neutrino production of opposite sign dimuons in the nomad ... · neutrino production of opposite...
TRANSCRIPT

Neutrino production of opposite sign dimuons in the
NOMAD experiment
P. Astier, D. Autiero, A. Baldisseri, M. Baldo-Ceolin, G. Ballocchi, M.
Banner, G. Bassompierre, K. Benslama, N. Besson, I. Bird, et al.
To cite this version:
P. Astier, D. Autiero, A. Baldisseri, M. Baldo-Ceolin, G. Ballocchi, et al.. Neutrino productionof opposite sign dimuons in the NOMAD experiment. Physics Letters B, Elsevier, 2000, 486,pp.35-48. <in2p3-00006060>
HAL Id: in2p3-00006060
http://hal.in2p3.fr/in2p3-00006060
Submitted on 15 Sep 2000
HAL is a multi-disciplinary open accessarchive for the deposit and dissemination of sci-entific research documents, whether they are pub-lished or not. The documents may come fromteaching and research institutions in France orabroad, or from public or private research centers.
L’archive ouverte pluridisciplinaire HAL, estdestinee au depot et a la diffusion de documentsscientifiques de niveau recherche, publies ou non,emanant des etablissements d’enseignement et derecherche francais ou etrangers, des laboratoirespublics ou prives.

EUROPEAN ORGANIZATION FOR NUCLEAR RESEARCH
CERN–EP/2000–07218 May 2000
NEUTRINO PRODUCTION OF OPPOSITE SIGN DIMUONS INTHE NOMAD EXPERIMENT
P. Astier1), D. Autiero2), A. Baldisseri3), M. Baldo-Ceolin4), G. Ballocchi2), M. Banner1), G. Bassompierre5),
K. Benslama6), N. Besson3), I. Bird2,6), B. Blumenfeld7), F. Bobisut4), J. Bouchez3), S. Boyd8), A. Bueno9,10),
S. Bunyatov11), L. Camilleri2), A. Cardini12), P.W. Cattaneo13), V. Cavasinni14), A. Cervera-Villanueva2,15),
G.M. Collazuol4), G. Conforto2,16), C. Conta13), M. Contalbrigo4), R. Cousins12), D. Daniels9), H. Degaudenzi6),
A. De Santo2,14), T. Del Prete14), T. Dignan9), L. Di Lella2), E. do Couto e Silva2), J. Dumarchez1), M. Ellis8),
T. Fazio5), G.J. Feldman9), R. Ferrari13), D. Ferrere2), V. Flaminio14), M. Fraternali13), J-M. Gaillard5),
E. Gangler1), A. Geiser2,17), D. Geppert17), D. Gibin4), S. Gninenko18), A. Godley8), J-J. Gomez-Cadenas2,15),
J. Gosset3), C. Goßling17), M. Gouanere5), A. Grant2), G. Graziani19), A. Guglielmi4), C. Hagner3),
J. Hernando15), D. Hubbard9), P. Hurst9), N. Hyett20), E. Iacopini19), C. Joseph6), F. Juget6),
M. Kirsanov16,18), O. Klimov11), J. Kokkonen2), A. Kovzelev13,18), A. Krasnoperov5,11), V. Kuznetsov2,11),
S. Lacaprara4), B. Lakic21), A. Lanza13), L. La Rotonda22), M. Laveder4), A. Letessier-Selvon1), J-M. Levy1),
L. Linssen2), A. Ljubicic21), J. Long7), A. Lupi19), E. Manola-Poggioli5), A. Marchionni19), F. Martelli16),
X. Mechain3), J-P. Mendiburu5), J-P. Meyer3), M. Mezzetto4), S.R. Mishra9,23), G.F. Moorhead20), L. Mossuz5),
P. Nedelec5), Yu. Nefedov11), C. Nguyen-Mau6), D. Orestano24), F. Pastore24), L.S. Peak8), E. Pennacchio16),
H. Pessard5), R. Petti13), A. Placci2), A. Pluquet3), G. Polesello13), D. Pollmann17), A. Polyarush18),
B. Popov1,11), C. Poulsen20), P. Rathouit3), C. Roda2,14), A. Rubbia2,10), F. Salvatore13), K. Schahmaneche1),
B. Schmidt2,17), T. Schmidt17), M.E. Sevior20), D. Sillou5), F.J.P. Soler2,8) G. Sozzi6), D. Steele6,7),
M. Steininger6), U. Stiegler2), M. Stipcevic21), T. Stolarczyk3), M. Tareb-Reyes6), G.N. Taylor20),
S. Tereshchenko11), A. Toropin18), A-M. Touchard1), S.N. Tovey2,20), M-T. Tran6), E. Tsesmelis2), J. Ulrichs8),
L. Vacavant6), M. Valdata-Nappi22), V. Valuev11,12), F. Vannucci1), K.E. Varvell8), M. Veltri16), V. Vercesi13),
D. Verkindt5), J-M. Vieira6), T. Vinogradova12), M-K. Vo3), F. Weber2,9) T. Weisse17), F. Wilson2),
L.J. Winton20), B.D. Yabsley8), H. Zaccone3), K. Zuber17), and P. Zuccon4)
ABSTRACT
The NOMAD Collaboration presents a study of opposite sign dimuon events in the framework ofLeading Order QCD. A total of 2714 neutrino- and 115 antineutrino-induced opposite sign dimuonevents with Eµ1, Eµ2 > 4.5 GeV, 15 < Eν < 300 GeV and Q2 > 1 (GeV/c)2 are observed in theFront-Calorimeter of NOMAD during the 1995 and 1996 runs. The analysis yields a value for thecharm quark mass of mc = 1.3+0.3 +0.3
−0.3 −0.3 GeV/c2 and for the average semileptonic branching ratio ofBc = 0.095+0.007 +0.014
−0.007 −0.013. The ratio of the strange to non-strange sea in the nucleon is measured to beκ = 0.48+0.09+0.17
−0.07−0.12. The measured rate of charm-induced dimuon relative to single muon, as a functionof neutrino energy, is consistent with the slow rescaling hypothesis of heavy quark production.
(To be published in Physics Letters B)

1) LPNHE, Univ. of Paris, Paris VI and VII, France.2) CERN, Geneva, Switzerland.3) DAPNIA, CEA Saclay, France.4) Univ. of Padova and INFN, Padova, Italy.5) LAPP, Annecy, France.6) University of Lausanne, Lausanne, Switzerland.7) Johns Hopkins Univ., Baltimore, MD, USA.8) Univ. of Sydney, Sydney, Australia.9) Harvard Univ., Cambridge, MA, USA.
10) ETH Zurich, Zurich, Switzerland.11) JINR, Dubna, Russia.12) UCLA, Los Angeles, CA, USA.13) Univ. of Pavia and INFN, Pavia, Italy.14) Univ. of Pisa and INFN, Pisa, Italy.15) IFIC, Valencia, Spain.16) Univ. of Urbino, Urbino, and INFN Florence, Italy.17) Dortmund Univ., Dortmund, Germany.18) Inst. Nucl. Research, INR Moscow, Russia.19) Univ. of Florence and INFN, Florence, Italy.20) University of Melbourne, Melbourne, Australia.21) Rudjer Boskovic Institute, Zagreb, Croatia.22) Univ. of Calabria and INFN, Cosenza, Italy.23) Univ. of South Carolina, Columbia, SC, USA.24) Roma-III Univ., Rome, Italy.
1 INTRODUCTIONA charged current muon-neutrino deep inelastic scattering event produces a single muon at the
leptonic vertex and changes the flavour of the initial quark at the hadronic vertex. If the initial quark is astrange (down) quark, a charm quark may be produced via a Cabibbo enhanced (suppressed) transition.The charm quark then fragments into a charmed hadron which may decay semileptonically, producingeither a second muon or an electron with its electric charge opposite to that of the muon from the leptonicvertex. This type of event is referred to as an opposite sign dilepton event. If the second lepton is a muonthe event is usually labelled as a dimuon event. This process is a powerful and clean probe of both thestrange component of the nucleon sea and the kinematics of heavy quark production.
The phenomenon of charm production by neutrinos has been investigated by a number of exper-iments. Dimuons have been studied in counter experiments : CDHS[1], CHARM II[4], CCFR[3] andFMMF[5]; in bubble chamber experiments such as Col-BNL[6], BEBC[7] and E362[8] at Fermilab; and inthe Fermilab emulsion experiments, E531[9] and E564[10]. Bubble chamber experiments generally havetoo few events to study the parameters of charm production with any precision. It is the counter ex-periments, and the E531 experiment, which have provided much of our knowledge of neutrino charmproduction.
This paper presents the results of an analysis of opposite sign dimuon events carried out by theNOMAD collaboration. The distributions of various kinematic variables are compared with a theoreticalmodel of dimuon production, constructed within the framework of leading order QCD, to yield a deter-mination of the charm quark mass, mc, the strange quark fraction of the nucleon sea, κ, and the averagesemileptonic branching ratio, Bc. The paper is organised as follows : Section 2 outlines the theoreticaldescription of opposite sign dimuon production within the framework of leading order QCD and Section3 gives a brief description of the neutrino beam. The detector is described in Section 4 along with a de-scription of the simulation programs used in the analysis (Section 4.2), a description of the data selectionprocess and a discussion of the background determination. Section 5 presents details of the analysis andSection 6 contains a discussion and a comparison with the results of other experiments. Finally, Section7 summarizes the results.
2 THEORYIn the Standard Model, an opposite sign dimuon event is produced when a neutrino interacts, via
a charged current, with a strange (s) or down (d) quark, producing a charm (c) quark. The charm quarkfragments into a charmed hadron (most frequently a D meson) which can then decay semileptonicallyresulting in a final state containing two oppositely charged muons : the primary muon which comes fromthe leptonic vertex and the secondary muon which arises from the decay of the charmed hadron.
The large mass of the charm quark, mc, gives rise to an energy threshold which has the effectof suppressing the opposite sign dimuon production rate at low neutrino energies. This is effectivelydescribed by the slow rescaling model[11] in which the usual scaling variable, x = Q2/2Mν, is replacedby the slow-rescaling variable, ξ = x(1 +m2
c/Q2). With this replacement, the leading order cross section
for opposite sign dimuon production by neutrino scattering on an isoscalar target may be written[5]
d3σν
dξ dy dz=
G2FMEνξ
π{[u(ξ,Q2) + d(ξ,Q2)
]|Vcd|2
+2s(ξ,Q2)|Vcs|2}(
1− y +xy
ξ
)D(z)Bc (1)
where GF is the Fermi constant; Eν is the energy of the incident neutrino; M is the mass of the nucleon;Q2 is the negative four momentum transfer squared; x and y are the Bjorken variables; z is defined to bethe ratio of the momentum of the charmed hadron to the maximum momentum that the kinematics willallow that hadron to possess; Vcd and Vcs are Cabibbo-Kobayashi-Maskawa (CKM) matrix elements[12]and u(ξ,Q2), d(ξ,Q2) and s(ξ,Q2) are the up, down and strange quark structure functions, respectively.The function D(z), discussed below in Section 4.2, describes the fragmentation of the charm quarkinto a charmed hadron and Bc is the average semileptonic branching ratio for charmed hadron decay.The corresponding cross section for incident antineutrinos is obtained by replacing the quark structurefunctions with the antiquark structure functions in Eq.(1). It should be noted that the slow rescalinghypothesis is an effective — and, as demonstrated by our data, consistent — description of the heavyquark production. A next-to-leading (NLO) order treatment of the data would yield different values forthe structure function related parameters [2].
1

3 NEUTRINO BEAMThe CERN-SPS wide band beam is produced by 450 GeV/c protons incident on a beryllium target.
The secondary pions and kaons pass through a large angle aluminium collimator and are focussed bya system of magnetic lenses, which focus(defocus) positive(negative) mesons. The particles decay ina 290 m long evacuated decay tunnel and the decay products then pass through an earth and ironshield which filters out all but the neutrinos and some muons. Monte Carlo predictions of the relativebeam composition and average energies of various neutrino types present in the beam are summarised inTable 1[13]. Variations in the relative beam compositions were used to estimate the systematic uncertaintydue to the beam description in the parameters determined in Section 5.
Table 1: Average energies and relative abundances of neutrino types in the CERN-SPS wide band beamAverage Eν (GeV) Rel. flux
abundanceνµ 23.5 1.000νµ 19.2 0.061νe 37.1 0.0094νe 31.3 0.0024
4 EXPERIMENTAL DETAILS4.1 Apparatus
The NOMAD detector, designed to search for a neutrino oscillation signal in the CERN SPS wideband neutrino beam, is described in detail in Ref. [14]. A side view of the detector is shown in Fig. 1.It consists of a number of subdetectors, most of which are located inside a 0.4 T dipole magnet with avolume of 7.5× 3.5× 3.5 m3. The relevant features for the present study will be briefly mentioned.
ChambersMuon
BeamNeutrino
V8
CalorimeterHadronic
1 metre
PreshowerModulesTRDDipole Magnet
Trigger Planes
ElectromagneticCalorimeterDrift Chambers
CalorimeterFront
Veto Planes
Figure 1: Side view of the NOMAD detector. The coordinate system has the x -axis into the plane of thefigure, the y-axis directed up towards the top of the figure and the z -axis horizontal, approximately alongthe direction of the neutrino beam (which points upwards at an angle of 2.4◦ with respect to the z -axis).
An iron-scintillator hadronic calorimeter, denoted the Front Calorimeter (FCAL), located upstreamof the central part of the NOMAD detector, forms the target for the opposite sign dimuon study. It consistsof 23 iron plates, 4.9 cm thick, separated by 1.8 cm air gaps. The first 20 gaps are instrumented with longscintillators which are read out at both ends by 3 in. photomultipliers. The dimensions of the scintillatorsare 175 × 18.5 × 0.6 cm3 and five consecutive scintillators are ganged together to form a module. Tensuch modules are placed on top of one another to form a stack and there are four stacks aligned along thebeam axis. The total instrumented region has a mass of 17.7 t and is about 5 nuclear interaction lengthsthick. The energy scale of the FCAL was calibrated in two stages. The relative calibration stage usedhigh energy muons to derive the response of each FCAL module to the energy deposited by a minimum
2
ionising particle (mip). The absolute energy scale, derived from a Monte Carlo study of neutral currentneutrino interactions in which all the hadronic energy was contained within the FCAL volume, was thenused to convert the energy deposition in units of mips to units of GeV. The energy calibration factor wasdetermined to be (2.95±0.02) mip/GeV. Using this calibration factor the energy resolution of the FCALis σ/E = 100%/
√E (GeV )[15].
The tracking detector consists of 44 drift chambers grouped into 11 modules. This is followed bya transition radiation detector (TRD) to enhance the separation of electrons from pions. Five additionaldrift chambers are interleaved with the TRD modules. A preshower (PRS) detector precedes an electro-magnetic calorimeter (ECAL), which consists of an array of lead glass Cerenkov counters. The energyresolution of the ECAL is σ/E = 1% + 3.2%/
√E(GeV )[14].
A hadronic calorimeter (HCAL) with an energy resolution of σ/E = 100%/√E(GeV ) is installed
behind the magnet coil and is followed by two muon detection stations consisting of large area driftchambers, the first after 8 and the second after 13 nuclear interaction lengths.
The FCAL trigger signal is obtained as the logical OR of the signals from each stack. A plane ofscintillators, V8, mounted on the upstream face of the FCAL as part of the veto, rejects charged particleseither in the beam or from interactions in material upstream of NOMAD. Neutrino interactions in theFCAL are selected by a V8 ×FCAL trigger with a threshold set at 75 mV, corresponding to a depositedenergy of approximately 2.0 GeV. The average rate of the V8 × FCAL trigger is 6.5per1013 protons ontarget (p.o.t), with negligible cosmic ray background. The trigger livetime is (89.5± 2.2) %[16].
4.2 Monte Carlo simulationsThe opposite sign dimuon study reported here utilised two detector simulations. The first was a
GEANT[17] based full detector simulation which included a detailed description of the detector geometryand which simulated the response of the detector to the particles produced in neutrino interactions.Neutrino events were simulated using a deep inelastic scattering event generator based on the LEPTO6.1[18] and JETSET 7.4[19] packages. These events were then passed through the GEANT simulationand reconstructed in the same way as data. The full scale simulation was, however, too slow to use for theanalysis presented in Section 5. To overcome this problem a fast detector simulation was constructed[15].This simulation used detector response functions derived from the detailed simulation to model thedetector acceptance, resolution and smearing, the efficiency of event selection and the details of thephysics of both opposite sign dimuon and single muon charged current events. The parton densities usedwere those measured by the CCFR experiment[2]. These parton densities were found to reproduce wellthe shape of the kinematic distributions of the single muon NOMAD data[15]. Non-isoscalarity of thetarget and the violation of the Callan-Gross relation were included.
The fragmentation of the charm quark into a charmed hadron was modelled using the Collins-Spillerfragmentation function[20], which has been shown to describe adequately charm fragmentation data fromthe e+e− experiment CLEO[21, 22]. This function is parametrised by
D(z) = N0
(1− zz
+εC (2− z)
1− z
)(1 + z2)
(1− 1
z− εC
1− z
)−2
(2)
where z = ph/pmaxh is the ratio of the momentum of the charmed hadron to the maximum momentum
that the kinematics will permit that charmed hadron to possess, N0 is a normalisation factor that ensuresthat the integral of D(z) is unity and εC is a free parameter which has been determined by CLEO[22]to be (0.6 ± 0.1) and by CCFR[23] to be (0.8 ± 0.2). This study uses a value of εC = 0.64 ± 0.09, theweighted average of the CLEO and CCFR results.
During fragmentation the charmed hadron acquires a momentum component transverse to theoriginal direction of the charm quark. The size of this transverse component, pT , was parametrisedas dN/dp2
T ∝ e−β p2T where pT is in units of GeV/c. The value of the parameter β was taken to be
1.1± 0.3 (GeV/c)−2, as measured by the LEBC collaboration[24].To model the relative proportion of charmed hadron species, we used the most recent analysis of
the E531[9] data as quoted in Ref. [2]. In that analysis, the production fractions of charmed hadrons weredetermined to be (60±6)% D0, (26±6)% D+, (7±5)% D+
s and (7±4)% Λ+c over a neutrino energy range
of 30 GeV to 200 GeV. The neutrino energy spectrum at NOMAD extends below 30 GeV, so to guardagainst systematic error a second analysis was performed using different production fractions, obtainedfrom an earlier E531 analysis[25], in the range Eν < 30 GeV. The effect on the final result was negligible.
The branching ratios of the different semileptonic decay modes of the D meson and the Λc baryonare listed in Table 2[12]. The D meson was decayed using a spin-1 vector matrix element in the case of theK∗ decay mode and a spin-0 pseudoscalar matrix element for the other decays[26]. As in JETSET[19],the decay of the Λc baryon was carried out using a V-A matrix element to distribute the decay products.
3
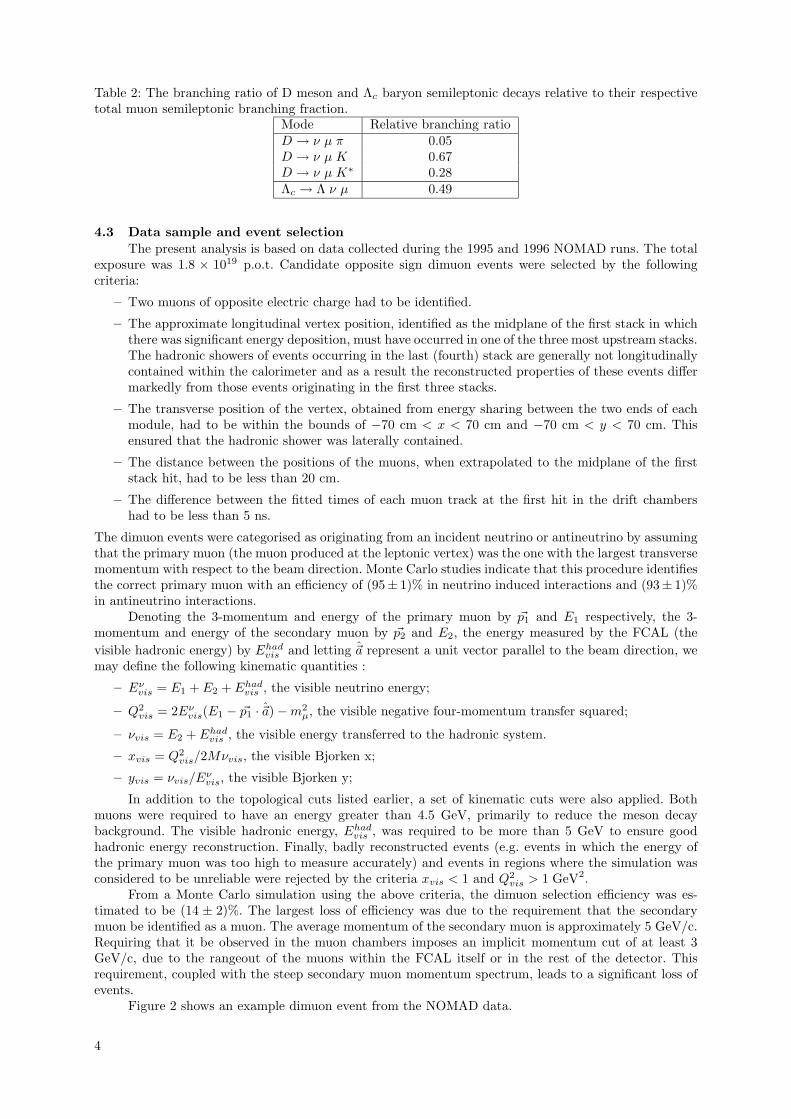
Table 2: The branching ratio of D meson and Λc baryon semileptonic decays relative to their respectivetotal muon semileptonic branching fraction.
Mode Relative branching ratioD → ν µ π 0.05D → ν µ K 0.67D → ν µ K∗ 0.28Λc → Λ ν µ 0.49
4.3 Data sample and event selectionThe present analysis is based on data collected during the 1995 and 1996 NOMAD runs. The total
exposure was 1.8 × 10¹⁹ p.o.t. Candidate opposite sign dimuon events were selected by the followingcriteria:
– Two muons of opposite electric charge had to be identified.
– The approximate longitudinal vertex position, identified as the midplane of the first stack in whichthere was significant energy deposition, must have occurred in one of the three most upstream stacks.The hadronic showers of events occurring in the last (fourth) stack are generally not longitudinallycontained within the calorimeter and as a result the reconstructed properties of these events differmarkedly from those events originating in the first three stacks.
– The transverse position of the vertex, obtained from energy sharing between the two ends of eachmodule, had to be within the bounds of −70 cm < x < 70 cm and −70 cm < y < 70 cm. Thisensured that the hadronic shower was laterally contained.
– The distance between the positions of the muons, when extrapolated to the midplane of the firststack hit, had to be less than 20 cm.
– The difference between the fitted times of each muon track at the first hit in the drift chambershad to be less than 5 ns.
The dimuon events were categorised as originating from an incident neutrino or antineutrino by assumingthat the primary muon (the muon produced at the leptonic vertex) was the one with the largest transversemomentum with respect to the beam direction. Monte Carlo studies indicate that this procedure identifiesthe correct primary muon with an efficiency of (95± 1)% in neutrino induced interactions and (93± 1)%in antineutrino interactions.
Denoting the 3-momentum and energy of the primary muon by ~p1 and E1 respectively, the 3-momentum and energy of the secondary muon by ~p2 and E2, the energy measured by the FCAL (thevisible hadronic energy) by Ehadvis and letting ~a represent a unit vector parallel to the beam direction, wemay define the following kinematic quantities :
– Eνvis = E1 + E2 + Ehadvis , the visible neutrino energy;
– Q2vis = 2Eνvis(E1 − ~p1 · ~a)−m2
µ, the visible negative four-momentum transfer squared;
– νvis = E2 + Ehadvis , the visible energy transferred to the hadronic system.
– xvis = Q2vis/2Mνvis, the visible Bjorken x;
– yvis = νvis/Eνvis, the visible Bjorken y;
In addition to the topological cuts listed earlier, a set of kinematic cuts were also applied. Bothmuons were required to have an energy greater than 4.5 GeV, primarily to reduce the meson decaybackground. The visible hadronic energy, Ehadvis , was required to be more than 5 GeV to ensure goodhadronic energy reconstruction. Finally, badly reconstructed events (e.g. events in which the energy ofthe primary muon was too high to measure accurately) and events in regions where the simulation wasconsidered to be unreliable were rejected by the criteria xvis < 1 and Q2
vis > 1 GeV2.From a Monte Carlo simulation using the above criteria, the dimuon selection efficiency was es-
timated to be (14 ± 2)%. The largest loss of efficiency was due to the requirement that the secondarymuon be identified as a muon. The average momentum of the secondary muon is approximately 5 GeV/c.Requiring that it be observed in the muon chambers imposes an implicit momentum cut of at least 3GeV/c, due to the rangeout of the muons within the FCAL itself or in the rest of the detector. Thisrequirement, coupled with the steep secondary muon momentum spectrum, leads to a significant loss ofevents.
Figure 2 shows an example dimuon event from the NOMAD data.
4

µ
µ+
−
Figure 2: Example of an opposite sign dimuon event occurring at the end of Stack 2 in the FCAL. Thetwo tracks are the oppositely charged muons in the event and the detector is shown from the side. Thegrey shading in each FCAL module indicates different levels of energy deposition.
4.4 Background estimationThe background to the opposite sign dimuon process arises from muonic decays of hadrons produced
in the hadronic shower or by hadrons which punch through to the muon chambers, thereby simulatingmuons. The amount of background was estimated by studying dimuon events in which both muons hadidentical electric charge, the so-called like sign events. This class of events is dominated by the decay ofhadrons (mostly pions and kaons)[27, 28] and hence, since the same physics processes give rise to the likesign events as to the opposite sign background events, can be used to estimate the background to theopposite sign dimuon signal.
The background subtraction algorithm, for any distribution A under study, was as follows :
– the number of like sign events in the data was determined.
– using the detailed Monte Carlo, the ratio, R, of the number of reconstructed opposite sign back-ground events to the number of reconstructed like sign events was calculated. Due to a combinationof leading charge effects and slightly different acceptances for positive and negative muons, moreopposite sign background events were observed than like sign events. This is illustrated in Table 3.
Table 3: The number of reconstructed opposite sign background events, like sign events and their ratioin simulated neutrino and antineutrino charged current event samples.
νµ νµInitial number of events 288,000 72,144Number of non-charm oppositesign background events 61± 8 10± 3Number of like sign events 40± 6 5± 2Background scale, R 1.5± 0.3 2+2
−1
– the same distribution for the like sign events in the data, ALSDMDATA , was scaled by R.
– the scaled distribution was subtracted, bin-by-bin, from A.
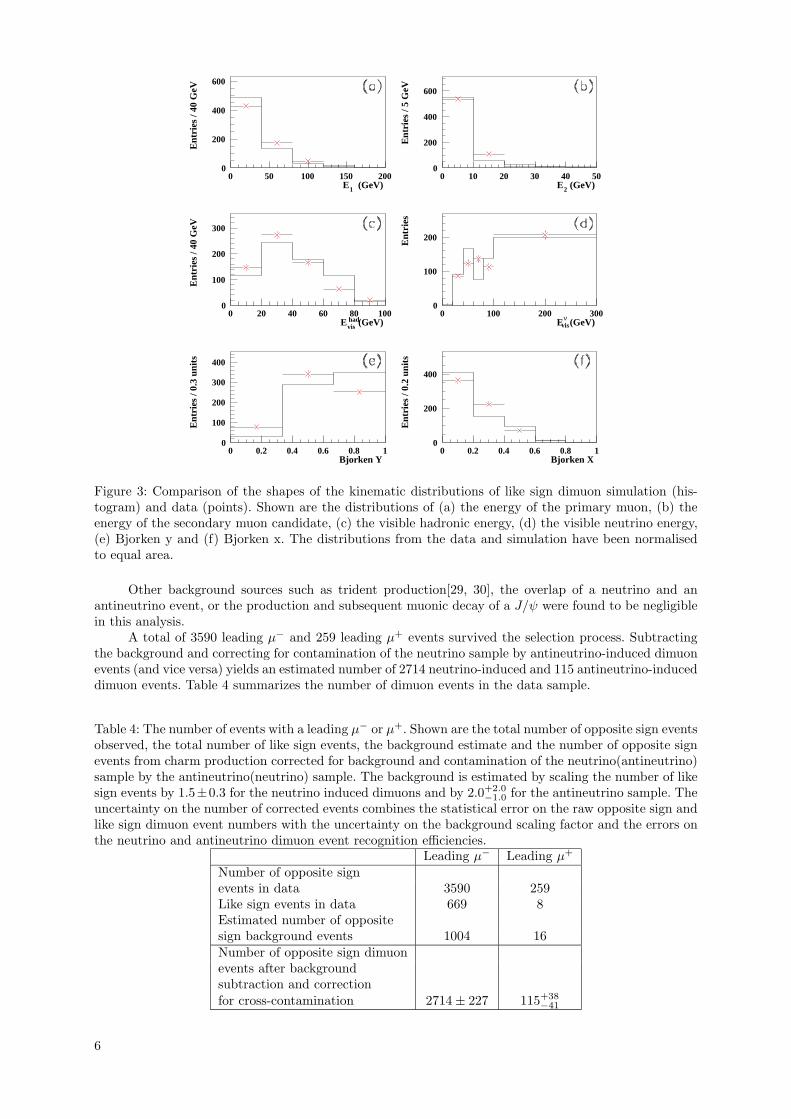
For this prescription to be valid it is important that the simulation describes both the shapes of thedistributions of the like sign data and the production rate satisfactorily. The rate of observed like signevents normalised to the number of observed neutrino charged current events was measured to be (2.7±0.1) × 10−4 in the data, to be compared to (2.7 ± 0.4) × 10−4 in the detailed simulation. ure 3 shows acomparison of the shapes of various distributions of like sign events in the data and the simulation. Theagreement is good.
5
E1 (GeV)E
ntri
es /
40 G
eVE2 (GeV)
Ent
ries
/ 5
GeV
Evishad (GeV)
Ent
ries
/ 40
GeV
Eνvis (GeV)
Ent
ries
Bjorken Y
Ent
ries
/ 0.
3 un
its
Bjorken X
Ent
ries
/ 0.
2 un
its
0
200
400
600
0 50 100 150 2000
200
400
600
0 10 20 30 40 50
0
100
200
300
0 20 40 60 80 1000
100
200
0 100 200 300
0
100
200
300
400
0 0.2 0.4 0.6 0.8 10
200
400
0 0.2 0.4 0.6 0.8 1
Figure 3: Comparison of the shapes of the kinematic distributions of like sign dimuon simulation (his-togram) and data (points). Shown are the distributions of (a) the energy of the primary muon, (b) theenergy of the secondary muon candidate, (c) the visible hadronic energy, (d) the visible neutrino energy,(e) Bjorken y and (f) Bjorken x. The distributions from the data and simulation have been normalisedto equal area.
Other background sources such as trident production[29, 30], the overlap of a neutrino and anantineutrino event, or the production and subsequent muonic decay of a J/ψ were found to be negligiblein this analysis.
A total of 3590 leading µ− and 259 leading µ+ events survived the selection process. Subtractingthe background and correcting for contamination of the neutrino sample by antineutrino-induced dimuonevents (and vice versa) yields an estimated number of 2714 neutrino-induced and 115 antineutrino-induceddimuon events. Table 4 summarizes the number of dimuon events in the data sample.
Table 4: The number of events with a leading µ− or µ+. Shown are the total number of opposite sign eventsobserved, the total number of like sign events, the background estimate and the number of opposite signevents from charm production corrected for background and contamination of the neutrino(antineutrino)sample by the antineutrino(neutrino) sample. The background is estimated by scaling the number of likesign events by 1.5±0.3 for the neutrino induced dimuons and by 2.0+2.0
−1.0 for the antineutrino sample. Theuncertainty on the number of corrected events combines the statistical error on the raw opposite sign andlike sign dimuon event numbers with the uncertainty on the background scaling factor and the errors onthe neutrino and antineutrino dimuon event recognition efficiencies.
Leading µ− Leading µ+
Number of opposite signevents in data 3590 259Like sign events in data 669 8Estimated number of oppositesign background events 1004 16Number of opposite sign dimuonevents after backgroundsubtraction and correctionfor cross-contamination 2714± 227 115+38
−41
6
5 ANALYSIS5.1 Description and results
The production of opposite sign dimuon events is governed by four parameters : the charm quarkmass, mc, the proportion of strange to nonstrange quarks in the nucleon sea, usually determined bythe parameter κ = 2S/(U + D) (where S =
∫ 1
0xs(x)dx, U =
∫ 1
0xu(x)dx and D =
∫ 1
0xd(x)dx), the
CKM matrix element, Vcd1), and Bc, the average semileptonic branching ratio of charmed hadrons.Determinations of these parameters were made by fitting the observed kinematic distributions to modeldistributions obtained from a Monte Carlo simulation. To obtain the model predictions for different setsof production parameters, each simulated event in a “seed” event sample was given a weight proportionalto the ratio of the differential cross sections for that event, calculated using the parameters for the newand seed samples. The seed sample consisted of approximately 140,000 neutrino dimuon events (afterevent selection) generated with mc = 0.1 GeV/c2, κ = 0.36, Vcs = 0.974[12] and Vcd = 0.221[12] usingthe fast Monte Carlo code described in Section 4.2. The charm quark mass at generation was chosen tobe small to ensure that the fit was not biased by any mass thresholds in the seed sample.
Since the antineutrino sample was only a small fraction of the total event sample, it was expectedthat any determination of Vcd would be less precise than the current value of (0.221± 0.003) and so Vcdand Vcs were fixed to their best known values.
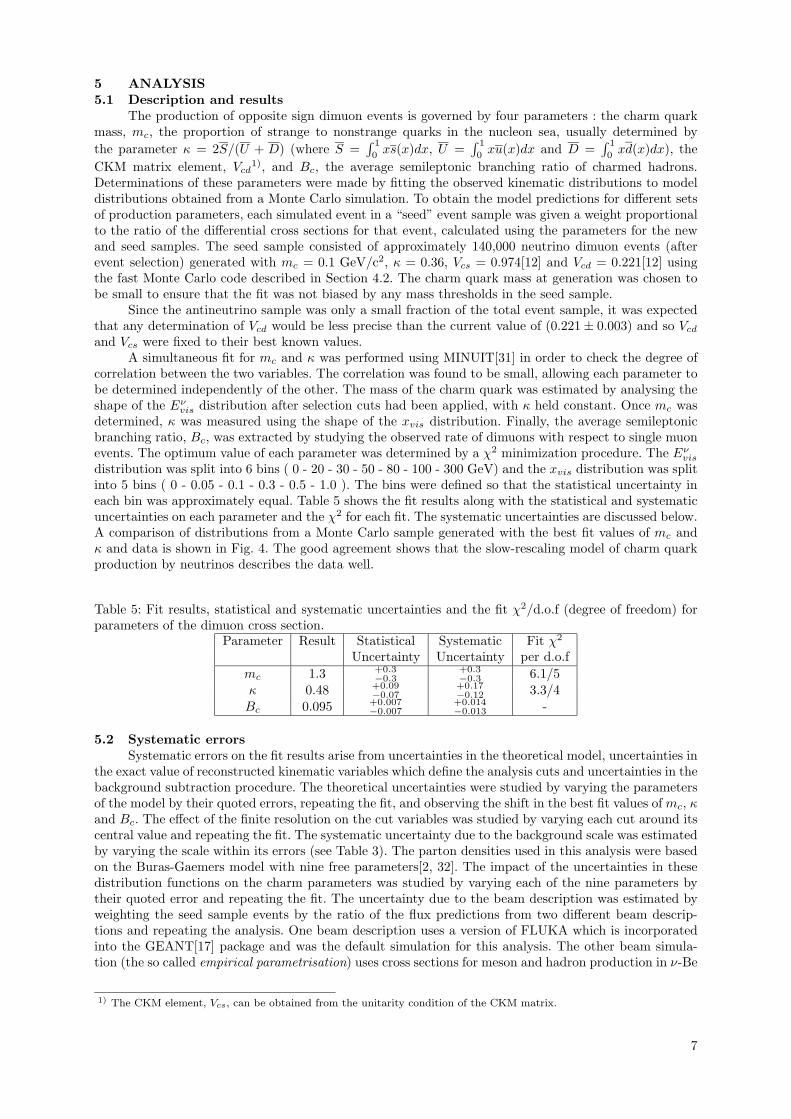
A simultaneous fit for mc and κ was performed using MINUIT[31] in order to check the degree ofcorrelation between the two variables. The correlation was found to be small, allowing each parameter tobe determined independently of the other. The mass of the charm quark was estimated by analysing theshape of the Eνvis distribution after selection cuts had been applied, with κ held constant. Once mc wasdetermined, κ was measured using the shape of the xvis distribution. Finally, the average semileptonicbranching ratio, Bc, was extracted by studying the observed rate of dimuons with respect to single muonevents. The optimum value of each parameter was determined by a χ2 minimization procedure. The Eνvisdistribution was split into 6 bins ( 0 - 20 - 30 - 50 - 80 - 100 - 300 GeV) and the xvis distribution was splitinto 5 bins ( 0 - 0.05 - 0.1 - 0.3 - 0.5 - 1.0 ). The bins were defined so that the statistical uncertainty ineach bin was approximately equal. Table 5 shows the fit results along with the statistical and systematicuncertainties on each parameter and the χ2 for each fit. The systematic uncertainties are discussed below.A comparison of distributions from a Monte Carlo sample generated with the best fit values of mc andκ and data is shown in Fig. 4. The good agreement shows that the slow-rescaling model of charm quarkproduction by neutrinos describes the data well.
Table 5: Fit results, statistical and systematic uncertainties and the fit χ2/d.o.f (degree of freedom) forparameters of the dimuon cross section.
Parameter Result Statistical Systematic Fit χ2
Uncertainty Uncertainty per d.o.fmc 1.3 +0.3
−0.3+0.3−0.3 6.1/5
κ 0.48 +0.09−0.07
+0.17−0.12 3.3/4
Bc 0.095 +0.007−0.007
+0.014−0.013 -
5.2 Systematic errorsSystematic errors on the fit results arise from uncertainties in the theoretical model, uncertainties in
the exact value of reconstructed kinematic variables which define the analysis cuts and uncertainties in thebackground subtraction procedure. The theoretical uncertainties were studied by varying the parametersof the model by their quoted errors, repeating the fit, and observing the shift in the best fit values of mc, κand Bc. The effect of the finite resolution on the cut variables was studied by varying each cut around itscentral value and repeating the fit. The systematic uncertainty due to the background scale was estimatedby varying the scale within its errors (see Table 3). The parton densities used in this analysis were basedon the Buras-Gaemers model with nine free parameters[2, 32]. The impact of the uncertainties in thesedistribution functions on the charm parameters was studied by varying each of the nine parameters bytheir quoted error and repeating the fit. The uncertainty due to the beam description was estimated byweighting the seed sample events by the ratio of the flux predictions from two different beam descrip-tions and repeating the analysis. One beam description uses a version of FLUKA which is incorporatedinto the GEANT[17] package and was the default simulation for this analysis. The other beam simula-tion (the so called empirical parametrisation) uses cross sections for meson and hadron production in ν-Be
1) The CKM element, Vcs, can be obtained from the unitarity condition of the CKM matrix.
7

E1 (GeV)
Ent
ries
/ 10
GeV
E2 (GeV)
Ent
ries
/ 2
GeV
Ehad
vis (GeV)
Ent
ries
/ 5
GeV
Eνvis (GeV)
Ent
ries
/ 5
GeV
0
100
200
300
400
500
600
700
0 50 100 150 2000
100
200
300
400
500
600
0 10 20 30 40 50
0
50
100
150
200
250
300
350
400
0 25 50 75 100 1250
50
100
150
200
250
300
350
0 100 200 300
Bjorken Y
Ent
ries
/ 0.
05 u
nits
Bjorken X
Ent
ries
/ 0.
05 u
nits
0
50
100
150
200
250
0 0.2 0.4 0.6 0.8 10
100
200
300
400
500
600
0 0.2 0.4 0.6 0.8 1
Figure 4: Comparison of the shapes of the kinematic distributions of an opposite sign dimuon simulation(histogram) and background subtracted data (points). Shown are distributions of (a) the energy of theprimary muon, (b) the energy of the secondary muon, (c) the visible hadronic energy, (d) the visibleneutrino energy, (e) visible Bjorken y and (f) visible Bjorken x. The distributions from the data andsimulation have been normalised to equal area.
interactions which have been determined from the analysis of νµ, νµ, νe and νe energy spectra observedin the NOMAD data and which agree with empirically measured production yields[33].
A summary of the systematic errors is presented in Table 6. The effect of varying the value of thecut on Bjorken x was negligible in all cases.
6 DISCUSSIONA comparison of these results with those reported by the CDHS[1], CHARM II[4], CCFR[3] and
FMMF[5] experiments is shown in Table 7. All parameters measured in this study are compatible withprevious experiments.
Within the framework of leading order QCD, an SU(3) symmetric sea would yield a value of κ = 1.The smaller value observed supports the conclusion that the size of the strange sea is suppressed withrespect to the size of the non-strange sea. The strange sea content of the nucleon may be defined byηs = 2 S/(U +D). Using the measured value of κ and taking the total antiquark to quark ratio, Q/Q, tobe 0.177 from the CCFR[3] parton density parametrisation yields
ηs = 0.071+0.011 +0.020−0.009 −0.015 (3)
which is consistent with previous publications[3, 4]. The average branching ratio determined in this studyis compatible with the values obtained by other experiments (see Table 7).
8
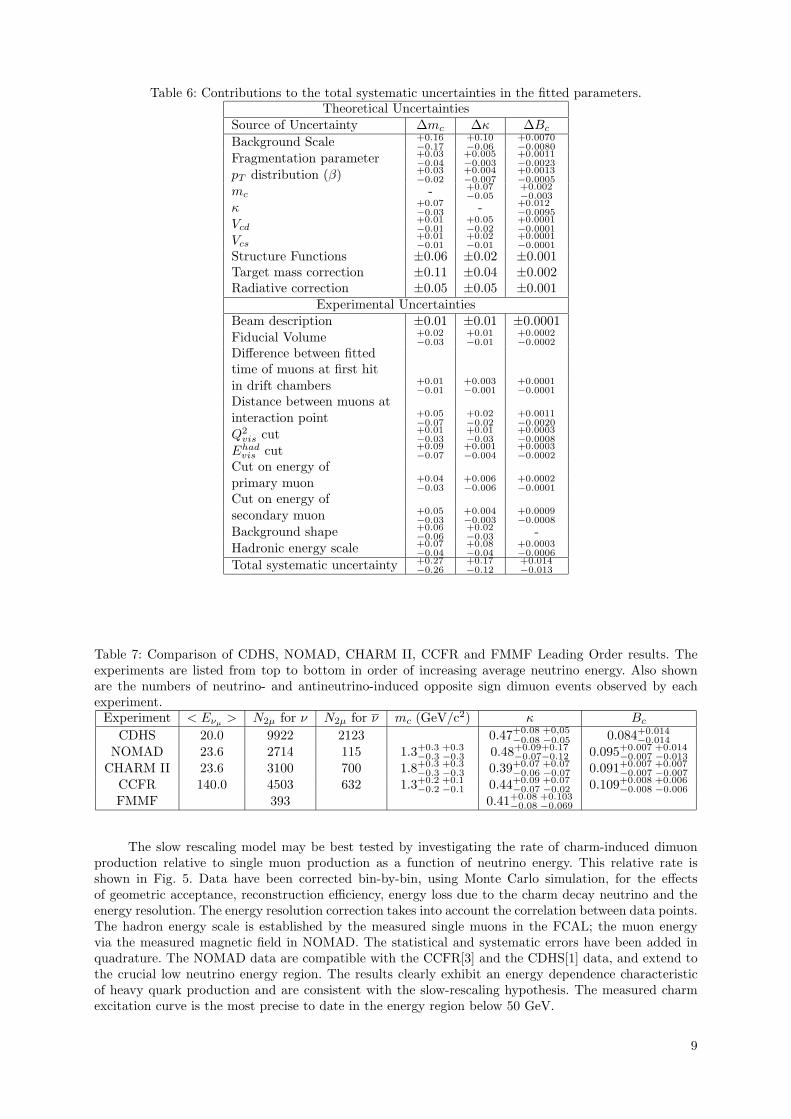
Table 6: Contributions to the total systematic uncertainties in the fitted parameters.Theoretical Uncertainties
Source of Uncertainty ∆mc ∆κ ∆BcBackground Scale +0.16
−0.17+0.10−0.06
+0.0070−0.0080
Fragmentation parameter +0.03−0.04
+0.005−0.003
+0.0011−0.0023
pT distribution (β) +0.03−0.02
+0.004−0.007
+0.0013−0.0005
mc - +0.07−0.05
+0.002−0.003
κ +0.07−0.03 - +0.012
−0.0095
Vcd+0.01−0.01
+0.05−0.02
+0.0001−0.0001
Vcs+0.01−0.01
+0.02−0.01
+0.0001−0.0001
Structure Functions ±0.06 ±0.02 ±0.001Target mass correction ±0.11 ±0.04 ±0.002Radiative correction ±0.05 ±0.05 ±0.001
Experimental UncertaintiesBeam description ±0.01 ±0.01 ±0.0001Fiducial Volume +0.02
−0.03+0.01−0.01
+0.0002−0.0002
Difference between fittedtime of muons at first hitin drift chambers +0.01
−0.01+0.003−0.001
+0.0001−0.0001
Distance between muons atinteraction point +0.05
−0.07+0.02−0.02
+0.0011−0.0020
Q2vis cut +0.01
−0.03+0.01−0.03
+0.0003−0.0008
Ehadvis cut +0.09−0.07
+0.001−0.004
+0.0003−0.0002
Cut on energy ofprimary muon +0.04
−0.03+0.006−0.006
+0.0002−0.0001
Cut on energy ofsecondary muon +0.05
−0.03+0.004−0.003
+0.0009−0.0008
Background shape +0.06−0.06
+0.02−0.03 -
Hadronic energy scale +0.07−0.04
+0.08−0.04
+0.0003−0.0006
Total systematic uncertainty +0.27−0.26
+0.17−0.12
+0.014−0.013
Table 7: Comparison of CDHS, NOMAD, CHARM II, CCFR and FMMF Leading Order results. Theexperiments are listed from top to bottom in order of increasing average neutrino energy. Also shownare the numbers of neutrino- and antineutrino-induced opposite sign dimuon events observed by eachexperiment.
Experiment < Eνµ > N2µ for ν N2µ for ν mc (GeV/c2) κ BcCDHS 20.0 9922 2123 0.47+0.08 +0,05
−0.08 −0.05 0.084+0.014−0.014
NOMAD 23.6 2714 115 1.3+0.3 +0.3−0.3 −0.3 0.48+0.09+0.17
−0.07−0.12 0.095+0.007 +0.014−0.007 −0.013
CHARM II 23.6 3100 700 1.8+0.3 +0.3−0.3 −0.3 0.39+0.07 +0.07
−0.06 −0.07 0.091+0.007 +0.007−0.007 −0.007
CCFR 140.0 4503 632 1.3+0.2 +0.1−0.2 −0.1 0.44+0.09 +0.07
−0.07 −0.02 0.109+0.008 +0.006−0.008 −0.006
FMMF 393 0.41+0.08 +0.103−0.08 −0.069
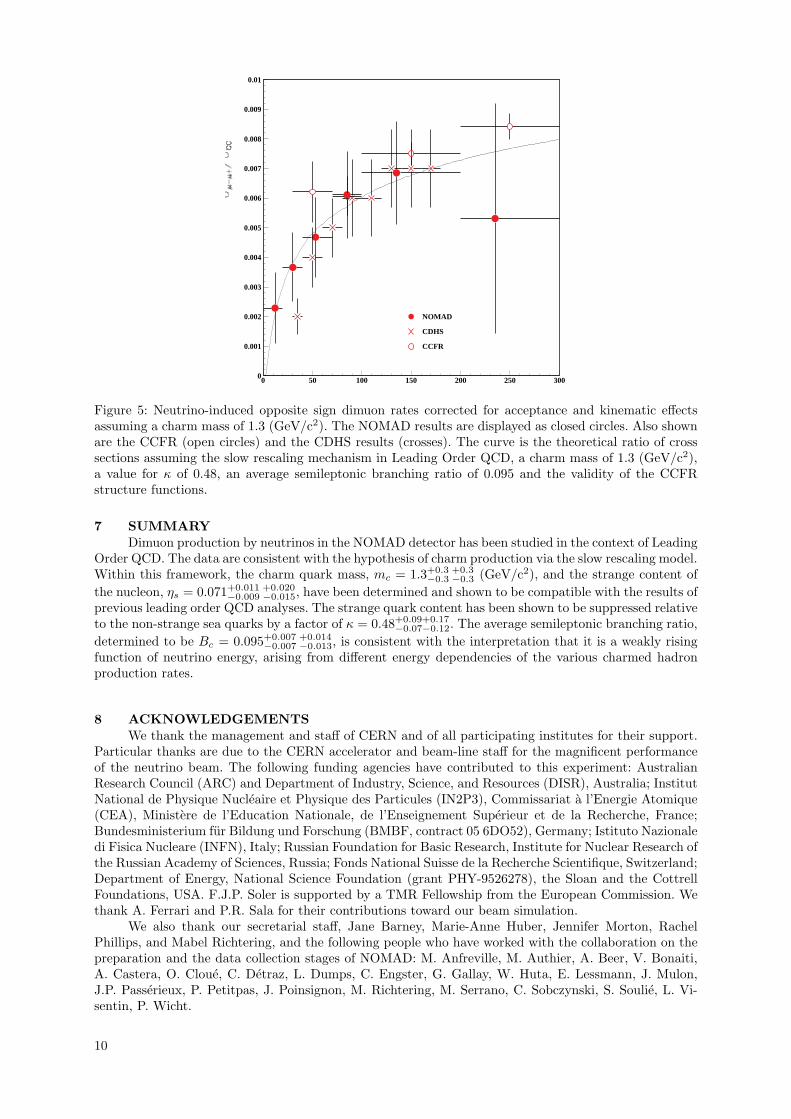
The slow rescaling model may be best tested by investigating the rate of charm-induced dimuonproduction relative to single muon production as a function of neutrino energy. This relative rate isshown in Fig. 5. Data have been corrected bin-by-bin, using Monte Carlo simulation, for the effectsof geometric acceptance, reconstruction efficiency, energy loss due to the charm decay neutrino and theenergy resolution. The energy resolution correction takes into account the correlation between data points.The hadron energy scale is established by the measured single muons in the FCAL; the muon energyvia the measured magnetic field in NOMAD. The statistical and systematic errors have been added inquadrature. The NOMAD data are compatible with the CCFR[3] and the CDHS[1] data, and extend tothe crucial low neutrino energy region. The results clearly exhibit an energy dependence characteristicof heavy quark production and are consistent with the slow-rescaling hypothesis. The measured charmexcitation curve is the most precise to date in the energy region below 50 GeV.
9
NOMAD
CDHS
CCFR
0
0.001
0.002
0.003
0.004
0.005
0.006
0.007
0.008
0.009
0.01
0 50 100 150 200 250 300
Figure 5: Neutrino-induced opposite sign dimuon rates corrected for acceptance and kinematic effectsassuming a charm mass of 1.3 (GeV/c2). The NOMAD results are displayed as closed circles. Also shownare the CCFR (open circles) and the CDHS results (crosses). The curve is the theoretical ratio of crosssections assuming the slow rescaling mechanism in Leading Order QCD, a charm mass of 1.3 (GeV/c2),a value for κ of 0.48, an average semileptonic branching ratio of 0.095 and the validity of the CCFRstructure functions.
7 SUMMARYDimuon production by neutrinos in the NOMAD detector has been studied in the context of Leading
Order QCD. The data are consistent with the hypothesis of charm production via the slow rescaling model.Within this framework, the charm quark mass, mc = 1.3+0.3 +0.3
−0.3 −0.3 (GeV/c2), and the strange content ofthe nucleon, ηs = 0.071+0.011 +0.020
−0.009 −0.015, have been determined and shown to be compatible with the results ofprevious leading order QCD analyses. The strange quark content has been shown to be suppressed relativeto the non-strange sea quarks by a factor of κ = 0.48+0.09+0.17
−0.07−0.12. The average semileptonic branching ratio,determined to be Bc = 0.095+0.007 +0.014
−0.007 −0.013, is consistent with the interpretation that it is a weakly risingfunction of neutrino energy, arising from different energy dependencies of the various charmed hadronproduction rates.
8 ACKNOWLEDGEMENTSWe thank the management and staff of CERN and of all participating institutes for their support.
Particular thanks are due to the CERN accelerator and beam-line staff for the magnificent performanceof the neutrino beam. The following funding agencies have contributed to this experiment: AustralianResearch Council (ARC) and Department of Industry, Science, and Resources (DISR), Australia; InstitutNational de Physique Nucleaire et Physique des Particules (IN2P3), Commissariat a l’Energie Atomique(CEA), Ministere de l’Education Nationale, de l’Enseignement Superieur et de la Recherche, France;Bundesministerium fur Bildung und Forschung (BMBF, contract 05 6DO52), Germany; Istituto Nazionaledi Fisica Nucleare (INFN), Italy; Russian Foundation for Basic Research, Institute for Nuclear Research ofthe Russian Academy of Sciences, Russia; Fonds National Suisse de la Recherche Scientifique, Switzerland;Department of Energy, National Science Foundation (grant PHY-9526278), the Sloan and the CottrellFoundations, USA. F.J.P. Soler is supported by a TMR Fellowship from the European Commission. Wethank A. Ferrari and P.R. Sala for their contributions toward our beam simulation.
We also thank our secretarial staff, Jane Barney, Marie-Anne Huber, Jennifer Morton, RachelPhillips, and Mabel Richtering, and the following people who have worked with the collaboration on thepreparation and the data collection stages of NOMAD: M. Anfreville, M. Authier, A. Beer, V. Bonaiti,A. Castera, O. Cloue, C. Detraz, L. Dumps, C. Engster, G. Gallay, W. Huta, E. Lessmann, J. Mulon,J.P. Passerieux, P. Petitpas, J. Poinsignon, M. Richtering, M. Serrano, C. Sobczynski, S. Soulie, L. Vi-sentin, P. Wicht.
10
References[1] H. Abramowicz et al., Z. Phys. C15, 19-31 (1982)[2] A.O.Bazarko, Ph.D. thesis, Columbia University, 1994.[3] S. A. Rabinowitz et al., CCFR Collaboration, Phys. Rev. Lett. 70, 134-137 (1993); C. Foudas
et al., CCFR Collaboration, Phys. Rev. Lett. 64, 1207-1210 (1990); A. O. Bazarko et al., CCFRCollaboration, Z.Phys. C65, 189-198 (1995)
[4] P. Vilain et al., Eur. Phys. J. C11, 19 (1999)[5] B. Strongin et al., Phys. Rev. D43, 2778-2786 (1991)[6] N.J.Baker et al., Phys. Rev. D43, 2765 (1991)[7] G. Gerbier et al., Z. Phys. C29, 15 (1985)[8] V. Jain et al., Phys. Rev. D41, 2057-2073 (1990)[9] N. Ushida et al., Phys. Lett. B121, 292-296 (1983)
[10] R. G. Ammar et al., Z. Phys. C45, 557-567 (1990)[11] H. Georgi and H. D. Politzer, Phys. Rev. D14, 1829 (1976)[12] Review of Particle Physics, Particle Data Group, Euro. Phys. J. C3, (1998)[13] G. Collazuol et al., CERN-OPEN-98-032 (1998)[14] J. Altegoer et al., Nucl. Inst. and Meth. A404, 96 (1998)[15] S. Boyd, Ph.D. thesis, University of Sydney, 1998.[16] J. Altegoer et al., Nucl. Inst. and Meth. A428, 299-316 (1999)[17] The NOMAD simulation program is based on GEANT 3.21, CERN Program Library Long Writeup
W5013.[18] G. Ingelman, in Proc. Physics at HERA, 1992, edited by W. Buchmueller and G. Ingelman (DESY,
Hamburg, 1992), p. 1366[19] T. Sjostrand, Comp. Phys. Comm. 82, 74-89 (1994); T. Sjostrand, CERN-TH/93-7112 (1993)[20] P. Collins and T. Spiller, J. Phys. G11, 1289-1298 (1985)[21] D. Andrews et al, Nucl. Inst. and Meth. A211, 47-71 (1983)[22] D. Bortoletto et al., Phys. Rev. D37, 1719-1743 (1988)[23] A.O.Bazarko et al., Z. Phys. C65, 189-198 (1995)[24] M. Aguilar-Benitez et. al., Phys. Lett. B123, 98-102 (1983)[25] N. Ushida et al., Phys. Lett. B206, 375-379 (1988)[26] J.D. Richman and P.R.Burchat Rev. Mod. Phys., Vol# 67, No. 4. 893-946 (1995)[27] K. Lang et al., Z. Phys. C33, 483 (1987)[28] C. Baltay et al., Phys. Rev. Lett. 55, 2543-2546 (1985)[29] D. Geiregat et al, Phys. Lett. B245, 271 (1990)[30] S.R. Mishra et al, Phys. Rev. Lett. 66, 3117-3120 (1991)[31] F. James, MINUIT 94.1, CERN Program Library Long Writeup D506.[32] A.J. Buras and K.J.F. Gaemers, Nucl. Phys. B132, 249 (1978)[33] Atherton et al., CERN 80-07, August 1980. G. Ambrosini et al., Phys. Lett. B420, 225-232 (1998);
G. Ambrosini et al., Phys. Lett. B425, 208-214 (1998); G. Ambrosini et al., Eur. Phys. J. C10, 605(1999)
11