nevada - dot.nv.gov
TRANSCRIPT

Page 1 of 50
NEVADA

2017 Nevada Highway Safety Improvement Program
Page 2 of 50
Table of Contents
Table of Contents .................................................................................................................................................... 2 Disclaimer ............................................................................................................................................................... 3 Executive Summary ................................................................................................................................................ 4 Introduction ............................................................................................................................................................. 5 Program Structure ................................................................................................................................................... 5
Program Administration...................................................................................................................................... 5 Program Methodology ........................................................................................................................................ 9
Project Implementation ......................................................................................................................................... 21 Funds Programmed ........................................................................................................................................... 21 General Listing of Projects ............................................................................................................................... 23
Safety Performance ............................................................................................................................................... 24 General Highway Safety Trends ....................................................................................................................... 24 Safety Performance Targets .............................................................................................................................. 35 Applicability of Special Rules .......................................................................................................................... 37
Evaluation ............................................................................................................................................................. 39 Program Effectiveness ...................................................................................................................................... 39 Effectiveness of Groupings or Similar Types of Improvements ...................................................................... 39 Project Effectiveness ......................................................................................................................................... 44
Compliance Assessment ....................................................................................................................................... 45
2017 Nevada Highway Safety Improvement Program
Page 3 of 50
Disclaimer
Protection of Data from Discovery Admission into Evidence
23 U.S.C. 148(h)(4) states “Notwithstanding any other provision of law, reports, surveys, schedules, lists, or data compiled or collected for any purpose relating to this section [HSIP], shall not be subject to discovery or admitted into evidence in a Federal or State court proceeding or considered for other purposes in any action for damages arising from any occurrence at a location identified or addressed in the reports, surveys, schedules, lists, or other data.” 23 U.S.C. 409 states “Notwithstanding any other provision of law, reports, surveys, schedules, lists, or data compiled or collected for the purpose of identifying, evaluating, or planning the safety enhancement of potential accident sites, hazardous roadway conditions, or railway-highway crossings, pursuant to sections 130, 144, and 148 of this title or for the purpose of developing any highway safety construction improvement project which may be implemented utilizing Federal-aid highway funds shall not be subject to discovery or admitted into evidence in a Federal or State court proceeding or considered for other purposes in any action for damages arising from any occurrence at a location mentioned or addressed in such reports, surveys, schedules, lists, or data.”

2017 Nevada Highway Safety Improvement Program
Page 4 of 50
Executive Summary
This annual Highway Safety Improvement Program (HSIP) report for 2016 summarizes the activities of the Nevada Department of Transportation’s HSIP as required by Fixing America’s Surface Transportation (FAST) Act. The FAST Act continues the HSIP to achieve a significant reduction in traffic fatalities and serious injuries on all public roads, including non-State-owned public roads and roads on tribal lands. The HSIP requires a data-driven, strategic approach to improving highway safety on all public roads that focuses on performance (FAST Act § 1113; 23 U.S.C. 148).
The FAST Act continued to allocate funds for the HSIP program in the Federal Fiscal Years 2016 - 2020. Available program funds for the purpose of this report are considered to be those funds obligated during the 2016 federal fiscal year. The activities of the Nevada Department of Transportation (NDOT) are primarily designed to develop safety improvement projects for the following areas:
• Systemic roadway improvements o Safety management plans
High crash locations (intersections and roadway segments)
o Rural lane departure crash mitigation o Rural intersection low cost safety improvements o Urban intersection low cost safety improvements o Urban lane departure crash mitigation
Pedestrian related crash mitigation Tribal Low Cost Safety Improvements
The crash data on all public roadways contained in this report is extracted from the Nevada Citation and Accident Tracking System (NCATS) and Brazos crash databases, and prepared for Traffic Safety Engineering’s analysis as a normalized view. After the crash data is downloaded from the NCATS and Brazos databases, it is processed through our geo-location software and is linearly referenced to the statewide street centerline data. The geo-location software tools automate the cleanup of location attributes and assign a spatial location to the crash data through a series of database procedures.
The HSIP program is administered by the NDOT Traffic Safety Engineering section, a centrally located component of the NDOT. The methods used by the Traffic Safety Engineering section to identify, select, implement, and evaluate safety improvement projects have been compiled in the NDOT’s “Safety Procedural Manual,” implemented in 1980, amended in 1990, 2010, and 2016. A copy of the current updated NDOT Safety Procedural Manual is located on the NDOT website.
2017 Nevada Highway Safety Improvement Program
Page 5 of 50
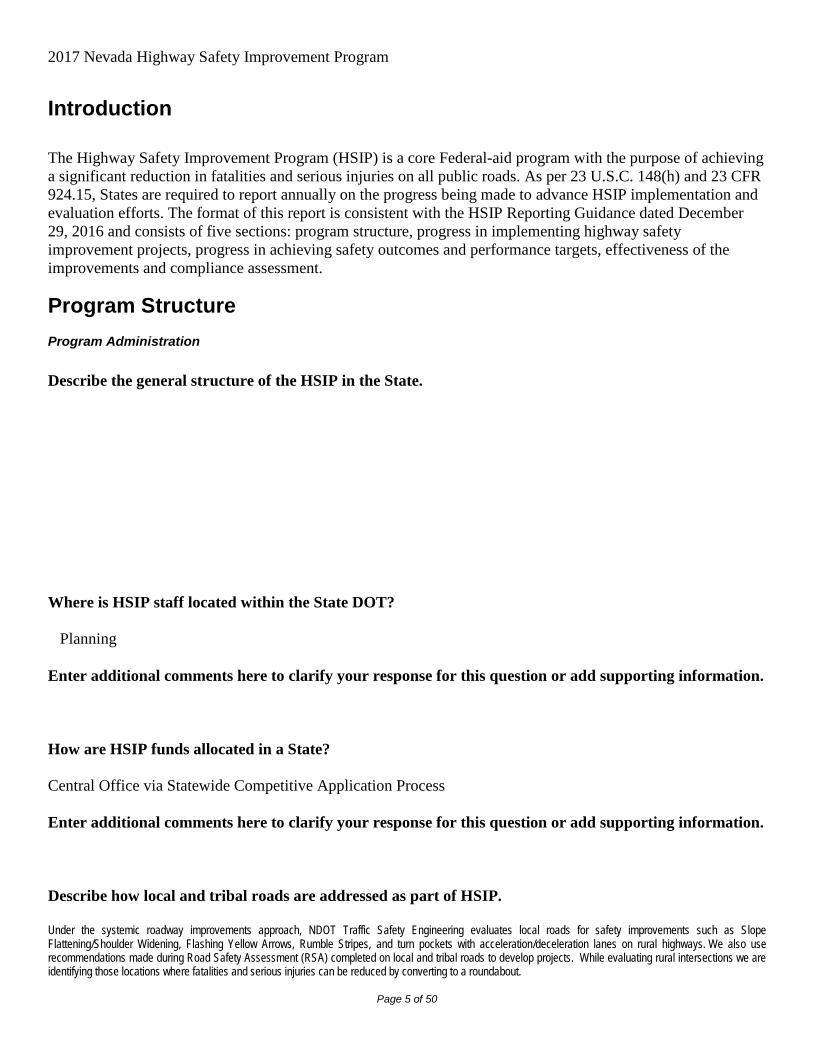
Introduction The Highway Safety Improvement Program (HSIP) is a core Federal-aid program with the purpose of achieving a significant reduction in fatalities and serious injuries on all public roads. As per 23 U.S.C. 148(h) and 23 CFR 924.15, States are required to report annually on the progress being made to advance HSIP implementation and evaluation efforts. The format of this report is consistent with the HSIP Reporting Guidance dated December 29, 2016 and consists of five sections: program structure, progress in implementing highway safety improvement projects, progress in achieving safety outcomes and performance targets, effectiveness of the improvements and compliance assessment.
Program Structure Program Administration Describe the general structure of the HSIP in the State.
Where is HSIP staff located within the State DOT? Planning Enter additional comments here to clarify your response for this question or add supporting information. How are HSIP funds allocated in a State? Central Office via Statewide Competitive Application Process Enter additional comments here to clarify your response for this question or add supporting information. Describe how local and tribal roads are addressed as part of HSIP. Under the systemic roadway improvements approach, NDOT Traffic Safety Engineering evaluates local roads for safety improvements such as Slope Flattening/Shoulder Widening, Flashing Yellow Arrows, Rumble Stripes, and turn pockets with acceleration/deceleration lanes on rural highways. We also use recommendations made during Road Safety Assessment (RSA) completed on local and tribal roads to develop projects. While evaluating rural intersections we are identifying those locations where fatalities and serious injuries can be reduced by converting to a roundabout.

2017 Nevada Highway Safety Improvement Program
Page 6 of 50
NDOT Traffic Safety Engineering developed a low-cost safety improvement project with 2 local tribal agencies; the Te-Moak Tribe Band (which includes Battle Mountain Indian Colony, Elko Indian Colony, South Fork Indian Reservation, and the Wells Indian Colony) and the Duckwater Tribe. The safety improvements included enhanced pedestrian lighting, signage, and sidewalk improvements.
Identify which internal partners (e.g., State departments of transportation (DOTs) Bureaus, Divisions) are involved with HSIP planning. Traffic Engineering/Safety Design Planning Maintenance Operations Districts/Regions Enter additional comments here to clarify your response for this question or add supporting information. Describe coordination with internal partners.
NDOT Traffic Safety Engineering coordinates with: 1. The NDOT Roadway Design team at many various levels to include, recommend or request the inclusion of safety improvements from strategies identified in the Strategic Highway Safety Program (SHSP), Road Safety Assessments (RSA), Safety Management Plans (SMPs) or locations identified as safety management areas: Preliminary Field Design Survey - at this level the team recommends possible improvements to include into the project based on the review of field conditions. Pre-design - at this level the traffic safety team evaluates the design concepts for the inclusion of safety improvements and recommends possible safety improvements to include into the project. Intermediate design - at this level the traffic safety team evaluates the preliminary design for the inclusion of safety improvements and recommends possible safety improvements to include into the project. Final design - at this level the traffic safety team evaluates the final design for the inclusion of safety improvements.
Also, NDOT Traffic Safety Engineering coordinates with the Roadway Design team to educate them in the latest safety strategies and provides guidance regarding safety improvements and ideas. This includes the utilization of the strategies included in the SHSP, the HSM and the federal guidelines. Traffic Safety Engineering coordinates with the Roadway Design Scoping section to initiate and recommend safety improvements into projects that are currently being evaluated. This coordination with the Scoping team also includes the 3R evaluation team when they complete their field reviews for upcoming projects. 2. The NDOT Maintenance/Operations division during Road Safety Assessment’s, Safety Management Plans and miscellaneous field reviews. 3. The NDOT Planning division at many different levels to provide guidance regarding safety improvements in the development of projects and by recommending safety improvements for inclusion into projects that are in the early stage of development. 4. The NDOT Traffic Operations division when developing / implementing safety projects, which includes signal design, lighting design, operational analysis of roadway segments and intersections, and development and discussion of safety strategies, methodologies and guidelines. Traffic Safety and Traffic Operations have incorporated the Intersection Control Evaluation (ICE) as part of our intersection improvement evaluations and Wrong Way Driver countermeasures. The Traffic Incident Management (TIM) program is also a coordinated effort between Traffic Safety and Traffic Operations. Utilizing HSIP funds, the TIM programs primary goal is to reduce fatalities and serious injuries from secondary crashes.

2017 Nevada Highway Safety Improvement Program
Page 7 of 50
5. The Governors Highway Safety Office (The Department of Public Safety - Office of Traffic Safety, OTS). Traffic Safety Engineering continues to coordinate with the OTS since the inception of the SHSP and has funded many behavioral components of the OTS. Because of this long ongoing coordination between Traffic Safety Engineering and OTS, the safety messages continue to reach more and more road users in the state of Nevada which results in achieving our combined performance measures. 6. The NDOT District offices to gain knowledge of the locations that are of concern to the district to determine if they are being identified as potential safety project locations.
Identify which external partners are involved with HSIP planning. Regional Planning Organizations (e.g. MPOs, RPOs, COGs) Governors Highway Safety Office Local Government Agency Tribal Agency Law Enforcement Agency Academia/University FHWA Other-Emergency Medical Services Enter additional comments here to clarify your response for this question or add supporting information. Law Enforcement Agencies - Nevada Highway Patrol, Las Vegas Metropolitan Police, City and County, etc. Describe coordination with external partners. NDOT Traffic Safety Engineering coordinated with:
1. Academia/University -the University of Nevada Reno, and the University of Nevada Las Vegas in several research projects, which includes Pedestrian safety, Rural Lane Departures on Curves, and Safety Analyst.
2. FHWA - attended webinars and workshops that are hosted by the FHWA. Also, FHWA provided technical support and guidance on the HSIP eligibility, and Juan Balbuena participated on SMPs, RSAs and attended the Safety Summit.
3. Governors Highway Safety Office (The Department of Public Safety - Office of Traffic Safety, OTS). Traffic Safety Engineering has been coordinating with the OTS since the inception of the SHSP and has funded many behavioral components of the OTS. Because of this long ongoing crash data coordination between Traffic Safety Engineering and OTS, the safety messages continue to reach more and more road users in the state of Nevada which results in achieving our combined performance measures.
4. Local Government Agency - representatives from local government agencies attended the Safety Summit and are also members of the Critical Emphasis Area teams.
5. MPO’s - staff from the Southern Nevada RTC, RTC of Washoe County, and CAMPO attended the Safety Summit and are also members of the Critical Emphasis Area teams.
6. Tribal Agency - some tribal representative attended the Safety Summit. Also, Traffic Safety Engineering has performed Road Safety Audits (RSAs) for a few tribes located in the state.
7. Law Enforcement Agency - representatives from local law enforcement agencies attended the Safety Summit and are also members of the Critical Emphasis Area teams.
Have any program administration practices used to implement the HSIP changed since the last reporting period? No

2017 Nevada Highway Safety Improvement Program
Page 8 of 50
Are there any other aspects of HSIP Administration on which the State would like to elaborate? Yes Describe other aspects of HSIP Administration on which the State would like to elaborate.
Nevada Strategic Highway Safety Plan:
The 2nd update to the Nevada SHSP was completed in 2016. The 2017 Nevada Traffic Safety Summit was held in Reno, Nevada on May 23 - 25. Approximately 250 safety professionals representing the 4 “E’s” gathered together to attend roundtable discussions and listen to presentations on a wide range of traffic safety SHSP topics. In 2016 at a meeting of the Nevada Executive Committee on Traffic Safety (NECTS), it was decided to add a 7th CEA for Young Drivers. Recurring activities for the SHSP in 2016 included semi-annual meetings of the NECTS (Nevada Executive Committee on Traffic Safety) and quarterly meetings for the SHSP Technical Working Group, seven SHSP Critical Emphasis Area (CEA) teams (Intersections, Impaired Driving, Occupant protection, Pedestrians, Lane departures and Motorcycle’s, and new Young Drivers). Road Safety Assessments (RSA)
The RSA program is continuing in Nevada and has been a typical approach by the designer and/or planner to use an RSA as a safety tool on their new projects. There were Eleven (11) RSAs performed from June 2016 to August 2017. The RSAs were primarily performed on 3R preservation projects, capacity projects, corridor studies, and Tribal planning projects. For Federal Fiscal Year 16 & 17, the RSA program continued the updating of the RSA database. The RSA database is a compilation of all the RSA suggestions in one central file that can easily be sorted out according to the required data field for use as a design/planning reference by NDOT transportation professionals. The RSA database will identify suggestions that were incorporated in the project or implemented by NDOT District Maintenance crews and/or by other using agencies; and identify those suggestions that were not implemented. The compilation was performed on 123 RSA reports that were completed statewide in a 5-year period from February 2010 to November 2014.
The RSA program statewide will continue in FFY 18-19. The updating of the RSA database will include those RSAs that were performed in 2015 and 2016.
Systemic improvements:
Systemic improvements that were incorporated in the FY2016 HSIP program were: shoulder widening & slope flattening on rural two-lane highways, flashing yellow arrow installations, and acceleration/deceleration and turn lanes on rural state highways. NDOT Traffic Safety Engineering is also evaluating the following:
• Conversion of all rural state route highway striping from 4” lines to 6” edge lines as a countermeasure for lane departure crashes.
• The use of the Intersection Control Evaluation (ICE) methodology to determine the best intersection type based on safety and efficiency.
Safety Management Plans: a safety focused corridor study
To reduce the number of crashes on Nevada Roadways, the NDOT Traffic Safety Engineering Division identified corridors on arterial roads statewide to implement safety improvements. To identify corridors for improvement on Principal Arterials, routes were identified that exceed the statewide average crashes per mile and average severe crashes per mile by functional classification when compared to the statewide averages. For Minor Arterials, routes were identified that exceed double the statewide average crashes per mile and severe crashes per mile by functional classification when compared to the statewide averages.
Three SMP’s were started at the following locations:
• McCarran Road in Sparks, Nevada (Greg to Probasco Way)
• Rancho in City of North Las Vegas (US 95 to Cheyenne)
• Lamb in City of Las Vegas (Sahara to Lake Mead)
These SMP’s will evaluate the needs of all modes of transportation and make recommendations for future projects. The purpose of a Safety Management Plan (SMP) was to conduct a safety focused corridor study aimed at all road users and to include collaboration with stakeholders and the public. A SMP includes the development of short and long range transportation safety improvement projects that incorporate relevant studies, access management principles, public and stakeholder input, crash and capacity analyses, benefit/cost analysis, and other impacts to all road

2017 Nevada Highway Safety Improvement Program
Page 9 of 50
users. A Technical Advisory Committee (TAC) and a Stakeholder Working Group (SWG) are created to help with the development of the SMP and to ensure that the plan was consistent with the needs of the many different stakeholders along the project corridor. The SMP process is consistent with the Nevada Strategic Highway Safety Plan’s goals of reducing the number of fatalities and serious injuries on Nevada’s roadways. NDOT Complete Streets Policy With the approval of NDOT’s Director, a NDOT Complete Streets Policy was developed by Traffic Safety Engineering staff for NDOT. The purpose of the NDOT Complete Streets policy is to provide guidance for the implementation of complete streets on NDOT right-of-way throughout the state. The NDOT Complete Street Policy was developed using the guidance from Smart Growth America and in collaboration with local jurisdictions, the Regional Transportation Commission’s, (both Washoe and Southern Nevada), and NDOT staff. The purpose of implementing Complete Streets policies and design is to provide access to safe, comfortable, and convenient travel for all users, regardless of age, ability, income, race, or ethnicity. This access could include walking, driving, bicycling, skateboarding, and/or using public transportation.
Traffic Safety Engineering Design Services (TSEDs):
The TSEDs were used to design safety improvements identified in RSAs and SMPs. The following list of projects were design in 2016 utilizing SEDs:
• Te-Moak Tribe Band and Duckwater Tribe Low Cost Safety Improvements • Multiple Intersections in Dist. II (Sparks) - Signal System Modification with Flashing Yellow Arrows. • US 50, MP LA 0- 25 Shoulder widening and slope flattening • US 93, MP CL 64-86 Shoulder widening and slope flattening • US 395 Construct Acceleration & Deceleration Lanes. Extend Existing Acceleration Lanes • SR 667, Kietzke Lane, Complete Street design with pedestrian, bike, and ADA Improvements (SMP) • SR 573, Craig Road, from Decatur Blvd to 5th St. Low Cost Safety Improvements as recommended in the Craig Road Safety Management
Plan • SR 582, Boulder Highway, 8 Pedestrian Crossing Improvements in both Clark County and Henderson, Nevada • US 50, 3 Pedestrian Crossing Improvements (@ Pike Street in Dayton,Nevada; @Silver State Street in Carson City, Nevada; and @
Lakeshore Blvd at Lake Tahoe, Nevada)
Program Methodology Does the State have an HSIP manual or similar that clearly describes HSIP planning, implementation and evaluation processes? Yes To upload a copy of the State processes, attach files below. File Name: Highway Safety Improvement Program Manual final-updated-8.7.17.docx Select the programs that are administered under the HSIP. Intersection Rural State Highways Skid Hazard Roadway Departure Pedestrian Safety Shoulder Improvement Segments Other-Safety Management Plans Enter additional comments here to clarify your response for this question or add supporting information.

2017 Nevada Highway Safety Improvement Program
Page 10 of 50
Program: Intersection Date of Program Methodology: 3/9/1997 What is the justification for this program? [Check all that apply] Addresses SHSP priority or emphasis area FHWA focused approach to safety What is the funding approach for this program? [Check one] Competes with all projects What data types were used in the program methodology? [Check all that apply] Crashes Exposure Roadway All crashes
Volume
Functional classification
What project identification methodology was used for this program? [Check all that apply] Crash frequency Equivalent property damage only (EPDO Crash frequency) Crash rate Excess expected crash frequency using SPFs Are local roads (non-state owned and operated) included or addressed in this program? Yes Are local road projects identified using the same methodology as state roads? Yes Describe the methodology used to identify local road projects as part of this program. How are projects under this program advanced for implementation? Other-Priority Ranking Select the processes used to prioritize projects for implementation. For the methods selected, indicate the relative importance of each process in project prioritization. Enter either the weights or numerical

2017 Nevada Highway Safety Improvement Program
Page 11 of 50
rankings. If weights are entered, the sum must equal 100. If ranks are entered, indicate ties by giving both processes the same rank and skip the next highest rank (as an example: 1, 2, 2, 4). Rank of Priority Consideration Ranking based on B/C : 1 Available funding : 2 Other-combining with other projects with our traffic safety partners : 3 Enter additional comments here to clarify your response for this question or add supporting information. Program: Pedestrian Safety Date of Program Methodology: 3/15/2015 What is the justification for this program? [Check all that apply] What is the funding approach for this program? [Check one] What data types were used in the program methodology? [Check all that apply] Crashes Exposure Roadway
All crashes
Volume
Other-Land Use Generators
Functional classification
What project identification methodology was used for this program? [Check all that apply] Crash frequency EPDO crash frequency with EB adjustment Crash rate Excess expected crash frequency using SPFs Are local roads (non-state owned and operated) included or addressed in this program? Yes Are local road projects identified using the same methodology as state roads? Yes Describe the methodology used to identify local road projects as part of this program.

2017 Nevada Highway Safety Improvement Program
Page 12 of 50
How are projects under this program advanced for implementation? Other-Priority Ranking Select the processes used to prioritize projects for implementation. For the methods selected, indicate the relative importance of each process in project prioritization. Enter either the weights or numerical rankings. If weights are entered, the sum must equal 100. If ranks are entered, indicate ties by giving both processes the same rank and skip the next highest rank (as an example: 1, 2, 2, 4). Rank of Priority Consideration Ranking based on B/C : 1 Available funding : 2 Other-Combining with other projects being done by our traffic safety partners : 3 Enter additional comments here to clarify your response for this question or add supporting information. Program: Roadway Departure Date of Program Methodology: 6/15/2016 What is the justification for this program? [Check all that apply] Addresses SHSP priority or emphasis area FHWA focused approach to safety What is the funding approach for this program? [Check one] Competes with all projects What data types were used in the program methodology? [Check all that apply] Crashes Exposure Roadway All crashes
Volume
Functional classification
What project identification methodology was used for this program? [Check all that apply] Crash frequency Equivalent property damage only (EPDO Crash frequency) Crash rate Excess expected crash frequency using SPFs Are local roads (non-state owned and operated) included or addressed in this program?

2017 Nevada Highway Safety Improvement Program
Page 13 of 50
Yes Are local road projects identified using the same methodology as state roads? Yes Describe the methodology used to identify local road projects as part of this program. How are projects under this program advanced for implementation? Other-Priority Ranking Select the processes used to prioritize projects for implementation. For the methods selected, indicate the relative importance of each process in project prioritization. Enter either the weights or numerical rankings. If weights are entered, the sum must equal 100. If ranks are entered, indicate ties by giving both processes the same rank and skip the next highest rank (as an example: 1, 2, 2, 4). Enter additional comments here to clarify your response for this question or add supporting information. Program: Rural State Highways Date of Program Methodology: 10/22/2012 What is the justification for this program? [Check all that apply] What is the funding approach for this program? [Check one] What data types were used in the program methodology? [Check all that apply] Crashes Exposure Roadway All crashes
Volume
Functional classification
What project identification methodology was used for this program? [Check all that apply] Crash frequency Equivalent property damage only (EPDO Crash frequency) Crash rate Excess expected crash frequency using SPFs

2017 Nevada Highway Safety Improvement Program
Page 14 of 50
Are local roads (non-state owned and operated) included or addressed in this program? Yes Are local road projects identified using the same methodology as state roads? Yes Describe the methodology used to identify local road projects as part of this program. How are projects under this program advanced for implementation? Other-Priority Ranking Select the processes used to prioritize projects for implementation. For the methods selected, indicate the relative importance of each process in project prioritization. Enter either the weights or numerical rankings. If weights are entered, the sum must equal 100. If ranks are entered, indicate ties by giving both processes the same rank and skip the next highest rank (as an example: 1, 2, 2, 4). Rank of Priority Consideration Ranking based on B/C : 1 Available funding : 2 Other-Combining with other projects being done by our traffic safety partners : 3 Enter additional comments here to clarify your response for this question or add supporting information. Program: Segments Date of Program Methodology: 9/15/2015 What is the justification for this program? [Check all that apply] What is the funding approach for this program? [Check one] What data types were used in the program methodology? [Check all that apply] Crashes Exposure Roadway All crashes
Volume
Functional classification

2017 Nevada Highway Safety Improvement Program
Page 15 of 50
What project identification methodology was used for this program? [Check all that apply] Crash frequency Equivalent property damage only (EPDO Crash frequency) Crash rate Excess expected crash frequency using SPFs Are local roads (non-state owned and operated) included or addressed in this program? Yes Are local road projects identified using the same methodology as state roads? Yes Describe the methodology used to identify local road projects as part of this program. How are projects under this program advanced for implementation? Other-Priority Ranking Select the processes used to prioritize projects for implementation. For the methods selected, indicate the relative importance of each process in project prioritization. Enter either the weights or numerical rankings. If weights are entered, the sum must equal 100. If ranks are entered, indicate ties by giving both processes the same rank and skip the next highest rank (as an example: 1, 2, 2, 4). Rank of Priority Consideration Ranking based on B/C : 1 Available funding : 2 Other-Combining with other projects being done by our traffic safety partners : 3 Enter additional comments here to clarify your response for this question or add supporting information. Program: Shoulder Improvement Date of Program Methodology: 6/15/2016 What is the justification for this program? [Check all that apply] Addresses SHSP priority or emphasis area FHWA focused approach to safety What is the funding approach for this program? [Check one] Competes with all projects

2017 Nevada Highway Safety Improvement Program
Page 16 of 50
What data types were used in the program methodology? [Check all that apply] Crashes Exposure Roadway All crashes
Volume
Functional classification
What project identification methodology was used for this program? [Check all that apply] Crash frequency Equivalent property damage only (EPDO Crash frequency) Crash rate Excess expected crash frequency using SPFs Are local roads (non-state owned and operated) included or addressed in this program? Yes Are local road projects identified using the same methodology as state roads? Yes Describe the methodology used to identify local road projects as part of this program. How are projects under this program advanced for implementation? Other-Priority Ranking Select the processes used to prioritize projects for implementation. For the methods selected, indicate the relative importance of each process in project prioritization. Enter either the weights or numerical rankings. If weights are entered, the sum must equal 100. If ranks are entered, indicate ties by giving both processes the same rank and skip the next highest rank (as an example: 1, 2, 2, 4). Enter additional comments here to clarify your response for this question or add supporting information. Program: Skid Hazard Date of Program Methodology: 6/15/2016 What is the justification for this program? [Check all that apply] Addresses SHSP priority or emphasis area

2017 Nevada Highway Safety Improvement Program
Page 17 of 50
FHWA focused approach to safety What is the funding approach for this program? [Check one] Competes with all projects What data types were used in the program methodology? [Check all that apply] Crashes Exposure Roadway All crashes
Volume
Functional classification
What project identification methodology was used for this program? [Check all that apply] Crash frequency Equivalent property damage only (EPDO Crash frequency) Crash rate Excess expected crash frequency using SPFs Are local roads (non-state owned and operated) included or addressed in this program? Yes Are local road projects identified using the same methodology as state roads? Yes Describe the methodology used to identify local road projects as part of this program. How are projects under this program advanced for implementation? Other-Priority Ranking Select the processes used to prioritize projects for implementation. For the methods selected, indicate the relative importance of each process in project prioritization. Enter either the weights or numerical rankings. If weights are entered, the sum must equal 100. If ranks are entered, indicate ties by giving both processes the same rank and skip the next highest rank (as an example: 1, 2, 2, 4). Enter additional comments here to clarify your response for this question or add supporting information. Program: Other-Safety Management Plans

2017 Nevada Highway Safety Improvement Program
Page 18 of 50
Date of Program Methodology: 6/15/2016 What is the justification for this program? [Check all that apply] Addresses SHSP priority or emphasis area FHWA focused approach to safety What is the funding approach for this program? [Check one] Competes with all projects What data types were used in the program methodology? [Check all that apply] Crashes Exposure Roadway All crashes
Volume
Functional classification
What project identification methodology was used for this program? [Check all that apply] Crash frequency Equivalent property damage only (EPDO Crash frequency) Crash rate Excess expected crash frequency using SPFs Are local roads (non-state owned and operated) included or addressed in this program? Yes Are local road projects identified using the same methodology as state roads? Yes Describe the methodology used to identify local road projects as part of this program. How are projects under this program advanced for implementation? Other-Priority Ranking Select the processes used to prioritize projects for implementation. For the methods selected, indicate the relative importance of each process in project prioritization. Enter either the weights or numerical rankings. If weights are entered, the sum must equal 100. If ranks are entered, indicate ties by giving both processes the same rank and skip the next highest rank (as an example: 1, 2, 2, 4). Ranking based on B/C : 1 Available funding : 2

2017 Nevada Highway Safety Improvement Program
Page 19 of 50
Other-combining with other projects with our traffic safety partners : 3 Enter additional comments here to clarify your response for this question or add supporting information. What percentage of HSIP funds address systemic improvements? 60 HSIP funds are used to address which of the following systemic improvements? Please check all that apply. Pavement/Shoulder Widening Install/Improve Lighting Add/Upgrade/Modify/Remove Traffic Signal Other-Safety Management Plans Enter additional comments here to clarify your response for this question or add supporting information. What process is used to identify potential countermeasures? [Check all that apply] Engineering Study Road Safety Assessment Crash data analysis Data-driven safety analysis tools (HSM, CMF Clearinghouse, SafetyAnalyst, usRAP) Other-Safety Management Plans Enter additional comments here to clarify your response for this question or add supporting information. Does the State HSIP consider connected vehicles and ITS technologies? No Enter additional comments here to clarify your response for this question or add supporting information. Does the State use the Highway Safety Manual to support HSIP efforts? Yes Please describe how the State uses the HSM to support HSIP efforts.
The Highway Safety Manual’s process for Network Screening and Project Prioritization is used to help determine the priority of HSIP projects as well as the predictive methodologies. We also use the Highway Safety Manual process for calculating the Safety Effectiveness of our projects.
2017 Nevada Highway Safety Improvement Program
Page 20 of 50
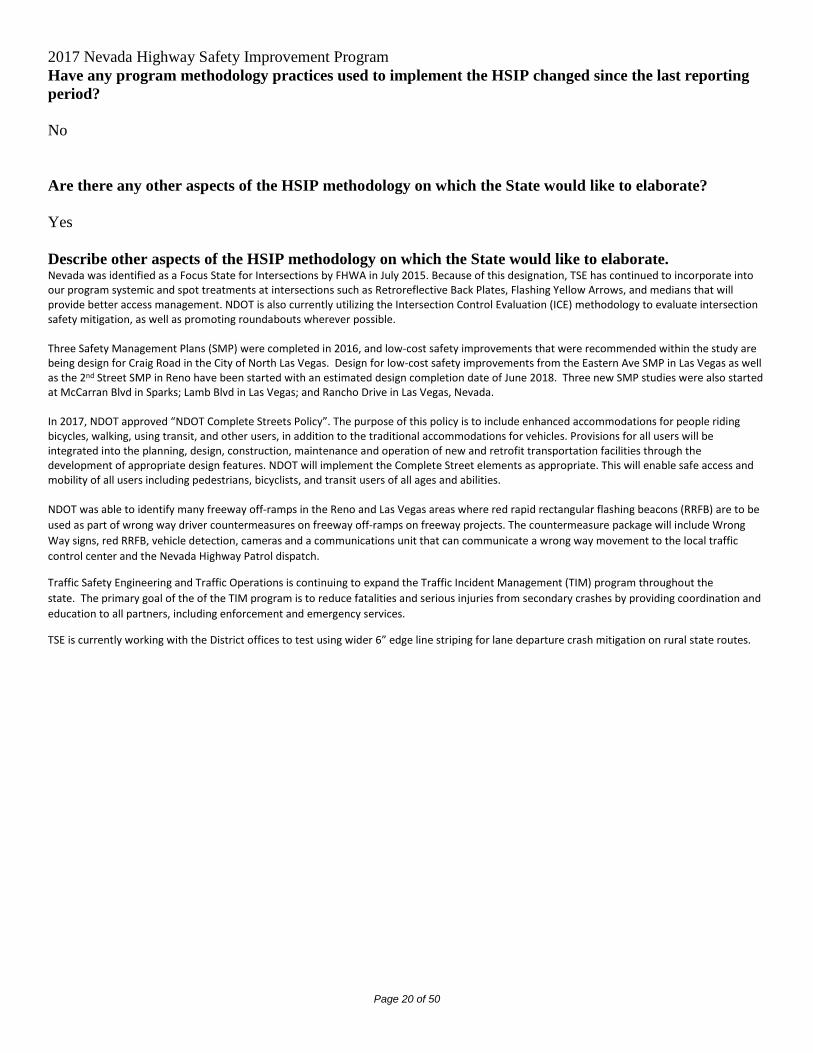
Have any program methodology practices used to implement the HSIP changed since the last reporting period? No Are there any other aspects of the HSIP methodology on which the State would like to elaborate? Yes Describe other aspects of the HSIP methodology on which the State would like to elaborate. Nevada was identified as a Focus State for Intersections by FHWA in July 2015. Because of this designation, TSE has continued to incorporate into our program systemic and spot treatments at intersections such as Retroreflective Back Plates, Flashing Yellow Arrows, and medians that will provide better access management. NDOT is also currently utilizing the Intersection Control Evaluation (ICE) methodology to evaluate intersection safety mitigation, as well as promoting roundabouts wherever possible. Three Safety Management Plans (SMP) were completed in 2016, and low-cost safety improvements that were recommended within the study are being design for Craig Road in the City of North Las Vegas. Design for low-cost safety improvements from the Eastern Ave SMP in Las Vegas as well as the 2nd Street SMP in Reno have been started with an estimated design completion date of June 2018. Three new SMP studies were also started at McCarran Blvd in Sparks; Lamb Blvd in Las Vegas; and Rancho Drive in Las Vegas, Nevada. In 2017, NDOT approved “NDOT Complete Streets Policy”. The purpose of this policy is to include enhanced accommodations for people riding bicycles, walking, using transit, and other users, in addition to the traditional accommodations for vehicles. Provisions for all users will be integrated into the planning, design, construction, maintenance and operation of new and retrofit transportation facilities through the development of appropriate design features. NDOT will implement the Complete Street elements as appropriate. This will enable safe access and mobility of all users including pedestrians, bicyclists, and transit users of all ages and abilities. NDOT was able to identify many freeway off-ramps in the Reno and Las Vegas areas where red rapid rectangular flashing beacons (RRFB) are to be used as part of wrong way driver countermeasures on freeway off-ramps on freeway projects. The countermeasure package will include Wrong Way signs, red RRFB, vehicle detection, cameras and a communications unit that can communicate a wrong way movement to the local traffic control center and the Nevada Highway Patrol dispatch.
Traffic Safety Engineering and Traffic Operations is continuing to expand the Traffic Incident Management (TIM) program throughout the state. The primary goal of the of the TIM program is to reduce fatalities and serious injuries from secondary crashes by providing coordination and education to all partners, including enforcement and emergency services. TSE is currently working with the District offices to test using wider 6” edge line striping for lane departure crash mitigation on rural state routes.

2017 Nevada Highway Safety Improvement Program
Page 21 of 50
Project Implementation Funds Programmed Reporting period for HSIP funding. Federal Fiscal Year Enter additional comments here to clarify your response for this question or add supporting information. Enter the programmed and obligated funding for each applicable funding category.
FUNDING CATEGORY PROGRAMMED OBLIGATED % OBLIGATED/PROGRAMMED
HSIP (23 U.S.C. 148) $19,126,241 $19,126,241 100%
HRRR Special Rule (23 U.S.C. 148(g)(1))
$0 $0 0%
Penalty Funds (23 U.S.C. 154) $0 $0 0%
Penalty Funds (23 U.S.C. 164) $0 $0 0%
RHCP (for HSIP purposes) (23 U.S.C. 130(e)(2))
$0 $0 0%
Other Federal-aid Funds (i.e. STBG, NHPP)
$0 $0 0%
State and Local Funds $1,074,974 $1,074,974 100%
Totals $20,201,215 $20,201,215 100% Enter additional comments here to clarify your response for this question or add supporting information. How much funding is programmed to local (non-state owned and operated) or tribal safety projects? 14% How much funding is obligated to local or tribal safety projects? 14% Enter additional comments here to clarify your response for this question or add supporting information. How much funding is programmed to non-infrastructure safety projects?

2017 Nevada Highway Safety Improvement Program
Page 22 of 50
23% How much funding is obligated to non-infrastructure safety projects? 23% Enter additional comments here to clarify your response for this question or add supporting information. How much funding was transferred in to the HSIP from other core program areas during the reporting period under 23 U.S.C. 126? 0% How much funding was transferred out of the HSIP to other core program areas during the reporting period under 23 U.S.C. 126? 0% Enter additional comments here to clarify your response for this question or add supporting information. Discuss impediments to obligating HSIP funds and plans to overcome this challenge in the future. Recently some items that are necessary to be procured with the requirements of a “Buy America” certification, have caused major project delays.
Does the State want to elaborate on any other aspects of it’s progress in implementing HSIP projects? Yes Describe any other aspects of the State’s progress in implementing HSIP projects on which the State would like to elaborate.
After the FAST Act was implemented, the behavior programs (non-infrastructure safety projects) that we had obligated funds to, were no longer eligible for HSIP funds. NDOT Traffic Safety Engineering was able to utilize other funds to keep this program going, (mainly state gas tax funds) and continue our program obligations.

2017 Nevada Highway Safety Improvement Program
Page 23 of 50
General Listing of Projects List the projects obligated using HSIP funds for the reporting period.
RELATIONSHIP TO SHSP
PROJECT NAME IMPROVEMENT CATEGORY
SUBCATEGORY OUTPUTS OUTPUT TYPE HSIP PROJECT COST($)
TOTAL PROJECT COST($)
FUNDING CATEGORY
FUNCTIONAL CLASSIFICATION
AADT SPEED OWNERSHIP METHOD FOR SITE SELECTION
EMPHASIS AREA STRATEGY
Multiple Intersections in Dist. II (Sparks) - Signal System Modification
Intersection traffic control
Modify traffic signal - add
additional signal heads
24 Intersections $2137500 $2250000 HSIP (23 U.S.C. 148)
Rural Principal Arterial - Other
0 50 State Highway Agency
Systemic Intersections Intersection 2
US 50 LA MP 0 - 25.0 Shoulder widening and slope flattening
Shoulder treatments
Widen shoulder - paved or other
25 Miles $4000000 $4210526 HSIP (23 U.S.C. 148)
Rural Principal Arterial - Other
683 65 State Highway Agency
Systemic Lane Departure Lane Departure 2
US 93, MP CL 64-86 Shoulder widening and slope flattening
Shoulder treatments
Widen shoulder - paved or other
22 Miles $2280000 $2400000 HSIP (23 U.S.C. 148)
Rural Principal Arterial - Other
1,207 70 State Highway Agency
Systemic Lane Departure Lane Departure 2
US 395 Construct Acceleration & Deceleration Lanes. Extend Existing Acceleration Lanes
Intersection geometry
Auxiliary lanes - add acceleration
lane 3 Intersections $1144750 $1205000 HSIP (23 U.S.C.
148) Rural Principal Arterial - Other
1,573 65 State Highway Agency
Systemic Intersection and Lane Departures
Intersections 1, 2 and 3
SR 667, Kietzke Lane, Pedestrian and ADA Improvements (SMP) Package 2
Pedestrians and bicyclists
Miscellaneous pedestrians and
bicyclists 1.1 Miles $2807000 $2960000 HSIP (23 U.S.C.
148) Rural Principal Arterial - Other
15,000 45 State Highway Agency
Safety Management Plan
and Crash rate/Crash
frequency analysis
Intersections and Pedestrian
Intersections 1 and 4, Pedestrian
1 and 2
SR 573, Craig Road, from Decatur Blvd to 5th St. (SMP)
Pedestrians and bicyclists
Miscellaneous pedestrians and
bicyclists 4 Miles $1900000 $2000000 HSIP (23 U.S.C.
148) Rural Principal Arterial - Other
41,974 45 State Highway Agency
Safety managemetn Plan and Crash/Crash
frequency analysis
Intersections and Pedestrians
Intersection 1 and 4, Pedestrian 1
and 2
Te-Moak Low Cost Safety Improvements (SED)
4 Intersections $791871 $833549 HSIP (23 U.S.C. 148)
Rural Principal Arterial - Other
0 45 Indian Tribe Nation
RSA recommendation
Intersections, Lane Departures, and Pedestrians
Intersections 1, 3 and 4, Lane
Departures 2, Pedestrians 1 and
2 Enter additional comments here to clarify your response for this question or add supporting information.

2017 Nevada Highway Safety Improvement Program
Page 24 of 50
Safety Performance General Highway Safety Trends Present data showing the general highway safety trends in the State for the past five years.
PERFORMANCE MEASURES 2008 2009 2010 2011 2012 2013 2014 2015 2016
Fatalities 0 0 0 0 261 266 290 325 329
Serious Injuries 0 0 0 0 1,048 1,205 1,144 1,097 1,232
Fatality rate (per HMVMT) 0.000 0.000 0.000 0.000 1.150 1.130 1.140 1.300 1.320
Serious injury rate (per HMVMT)
0.000 0.000 0.000 0.000 4.590 3.900 4.490 4.370 4.910
Number non-motorized fatalities
0 0 0 0 61 68 80 83 86
Number of non-motorized serious injuries
0 0 0 0 197 211 199 181 206

2017 Nevada Highway Safety Improvement Program
Page 25 of 50
0
50
100
150
200
250
300
350
2008 2009 2010 2011 2012 2013 2014 2015 2016
Annual Fatalities
Fatalities 5 Year Rolling Avg.
0
200
400
600
800
1000
1200
1400
1600
2008 2009 2010 2011 2012 2013 2014 2015 2016
Annual Serious Injuries
Serious Injuries 5 Year Rolling Avg.

2017 Nevada Highway Safety Improvement Program
Page 26 of 50
0
0.2
0.4
0.6
0.8
1
1.2
1.4
1.6
2008 2009 2010 2011 2012 2013 2014 2015 2016
Fatality rate (per HMVMT)
Fatality rate (per HMVMT) 5 Year Rolling Avg.
0
1
2
3
4
5
6
7
2008 2009 2010 2011 2012 2013 2014 2015 2016
Serious injury rate (per HMVMT)
Serious injury rate (per HMVMT) 5 Year Rolling Avg.

2017 Nevada Highway Safety Improvement Program
Page 27 of 50
Enter additional comments here to clarify your response for this question or add supporting information. Describe fatality data source. FARS Enter additional comments here to clarify your response for this question or add supporting information. NV Dept. of Transportation keeps a fatal database and coordinates the information with the state FARS Analyst. To the maximum extent possible, present this data by functional classification and ownership.
Year 2016
Functional Classification Number of Fatalities (5-yr avg)
Number of Serious Injuries
(5-yr avg) Fatality Rate (per HMVMT)
(5-yr avg) Serious Injury Rate
(per HMVMT) (5-yr avg)
Rural Principal Arterial - Interstate
20.6 35.8 1 1.45
Rural Principal Arterial - Other Freeways and Expressways
0 0 0 0
Rural Principal Arterial - Other
30.8 41.6 2.13 2.09
0
50
100
150
200
250
300
350
2008 2009 2010 2011 2012 2013 2014 2015 2016
Non Motorized Fatalities and Serious Injuries
Fatalities and Serious Injuries 5 Year Rolling Avg.
2017 Nevada Highway Safety Improvement Program
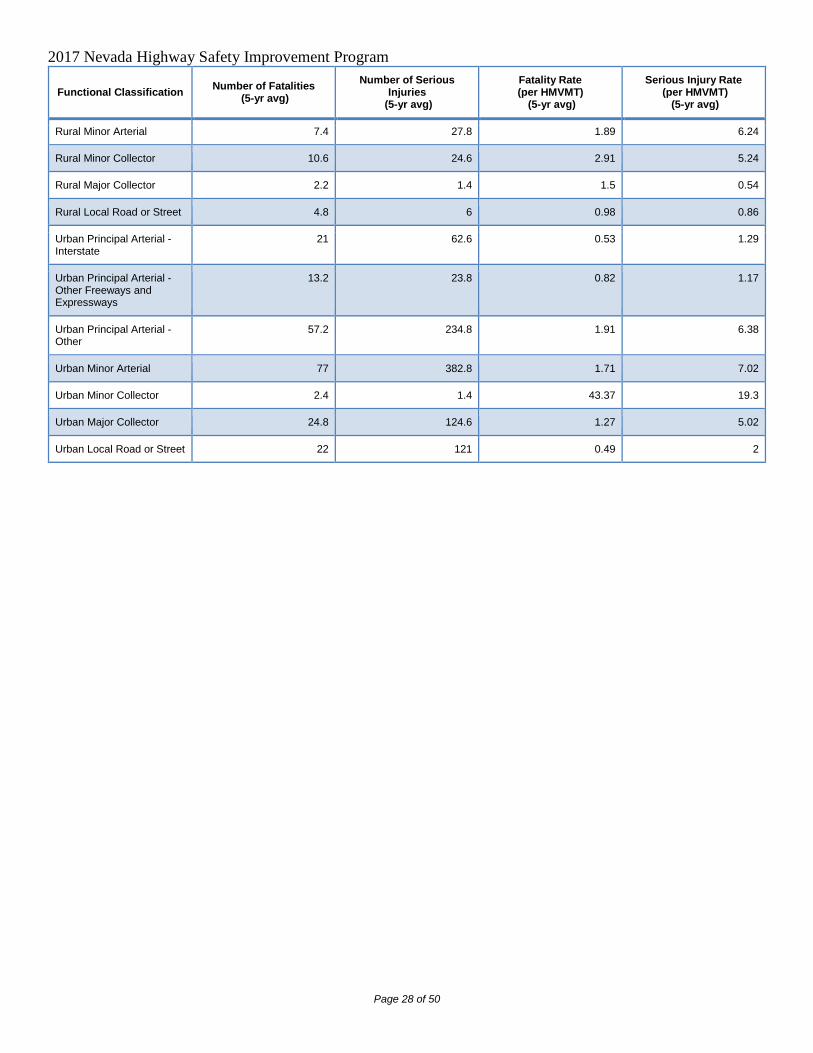
Page 28 of 50
Functional Classification Number of Fatalities (5-yr avg)
Number of Serious Injuries
(5-yr avg) Fatality Rate (per HMVMT)
(5-yr avg) Serious Injury Rate
(per HMVMT) (5-yr avg)
Rural Minor Arterial 7.4 27.8 1.89 6.24
Rural Minor Collector 10.6 24.6 2.91 5.24
Rural Major Collector 2.2 1.4 1.5 0.54
Rural Local Road or Street 4.8 6 0.98 0.86
Urban Principal Arterial - Interstate
21 62.6 0.53 1.29
Urban Principal Arterial - Other Freeways and Expressways
13.2 23.8 0.82 1.17
Urban Principal Arterial - Other
57.2 234.8 1.91 6.38
Urban Minor Arterial 77 382.8 1.71 7.02
Urban Minor Collector 2.4 1.4 43.37 19.3
Urban Major Collector 24.8 124.6 1.27 5.02
Urban Local Road or Street 22 121 0.49 2

2017 Nevada Highway Safety Improvement Program
Page 29 of 50
Year 2015
Roadways Number of Fatalities (5-yr avg)
Number of Serious Injuries
(5-yr avg) Fatality Rate (per HMVMT)
(5-yr avg) Serious Injury Rate
(per HMVMT) (5-yr avg)
State Highway Agency 151 497
County Highway Agency 55 417
Town or Township Highway Agency
City of Municipal Highway Agency
50 256
State Park, Forest, or Reservation Agency
Local Park, Forest or Reservation Agency
Other State Agency
Other Local Agency
Private (Other than Railroad)
Railroad
State Toll Authority
Local Toll Authority
Other Public Instrumentality (e.g. Airport, School, University)
Indian Tribe Nation

2017 Nevada Highway Safety Improvement Program
Page 30 of 50
0102030405060708090
Fata
litie
s
Number of Fatalities by Functional Classification 5 Year Average
2008-2012 2009-2013 2010-2014 2011-2015 2012-2016

2017 Nevada Highway Safety Improvement Program
Page 31 of 50
050
100150200250300350400450500
Serio
us In
jurie
s
Number of Serious Injuries by Functional Classification 5 Year Average
2008-2012 2009-2013 2010-2014 2011-2015 2012-2016

2017 Nevada Highway Safety Improvement Program
Page 32 of 50
05
101520253035404550
Fata
lity
Rate
Fatality Rate (per HMVMT) by Functional Classification 5 Year Average
2008-2012 2009-2013 2010-2014 2011-2015 2012-2016

2017 Nevada Highway Safety Improvement Program
Page 33 of 50
05
10152025303540
Serio
us In
jury
Rat
e
Serious Injury Rate (per HMVMT) by Functional Classification 5 Year Average
2008-2012 2009-2013 2010-2014 2011-2015 2012-2016

2017 Nevada Highway Safety Improvement Program
Page 34 of 50
0
20
40
60
80
100
120
140
160
State Highway Agency County Highway Agency City of Municipal Highway Agency
Fata
litie
s
Number of Fatalities by Roadway Ownership 5 Year Average
2008-2012 2009-2013 2010-2014 2011-2015 2012-2016

2017 Nevada Highway Safety Improvement Program
Page 35 of 50
Enter additional comments here to clarify your response for this question or add supporting information. We do not have FC2 in rural Are there any other aspects of the general highway safety trends on which the State would like to elaborate? Yes Provide additional discussion related to general highway safety trends.
A 4-year rolling average was used to create the values in Question #32 above because 2008 crash data did not have function class associated with it. This will be resolved in next year’s reports.
Safety Performance Targets Safety Performance Targets
Calendar Year 2018 Targets *
Number of Fatalities 333.0
Describe the basis for established target, including how it supports SHSP goals. Decrease the upward trend so that the 2011-2015 five-year moving average of 278
0
100
200
300
400
500
600
State Highway Agency County Highway Agency City of Municipal Highway Agency
Serio
us In
jurie
s
Number of Serious Injuries by Roadway Ownership
5 Year Average
2008-2012 2009-2013 2010-2014 2011-2015 2012-2016

2017 Nevada Highway Safety Improvement Program
Page 36 of 50
traffic fatalities is 333, which is less than the projected 334 fatalities by December 31, 2018.
Number of Serious Injuries 1883.0
Describe the basis for established target, including how it supports SHSP goals. Decrease the upward trend so that the 2011-2015 five-year moving average of 1211 serious injuries is 1,883, which is less than the projected 1,884 serious injuries by December 31, 2018.
Fatality Rate 1.250
Describe the basis for established target, including how it supports SHSP goals. Decrease the upward trend so that the 2011-2015 five-year moving average of 1.12 fatalities per 100M VMT is 1.25, which is less than the projected 1.26 fatality rate by December 31, 2018.
Serious Injury Rate 4.890
Describe the basis for established target, including how it supports SHSP goals. Decrease the 2011-2015 five-year moving average of 5.08 serious injuries per 100M VMT to 4.89 by December 31, 2018.
Total Number of Non-Motorized Fatalities and Serious Injuries 300.0
Describe the basis for established target, including how it supports SHSP goals. Decrease the upward trend so that the 2011-2015 five-year moving average of 261 non-motorized fatalities and serious injuries is 300, which is less than the projected 301 fatalities by December 31, 2018.
Enter additional comments here to clarify your response for this question or add supporting information. Describe efforts to coordinate with other stakeholders (e.g. MPOs, SHSO) to establish safety performance targets. There are ongoing efforts with the Locals to establish safety performance measures. This includes standing monthly coordination meetings with discussions on the available data, trends in the data, problems with the data and other relative matters at the time.
We have had one Safety Target Performance Measures workshop sponsored by FHWA in April 2017, which was well attended by both State DOT, DPS/OTS (SHSO) and Local MPO staff.
There is another general Performance Measures workshop being sponsored by FHWA in August 2017 and it also will be attended by the same group plus many others that did not attend the specific Safety workshop.

2017 Nevada Highway Safety Improvement Program
Page 37 of 50
Our office works closely with each of the Local entities to provide them whatever data they request. This includes but not limited to: raw crash data, located crash maps, summarized crash analysis, heat maps and crashes by jurisdictional boundaries.
The SHSO (DPS/OTS) and NDOT Traffic Safety Engineering office work extremely close to set and use the first three measures; number of fatal crashes, fatal rate and number of serious injuries.
My own opinion as the Chief Traffic Safety Engineer and after visiting many states through Peer to Peer exchanges, AASHTO meetings and the National SHSP scan tour, it is evident that we here in Nevada have a unique and close working relation with our SHSO.
This close collaboration improves our efforts on all levels of improving Traffic Safety as our message is not confused (we have the same message), our expenditures are not duplicated and hence we multiply our effectiveness.
Does the State want to report additional optional targets? No Enter additional comments here to clarify your response for this question or add supporting information.
Applicability of Special Rules Does the HRRR special rule apply to the State for this reporting period? No Enter additional comments here to clarify your response for this question or add supporting information. Provide the number of older driver and pedestrian fatalities and serious injuries for the past seven years.
PERFORMANCE MEASURES 2009 2010 2011 2012 2013 2014 2015
Number of Older Driver and Pedestrian Fatalities
36 60 55 58 56 58 30
Number of Older Driver and Pedestrian Serious Injuries
90 77 88 64 93 95 68

2017 Nevada Highway Safety Improvement Program
Page 38 of 50
Enter additional comments here to clarify your response for this question or add supporting information.
0
20
40
60
80
100
120
140
160
180
2009 2010 2011 2012 2013 2014 2015
# of
Fat
aliti
es a
nd S
erio
us In
jurie
s
Years
Number of Older Driver and Pedestrian Fatalities and Serious Injuries by Year.
Fatalities Serious Injuries

2017 Nevada Highway Safety Improvement Program
Page 39 of 50
Evaluation Program Effectiveness How does the State measure effectiveness of the HSIP? Change in fatalities and serious injuries Enter additional comments here to clarify your response for this question or add supporting information. Based on the measures of effectiveness selected previously, describe the results of the State's program level evaluations. NDOT measures the effectiveness of the HSIP by the measure of change in fatalities and serious injuries. Although the number of Fatalities and Serious Injuries have increased, from 2015 to 2016 Nevada saw a decrease in the Fatality and the Serious Injury Rates.
What other indicators of success does the State use to demonstrate effectiveness and success of the Highway Safety Improvement Program? # miles improved by HSIP More systemic programs # RSAs completed HSIP Obligations Enter additional comments here to clarify your response for this question or add supporting information. Are there any significant programmatic changes that have occurred since the last reporting period? No
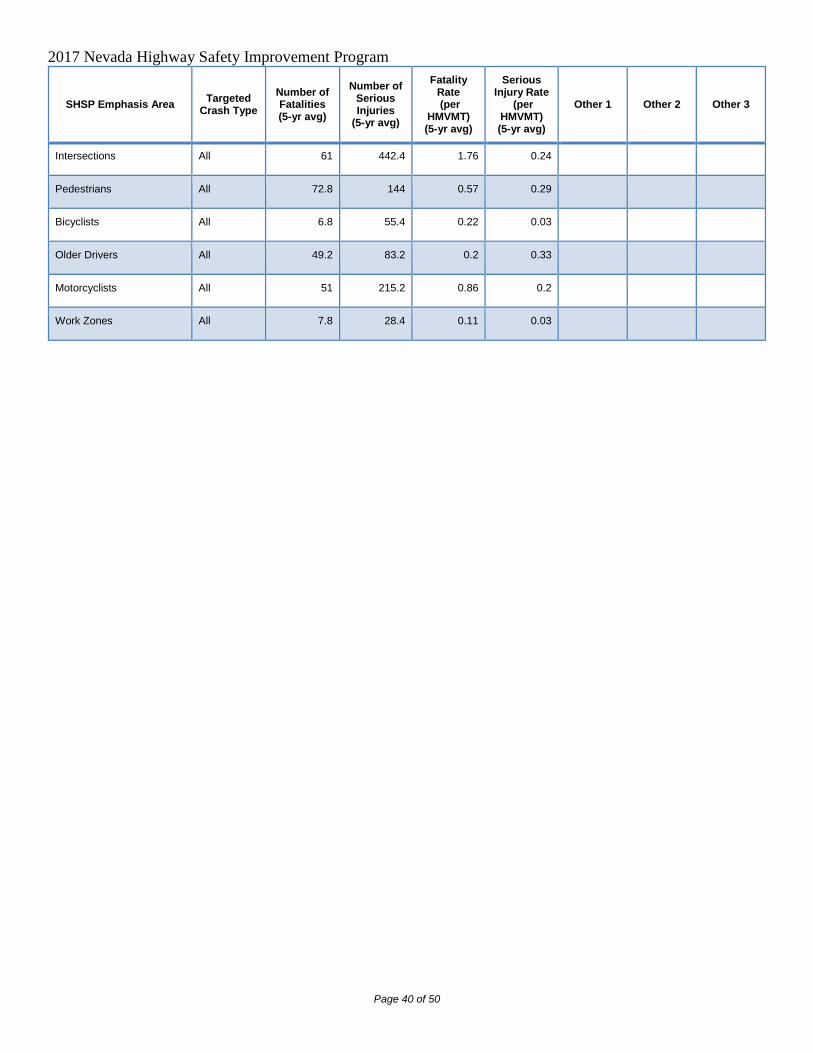
Effectiveness of Groupings or Similar Types of Improvements Present and describe trends in SHSP emphasis area performance measures.
Year 2016
SHSP Emphasis Area Targeted Crash Type
Number of Fatalities (5-yr avg)
Number of Serious Injuries
(5-yr avg)
Fatality Rate (per
HMVMT) (5-yr avg)
Serious Injury Rate
(per HMVMT) (5-yr avg)
Other 1 Other 2 Other 3
Lane Departure All 108 337.6 1.35 0.43
2017 Nevada Highway Safety Improvement Program
Page 40 of 50
SHSP Emphasis Area Targeted Crash Type
Number of Fatalities (5-yr avg)
Number of Serious Injuries
(5-yr avg)
Fatality Rate (per
HMVMT) (5-yr avg)
Serious Injury Rate
(per HMVMT) (5-yr avg)
Other 1 Other 2 Other 3
Intersections All 61 442.4 1.76 0.24
Pedestrians All 72.8 144 0.57 0.29
Bicyclists All 6.8 55.4 0.22 0.03
Older Drivers All 49.2 83.2 0.2 0.33
Motorcyclists All 51 215.2 0.86 0.2
Work Zones All 7.8 28.4 0.11 0.03

2017 Nevada Highway Safety Improvement Program
Page 41 of 50
0
20
40
60
80
100
120
140
160
LaneDeparture
Intersections Pedestrians Bicyclists Older Drivers Motorcyclists Work Zones
Fata
litie
s
Number of Fatalities 5 Year Average
2008-2012 2009-2013 2010-2014 2011-2015 2012-2016
0
100
200
300
400
500
600
LaneDeparture
Intersections Pedestrians Bicyclists Older Drivers Motorcyclists Work Zones
Serio
us In
jurie
s
Number of Serious Injuries 5 Year Average
2008-2012 2009-2013 2010-2014 2011-2015 2012-2016

2017 Nevada Highway Safety Improvement Program
Page 42 of 50
Enter additional comments here to clarify your response for this question or add supporting information. Has the State completed any countermeasure effectiveness evaluations during the reporting period?
0
0.5
1
1.5
2
2.5
3
LaneDeparture
Intersections Pedestrians Bicyclists Older Drivers Motorcyclists Work Zones
Fata
lity
Rate
Fatality Rate (per HMVMT) 5 Year Average
2008-2012 2009-2013 2010-2014 2011-2015 2012-2016
0
0.1
0.2
0.3
0.4
0.5
0.6
0.7
LaneDeparture
Intersections Pedestrians Bicyclists Older Drivers Motorcyclists Work Zones
Serio
us In
jury
Rat
e
Serious Injury Rate (per HMVMT) 5 Year Average
2008-2012 2009-2013 2010-2014 2011-2015 2012-2016
2017 Nevada Highway Safety Improvement Program
Page 43 of 50
No Enter additional comments here to clarify your response for this question or add supporting information.

2017 Nevada Highway Safety Improvement Program
Page 44 of 50
Project Effectiveness Provide the following information for previously implemented projects that the State evaluated this reporting period. Enter additional comments here to clarify your response for this question or add supporting information. Are there any other aspects of the overall HSIP effectiveness on which the State would like to elaborate? Yes Describe any other aspects of HSIP effectiveness on which the State would like to elaborate. Due to the increase in pedestrian fatalities in our state, the Transportation Board directed NDOT's Director to allocated additional funds for pedestrian safety improvements. As a result, $10 million of state gas tax funds have been allocated for pedestrian safety improvement projects within the state for the past 2 years. During this reporting timeframe we have been able to design and install the following Pedestrian Safety Projects which include new crosswalks, pedestrian activated rapid rectangular flashing beacons at the crosswalks, enhanced street lighting, pedestrian refuge medians and ADA compliant pedestrian ramps:
• SR 28 in Incline Village - completed spring 2016 • SR 443/ Sun Valley Blvd @ Gepford, Skaggs, 6th Ave - completed spring 2107 • SR 430/N Virginia St @ Talus Way and Moraine Way -completion August 2017 • SR 667/Kietzke Lane @ Roberts St, Taylor St, Apple St, Grove St-completion August 2017 • SR 159/Charleston Blvd from Hillside to Nellis Blvd- completion August 2017 • Boulder Highway at Sun Valley Drive - completion August 2017
Currently we are designing the following projects which include new crosswalks, activated rapid rectangular flashing beacons at the crosswalks, enhanced street lighting, pedestrian refuge medians and ADA compliant pedestrian ramps to be installed next year: • US 50 @ Pike Street in Dayton Nevada • Silver State Street in Carson City, Nevada • Lake Shore Blvd at Marla Bay, Nevada • Boulder Highway at the following 8 locations 1. VA Clinic - Midblock of College Drive / Horizon Drive in Henderson, NV 2. Foster Ave in Henderson, Nevada 3. Corn Street in Henderson, Nevada 4. Lowery Street in Henderson, Nevada 5. Near Hamilton Ave in Clark County, Nevada 6. Whitney Ave, Clark County, Nevada 7. 4350 Boulder Hwy in Clark County, Nevada 8. Oakey Blvd in Clark County, Nevada
A Complete Streets Project on Kietzke Lane (Reno, NV) from Mill Street to Galetti Road which includes sidewalk improvements and connectivity, buffered bike lanes, activated rapid rectangular flashing beacons at a crosswalk, enhanced street lighting, pedestrian refuge medians and ADA compliant pedestrian ramps. A Complete Streets Project on Craig Road (City of North Las Vegas) from Decatur to 5th Street which includes sidewalk improvements and connectivity, Bus/Bike lanes, Retro-Reflective Traffic Signal Backplates, LED corridor street lighting, and ADA compliant pedestrian ramps and push buttons.

2017 Nevada Highway Safety Improvement Program
Page 45 of 50
Compliance Assessment What date was the State’s current SHSP approved by the Governor or designated State representative? 10/11/2016 What are the years being covered by the current SHSP? From: 2016 To: 2020 When does the State anticipate completing it’s next SHSP update? 2020 Enter additional comments here to clarify your response for this question or add supporting information. Provide the current status (percent complete) of MIRE fundamental data elements collection efforts using the table below.
NON LOCAL PAVED ROADS - SEGMENT
NON LOCAL PAVED ROADS - INTERSECTION
NON LOCAL PAVED ROADS - RAMPS LOCAL PAVED ROADS UNPAVED ROADS
MIRE NAME (MIRE NO.) STATE NON-STATE STATE NON-STATE STATE NON-STATE STATE NON-STATE STATE NON-STATE
ROADWAY SEGMENT
Segment Identifier (12) 100 100 0 0 0 0
Route Number (8) 100 100
Route/Street Name (9) 100 100
Federal Aid/Route Type (21)
100 100
Rural/Urban Designation (20)
100 100 0 0
Surface Type (23) 100 100 0 0
Begin Point Segment Descriptor (10)
100 100 0 0 0 0
End Point Segment Descriptor (11)
100 100 0 0 0 0
Segment Length (13) 100 100
Direction of Inventory (18) 0 0
Functional Class (19) 100 100 0 0 0 0
Median Type (54) 100 100

2017 Nevada Highway Safety Improvement Program
Page 46 of 50
NON LOCAL PAVED ROADS - SEGMENT
NON LOCAL PAVED ROADS - INTERSECTION
NON LOCAL PAVED ROADS - RAMPS LOCAL PAVED ROADS UNPAVED ROADS
MIRE NAME (MIRE NO.) STATE NON-STATE STATE NON-STATE STATE NON-STATE STATE NON-STATE STATE NON-STATE
Access Control (22) 100 100
One/Two Way Operations (91)
100 100
Number of Through Lanes (31)
100 100 0 0
Average Annual Daily Traffic (79)
100 100 0 0
AADT Year (80) 100 100
Type of Governmental Ownership (4)
100 100 0 0 0 0
INTERSECTION
Unique Junction Identifier (120) 0 0
Location Identifier for Road 1 Crossing Point (122)
100 100
Location Identifier for Road 2 Crossing Point (123)
100 100
Intersection/Junction Geometry (126) 0 0
Intersection/Junction Traffic Control (131) 100 100
AADT for Each Intersecting Road (79) 100 100
AADT Year (80) 100 100
Unique Approach Identifier (139) 0 0
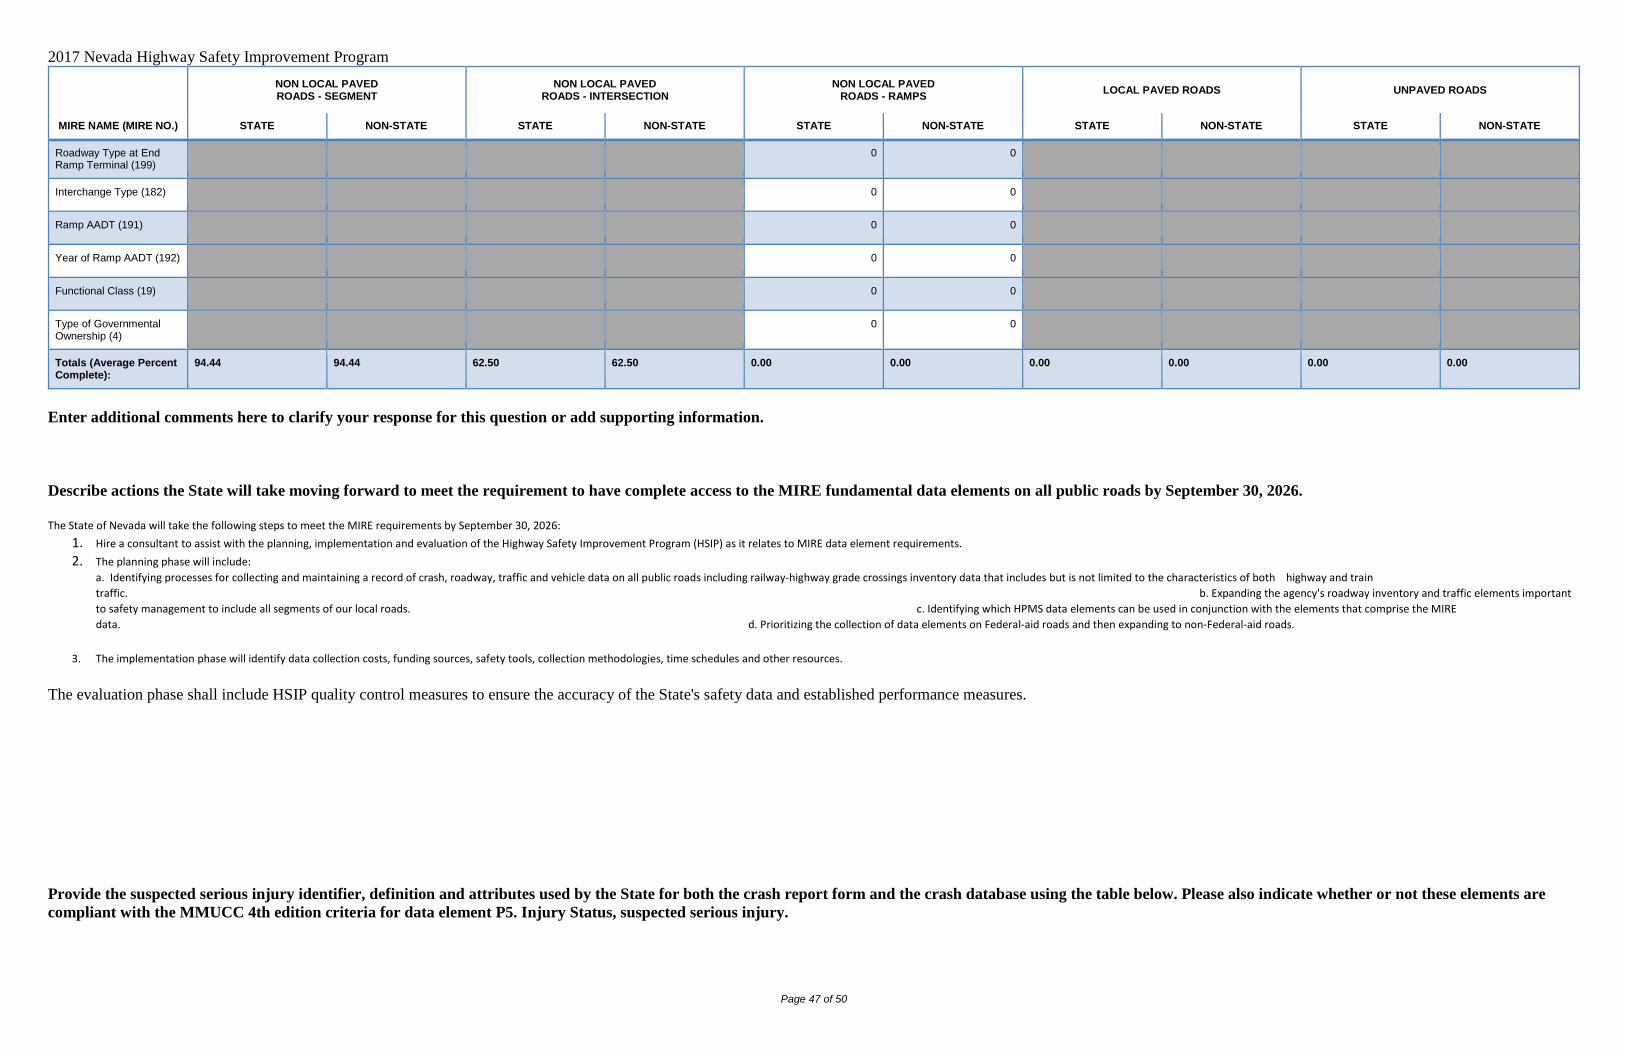
INTERCHANGE/RAMP
Unique Interchange Identifier (178) 0 0
Location Identifier for Roadway at Beginning of Ramp Terminal (197)
0 0
Location Identifier for Roadway at Ending Ramp Terminal (201)
0 0
Ramp Length (187) 0 0
Roadway Type at Beginning of Ramp Terminal (195)
0 0
2017 Nevada Highway Safety Improvement Program
Page 47 of 50
NON LOCAL PAVED ROADS - SEGMENT
NON LOCAL PAVED ROADS - INTERSECTION
NON LOCAL PAVED ROADS - RAMPS LOCAL PAVED ROADS UNPAVED ROADS
MIRE NAME (MIRE NO.) STATE NON-STATE STATE NON-STATE STATE NON-STATE STATE NON-STATE STATE NON-STATE
Roadway Type at End Ramp Terminal (199) 0 0
Interchange Type (182) 0 0
Ramp AADT (191) 0 0
Year of Ramp AADT (192) 0 0
Functional Class (19) 0 0
Type of Governmental Ownership (4) 0 0
Totals (Average Percent Complete):
94.44 94.44 62.50 62.50 0.00 0.00 0.00 0.00 0.00 0.00
Enter additional comments here to clarify your response for this question or add supporting information. Describe actions the State will take moving forward to meet the requirement to have complete access to the MIRE fundamental data elements on all public roads by September 30, 2026. The State of Nevada will take the following steps to meet the MIRE requirements by September 30, 2026:
1. Hire a consultant to assist with the planning, implementation and evaluation of the Highway Safety Improvement Program (HSIP) as it relates to MIRE data element requirements. 2. The planning phase will include:
a. Identifying processes for collecting and maintaining a record of crash, roadway, traffic and vehicle data on all public roads including railway-highway grade crossings inventory data that includes but is not limited to the characteristics of both highway and train traffic. b. Expanding the agency's roadway inventory and traffic elements important to safety management to include all segments of our local roads. c. Identifying which HPMS data elements can be used in conjunction with the elements that comprise the MIRE data. d. Prioritizing the collection of data elements on Federal-aid roads and then expanding to non-Federal-aid roads.
3. The implementation phase will identify data collection costs, funding sources, safety tools, collection methodologies, time schedules and other resources.
The evaluation phase shall include HSIP quality control measures to ensure the accuracy of the State's safety data and established performance measures.
Provide the suspected serious injury identifier, definition and attributes used by the State for both the crash report form and the crash database using the table below. Please also indicate whether or not these elements are compliant with the MMUCC 4th edition criteria for data element P5. Injury Status, suspected serious injury.

2017 Nevada Highway Safety Improvement Program
Page 48 of 50
CRITERIA SUSPECTED SERIOUS INJURY IDENTIFIER(NAME) MMUCC 4TH EDITION COMPLIANT * SUSPECTED SERIOUS INJURY
DEFINITION MMUCC 4TH EDITION COMPLIANT * SUSPECTED SERIOUS INJURY ATTRIBUTES(DESCRIPTORS) MMUCC 4TH EDITION COMPLIANT *
Crash Report Form A - Suspected Serious Injury Yes N/A Yes N/A Yes
Crash Report Form Instruction Manual A - Suspected Serious Injury Yes Any injury visible, or diagnosed by a physician, that prevents the injured party
from walking, driving, or normally continuing the activities that he/she was capable of performing prior to the crash.
Yes Examples: Fractures of the spine, open or displaced fractures of the limbs, exposure
of underlying tissue, crush injuries, significant burns (2nd/ 3rd degree over10% of body, unconsciousness when taken from
the crash scene, paralysis
Yes
Crash Database A Yes N/A No N/A No
Crash Database Data Dictionary A Yes Crash database only stores the Code "A" and the corresponding description which
currently is incapacitating. Project is about to begin to update the table that houses the
code and description.
No Not stored in the crash database No
Please describe the actions the State is taking to become compliant by April 15, 2019. Nevada has already made some changes. The crash form code list for our form5 and the manual the officers use has been updated and distributed as of July 2017. Officers have also been told of the change verbally at two previous meetings. Our crash vendor has been tasked with updating the pick list description in the electronic crash software. We have a kickoff meeting with Enterprise IT Services, the state IT shop, to get a project underway in order to make the necessary changes, that will take a bit longer to do, estimated completion Spring 2018.
Enter additional comments here to clarify your response for this question or add supporting information. The crash data repository only stores the Injury Status Code. There is a corresponding look up table that stores both the code and description as indicated below and is the only place the description is mentioned. This table will be updated to reflect the new description. The data dictionary for the repository will never include the descriptors of the injury.
INJURED_STATUS_CODE -
Lookup value associated with the code table description
INJURED_STATUS_DESC -
Description of the associated code.
Did the State conduct an HSIP program assessment during the reporting period? Yes Describe the purpose and outcomes of the State’s HSIP program assessment.
In conjunction with our partners at FHWA we did conduct an HSIP assessment in 2016, which we do every year.
From the prior year’s assessment, we updated our HSIP procedural Manual in 2016.

2017 Nevada Highway Safety Improvement Program
Page 49 of 50
Optional Attachments Program Structure: Highway Safety Improvement Program Manual final-updated-8.7.17.docx HSIP Flow Chart3 .pdf Project Implementation: Safety Performance: Evaluation: Compliance Assessment:

2017 Nevada Highway Safety Improvement Program
Page 50 of 50
Glossary 5 year rolling average
means the average of five individuals, consecutive annual points of data (e.g. annual fatality rate).
Emphasis area means a highway safety priority in a State’s SHSP, identified through a data-driven, collaborative process.
Highway safety improvement project
means strategies, activities and projects on a public road that are consistent with a State strategic highway safety plan and corrects or improves a hazardous road location or feature or addresses a highway safety problem.
HMVMT means hundred million vehicle miles traveled.
Non-infrastructure projects
are projects that do not result in construction. Examples of non-infrastructure projects include road safety audits, transportation safety planning activities, improvements in the collection and analysis of data, education and outreach, and enforcement activities.
Older driver special rule
applies if traffic fatalities and serious injuries per capita for drivers and pedestrians over the age of 65 in a State increases during the most recent 2-year period for which data are available, as defined in the Older Driver and Pedestrian Special Rule Interim Guidance dated February 13, 2013.
Performance measure
means indicators that enable decision-makers and other stakeholders to monitor changes in system condition and performance against established visions, goals, and objectives.
Programmed funds mean those funds that have been programmed in the Statewide Transportation Improvement Program (STIP) to be expended on highway safety improvement projects.
Roadway Functional Classification
means the process by which streets and highways are grouped into classes, or systems, according to the character of service they are intended to provide.
Strategic Highway Safety Plan (SHSP)
means a comprehensive, multi-disciplinary plan, based on safety data developed by a State Department of Transportation in accordance with 23 U.S.C. 148.
Systematic refers to an approach where an agency deploys countermeasures at all locations across a system.
Systemic safety improvement
means an improvement that is widely implemented based on high risk roadway features that are correlated with specific severe crash types.
Transfer means, in accordance with provisions of 23 U.S.C. 126, a State may transfer from an apportionment under section 104(b) not to exceed 50 percent of the amount apportioned for the fiscal year to any other apportionment of the State under that section.