nevada's class-size reduction program -- program data and ... · 6th-12th 28.3 28.8 28.7 29...
TRANSCRIPT
BACKGROUND PAPER 01-2
NEVADA=S CLASS-SIZE REDUCTION PROGRAM:
PROGRAM DATA AND
SUMMARY OF EVALUATION REPORTS
Nevada Revised Statutes 388.700C388.730 APROGRAM TO REDUCE THE PUPIL-TEACHER RATIO@
H. PEPPER STURM, COMMITTEE POLICY ANALYST SENATE HUMAN RESOURCES COMMITTEE NEVADA LEGISLATIVE COUNSEL BUREAU
February 2001

i
Table Of Contents
Page I. Background and Program Information ....................................................................1
A. Pupil-Teacher Ratios.......................................................................................2 B. Effect Upon Pupil-To-Teacher Ratios in Other Grades..................................4 C. Program Costs.................................................................................................5 D. Classroom Configuration ................................................................................6
II. Summary of Previous Program Evaluations of Nevada’s Class-Size Reduction Program ................................................................................7
A. 1993 Evaluation Report ..................................................................................7 B. 1995 Evaluation Report ..................................................................................9 C. 1997 and 1998 Evaluation Reports ...............................................................12 D. 1999 Evaluation Report ................................................................................13 E. 2001 Evaluation Report ................................................................................14 F. 1995-1996 Nevada Class-Size Survey Results .............................................15 G. Elko Pilot Program Survey Information–2001 .............................................16
III. Additional Evaluation Data....................................................................................17
A. Special Education Referrals..........................................................................17 B. Grade Retention ............................................................................................18
IV. Summary of Major Findings – Elko County School District Class-Size Demonstration Project..........................................................................20
A. Summary of Evaluation Findings .................................................................20 B. Elko Pilot Program Survey Information – 2001 ...........................................22
V. Selected References to Materials Cited .................................................................24

Page 1
NEVADA’S CLASS-SIZE REDUCTION PROGRAM
PREPARED BY PEPPER STURM, POLICY ANALYST
SENATE COMMITTEE ON HUMAN RESOURCES and Facilities
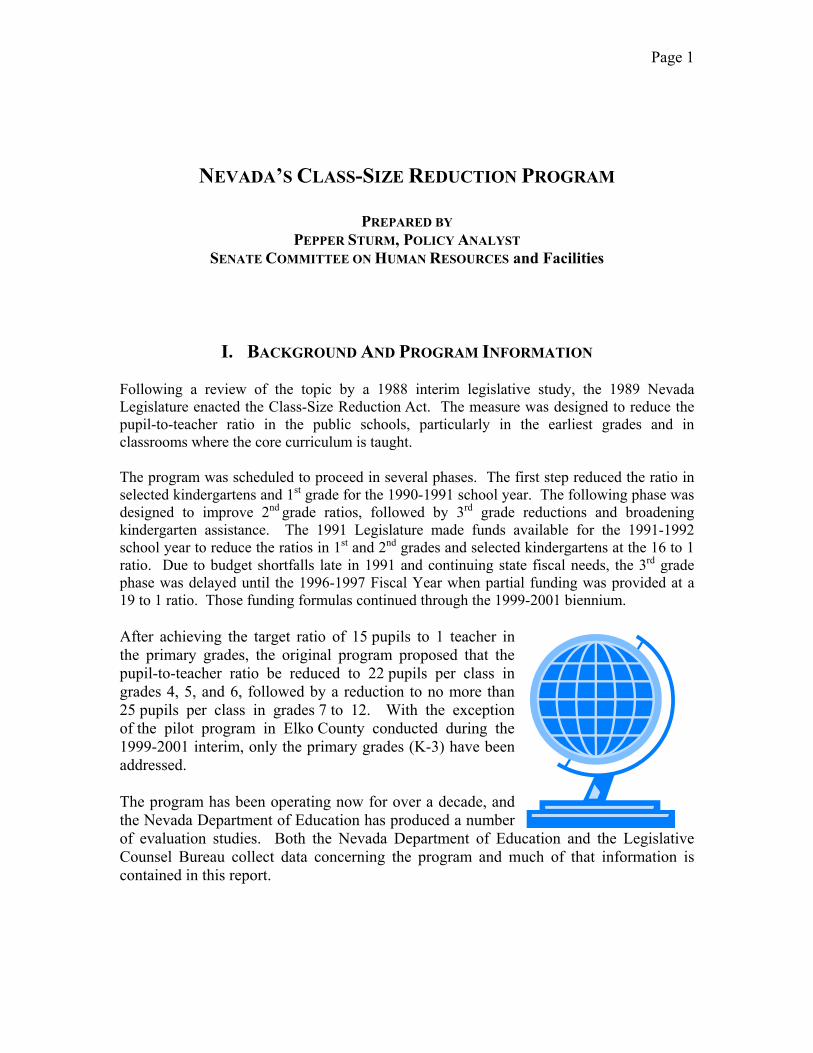
I. BACKGROUND AND PROGRAM INFORMATION Following a review of the topic by a 1988 interim legislative study, the 1989 Nevada Legislature enacted the Class-Size Reduction Act. The measure was designed to reduce the pupil-to-teacher ratio in the public schools, particularly in the earliest grades and in classrooms where the core curriculum is taught. The program was scheduled to proceed in several phases. The first step reduced the ratio in selected kindergartens and 1st grade for the 1990-1991 school year. The following phase was designed to improve 2nd grade ratios, followed by 3rd grade reductions and broadening kindergarten assistance. The 1991 Legislature made funds available for the 1991-1992 school year to reduce the ratios in 1st and 2nd grades and selected kindergartens at the 16 to 1 ratio. Due to budget shortfalls late in 1991 and continuing state fiscal needs, the 3rd grade phase was delayed until the 1996-1997 Fiscal Year when partial funding was provided at a 19 to 1 ratio. Those funding formulas continued through the 1999-2001 biennium. After achieving the target ratio of 15 pupils to 1 teacher in the primary grades, the original program proposed that the pupil-to-teacher ratio be reduced to 22 pupils per class in grades 4, 5, and 6, followed by a reduction to no more than 25 pupils per class in grades 7 to 12. With the exception of the pilot program in Elko County conducted during the 1999-2001 interim, only the primary grades (K-3) have been addressed. The program has been operating now for over a decade, and the Nevada Department of Education has produced a number of evaluation studies. Both the Nevada Department of Education and the Legislative Counsel Bureau collect data concerning the program and much of that information is contained in this report.
Page 2
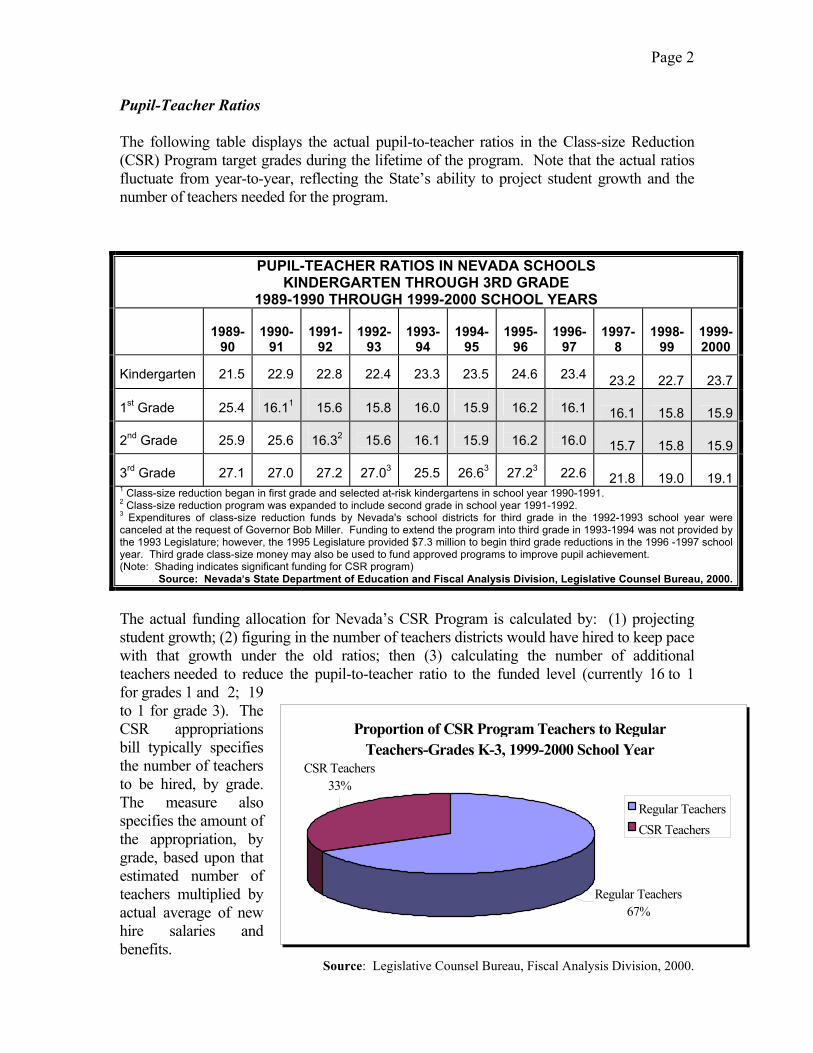
Pupil-Teacher Ratios The following table displays the actual pupil-to-teacher ratios in the Class-size Reduction (CSR) Program target grades during the lifetime of the program. Note that the actual ratios fluctuate from year-to-year, reflecting the State’s ability to project student growth and the number of teachers needed for the program.
The actual funding allocation for Nevada’s CSR Program is calculated by: (1) projecting student growth; (2) figuring in the number of teachers districts would have hired to keep pace with that growth under the old ratios; then (3) calculating the number of additional teachers needed to reduce the pupil-to-teacher ratio to the funded level (currently 16 to 1 for grades 1 and 2; 19 to 1 for grade 3). The CSR appropriations bill typically specifies the number of teachers to be hired, by grade. The measure also specifies the amount of the appropriation, by grade, based upon that estimated number of teachers multiplied by actual average of new hire salaries and benefits.
Source: Legislative Counsel Bureau, Fiscal Analysis Division, 2000.
PUPIL-TEACHER RATIOS IN NEVADA SCHOOLS KINDERGARTEN THROUGH 3RD GRADE
1989-1990 THROUGH 1999-2000 SCHOOL YEARS
1989-
90
1990-
91
1991-
92
1992-
93
1993-
94
1994-
95
1995-
96
1996-
97
1997-
8
1998-
99 1999-2000
Kindergarten
21.5
22.9
22.8
22.4
23.3
23.5
24.6
23.4 23.2 22.7 23.7
1st Grade
25.4
16.11
15.6
15.8
16.0
15.9
16.2
16.1 16.1 15.8 15.9
2nd Grade
25.9
25.6
16.32
15.6
16.1
15.9
16.2
16.0 15.7 15.8 15.9
3rd Grade
27.1
27.0
27.2
27.03
25.5
26.63
27.23
22.6 21.8 19.0 19.1
1 Class-size reduction began in first grade and selected at-risk kindergartens in school year 1990-1991. 2 Class-size reduction program was expanded to include second grade in school year 1991-1992. 3 Expenditures of class-size reduction funds by Nevada's school districts for third grade in the 1992-1993 school year were canceled at the request of Governor Bob Miller. Funding to extend the program into third grade in 1993-1994 was not provided by the 1993 Legislature; however, the 1995 Legislature provided $7.3 million to begin third grade reductions in the 1996 -1997 school year. Third grade class-size money may also be used to fund approved programs to improve pupil achievement. (Note: Shading indicates significant funding for CSR program)
Source: Nevada=s State Department of Education and Fiscal Analysis Division, Legislative Counsel Bureau, 2000.
Proportion of CSR Program Teachers to Regular Teachers-Grades K-3, 1999-2000 School Year
Regular Teachers67%
CSR Teachers33%
Regular TeachersCSR Teachers

Page 3
The next chart provides information, by district, concerning the class-size target grades by school district.
PUPIL-TEACHER RATIOS FOR SCHOOL YEAR 1999-2000 BY GRADE FOR NEVADA AND SCHOOL DISTRICTS
School District Kindergarten First Second Third Carson City 25.1 16.0 15.2 19.7 Churchill 20.1 16.4 13.5 20.0 Clark 24.7 16.0 16.0 19.4 Douglas 23.7 16.0 15.8 18.7 Elko * 17.2 17.1 17.5 19.3 Esmeralda 4.5 15.0 10.0 15.0 Eureka 6.3 11.3 15.0 11.5 Humboldt 21.9 13.1 15.4 16.7 Lander 20.9 13.7 12.7 19.9 Lincoln 13.5 10.2 12.0 13.0 Lyon 20.4 15.4 15.4 18.6 Mineral 18.7 19.3 11.8 16.4 Nye 17.7 15.7 17.0 20.0 Pershing 12.1 9.9 16.2 18.8 Storey 11.7 12.0 18.0 13.0 Washoe 23.2 16.4 16.5 18.7 White Pine 17.7 17.7 13.4 18.1
STATE 23.7 16.0 16.0 19.2 Note: Elko’s Demonstration Program allows the district to establish ratios of 22:1 in grades 1 through 6.
Source: Legislative Counsel Bureau, Fiscal Analysis Division, 2000.
In the current fiscal year, Nevada will employ 1,826 CSR teachers. The growth in the numbers of these teachers reflected on the chart below is a function of student growth in existing CSR grades, plus the addition of other grades as the program was phased in.
Source: Nevada Department of Education, 2000
Number of Class-Size Reduction Program Teachers
0
150
300
450
600
750
1990
-91
1991
-92
1992
-93
1993
-94
1994
-95
1995
-96
1996
-97
1997
-98
1998
-99
1999
-00
Tota
l Num
ber
Kndrgrtn First Second Third
Page 4
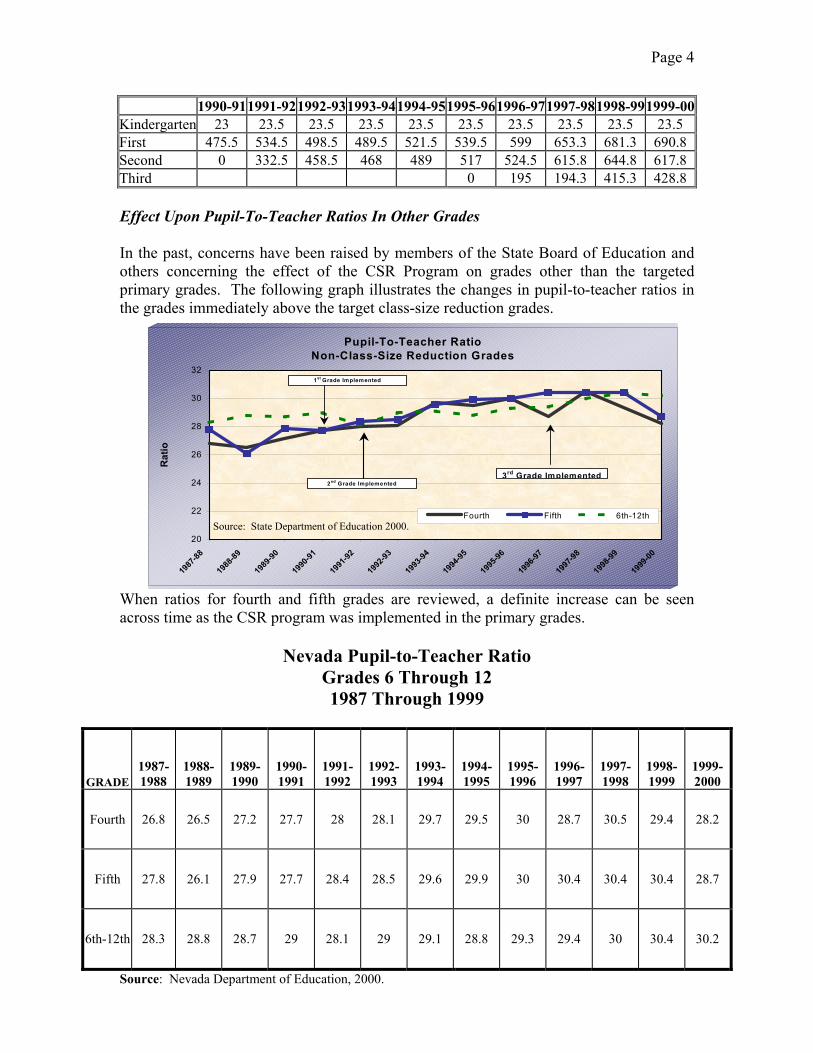
1990-911991-92 1992-931993-941994-951995-961996-971997-98 1998-991999-00Kindergarten 23 23.5 23.5 23.5 23.5 23.5 23.5 23.5 23.5 23.5 First 475.5 534.5 498.5 489.5 521.5 539.5 599 653.3 681.3 690.8 Second 0 332.5 458.5 468 489 517 524.5 615.8 644.8 617.8 Third 0 195 194.3 415.3 428.8 Effect Upon Pupil-To-Teacher Ratios In Other Grades In the past, concerns have been raised by members of the State Board of Education and others concerning the effect of the CSR Program on grades other than the targeted primary grades. The following graph illustrates the changes in pupil-to-teacher ratios in the grades immediately above the target class-size reduction grades.
When ratios for fourth and fifth grades are reviewed, a definite increase can be seen across time as the CSR program was implemented in the primary grades.
Nevada Pupil-to-Teacher Ratio Grades 6 Through 12 1987 Through 1999
GRADE 1987-1988
1988-1989
1989- 1990
1990- 1991
1991- 1992
1992- 1993
1993-1994
1994- 1995
1995- 1996
1996-1997
1997- 1998
1998- 1999
1999-2000
Fourth 26.8 26.5 27.2 27.7 28 28.1 29.7 29.5 30 28.7 30.5 29.4 28.2
Fifth 27.8 26.1 27.9 27.7 28.4 28.5 29.6 29.9 30 30.4 30.4 30.4 28.7
6th-12th 28.3 28.8 28.7 29 28.1 29 29.1 28.8 29.3 29.4 30 30.4 30.2
Source: Nevada Department of Education, 2000.
Pupil-To-Teacher RatioNon-Class-Size Reduction Grades
20
22
24
26
28
30
32
1987
-88
1988
-89
1989
-90
1990
-91
1991
-92
1992
-93
1993
-94
1994
-95
1995
-96
1996
-97
1997
-98
1998
-99
1999
-00
Rat
io
Fourth Fifth 6th-12th
1st Grade Implemented
2nd Grade Implemented3rd Grade Implemented
Source: State Department of Education 2000.
Page 5
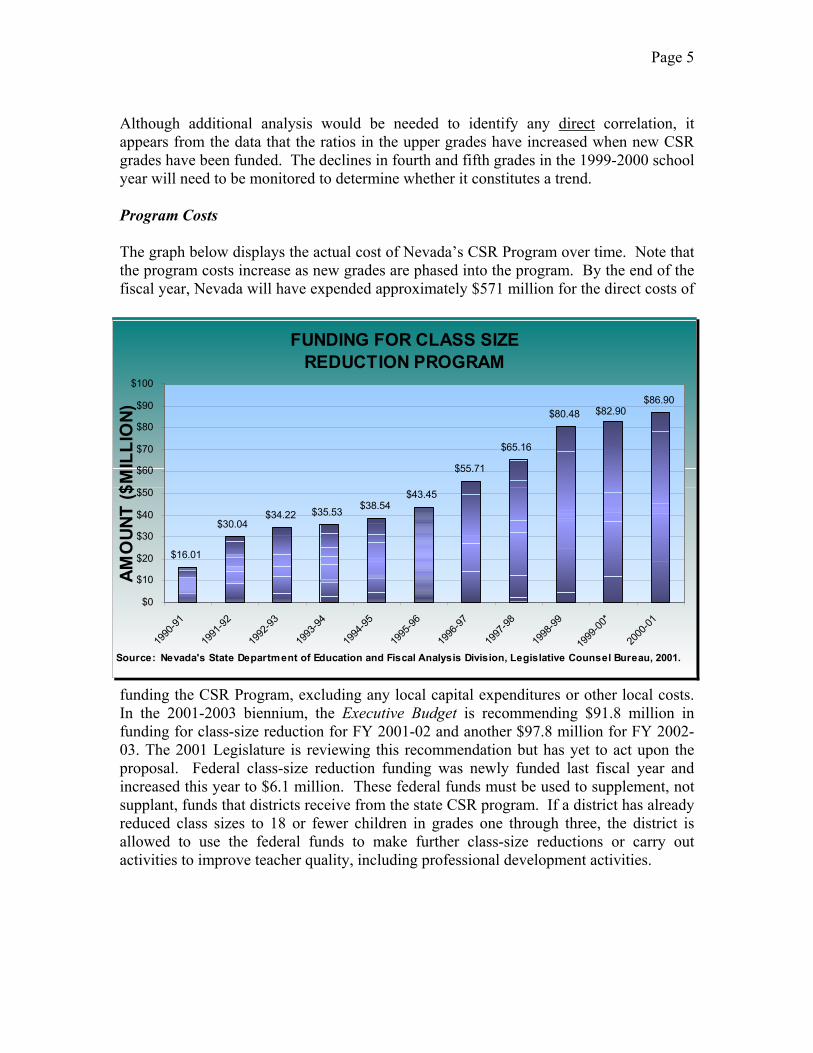
Although additional analysis would be needed to identify any direct correlation, it appears from the data that the ratios in the upper grades have increased when new CSR grades have been funded. The declines in fourth and fifth grades in the 1999-2000 school year will need to be monitored to determine whether it constitutes a trend. Program Costs The graph below displays the actual cost of Nevada’s CSR Program over time. Note that the program costs increase as new grades are phased into the program. By the end of the fiscal year, Nevada will have expended approximately $571 million for the direct costs of
funding the CSR Program, excluding any local capital expenditures or other local costs. In the 2001-2003 biennium, the Executive Budget is recommending $91.8 million in funding for class-size reduction for FY 2001-02 and another $97.8 million for FY 2002-03. The 2001 Legislature is reviewing this recommendation but has yet to act upon the proposal. Federal class-size reduction funding was newly funded last fiscal year and increased this year to $6.1 million. These federal funds must be used to supplement, not supplant, funds that districts receive from the state CSR program. If a district has already reduced class sizes to 18 or fewer children in grades one through three, the district is allowed to use the federal funds to make further class-size reductions or carry out activities to improve teacher quality, including professional development activities.
FUNDING FOR CLASS SIZE REDUCTION PROGRAM
$16.01
$30.04$34.22 $35.53 $38.54
$43.45
$55.71
$65.16
$80.48$86.90
$82.90
$0
$10
$20
$30
$40
$50
$60
$70
$80
$90
$100
1990
-91
1991
-92
1992
-93
1993
-94
1994
-95
1995
-96
1996
-97
1997
-98
1998
-99
1999
-00*
2000
-01
AMO
UNT
($M
ILLI
ON)
Source: Nevada's State Department of Education and Fiscal Analysis Division, Legislative Counsel Bureau, 2001.
Page 6
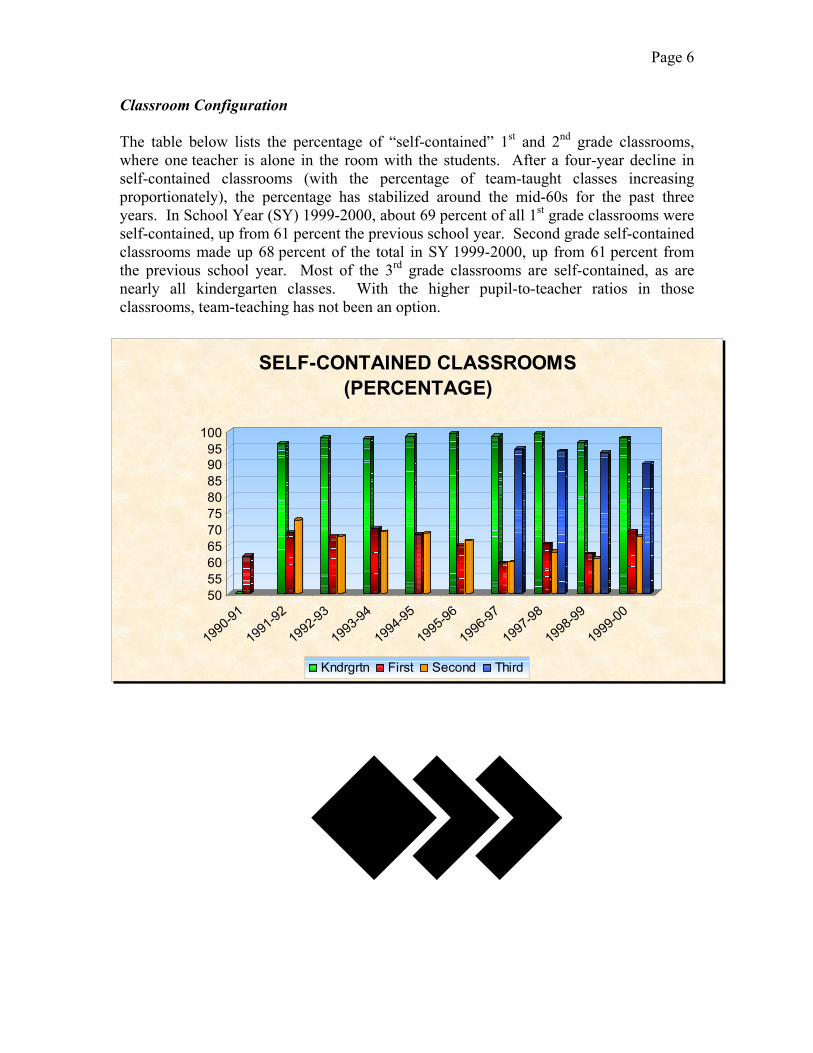
Classroom Configuration The table below lists the percentage of “self-contained” 1st and 2nd grade classrooms, where one teacher is alone in the room with the students. After a four-year decline in self-contained classrooms (with the percentage of team-taught classes increasing proportionately), the percentage has stabilized around the mid-60s for the past three years. In School Year (SY) 1999-2000, about 69 percent of all 1st grade classrooms were self-contained, up from 61 percent the previous school year. Second grade self-contained classrooms made up 68 percent of the total in SY 1999-2000, up from 61 percent from the previous school year. Most of the 3rd grade classrooms are self-contained, as are nearly all kindergarten classes. With the higher pupil-to-teacher ratios in those classrooms, team-teaching has not been an option.
50556065707580859095
100
1990-91
1991-92
1992-93
1993-94
1994-95
1995-96
1996-97
1997-98
1998-99
1999-00
SELF-CONTAINED CLASSROOMS(PERCENTAGE)
Kndrgrtn First Second Third
Page 7
II. SUMMARY OF PREVIOUS PROGRAM EVALUATIONS OF NEVADA’S CLASS-SIZE REDUCTION PROGRAM
In general, the reports evaluating Nevada’s Class-Size Reduction Program have contained mixed results. Generally reports have contained evaluation components, and certain reports have included survey data
Evaluation Reports There have been six evaluation studies of the State’s Class-Size Reduction Program since 1993. These evaluations have been conducted periodically by the State Department of Education. A summary of key findings follows: 1993 Evaluation Report In 1993, the evaluation report found that:
• Principals, teachers, and parents were very positive in their attitudes toward class-size reduction, and the dynamics created within the classroom contributed to an improved learning environment.
• School districts reported fewer special education referrals (a decrease of
5 percent) and less absenteeism by teachers (a decline of 7.1 percent).
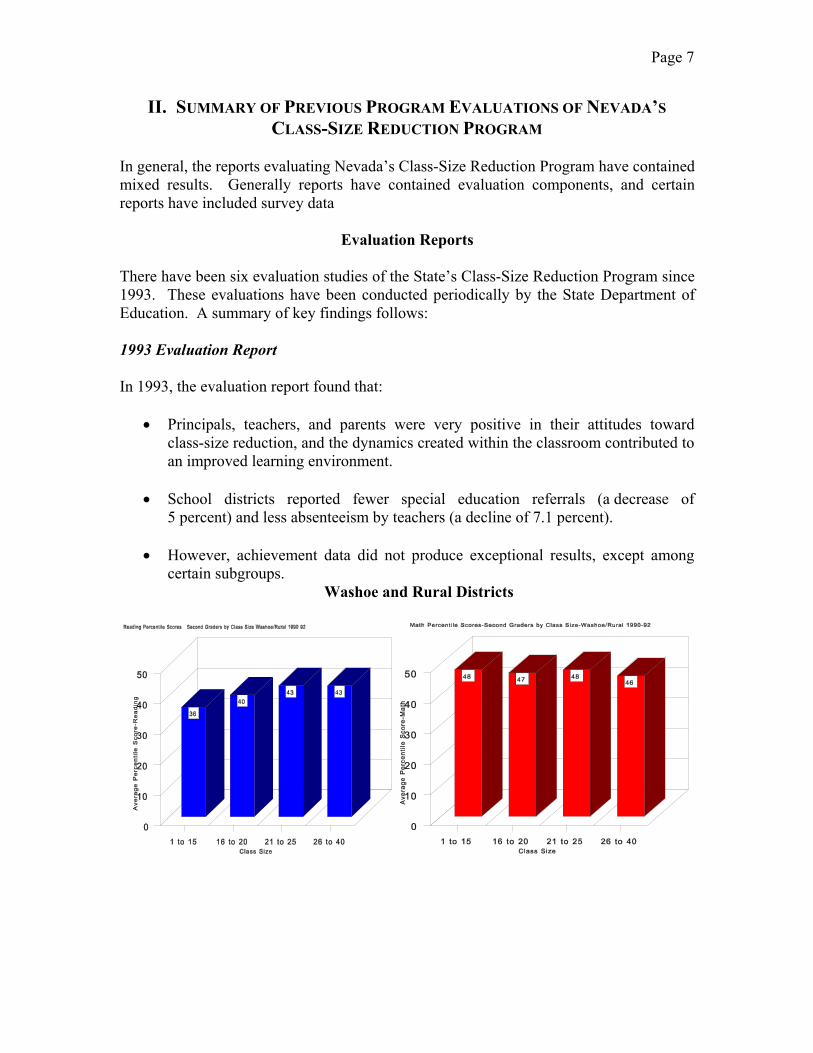
• However, achievement data did not produce exceptional results, except among certain subgroups.
Washoe and Rural Districts
Page 8
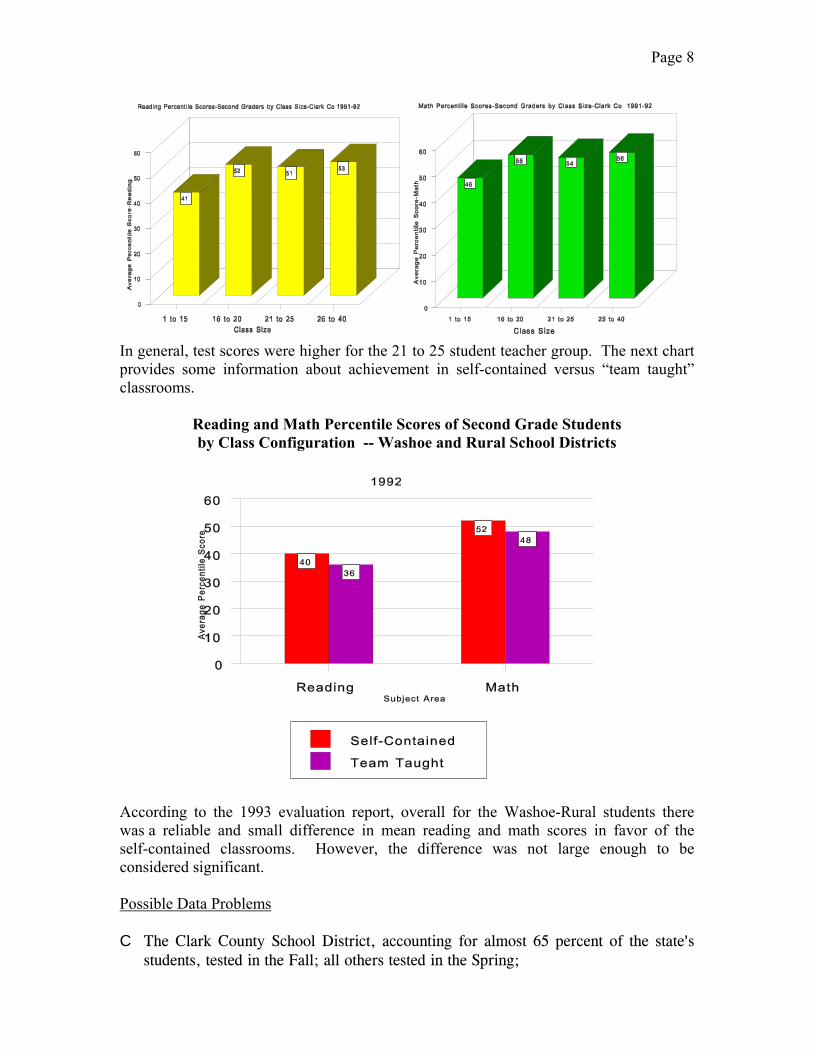
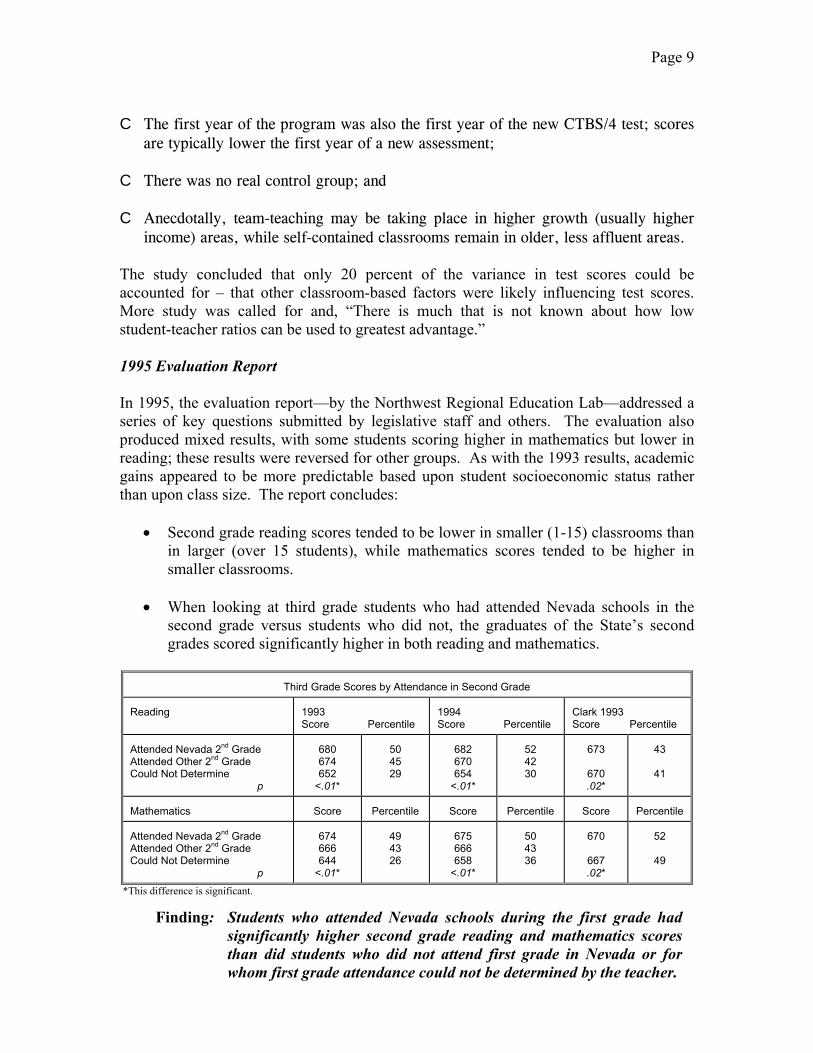
In general, test scores were higher for the 21 to 25 student teacher group. The next chart provides some information about achievement in self-contained versus “team taught” classrooms.
Reading and Math Percentile Scores of Second Grade Students by Class Configuration -- Washoe and Rural School Districts
According to the 1993 evaluation report, overall for the Washoe-Rural students there was a reliable and small difference in mean reading and math scores in favor of the self-contained classrooms. However, the difference was not large enough to be considered significant. Possible Data Problems C The Clark County School District, accounting for almost 65 percent of the state=s
students, tested in the Fall; all others tested in the Spring;
Page 9
C The first year of the program was also the first year of the new CTBS/4 test; scores
are typically lower the first year of a new assessment; C There was no real control group; and C Anecdotally, team-teaching may be taking place in higher growth (usually higher
income) areas, while self-contained classrooms remain in older, less affluent areas. The study concluded that only 20 percent of the variance in test scores could be accounted for – that other classroom-based factors were likely influencing test scores. More study was called for and, “There is much that is not known about how low student-teacher ratios can be used to greatest advantage.” 1995 Evaluation Report In 1995, the evaluation report—by the Northwest Regional Education Lab—addressed a series of key questions submitted by legislative staff and others. The evaluation also produced mixed results, with some students scoring higher in mathematics but lower in reading; these results were reversed for other groups. As with the 1993 results, academic gains appeared to be more predictable based upon student socioeconomic status rather than upon class size. The report concludes:
• Second grade reading scores tended to be lower in smaller (1-15) classrooms than in larger (over 15 students), while mathematics scores tended to be higher in smaller classrooms.
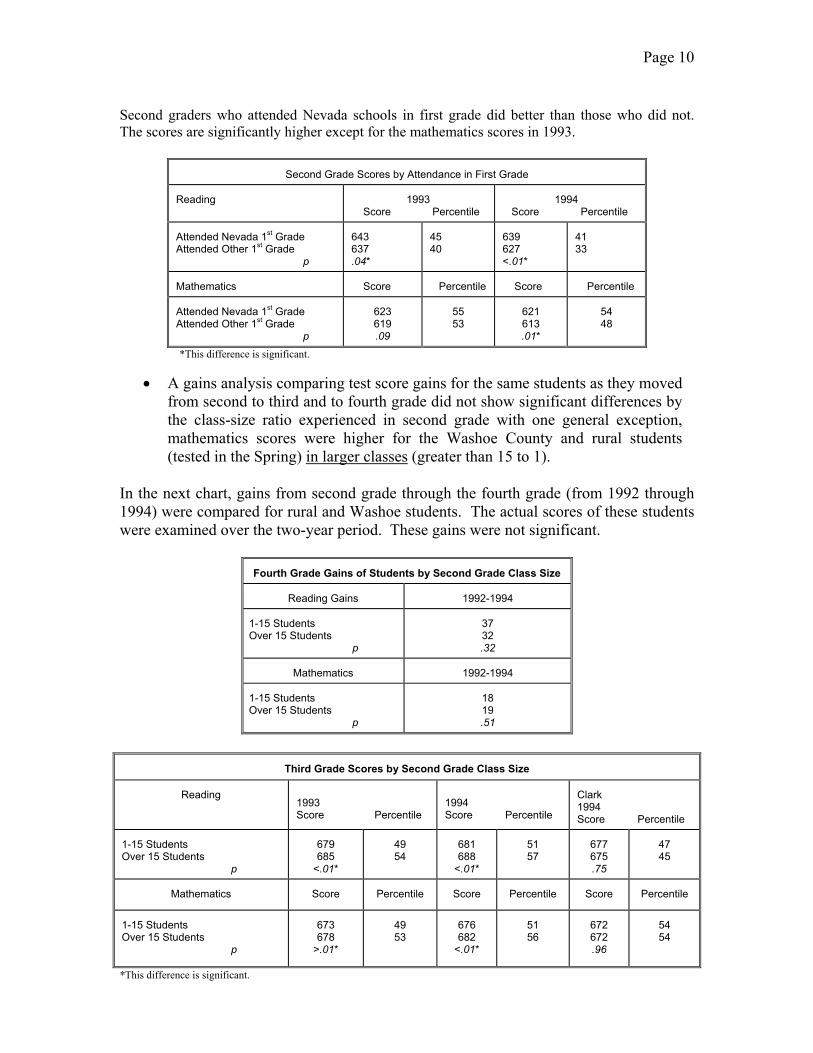
• When looking at third grade students who had attended Nevada schools in the
second grade versus students who did not, the graduates of the State’s second grades scored significantly higher in both reading and mathematics.
Third Grade Scores by Attendance in Second Grade Reading
1993 Score Percentile
1994 Score Percentile
Clark 1993 Score Percentile
Attended Nevada 2nd Grade Attended Other 2nd Grade Could Not Determine p
680 674 652
<.01*
50 45 29
682 670 654
<.01*
52 42 30
673
670 .02*
43
41
Mathematics
Score
Percentile
Score
Percentile
Score
Percentile
Attended Nevada 2nd Grade Attended Other 2nd Grade Could Not Determine p
674 666 644
<.01*
49 43 26
675 666 658
<.01*
50 43 36
670
667 .02*
52
49
*This difference is significant.
Finding: Students who attended Nevada schools during the first grade had significantly higher second grade reading and mathematics scores than did students who did not attend first grade in Nevada or for whom first grade attendance could not be determined by the teacher.
Page 10
Second graders who attended Nevada schools in first grade did better than those who did not. The scores are significantly higher except for the mathematics scores in 1993.
Second Grade Scores by Attendance in First Grade
Reading
1993 Score Percentile
1994 Score Percentile
Attended Nevada 1st Grade Attended Other 1st Grade p
643 637 .04*
45 40
639 627 <.01*
41 33
Mathematics
Score
Percentile
Score
Percentile
Attended Nevada 1st Grade Attended Other 1st Grade p
623 619 .09
55 53
621 613 .01*
54 48
*This difference is significant.
• A gains analysis comparing test score gains for the same students as they moved from second to third and to fourth grade did not show significant differences by the class-size ratio experienced in second grade with one general exception, mathematics scores were higher for the Washoe County and rural students (tested in the Spring) in larger classes (greater than 15 to 1).
In the next chart, gains from second grade through the fourth grade (from 1992 through 1994) were compared for rural and Washoe students. The actual scores of these students were examined over the two-year period. These gains were not significant.
Fourth Grade Gains of Students by Second Grade Class Size
Reading Gains
1992-1994
1-15 Students Over 15 Students p
37 32 .32
Mathematics
1992-1994
1-15 Students Over 15 Students p
18 19 .51
Third Grade Scores by Second Grade Class Size
Reading 1993 Score Percentile
1994 Score Percentile
Clark 1994 Score Percentile
1-15 Students Over 15 Students p
679 685
<.01*
49 54
681 688
<.01*
51 57
677 675 .75
47 45
Mathematics
Score
Percentile
Score
Percentile
Score
Percentile
1-15 Students Over 15 Students p
673 678
>.01*
49 53
676 682
<.01*
51 56
672 672 .96
54 54
*This difference is significant.
Page 11
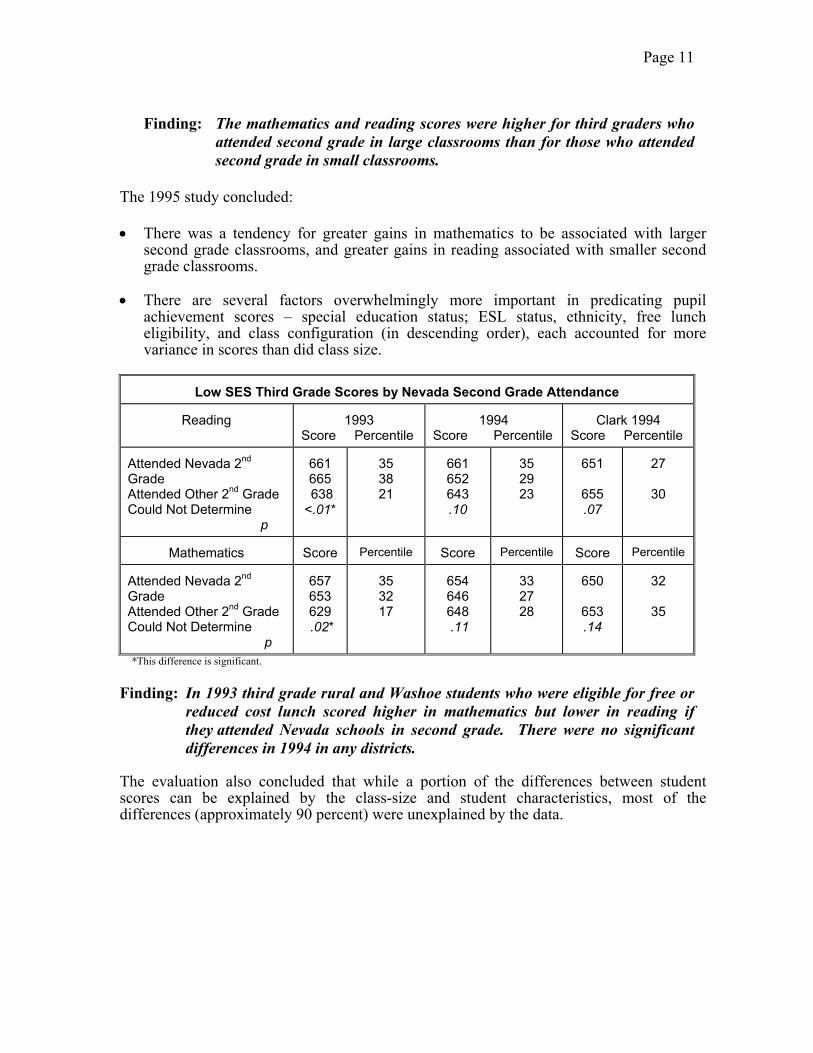
Finding: The mathematics and reading scores were higher for third graders who
attended second grade in large classrooms than for those who attended second grade in small classrooms.
The 1995 study concluded: • There was a tendency for greater gains in mathematics to be associated with larger
second grade classrooms, and greater gains in reading associated with smaller second grade classrooms.
• There are several factors overwhelmingly more important in predicating pupil
achievement scores – special education status; ESL status, ethnicity, free lunch eligibility, and class configuration (in descending order), each accounted for more variance in scores than did class size.
Low SES Third Grade Scores by Nevada Second Grade Attendance
Reading
1993 Score Percentile
1994
Score Percentile
Clark 1994
Score Percentile Attended Nevada 2nd Grade Attended Other 2nd Grade Could Not Determine p
661 665 638 <.01*
35 38 21
661 652 643 .10
35 29 23
651
655 .07
27
30
Mathematics
Score
Percentile
Score
Percentile
Score
Percentile
Attended Nevada 2nd Grade Attended Other 2nd Grade Could Not Determine p
657 653 629 .02*
35 32 17
654 646 648 .11
33 27 28
650
653 .14
32
35
*This difference is significant. Finding: In 1993 third grade rural and Washoe students who were eligible for free or
reduced cost lunch scored higher in mathematics but lower in reading if they attended Nevada schools in second grade. There were no significant differences in 1994 in any districts.
The evaluation also concluded that while a portion of the differences between student scores can be explained by the class-size and student characteristics, most of the differences (approximately 90 percent) were unexplained by the data.

Page 12
Role of Class Size in Student Scores
Reading
1993
1994
Percentage of Reading Scores Explained by Class Size
0.1
0.2
Percentage of Reading Scores Explained by Student Characteristics
10.5
10.5
Mathematics
Percentage of Mathematics Scores Explained by Class Size
3.4
0
Percentage of Mathematics Scores Explained by Student Characteristics
7.4
8.2
1997 and 1998 Evaluation Reports After 1995, the Nevada Department of Education began working on an evaluation model for the CSR Program that would not require additional costs or result in an undue reporting burden for schools and teachers. This new evaluation design was communicated to the Legislature in the spring of 1996. The key feature of this design was the sole use of existing data that is routinely collected as a part of the Proficiency Testing Program, which tests students at grades four and eight. In 1997 and 1998, the reviews were based solely on the examination of state-mandated tests, and the results were very similar for both years. Those studies concluded that:
• When mean scale scores and percentiles for reading, language, and math tests were examined by the attendance variable, it was found that higher scores were associated with having had two years of class-size reduction experience.
• However, the overall results were not borne out for all subgroups of students. For
example, there was no indication that the test scores of minority students or students in a low socioeconomic bracket had been affected by the class-size reduction experience. This finding is particularly disturbing since class-size reduction programs were originally designed to help at-risk students.
PERCENTILES BY CLASS-SIZE REDUCTION EXPERIENCE
(October 1997 Testing) Fourth Graders with: Reading Total Language Total Mathematics Total 2 Years of CSR Experience (n=14,513) 49 54 51
1 Year of CSR Experience Grade 2 (n=1,466)
49 54 52
1 Year of CSR Experience Grade 1 (n=277)
47 50 46
No CSR Experience (n=2,915) 48 50 48
Page 13
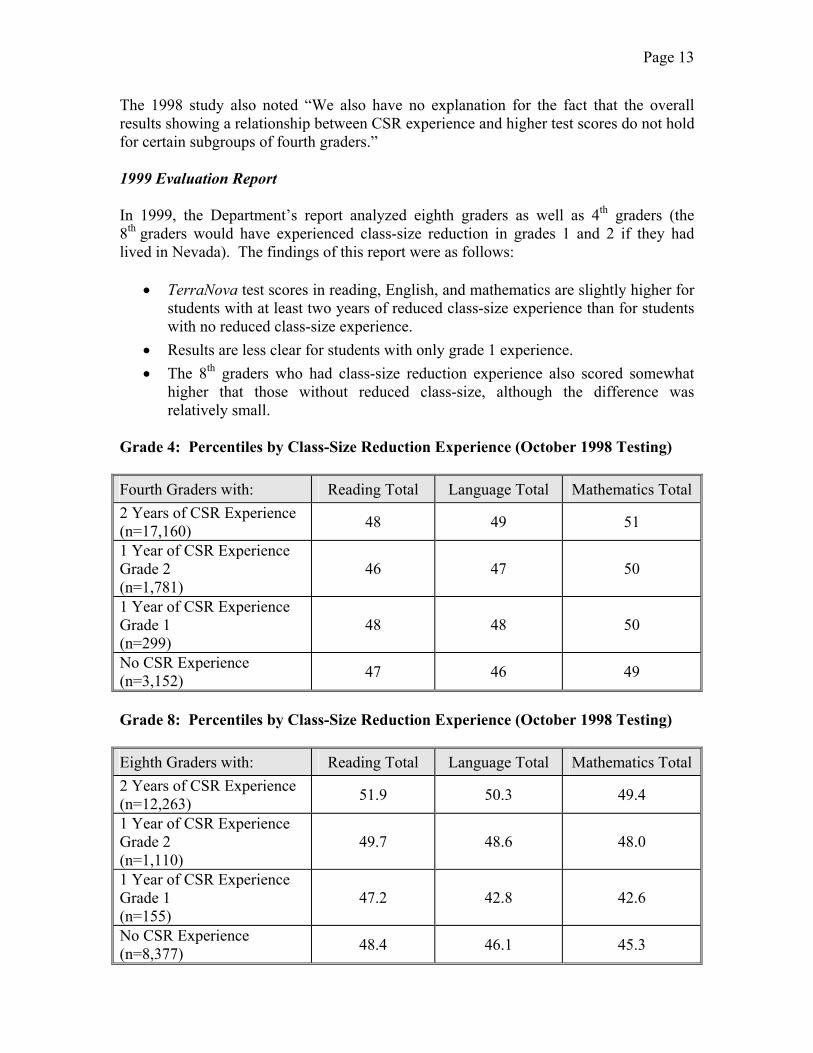
The 1998 study also noted “We also have no explanation for the fact that the overall results showing a relationship between CSR experience and higher test scores do not hold for certain subgroups of fourth graders.” 1999 Evaluation Report In 1999, the Department’s report analyzed eighth graders as well as 4th graders (the 8th graders would have experienced class-size reduction in grades 1 and 2 if they had lived in Nevada). The findings of this report were as follows:
• TerraNova test scores in reading, English, and mathematics are slightly higher for students with at least two years of reduced class-size experience than for students with no reduced class-size experience.
• Results are less clear for students with only grade 1 experience. • The 8th graders who had class-size reduction experience also scored somewhat
higher that those without reduced class-size, although the difference was relatively small.
Grade 4: Percentiles by Class-Size Reduction Experience (October 1998 Testing) Fourth Graders with: Reading Total Language Total Mathematics Total 2 Years of CSR Experience (n=17,160) 48 49 51
1 Year of CSR Experience Grade 2 (n=1,781)
46 47 50
1 Year of CSR Experience Grade 1 (n=299)
48 48 50
No CSR Experience (n=3,152) 47 46 49
Grade 8: Percentiles by Class-Size Reduction Experience (October 1998 Testing) Eighth Graders with: Reading Total Language Total Mathematics Total 2 Years of CSR Experience (n=12,263) 51.9 50.3 49.4
1 Year of CSR Experience Grade 2 (n=1,110)
49.7 48.6 48.0
1 Year of CSR Experience Grade 1 (n=155)
47.2 42.8 42.6
No CSR Experience (n=8,377) 48.4 46.1 45.3
Page 14
Note: For all three subjects, eighth graders who had experienced class-size reduction in both first and second grades had higher scores than those who had experienced no class-size reduction. Again, the evaluation found that the overall impact upon test scores of various categories of students was mixed. Certain subgroups did not seem to benefit: limited English-proficient students did not have higher test scores; students from low socioeconomic families did not show evidence of any academic benefit; there is no clear relationship between reduced class-size and test scores for Native-American or African American students in Nevada. Special education pupils and Asian, Hispanic, and White students did seem to benefit from the program, although the study noted that the difference was not large. The evaluation also took note of the range of test scores by subgroups of students – for example, white fourth grades percentile scores ranged from 49 to 55, while Hispanic students ranged from 34 to 45. The report concluded that a more comprehensive study was needed to determine the impact of CSR upon pupil achievement. 2001 Evaluation Report The most recent report, in draft form at present, used a pilot study approach and focused upon data solely from the Clark County School District for fourth grade students tested in fall of 1998. Several conclusions from this evaluation are worth noting. Classroom Configuration
• With regard to classroom configuration, there were no differences in student/family characteristic (i.e., low-socioeconomic status), with the exception of special education characteristic – special education students tended to be in self-contained classrooms.
• With regard to classroom configuration and test scores – the results showed no significant differences in test scores by whether the student was in a team-taught or self-contained classroom configuration, with the exception of students with Limited English Proficiency (LEP) – such students had higher test scores in they were in a self-contained classroom.
Teacher Characteristics
• Schools with high proportions of teachers with less than four years’ experience, and school with a low proportion of teachers who hold advanced degrees tend to have students with lower test scores.
• The percentage of LEP students was not significantly related to the percentage of teachers with bachelor’s degrees versus the percentage having earned advanced degrees.
• There is a significant relationship between teacher experience and test scores.
Page 15
The evaluation notes that establishing evidence that teacher experience and education can have a positive impact upon student achievement, especially in at-risk schools, supports the idea of providing incentives for highly qualified teachers to teach and mentor other teachers in low-performing schools.
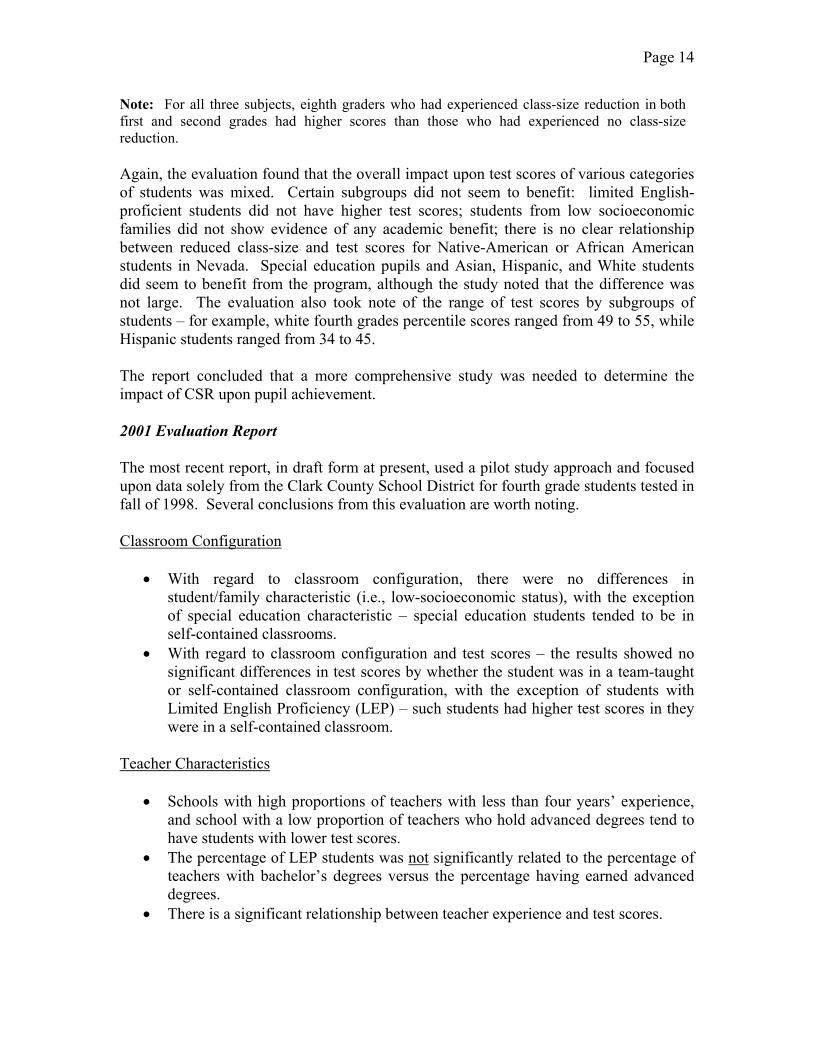
Survey Data Reports The Nevada Department of Education conducted two major surveys of key personnel and parents involved in the CSR Program. Of these, the survey administered during the 1995-1996 school year was the more complete. 1995-1996 Nevada Class-Size Survey Results The survey component of the Nevada Department of Education’s 1997 report contained some significant information. Among the findings from this segment of the report are the following:
• Class-size reduction continues to receive positive support statewide from principals, teachers, and parents.
• Most respondents feel that having a smaller class means that each child will
receive the individual attention needed to fully understand the skills that are being taught.
SURVEY RESPONSE CONCERNING PERCEIVED EFFECT OF NEVADA CLASS-SIZE REDUCTION PROGRAM ON TEACHING AND LEARNING
1995-1996
Percent Reporting Some or Great Improvement
Percent Reporting
No Change
Percent Reporting
a Decline Principals
74
16
3
Teachers
74
17
5
Parents
74
22
4
Source: 1995-1996 Class-Size Reduction Survey Results for Nevada, Statewide Results Prepared by the Clark County School District, 1996. Note: Responses listed do not include those who left these questions blank. Even though many respondents stated that team-teaching is preferable to 30 to 1 ratios, they believe it is not as beneficial as each teacher having a self-contained classroom of 15 to 1.
Page 16
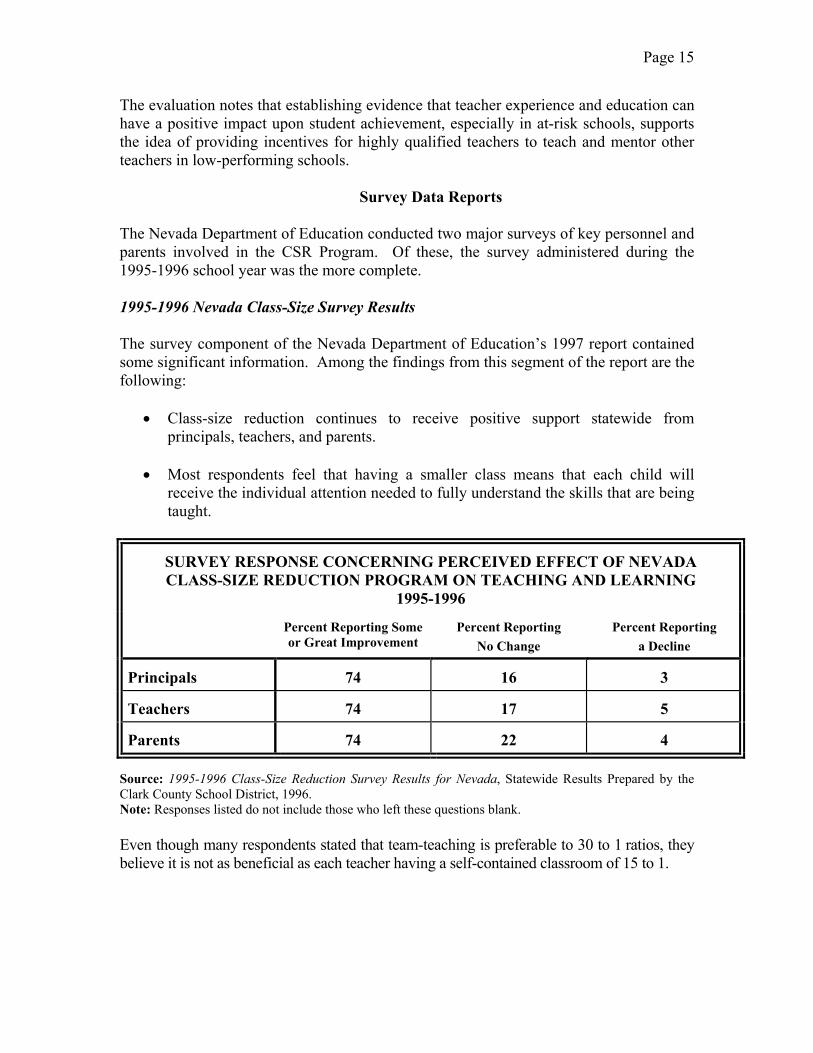
1995-1996 SURVEY RESPONSE: TOP TWO COMMENTS
CONCERNING NEVADA’S CLASS-SIZE REDUCTION PROGRAM
What Is Most Advantageous Aspect (Or What Effect on Child)?
What Aspect Interferes with Success (Or What Problems as it Affects Your Child)?
Principals
More one-on-one and small group instruction/interaction
C Lack of space/ classrooms C Team-teaching
Teachers
C More one on one and small group instruction C Team-teachers can share ideas and learn from each other
C Lack of space/ classrooms C Team-teaching
Parents
C Teacher can give child more individual attention C Students feel more confident and have higher self-esteem in a small class
C There are no problems C Team-taught classrooms overcrowded and noisy
Source: 1995-1996 Class-Size Reduction Survey Results for Nevada, Statewide Results Prepared by the Clark County School District, 1996. Elko Pilot Program Survey Information—2001 The Elko pilot program evaluation report includes detailed survey information from Elko parents with regard to the pilot program. Surveys included teacher interviews and surveys, principal surveys, and surveys and focus groups with parents. A summary of the survey information about the Elko Pilot Program is contained in Section IV of this report.
Page 17
III. ADDITIONAL EVALUATION DATA
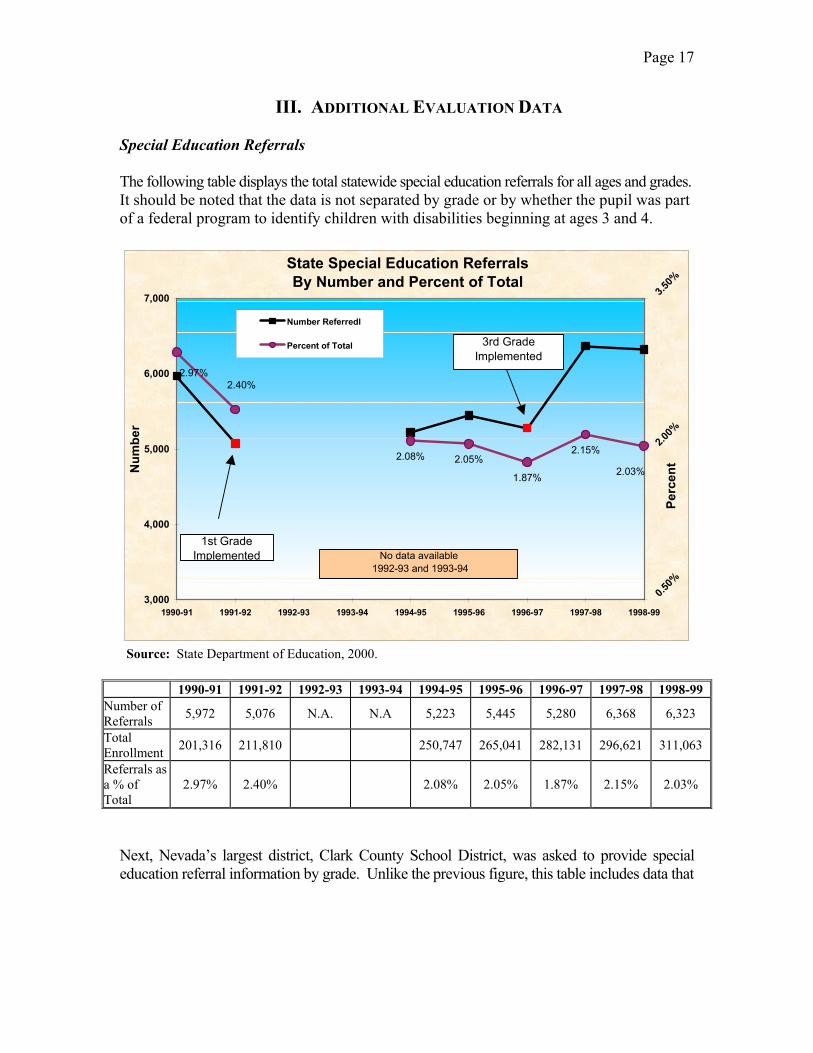
Special Education Referrals The following table displays the total statewide special education referrals for all ages and grades. It should be noted that the data is not separated by grade or by whether the pupil was part of a federal program to identify children with disabilities beginning at ages 3 and 4.
Source: State Department of Education, 2000.
1990-91 1991-92 1992-93 1993-94 1994-95 1995-96 1996-97 1997-98 1998-99 Number of Referrals 5,972 5,076 N.A. N.A 5,223 5,445 5,280 6,368 6,323
Total Enrollment 201,316 211,810 250,747 265,041 282,131 296,621 311,063
Referrals as a % of Total
2.97% 2.40% 2.08% 2.05% 1.87% 2.15% 2.03%
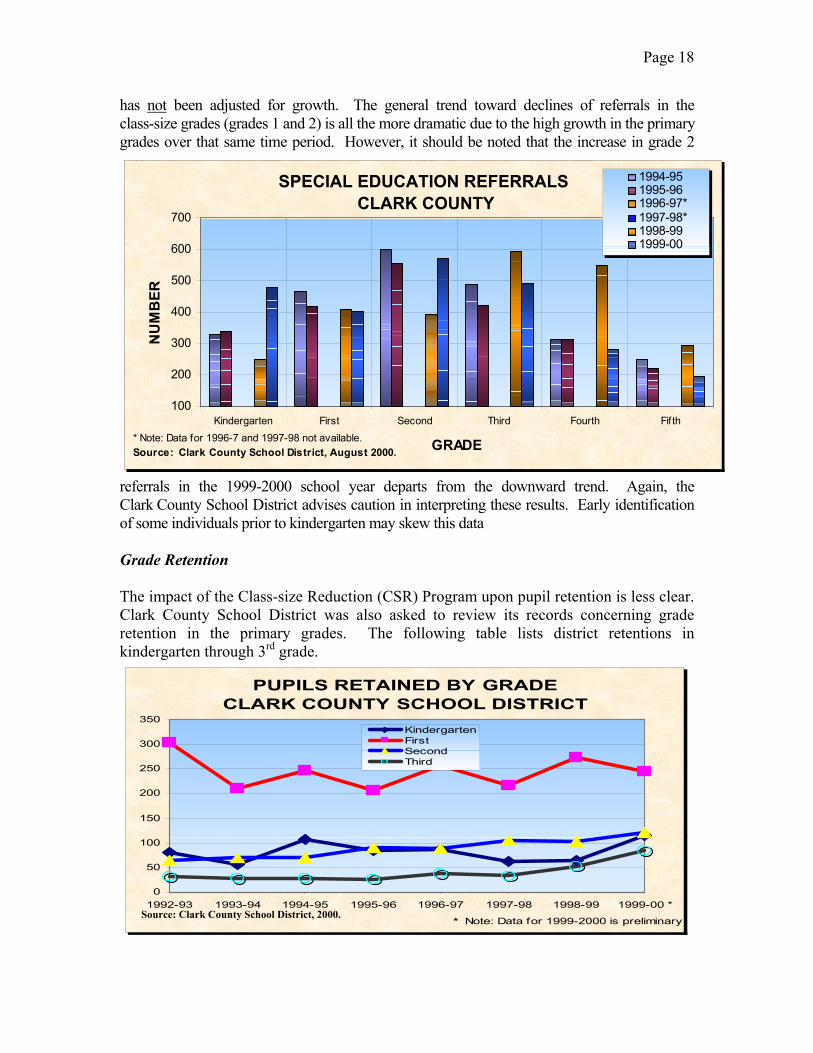
Next, Nevada’s largest district, Clark County School District, was asked to provide special education referral information by grade. Unlike the previous figure, this table includes data that
State Special Education Referrals By Number and Percent of Total
2.08% 2.05%
1.87%
2.15%
2.40%
2.03%
2.97%
3,000
4,000
5,000
6,000
7,000
1990-91 1991-92 1992-93 1993-94 1994-95 1995-96 1996-97 1997-98 1998-99
Num
ber
0.50%
2.00%
3.50%
Perc
ent
Number Referredl
Percent of Total
1st Grade Implemented
3rd Grade Implemented
No data available 1992-93 and 1993-94
Page 18
has not been adjusted for growth. The general trend toward declines of referrals in the class-size grades (grades 1 and 2) is all the more dramatic due to the high growth in the primary grades over that same time period. However, it should be noted that the increase in grade 2
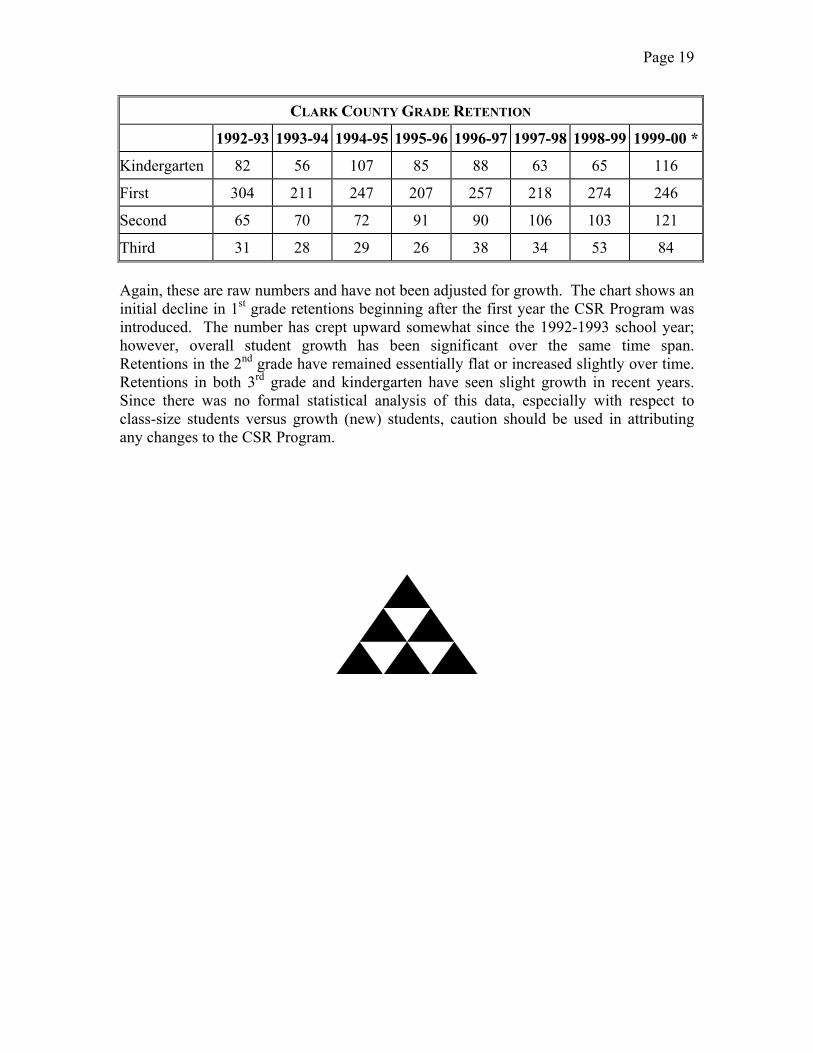
referrals in the 1999-2000 school year departs from the downward trend. Again, the Clark County School District advises caution in interpreting these results. Early identification of some individuals prior to kindergarten may skew this data Grade Retention The impact of the Class-size Reduction (CSR) Program upon pupil retention is less clear. Clark County School District was also asked to review its records concerning grade retention in the primary grades. The following table lists district retentions in kindergarten through 3rd grade.
SPECIAL EDUCATION REFERRALS CLARK COUNTY
100
200
300
400
500
600
700
Kindergarten First Second Third Fourth Fifth
GRADE
NU
MB
ER1994-951995-961996-97*1997-98*1998-991999-00
* Note: Data for 1996-7 and 1997-98 not available.Source: Clark County School District, August 2000.
PUPILS RETAINED BY GRADE CLARK COUNTY SCHOOL DISTRICT
0
50
100
150
200
250
300
350
1992-93 1993-94 1994-95 1995-96 1996-97 1997-98 1998-99 1999-00 *
* Note: Data for 1999-2000 is preliminary
KindergartenFirstSecondThird
Source: Clark County School District, 2000.
Page 19
CLARK COUNTY GRADE RETENTION
1992-93 1993-94 1994-95 1995-96 1996-97 1997-98 1998-99 1999-00 *
Kindergarten 82 56 107 85 88 63 65 116
First 304 211 247 207 257 218 274 246
Second 65 70 72 91 90 106 103 121
Third 31 28 29 26 38 34 53 84 Again, these are raw numbers and have not been adjusted for growth. The chart shows an initial decline in 1st grade retentions beginning after the first year the CSR Program was introduced. The number has crept upward somewhat since the 1992-1993 school year; however, overall student growth has been significant over the same time span. Retentions in the 2nd grade have remained essentially flat or increased slightly over time. Retentions in both 3rd grade and kindergarten have seen slight growth in recent years. Since there was no formal statistical analysis of this data, especially with respect to class-size students versus growth (new) students, caution should be used in attributing any changes to the CSR Program.
Page 20
IV. SUMMARY OF MAJOR FINDINGS – ELKO COUNTY SCHOOL DISTRICT
CLASS-SIZE DEMONSTRATION PROJECT
Assembly Bill 700 of the 1999 Legislative Session authorizes a demonstration project for the Elko County School District to reduce pupil-teacher ratios to 22 to 1 in grades K through 5 in an effort to eliminate team teaching. The Legislature also required that the Elko County School District evaluate the effectiveness of its demonstration project in improving pupil achievement and report its findings in an interim report to the Legislative Committee on Education on or before February 15, 2000, with a final report to the Legislature on or before February 15, 2001. In response, the Elko County School District in July 1999, requested that Great Basin College, the Nevada Department of Education, and the Legislative Bureau of Educational Accountability and Program Evaluation (Bureau) assist in the evaluation. A separate report, titled Report on the Elko County School District Class-Size Reduction Demonstration Project contains detailed information about the pilot. Summary of Evaluation Findings A summary of the report’s major evaluation findings include:
• Classroom observations found little difference in student classroom behavior between 16:1 classrooms versus 22:1 classrooms.
• TerraNova scores were consistently improved for grades 3-6 in classes with
reduced 22:1 size.
• Majority of parents experienced greater contact with teacher and more parental involvement.
• Teachers in grades 1-2 were more likely see no or positive effects from 22:1 class
size.
• Vast majority of teachers in grades 3-6 saw positive effects. • Most significant areas of positive effect are: more one-on-one instruction and
better discipline.
The report contains detailed tables of data with regard to student test scores, classroom observations, classroom behavior, survey data, interview data, and other information relating the pilot project. The charts of the following pages provide some indication of the information contained within the report:
Page 21
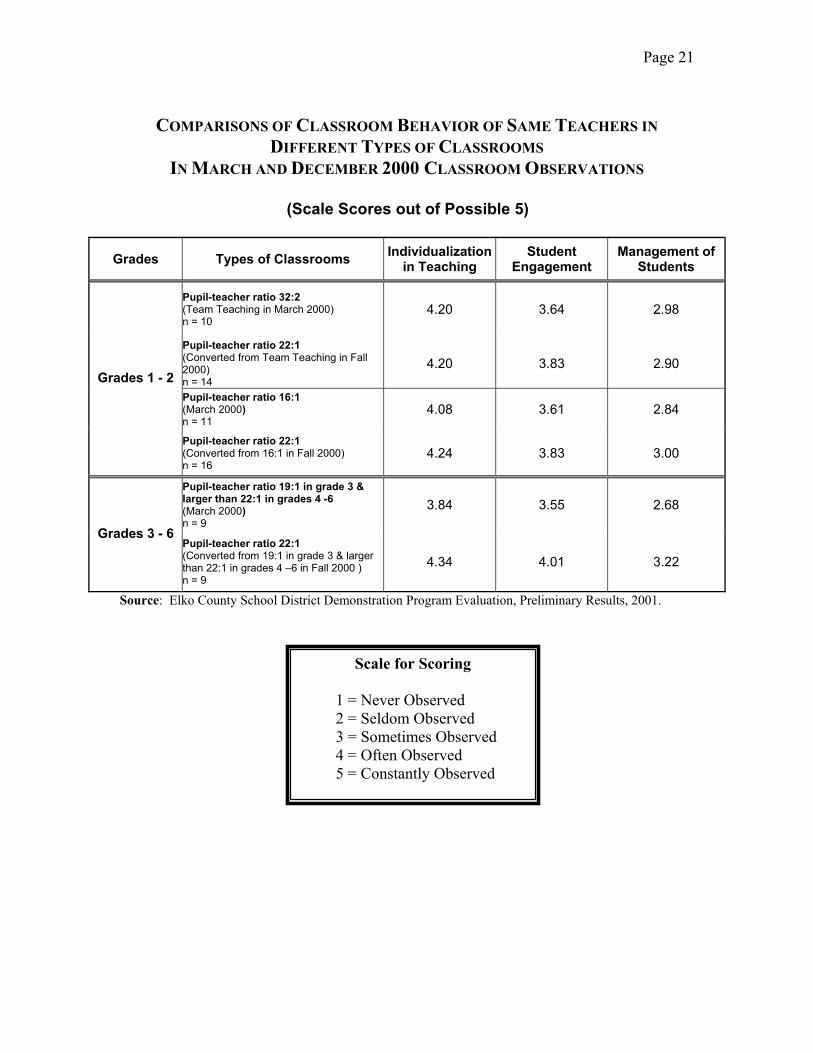
COMPARISONS OF CLASSROOM BEHAVIOR OF SAME TEACHERS IN
DIFFERENT TYPES OF CLASSROOMS IN MARCH AND DECEMBER 2000 CLASSROOM OBSERVATIONS
(Scale Scores out of Possible 5)
Grades Types of Classrooms Individualization in Teaching
Student Engagement
Management of Students
Pupil-teacher ratio 32:2 (Team Teaching in March 2000) n = 10
4.20 3.64 2.98
Pupil-teacher ratio 22:1 (Converted from Team Teaching in Fall 2000) n = 14
4.20 3.83 2.90
Pupil-teacher ratio 16:1 (March 2000) n = 11
4.08 3.61 2.84
Grades 1 - 2
Pupil-teacher ratio 22:1 (Converted from 16:1 in Fall 2000) n = 16
4.24 3.83 3.00
Pupil-teacher ratio 19:1 in grade 3 & larger than 22:1 in grades 4 -6 (March 2000) n = 9
3.84 3.55 2.68
Grades 3 - 6 Pupil-teacher ratio 22:1 (Converted from 19:1 in grade 3 & larger than 22:1 in grades 4 –6 in Fall 2000 ) n = 9
4.34 4.01 3.22
Source: Elko County School District Demonstration Program Evaluation, Preliminary Results, 2001.
Scale for Scoring
1 = Never Observed 2 = Seldom Observed 3 = Sometimes Observed 4 = Often Observed 5 = Constantly Observed
Page 22
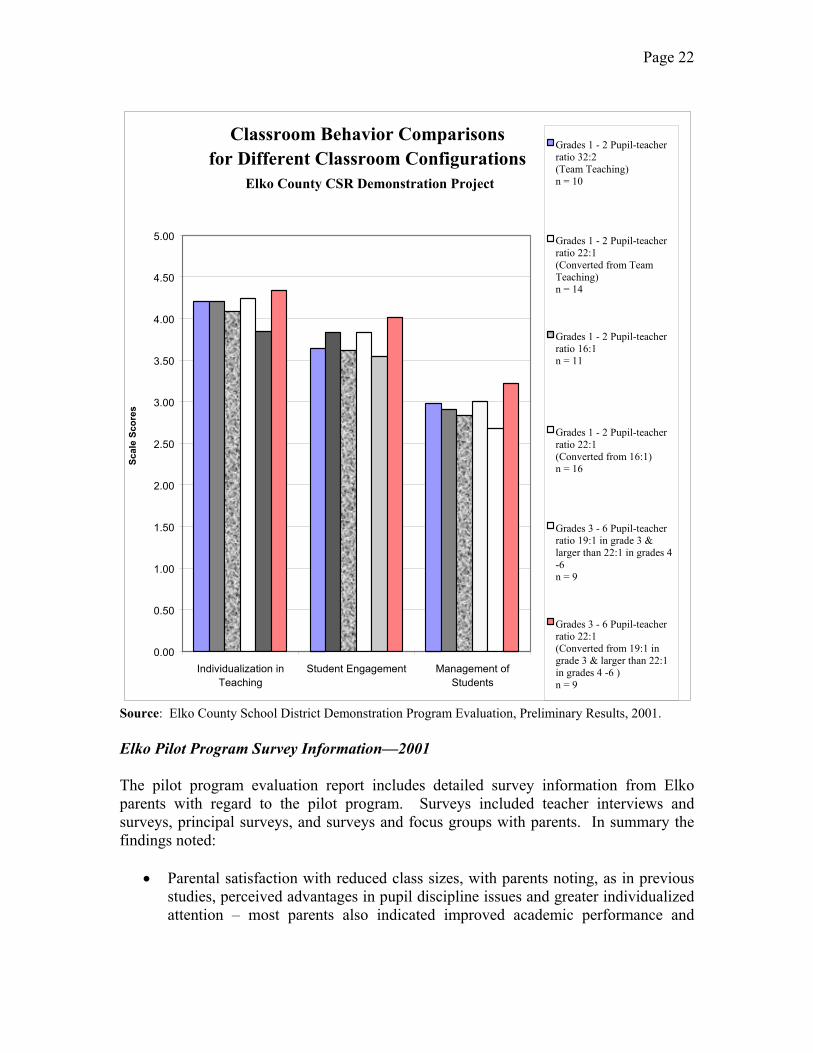
Source: Elko County School District Demonstration Program Evaluation, Preliminary Results, 2001. Elko Pilot Program Survey Information—2001 The pilot program evaluation report includes detailed survey information from Elko parents with regard to the pilot program. Surveys included teacher interviews and surveys, principal surveys, and surveys and focus groups with parents. In summary the findings noted:
• Parental satisfaction with reduced class sizes, with parents noting, as in previous studies, perceived advantages in pupil discipline issues and greater individualized attention – most parents also indicated improved academic performance and
Classroom Behavior Comparisons for Different Classroom Configurations
Elko County CSR Demonstration Project
0.00
0.50
1.00
1.50
2.00
2.50
3.00
3.50
4.00
4.50
5.00
Individualization inTeaching
Student Engagement Management ofStudents
Scal
e Sc
ores
Grades 1 - 2 Pupil-teacherratio 32:2 (Team Teaching) n = 10
Grades 1 - 2 Pupil-teacherratio 22:1 (Converted from TeamTeaching) n = 14
Grades 1 - 2 Pupil-teacherratio 16:1 n = 11
Grades 1 - 2 Pupil-teacherratio 22:1 (Converted from 16:1) n = 16
Grades 3 - 6 Pupil-teacherratio 19:1 in grade 3 &larger than 22:1 in grades 4-6 n = 9
Grades 3 - 6 Pupil-teacherratio 22:1 (Converted from 19:1 ingrade 3 & larger than 22:1in grades 4 -6 ) n = 9
Page 23
improved social aspects. Parent surveys noted the advantages and disadvantages of team teaching.
• Teachers were most likely to see positive effects, especially as the program
entered its second year – many noted improved physical space, increased student social interaction, fewer discipline problems, increased use of materials and increased academic interaction between student and teacher.
• In general, principals were positive and tended to see improvements as well.
The report concludes that more data needs to be collected if pilot program extended.
Page 24
V. SELECTED REFERENCES TO MATERIALS CITED NRS 388.700 Class-Size Reduction Program Report. Nevada Department of Education,
January 31, 1997. Costa, Judith S. 1995-1996 Class-Size Reduction Survey Results for Nevada.
Clark County School District Testing and Evaluation Department (1997). Gonzales, Danny A. Report on the Elko County School District Class-Size Reduction
Demonstration Project. Great Basin College & Elko County School District, February 2001.
Pollard, James P. The Nevada Class-Size Reduction Evaluation Study 1995. Northwest
Regional Educational Laboratory, March 1995. Snow, Mary B. The 1993 Class-Size Reduction Evaluation Study. Nevada Department of Education, August 1993. Snow, Mary B. An Evaluation of the Class-Size Program. Nevada Department of
Education, August 1998. Snow, Mary B. An Evaluation of the Class-Size Program. Nevada Department of
Education, April 1999. Snow, Mary B. Class-Size Reduction in Nevada: A Pilot Study. Nevada Department of
Education, February 2001.