new approaches to minimize excess sludge in activated ... · new approaches to minimize excess...
TRANSCRIPT

NEW APPROACHES TO MINIMIZE EXCESS SLUDGE IN ACTIVATED SLUDGE SYSTEMS
G H Chen, K J An, S. G H Chen, K J An, S. SabySaby, and H K Mo , and H K Mo
Department of Civil EngineeringThe Hong Kong University of Science and Technology
(HKUST)Clear Water Bay, Kowloon, Hong Kong

Introduction
Activated sludge production, treatment and disposal

Sludge Production
Primary Settling
Effluent toSecondary Treatment
Raw WastewaterBOD (100%) Screens
Primary Sludge(35% BOD)
Primary Treatment Effluent(BOD 65%) Bio-reactor
Secondary Effluent(BOD 10%)Secondary
Settling
Secondary Sludge(30% BOD)
CO2+ H2O (25% BOD)
Primary sludge:110-170 kg dry solids /103 m3
of wastewater treated
microorganisms
cellsnewOHCOnutrientsOmatterorganic222 ++++
Secondary sludge:70-100 kg dry solids /103 m3
of wastewater treated
3 m3/103m3
wastewater treated
8 m3/103m3
wastewater treated

Sludge Treatment
Gravity Anaerobic digestion
Chemical conditioning
Primary sludge (5% solids)
Flotation
Aerobic digestion
Heating
Centrifuge
Filter press
Drying bed
Lagoon
Centrifuge
Thickening Stabilization Conditioning Dewatering
optional
7-9% solids
Secondary sludge (1% solids)
Primary sludge + secondary sludge (3% solids)
Anaerobic digestion
~ 30% solids contentReducing the sludge
volume greatly
Sludge reuse or disposal

Sludge Disposal
Incineration
Ocean dumpingLand application
•The most preferred means• Capacity is limited• Lack of new location
• Practiced in large municipalities• Air pollution
Landfill
Water pollution control regulationsReuse of sludge nutrientSoil amendment Sludge should be less contaminated

Sludge Disposal
Incineration
Ocean dumping
Landfill
Land application
•The most preferred means• Capacity is limited• Lack of new location
• Practiced in large municipalities• Air pollution
Water pollution control regulationsReuse of sludge nutrientSoil amendment Sludge should be less contaminated
Incineration
Ocean dumping
Landfill
Land application
•The most preferred means• Capacity is limited• Lack of new location
• Practiced in large municipalities• Air pollution
Water pollution control regulations
Incineration
Ocean dumping
Landfill
Land application
•The most preferred means• Capacity is limited• Lack of new location
• Practiced in large municipalities• Air pollution
Water pollution control regulationsReuse of sludge nutrientSoil amendment Sludge should be less contaminated
Best solution will be reducing excess sludge production during the wastewater treatment, or recovering energy and resources from sludge

Major Approaches of Excess Sludge Reduction

Major Approaches of Excess Sludge Reduction
(1) Sludge pretreatment through thermal, mechanical, or ozone treatment
(2) Restricting/limiting sludge growth in an aeration tank
Disintegration:Sludge Secondary substrate

recycled sludge recycled sludge
secondary substratessecondary substrates
dissolvingozonation
Thermal
COCO22 + H+ H22OO
catabolism
new biomassnew biomass
anabolismO2 O2
Why Sludge Why Sludge SolubilizationSolubilization//disintrgationdisintrgationcan Reduce Excess Sludge Productioncan Reduce Excess Sludge Production
As a result, excess sludge can be reducedAs a result, excess sludge can be reduced

[1] Applied force for sludge pretreatment
– Heat treatment under a high temperature up to 180ºC[R. T. Haugh et al.,1978][J. Pinnekamp ,1989], [U. Kepp et al., 2000], [A. Canales et al., 1994]
– Mechanical pretreatment using ultrasonication, mills and homogenizers[G. Lehne, A. Muller and J. Schwedes 2001], [K. Nickel et al., 1998][U. Basier and P. Schmidheiny, 1997]
• Stirred Ball Mills (SBM) • High Pressure Homogenizers (HPH)• Ultrasonic Homogenizers (UH)• Mechanical Jet Smash Technique (MJS)• High Performance Pulse Technique (HPP)• Lysat-Centrifugal-Technique (LC)
– Ozonation [H. Yasui and M. Shibata,1994], [E. Egemen et al., 2001][T. Kamiya, and J. Hirotsuji, 1998], [M. Weemaes et al., 2000]

[1] Specific energy consumption with various pretreatment methods [J. Müller,2000]
Specific energy input (kJ/kg SS)
Deg
ree
of s
ludg
e re
duct
ion
(%)

[1] Comparison of various sludge pretreatment methods
Poor sludge settlingOdor generation
Relatively low
Relatively lowHighOzonation
High costSuitability of the machines for practical application is major concern
HighHighHighMechanical
Produce non-biodegradable organic matter at high temperature Odor generation
HighHighLowThermal
DisadvantagesOperational cost
Energy requirement
Sludge reductionefficiency
Sludge pretreatment method

[2] Restricting/limiting sludge growth in an aeration tank
A significant reduction in sludge production could be achieved by restricting/limiting sludge growth under the following conditions:
1. at high temperatures [P. Coultate and K. Sundaram,1975], [I. Nioh and C. Furusaka,1968]
2. with the presence of metabolic inhibitory substances [G.H Chen et al., 2000];3. with nutrients limitation [S. P. Tsai, 1990]4. with the presence of higher forms of microorganisms such as protozoa and
metazoa [C. H. Ratsak et al., 1994]; [J. H. Rensink et al., 1997]5. with a long SRT as in an extended aeration process and MBR process [S.
Chaize and A. Huyard , 1993].

[2] Concept of restricting/limiting sludge growththrough futile cycle or energy uncoupling
EnergyEnergy
Catabolism Anabolism
Energy Conditions to induce futile cycle:
Extreme or unfavorable environmentLimitation of nutrientsPresence of certain chemicalsFutile
Cycle

Sludge Pretreatment Sludge Pretreatment vsvs Sludge Growth RestrictionSludge Growth Restriction
Sludge Pretreatment Sludge Growth Restriction
60-100% excess sludge reduction
50-80% excess sludge reduction
High energy input Lower energy input
Require modification of treatment plant
Little modification of treatment plant

Major Shortcomings of the Present Methods
• Poor Sludge Settling
• Higher Oxygen Requirements
• Reduced Nutrient and Substrate Removal
• Alternative method for reducing excess sludge production, which is feasible and cost-effective, is necessary

New Approaches to Reduce Excess Sludge Studied at HKUST
1. Chemically stimulated futile cycle
2. Chlorination pretreatment of sludge
3. Oxic-Settling-Anaerobic (OSA) process
4. Autotrophic denitrification

Ideal Chemicals to Stimulate Futile CycleIdeal Chemicals to Stimulate Futile Cycle
Low cost
High efficiency
Low toxicity
Less impact on substrate removal capacity
3, 3’, 4’, 5-tetrachlorosalicyanide (TCS)

Chemical Structure of TCS
A chemical compound, 3,3A chemical compound, 3,3’’,4,4’’,5,5--ttetrachlorosalicylanilideetrachlorosalicylanilide (TCS) can (TCS) can stimulate futile cycle in stimulate futile cycle in Streptococcus Streptococcus bovisbovis
CONH
Cl Cl
Cl
Cl CH
One of the formulations of soaps, rines, polishes, shampoo, deodorants

Work Scope
to investigate the effect of TCS on sludge growth rate and
substrate utilization rate
to find out an appropriate TCS dosage to induce excess sludge
reduction
to examine the response of microbial activity to the TCS
dosage

Methodology:
pure culture of E.Coli
batch and continuous mixed cultures cultivated with and without TCS
endogenous decay coefficient study

-1
-0.5
0
0.5
1
0 0.1 0.2 0.3 0.4 0.5TCS (ppm)
Yob
s (m
g P-
CO
D/m
g S-
CO
D)
Effect of TCS on the observed growth yield (Yobs) of E. coli at different TCS concentration
S0/ X0 = 2X0 = 500 mg/L

Change of ATP content in E. coli at different TCS concentrations
TCS concentration (ppm)
∆ATP content (µg/mg SS)
0.0 -1.59 0.02 -1.62 0.05 -1.77 0.1 -1.90 0.2 -1.88 0.4 -2.16

Effect of TCS on Sludge Growth Rate and Substrate Effect of TCS on Sludge Growth Rate and Substrate RemovalRemoval RateRate
1
1.1
1.2
1.3
1.4
1.5
0 30 60 90 120 150 180Time (min.)
Rel
ativ
e bi
omas
sco
nc. (
X/X
o)
Control0.2 ppm TCS0.4 ppm TCS0.6 ppm TCS0.8 ppm TCS
S0/ X0 = 2X0 = 500 mg/LContinuous aeration
significant effect on sludge growth when TCS > 0.4 ppm
0.5
0.6
0.7
0.8
0.9
1
0 30 60 90 120 150 180Time (min.)
Rel
ativ
e su
bstr
ate
conc
. (S/
So)
Control 0.2 ppm TCS0.4 ppm TCS0.6 ppm TCS0.8 ppm TCS
S0/ X0 = 2X0 = 500 mg/L Continuous aeration
Significant effect on substrate uptake rate when TCS >0.4 ppm

Effect of TCS on Observed Growth YieldEffect of TCS on Observed Growth Yield
0.3
0.5
0.7
0 0.2 0.4 0.6 0.8TCS dose (ppm)
Yob
s (m
g M
LSS/
mg
CO
D) So/Xo =2
X0 = 500 mg MLSS/L TCS reduces the Yobs
A shape drop of Yobs is detected between 0.4 and 0.6 ppm TCS introduction
0.2
0.4
0.6
0.8
1
0 0.2 0.4 0.6 0.8TCS dose (ppm)
u/u
0 or
q/q
0
u/u0
q/q0
TCS reduces both the µ and q
The change of µ resemble that of Yobs

Effect of TCS on Sludge Decay RateEffect of TCS on Sludge Decay Rate
400
450
500
550
600
0 1 2 3 4 5Time (day)
MLS
S (m
g/L)
control1.0 ppm TCS

Effect of TCS on Cumulative Excess Effect of TCS on Cumulative Excess Sludge Production of Batch Cultures Sludge Production of Batch Cultures
0
30
60
90
120
0 5 10 15 20 25 30Time (day)
Acc
umul
ativ
e Ex
cess
Slu
dge
(g S
S/d)
Bc 2Bc 1Bc 0
S0/X0 = 0.25X0 = 2,000 mg SS/L
y = 1.94 g SS/d
y = 3.41 g SS/d
y = 2.66 g SS/d

Nomenclatures in the Results and DiscussionNomenclatures in the Results and Discussion
Symbol Description
Bc 0 Batch cultivation without the presence of TCS (control)
Bc 1 Batch cultivation with the presence of 0.5 ppm TCS
Bc 2 Batch cultivation with the presence of 1.0 ppm TCS
Cc 0 Continuous cultivation without the presence of TCS
Cc 1 Continuous cultivation with the presence of 1.0 ppm TCS

Observed Growth Yield of Batch Cultures Cultivated Observed Growth Yield of Batch Cultures Cultivated with TCS at Different Dosages with TCS at Different Dosages
0
0.2
0.4
0.6
0.8
0 10 20 30Time (d)
Yobs
(g S
S/g
CO
D)
Bc 2Bc 1Bc 0
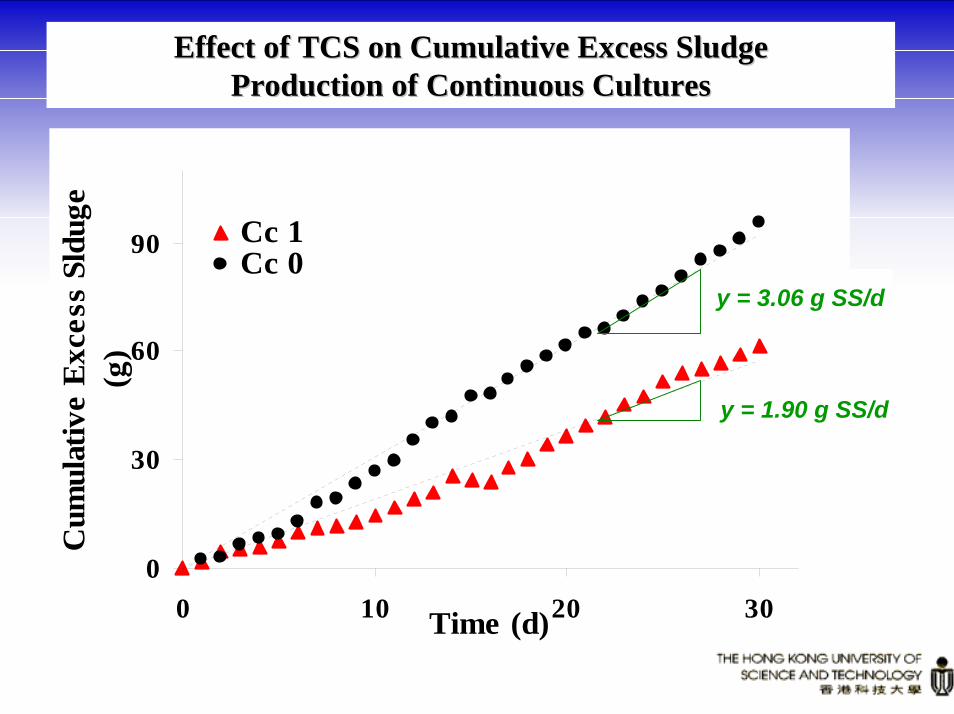
Effect of TCS on Cumulative Excess SludgeEffect of TCS on Cumulative Excess SludgeProduction of Continuous Cultures Production of Continuous Cultures
0
30
60
90
0 10 20 30Time (d)
Cum
ulat
ive
Exc
ess
Sldu
ge(g
)
Cc 1Cc 0
y = 3.06 g SS/d
y = 1.90 g SS/d

Observed Growth Yield Analysis of Continuous CulturesObserved Growth Yield Analysis of Continuous Cultures
0
0.2
0.4
0.6
0 10 20 30Time (d)
Yobs
(mg
SS/ m
gC
OD
/d)
Cc 1Cc 0
Experiments were conducted at a period of 3 hoursDuring the experiment, TCS was not added

Effect of TCS on Substrate Removal Efficiency of Continuous CultEffect of TCS on Substrate Removal Efficiency of Continuous Culturesures
55
65
75
85
95
0 10 20 30Time (d)
Cc 1Cc 0C
OD
rem
oval
ef
ficie
ncy
(%)
TCS dose (ppm) Parameter
0 1.0
Mean Substrate removal (mg COD /L /d) 920 880
Daily Sludge Production 383 238
Overall yield (g SS / g COD) 0.41 0.27
Effluent SS conc. (mg/L) 35.7±15.4 43.3±23.1

Effect of TCS on SOUR of Batch and Continuous CulturesEffect of TCS on SOUR of Batch and Continuous Cultures
SOUR (mg O2/g SS/hr)Measurement Day
0ppm TCS (control) 0.5ppm TCS 1.0ppm TCS
0 58.6 61.2 58.95th 52.1 57.1 49.3
10th 63.1 75.3 97.020th 63.7 79.7 90.830th 60.1 81.3 96.1
Batch CultureINCREASE
SOUR (mg O 2/g SS/hr)M easurement Day
0 ppm TCS (control) 1.0 ppm TCS
0th 61.2 63.75th 62.2 72.4
10th 66.7 77.820th 64.8 79.530th 62.6 78.3
Continuous Culture

Microbial Activity of Batch Cultures (DAPI & CTC Data)Microbial Activity of Batch Cultures (DAPI & CTC Data)
0.5 ppm TCS1.0 ppm TCS
Control
Day Batch Culture Active microbialportion (%)
no. of active microbes/ VSS(no./mg)
15 Control 5.7 1.39 x 10⁸
0.5 ppm TCS 10.3 3.45 x 10⁸
1.0 ppm TCS 10.5 4.07 x 10⁸
30 Control 3.9 1.09 x 10⁸
0.5 ppm TCS 4.3 1.22 x 10⁸
1.0 ppm TCS 7.6 2.72 x 10⁸In
crea
se
Incr
ease

Microbial Activity of Continuous CultureMicrobial Activity of Continuous Culture
Control1.0 ppm TCS
Day ContinuousCulture
Active microbialportion (%)
no. of active microbes/VSS (no./mg)
15 control 7.4 1.49 x 10⁸
1.0 ppm TCS 11.2 2.99 x 10⁸
30 control 5.6 1.42 x 10⁸
1.0 ppm TCS 10.1 2.69 x 10⁸In
crea
se
Incr
ease

Enzyme complex I, III and IV
+ + + + + + + + + + + + + + + + + + + + +
- - - - - - - - - - - - - - - - - --
1/2 O2 + 2 H+ + 2 e- H2O
2 NADH +2 H+ 2 NAD+ +2 e-
F0
F1
I, III,IV
H+H+
H+ H+H+
H+
ATP
H+
ADP+Pi
H+ H+
H+
H+
TCS interacts with
membrane
H+
H+
H+
Proposed Mechanism: Futile Cycle Induced by TCS
INNER AREA
OUTER AERA
MITOCHONDRIA
F0, F1-ATP synthase

[2] Chlorination pretreatment of Excess Sludge
Excess sludge
Compressed air
Treated Water
40 L/daySynthetic wastewater
Flow meter
Automatism
Pressurecaptor
40 L/day
Hollow fibermembrane
2L sludge
Cl2
N2KI solution (1N)
Magnetic stirrer
99%
For washing
Chlorinated sludge
2 L/day
Reactor for sludgechlorination
MembranebioreactorB A
Figure 2-1. Membrane biological reactor (A) and chlorination setup (B) used in this study.

Chlorine dose and residual during the sludge chlorination.
65.019.10.33237.85.80.26612.91.80.1999.00.30.1335.50.30.066
(mg Cl2/L)(mg Cl2/L)(g Cl2 /g MLSS)
Total Cl2residual
Free Cl2Residual
Chlorine Dose

y = 1.71x - 0.41R2 = 0.99
y = 5.14x - 6.88R2 = 0.99
0
20
40
60
80
100
120
140
160
180
200
0 5 10 15 20 25 30 35 40
Time (days)
Cum
ulat
ive
exce
ss s
ludg
e (g
)Reference system
With chlorinated sludge recirculation
Reduction 67%
Figure 2-2. Sludge production rates in the continuous systems without (the reference system) and with (testing line) the chlorination treatment of excess sludge.

0
100
200
300
400
500
600
700
800
0 5 10 15 20 25 30 35 40
Time (days)
Solu
ble
CO
D in
slu
dge
(mg
O2/L
)
-10
0
10
20
30
40
50In sludge from aerated sludgeIn treated water
Solu
ble
CO
D in
trea
ted
wat
er (m
g O
2/L)
Figure 2-3. Variations of the COD concentration in the sludge and treatedwater of the testing system.
(Errors bars present the standard deviation of the COD measurement).
A
C
B
50
60
70
80
90
100
0 5 10 15 20 25 30 35
Time (days)
% M
LSS/
TS
Sludge from aerated tank
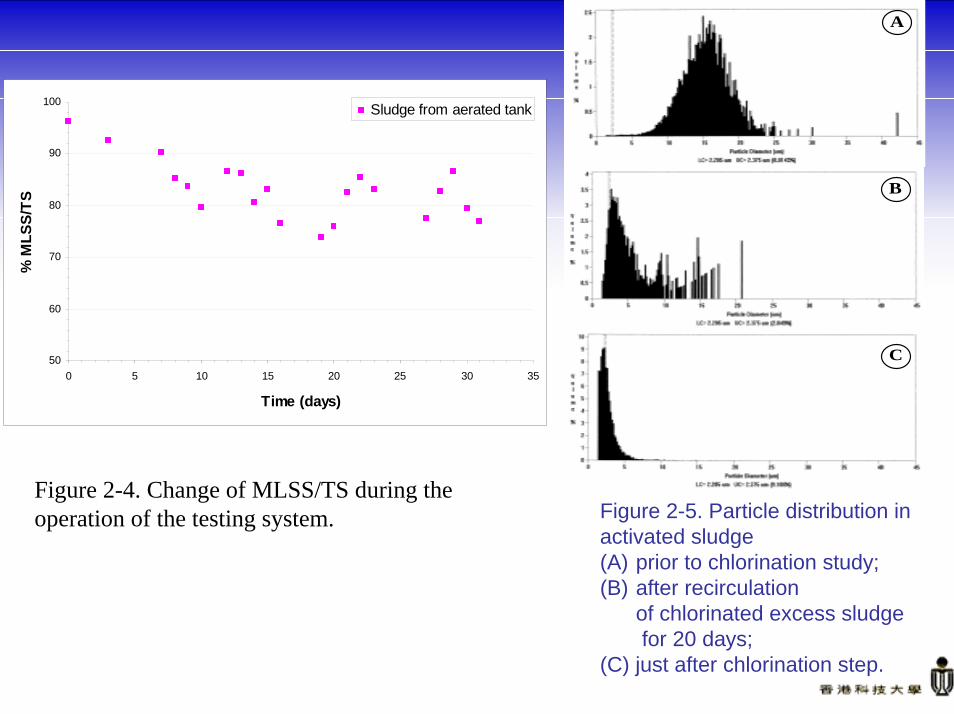
Figure 2-4. Change of MLSS/TS during the operation of the testing system. Figure 2-5. Particle distribution in
activated sludge (A) prior to chlorination study; (B) after recirculation
of chlorinated excess sludge for 20 days;
(C) just after chlorination step.

0.0E+00
5.0E+11
1.0E+12
1.5E+12
2.0E+12
2.5E+12
3.0E+12
Sludge from reference system
Numb
er of
cells
per g
of M
LSS
Cells (DAPI counting)
Respiring bacteria(CTC counting)
Sludge in pilot unit with chlorinated sludge recirculation
29%
34%
Figure 2-8. Total number of cells and the number of active bacteria in both the reference and testing systems (the results represent the mean values of five independent analyses).
THMs concentrations in the treated water and sludge.
8606808301280Sludge after NaClO addition (150 mg Cl2/L)
<200<200230*<200Chlorinated sludge (after 10 min reaction)
270*310<200260*Chlorinated sludge (just after chlorination)
<200<200<200<200Treated water
Analysis 4Analysis 3Analysis 2Analysis 1Sample
THMs concentration (µg/L)

[3] Oxic-Settling-Anaerobic (OSA) System
Aerationtank
Settling
Influent Effluent
Excess sludge
Sludge holding tank
• No additional substrate• High sludge
concentration • Longer retention time
Important factors
•Biomass level •Anaerobic sludge exposure time (SAET)•ORP
Sludge settleability and nutrient removal?What extent of reduction?
What is the cause for the reduction?
• It is relatively easy to modify conventional activated sludge process
• Neither chemical addition nor heat energy is required
• The treatment efficiency is NOT affected
• Great potential in full-scale application

• To examine the capacity of OSA system in reducing excess sludge production
• To investigate the performance of an OSA system under different operating conditions
• To study the impact of the anaerobic sludge zone on bacterial activity
• To identify the cause of the reduction of excess sludge production in an OSA system
Study Objectives

Experimental Set-up
Working Volume = 10.0 L
AERATION TANK
SETTLING TANK
STOCKSOLUTION
Volume = 4.0 L
DILUTIONWATER
SLUDGE HOLDING TANK
Working Volume = 4.5 L
NITROGENGAS TANK
Effluent Overflow
RecirculatedSupernatant
Air inlet
Concentrated Sludge
ORP Electrode
Effluent Permeate
Hollow Fiber MembranePore size 0.4 µmFacilitate the precise measurement of sludge production
MLSS : 7-9 g/LORP : 100, -100, and -250mV
SAET 6,10, and 12 hrMLSS : 7-9 g/LORP : -250mV
HRT : 6 hr, MLSS:2 g/L, DO: >2 mg/L
Wastage excess sludge

Observed Growth Yield at Different ORP in Sludge Holding Tank
0.1812.772.30-250
0.2212.272.70-100
0.3212.183.90+ 100
Yobs(g SS/g COD)
COD removal rate (g COD/day)
Net sludge production rate
(g SS/day)
ORP in sludge holding tank (mV)

Observed growth yieldat different SAET in Sludge Holding Tank
at -250 mV ORP
0.1712.72.012
0.1912.32.410
0.2712.23.56
Yobs(g SS/g COD)
COD removalrate (g COD/day)
Net sludgeproduction rate
(g SS/day)
SAET in sludge holding tank (hours)

Comparisons of Performance of OSA System with Reference System under same COD Loading
Operating conditions
Reference System I OSA System
Influent
Effluent
Effluent
SettlingTank
Aeration Tank
Wastage sludge
Influent
Aeration Tank
Wastage sludge
Sludge Holding Tank
HRT : 6 hrMLSS : 2 g/L
HRT : 6 hrMLSS : 2 g/L
SAET : 10 hrMLSS : 8 g/LORP : -250mV
Membrane filtration was used to facilitate the precise measurement

COD Removal
0
50
100
150
200
250
300
350
400
0 10 20 30 40 50 60 70 80
Time (day)
CO
D (m
g/L)
Effluent average (Reference system I) = 41 mg/L
Effluent average (OSA system) = 18 mg/L
Influent average =330 mg/L

Sludge Production Rate
0
100
200
300
400
500
0 10 20 30 40 50 60 70 80Time (day)
Cum
ulat
ive
Exce
ss S
ludg
e Pr
oduc
tion
(g M
LSS)
Excess sludge production (Reference system I)@ 4.8 g/day
Excess sludge production (OSA system)@ 2.3 g/day
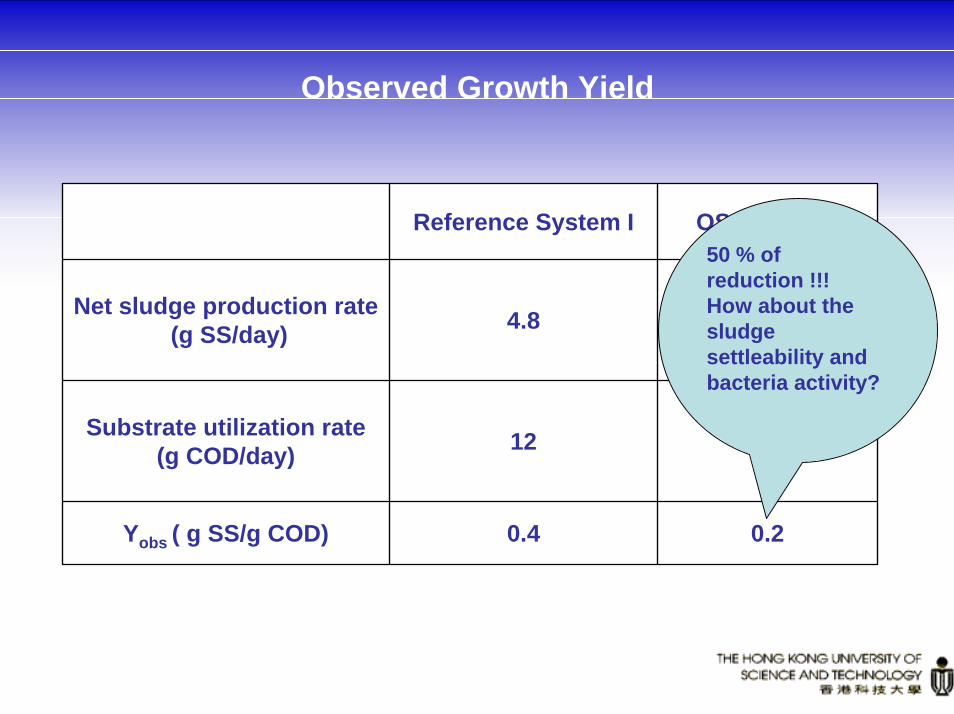
Observed Growth Yield
0.20.4Yobs ( g SS/g COD)
1312Substrate utilization rate (g COD/day)
2.34.8Net sludge production rate(g SS/day)
OSA SystemReference System I50 % of reduction !!!How about the sludge settleability and bacteria activity?

Sludge Settleability
0
50
100
150
200
250
300
0 10 20 30 40 50 60 70 80
Time (day)
SVI
Reference system IMean 180
Mean 110
OSA system

SOUR
0
10
20
30
40
50
60
70
80
SOU
R (m
gO2 /g
VSS
-hr)
1 2 3 4 5 6 7 8 9 10
Time (week)
OSA system Reference system I
60
50
At temperature 20oC

Comparisons of Performance of OSA System with Reference System under same Sludge Quantity
Operating Conditions
Reference System II OSA System
Influent
Effluent
Effluent
SettlingTank
Aeration Tank
Wastage sludge
Influent
Aeration Tank
Wastage sludge
Sludg Holding Tank
HRT : 6 hrMLSS: 7~8 g/L
HRT : 6 hrMLSS: 2 g/L
20 g
80 g
30 g
30 g
Higher sludge quantity will generally result in low sludge production? is it the main cause for the OSA system for reducing the excess sludge production?

Sludge Production Rate
Reference system II@ 2.2 g/day
OSA system@ 2.0 g/day
0
20
40
60
80
100
120
0 10 20 30 40 50Time (day)
Cum
ulat
ive
Exce
ss S
ludg
e Pr
oduc
tion
(g M
LSS)

COD Removal
0
50
100
150
200
250
300
350
400
0 5 10 15 20 25 30 35 40 45 50 55 60
Time (day)
CO
D (m
g/L)
Influent average 330 mg/L for both systems
Effluent average(Reference system II)= 12 mg/L
Effluent average(OSA system) = 18 mg/L
Sludge loading is 4 times higher

Observed Growth Yield
0.18Yobs ( g SS/g COD) 0.2
1313Substrate utilization rate(g COD/day)
2.02.2Net sludge production rate(g SS/day)
OSA systemReference System II
However, the operating principle of the two systems are different !
Let’s look at the other parameters…

SOUR
0
10
20
30
40
50
60
70
80SO
UR
mgO
2/g
VSS-
hr
1 2 3 4 5 6 7 8 9 10Time (week)
OSA system Reference system IISOUR
Substrate oxidation and cell synthesis:
COHNS + O2 + nutrients →bacteriaCO2 + H2O + NH3 + )tissuecellnew(NOHC 275 + other end products
60
40
At Temperature 20oC

Endogenous Respiration
Endogenous respiration:
C5H7O2N (Cells) + 5 O2 →bacteria 5CO2 + NH3 + 2H2O
0
2
4
6
8
10
12SO
UR
mg
O 2/
g VS
S-hr
1 2 3 4 5 6 7 8 9 10
Time (week)
OSA system Reference system II
8
5
At Temperature 20oC

The diluted SVI (DSVI) test has been used for the reference system II since MLSS concentration in the aeration tank was very high (Wastewater Engineering 4th edition)
Sludge Settleability
0
100
200
300
400
0 10 20 30 40 50 60Time (day)
SVI/D
SVI
DSVI for reference system II
SVI for OSA system

Microscopic Observation
1,260<100Actinomycete (CFU/mL)
13,750absentProtozoa and metazoa (counts/mL)
Reference System IIOSA SystemType of microorganism
Ciliates in Ref IIActinomycete

Nutrients Removal
45±25.5±19.5±0.510±1PO43-
(mg P /L)80±318±212±2330±10COD (mg/L)
0.2±0.0536±155±11.6±0.3NO3-
(mg N/L)
0.02±0.0050.05±0.050.05±0.020NO2-
(mg N/L)
25±0.50.04±0.050.04±0.535±0.5NH4+-
(mg N/L)
26±0.538±0.555±160±1TN (mg N/L)
Effluent of the sludge
holding tankSystem effluentEffluentInfluentParameter
OSA systemReference system II

COD Balance Batch Test Set-Up
P
ORP & pH Recorder
GC/FID
Magneticstirrer
Nitrogen gas
Reactor I ORP :-250 mV Reactor III
ORP : 0~ -20 mV
Reactor IIORP :-150 mV
Measured Parameters
- pH and ORP- MLSS and COD- Nitrite, Nitrate, Phosphate, Sulfate- Organic Carbon content in the produced gas

MLS
S an
d C
OD
(a)
Initial, 9 Initial, 9 Initial, 9
Final, 7.9Final, 8.7 Final, 8.9
0
1
2
3
4
5
6
7
8
9
10
Reactor I (ORP at -250 mV) Reactor II (ORP at -150mV) Reactor III (ORP at -20 mV)
MLS
S (g
/L)
10% 4% 1.2%
(b)
Final, 15
Final, 147
Final, 512
Initial, 35Initial, 35Initial, 350
100
200
300
400
500
600
Reactor I (ORP at -250 mV) Reactor II (ORP at -150mV) Reactor III (ORP at -20 mV)
CO
D c
once
ntra
tion
(mg/
L)

7.932.0 37.87.6PO43--P(mg/L)
120.9 0.434.5NO3--N(mg/L)
00.0 0.00NO2--N(mg/L)
7.06.5 7.57.3pH
01444632VFA (mg as COD/L)
11,64011,477 11,12811,674TCOD (mg/L)
1216534539SCOD (mg/L)
8,1297,9667,5938,194MLVSS (mg/L)
8,8988,6788,254.08,906MLSS (mg/L)
Reactor IIIReactor IIReactor I
Final sample after 16 hoursInitial sampleParameter
1. initial and final COD (soluble + particulate) was estimated, their difference gives a total COD loss
2. COD consumptions in the corresponding reactions were estimated
3. The amount of COD released as gaseous products was estimated
Typical Results
SO42--S(mg/L) 7.2 3.6 6.3 7.0
Organic carbon (%) in the gas - 2.03 - -
Total COD removed in Step (2) and (3) was compared with the total COD loss of the system in Step (1).

COD Balance
Reactor I
1.93467.26213.70 77.69.6166.36 476.48
-0.72434.41194.18 70.610.4159.22 431.32
9.30497.4266.75 60.47.2163 536.32
Total COD consumption
Gas production
Phosphorus release
Sulfate reductionDenitrificationSTo-STe (mg/L)
Unaccounted COD (%)
COD consumption (mg/L)COD loss
Reactor II
2.19209.330441.2164.13214.02
5.91202.79045.40.4156.99215.54
4.79200.46048.81.8149.86210.54
Total COD consumption(4)(3)(2)(1)STo-STe (mg/L)
Unaccounted COD (%)
COD consumption (mg/L)COD loss

Expected Sludge Production under Anaerobic and Aerobic Conditions
Removal of substrate under anaerobic condition
Removal of substrate under aerobic condition
Theoretical sludge production (mg/L)
Theoretical sludge production (mg/L)
Reaction COD consumed (mg/L)
Y(g VSS/g COD)
Y(g VSS/g COD)
Denitrification 163 0.3 48.9
Sulfate reduction 7.2 0.2 1.4
0.55 251.3Phosphorus release 60.4 0.18 10.88
Gas production 266.8 0.05 13.34
Total ∑ 497.4 ∑ 74.5 ∑ 251.3

Conceptual Representation of OSA System
Influent
COD =330 mg/LNH4
+-N =36 mg N/LNO3
- -N =2 mg N/LPO4
2--P= 10 mg P/L
Biomass =8.8 g/LCOD < 30 mg/LSludge wastage
Aeration Tank
CO2
Biomass
Settling Tank Sludge Holding Tank
ORP = -250 mVSAET = 10 hours
Soluble COD
Decay Biomass Soluble COD (100%)
Denitrification Sulfate reduction Phosphorus release Gas production( 33%) (2%) (15%) (50%)
Overall growth yield is significantly lower as compared to aerobic oxidation
Biomass =8.3 g/LCOD = 70 mg/L
Effluent
day/12.0g4.39
day/g5sludgeofamount
decaytoduelossSS ==Ka=
Achromobacter, Acinetobacter, Agrobacterium, Alcaligenes, Arthrobacter, Paracocus etc (Payne, 1981)
Halobacterium, Methanomonas. Pseudomonas spp. Gayle (1987)
Most of these bacteria are able to use oxygen as well as nitrate or nitrite and also can carry out fermentation in the absence of nitrate or oxygen..

Economic Aspect
1.6 *107 USD/year [2,3]1.02×10⁷ USD/year[2,3] (40USD/ton)
Sludge Treatment and disposal cost
Calculation based on 100,000 m3/d of flow rate for two systems[1] Metcalf and Eddy, Inc. Wastewater Engineering: Treatment, Disposal and Reuse 4th edition, McGraw-Hill. Inc,
2003.[2] D. G. Christoulas, A. D. Andreadakis, A. Kouzeli-Katsiri, E. Aftias and Mamais, Alternative schemes for the
management of the sludge produced at Psyttalis WWTP, Water Sci. Techol., 42(9), 29-36, 2000.[3] A. M. Springer, D. V. Guillerom, Feasibility study of sludge lysis and recycle in the activated sludge process, T.
Journal May 1996 162-170
330 m3/d210 m3/dDisposal capacity(Landfill)
1100 m3 * 15d= 16,500 m3 [1]
700 m3/d *15d =10,500 m3 [1]
Digester volumeCost saving
NOYesORP control unit
NOAdditional for sludge pumping
Pumping
NOQ:25,000m3/d,HRT 10h= 10,416 m3
Sludge holding tank construction
Cost increase
Typical activated sludge process
OSA

[5] A new solution to Hong Kong Sewage- A Feasibility Study of Autotrophic Denitrification
Hong Kong sewage has unique characteristics due to the use of seawater in toilet flushing: sulfate level ~ 500 mg/L, COD ~ 300 mg/L, and chloride ~ 6000 mg/LThis sulfate level enables efficient sulfidogenic reactions under anaerobic condition, thereby resulting in a very low sludge yield (0.17) and eliminating oxygen demand for carbon oxidation in the subsequent treatment steps. If sufficiently produced sulfide, mostly in dissolved form, could be utilized by “Autotrophic Denitrification” as the electron donor, sludge production can be further reduced up to 75% as compared to conventional aerobic-anaerobic processesKey point is to shut out carbon source completely from heterotrophic oxidation and denitrification that feature a high sludge yield (0.4-0.5).

REACTION I REACTION I –– HeterotrophicHeterotrophic Sulfate ReductionSulfate Reduction
REACTION II REACTION II –– Autotrophic DenitrificationAutotrophic Denitrification
Y=0.17 COD + SO42- H2S + HS-
Y=0.5 COD + O2 CO2 + H2O
Y=0.4 COD + NO3- CO2 + N2
Y=0.15 H2S + HS- + NO3- SO4
- + N2

Proposed New Treatment System for Hong Kong Saline Sewage
COD Removal(Low sludge yield)
Nitrification(Low sludge yield)
Autotrophic denitrification(Low sludge yield)
Up to 75% excess sludge can be reduced than conventional aerobic-anaerobic processes

Advantages of Proposed Treatment
Integration of sulfate reduction, autotrophic denitrification, and nitrification to achieve a very low sludge yield
Efficient COD removal and complete nitrogen removal are possible.
Neither chemical nor physical forces are needed, oxygen demand is also reduced greatly. Thus, a very low operation cost can be expected.

Objective of this study
• To confirm efficiency of COD removal through sulfate reduction(Phase I)
• To study efficiency of autotrophic denitrification (AD) and its affecting factors (Phase I)
• To investigate performance of the integrated system for nitrogen and COD removal and excess sludge reduction(Phase II)
• To identify SRB and ADB bacteria (Phase II)• Pilot study of the proposed system at sewage treatment works
(Phase III)
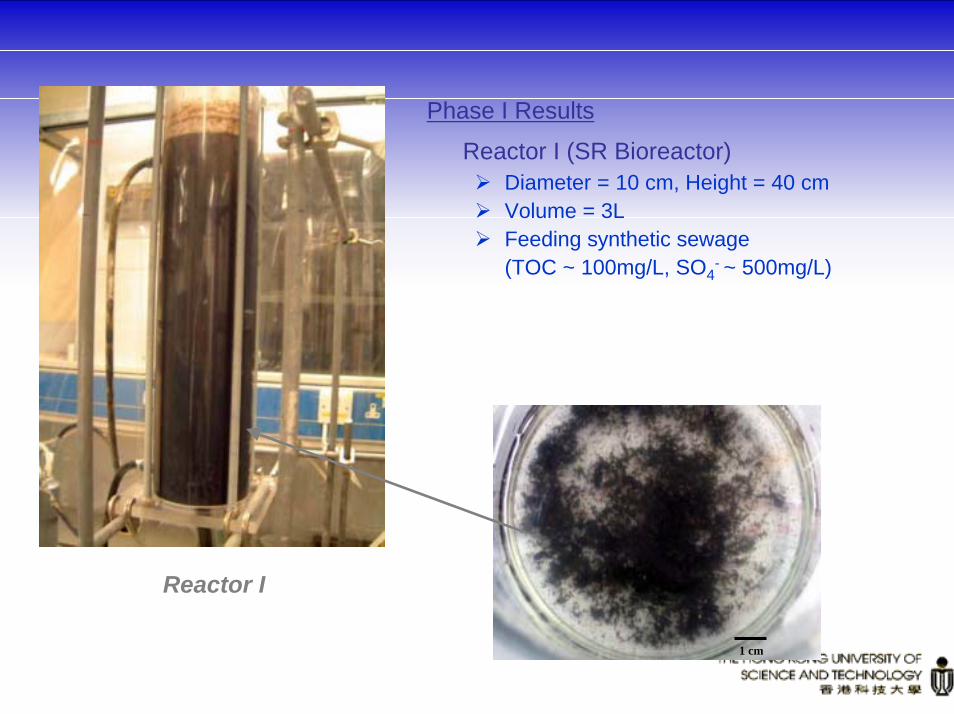
Reactor I
1 cm
Phase I Results
Reactor I (SR Bioreactor)Diameter = 10 cm, Height = 40 cmVolume = 3LFeeding synthetic sewage (TOC ~ 100mg/L, SO4
- ~ 500mg/L)

Reactor II
Reactor II (Submerged AD Bio-filter)Diameter = 10 cm, Height = 30 cmVolume ~ 2.15 L Feeding effluent from reactor I with external nitrate source (30 N-mg/L)
Transition
Zone
Working
Zone

Summary of Reactor I (SRB) Performance
ParametersHydraulic Retention Time
4 hrs 6 hrsInfluent Flow Rate (L/hr) 0.8 0.53
TOC (mg/L)
Influent (Average) 95 90
Effluent 16.3 ± 4.2 14.6 ± 2.7
TOC Removal % 82.4 ± 0.1 86.9 ± 5.1Sulfate (mg/L)
Influent 480.4 ± 116.7 660.6 ± 166.1
Effluent 220.3 ± 110.2 382.2 ± 111.9
Sulfate Removal 260.1 ± 113.4 278.4 ± 139.0
Average organic loading rate
kg TOC/m3-day 0.57 0.35
Sludge Yield (g VSS / g COD) 0.17 0.16
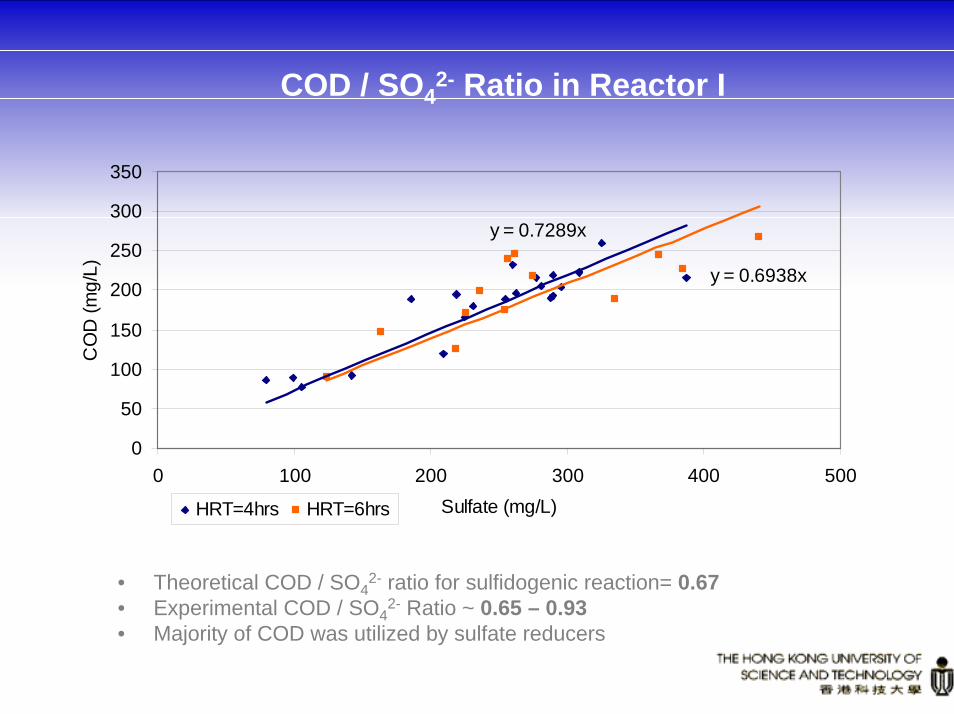
COD / SO42- Ratio in Reactor I
• Theoretical COD / SO42- ratio for sulfidogenic reaction= 0.67
• Experimental COD / SO42- Ratio ~ 0.65 – 0.93
• Majority of COD was utilized by sulfate reducers
y = 0.7289x
y = 0.6938x
0
50
100
150
200
250
300
350
0 100 200 300 400 500Sulfate (mg/L)
CO
D (m
g/L)
HRT=4hrs HRT=6hrs

Sulfur Balance in Reactor I
Measured Sulfur Source• Influent
– Sulfate ~ 154.2 mg S/L• Effluent
– Sulfate ~ 64.2 mg S/L– Total dissolved sulfide ~ 72.5 mg S/L
• Sulfate Reduced = 90 mg S/L• About 80% of the sulfide produced is in
the dissolved form
The remaining sulfur may include:hydrogen sulfide gasbiomass sulfurMetal sulfide

Performance of Reactor II (SADB)
HRT = 4hrs
0
10
20
30
40
50
0 2 4 6 8 10 12 14
Time (days)
Nitr
ate
(N
-mg/L
)
Influent NO3-
Effluent NO3-

Summary of SADB Performance
373.2259.7SO42- (mg/L)
124.486.6SO42- (mg S/L)
Dissolved Sulfide (mg S /L)
NO3- (N-mg/L)
72.5
33.8
Influent
-
1.3
Effluent
96%
Efficiency
Sufficient NO3- removal
in HRT = 4 hrs
TOC removal < 5mg/L
Theoretical Ratio: SO42- / NO3
- = 1.92 – 2.51 mg S/ mg N
Experimental Ratio:SO42- / NO3
- = 2.1 ± 1.19 mg S / mg N

Acknowledgement
• Following organizations should be acknowledged for financially supporting our work:
Hong Kong Research Grants CouncilHKUSTVivendi Water

The end
Thank you very much for your attention and patience.

Sludge Production and Landfill CapacityExample of Hong Kong
Projected daily sludge production from water and wastewater treatment works in Hong Kong
Others
Wastewater workWater work
Sludge production and landfill assimilative capacity in Hong Kong
2050180015001690Landfill capacity (ton/day)
212018501200510Sludge quantity (ton/day)
2015200820011991Year