new approaches to ultra-cold neutron production
TRANSCRIPT
Chen-Yu Liu
Research Opportunities with Ultracold Neutrons in the US11/7/2009Santa Fe, NM
New Approaches to Ultra-cold Neutron Production
Chris Lavelle, Greg Manus, Patrick McChesney, Dan Salvat, Yun Chang Shin, Phil Childress, Bill Lozowski, Walt Fox (Indiana University /IUCF)
C. Morris, A. Saunders, M. Makela (LANL)
A.R. Young (NCSU)
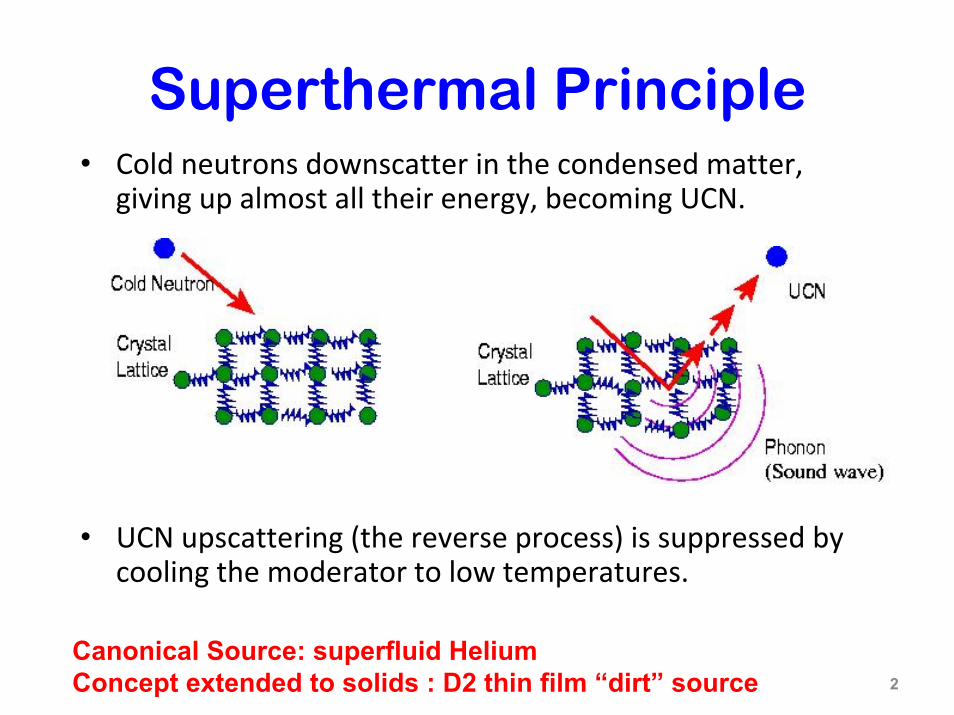
Superthermal Principle• Cold neutrons downscatter in the condensed matter,
giving up almost all their energy, becoming UCN.
• UCN upscattering (the reverse process) is suppressed by cooling the moderator to low temperatures.
2
Canonical Source: superfluid HeliumConcept extended to solids : D2 thin film “dirt” source
3
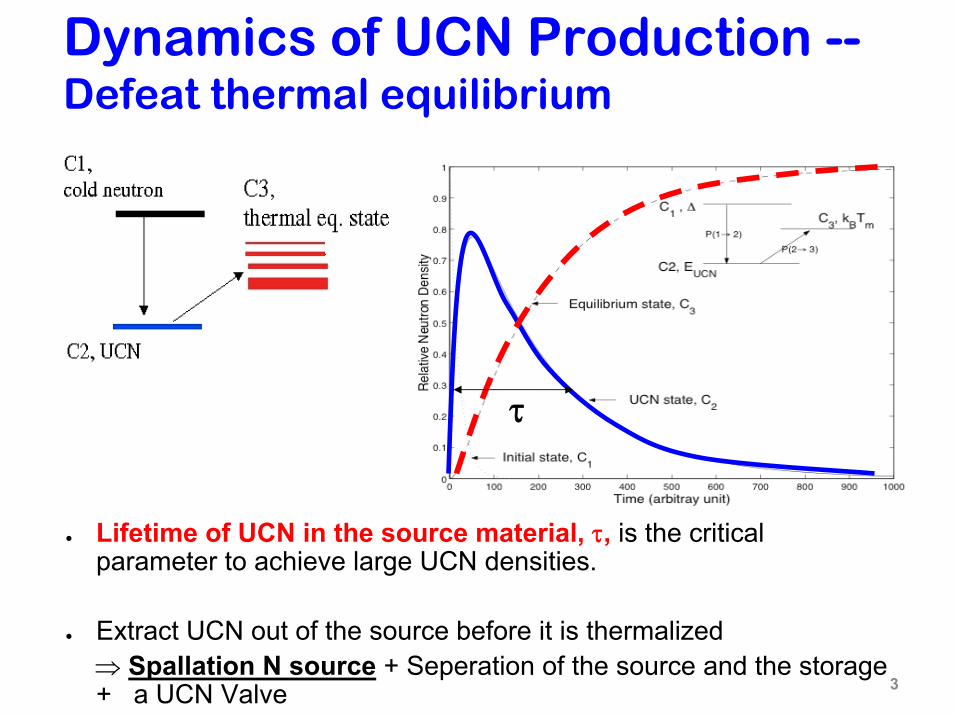
● Lifetime of UCN in the source material, τ, is the critical parameter to achieve large UCN densities.
● Extract UCN out of the source before it is thermalized ⇒ Spallation N source
Dynamics of UCN Production --Defeat thermal equilibrium
+ Seperation of the source and the storage + a UCN Valve
τ
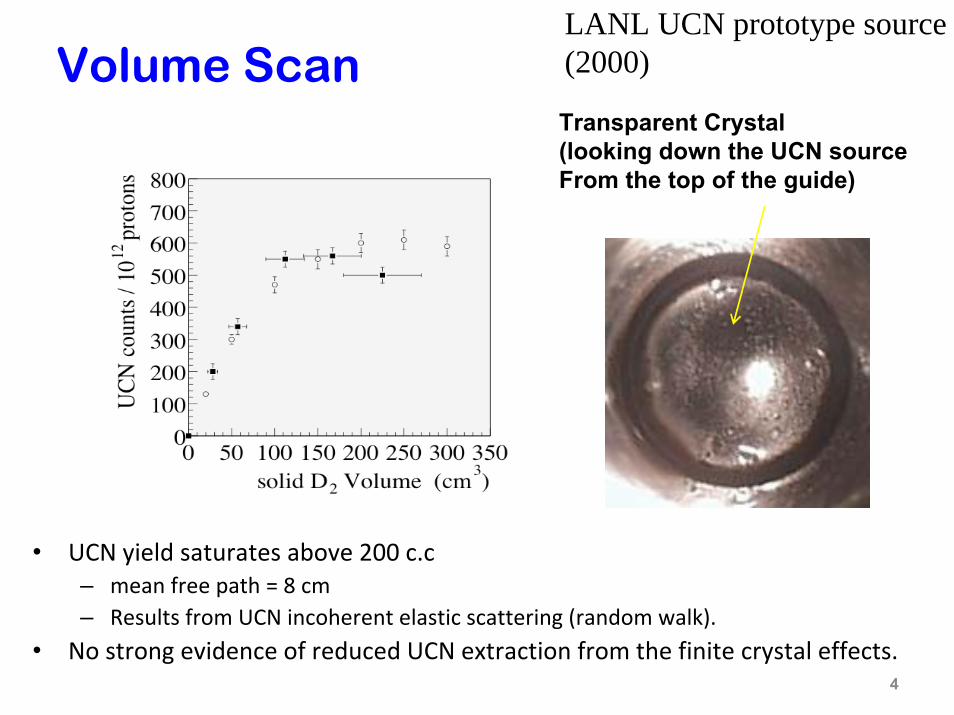
Volume Scan
• UCN yield saturates above 200 c.c – mean free path = 8 cm– Results from UCN incoherent elastic scattering (random walk).
• No strong evidence of reduced UCN extraction from the finite crystal effects.4
LANL UCN prototype source(2000)
Transparent Crystal(looking down the UCN sourceFrom the top of the guide)

5
• UCN density:(Limited by loss)
• The figure of merit:
Isotop σcoh σinc σa σs/σa purity Debye T
2D
5.59 2.04 0.000519 1.47×10
4 99.82 110
4He
1.13 0 0 ∞ 20
15N
5.23 0.0005 0.000024 2.1×10
5 99.9999 80
16O
4.23 0 0.00010 2.2×10
4 99.95 104
208Pb
11.7 0 0.00049 2.38×10
4 99.93
105
s a
⎟⎟⎠
⎞⎜⎜⎝
⎛∝× ...111 +
σ+
σ+
σστP=ρ
nucl.ab.βupdownucn
Good Candidate Material
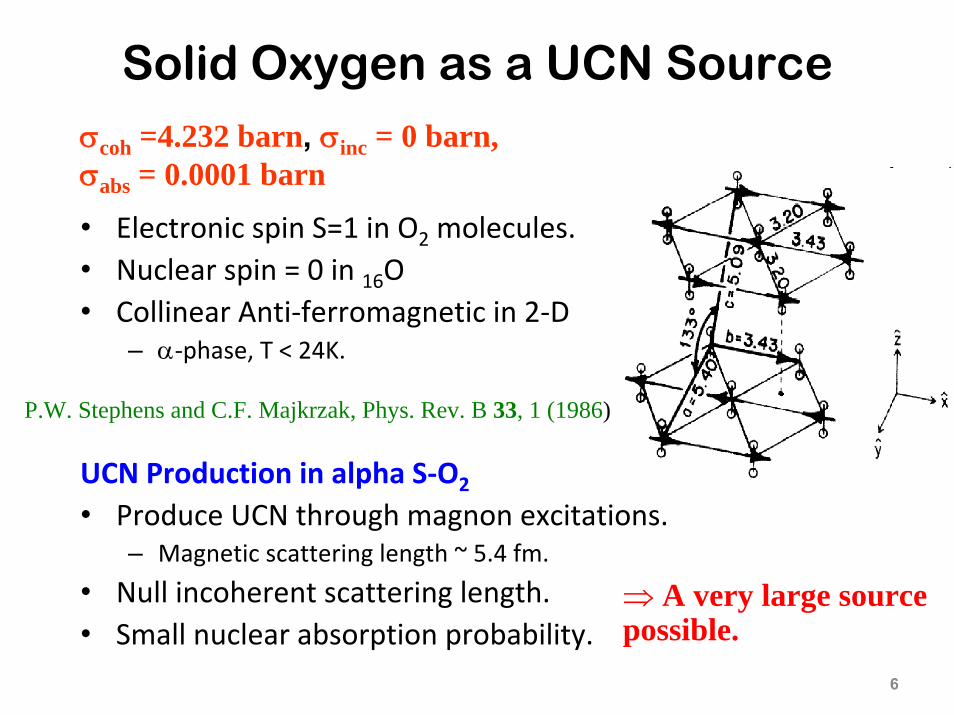
Solid Oxygen as a UCN Source
• Electronic spin S=1 in O2 molecules.• Nuclear spin = 0 in 16O• Collinear Anti‐ferromagnetic in 2‐D
– α‐phase, T < 24K.
UCN Production in alpha S‐O2
• Produce UCN through magnon excitations.– Magnetic scattering length ~ 5.4 fm.
• Null incoherent scattering length.• Small nuclear absorption probability.
6
P.W. Stephens and C.F. Majkrzak, Phys. Rev. B 33, 1 (1986)
⇒ A very large source possible.
σcoh =4.232 barn, σinc = 0 barn,σabs = 0.0001 barn

Neutron-Magnon Scattering in S-O2
• Magnon production energy gap ~ 0.8meV– Magnons partially frozen at T
< 8K.– Significantly reduce the UCN
upscattering rate.
7
0.8meV
Phonon Density of States
Magnon Density of States
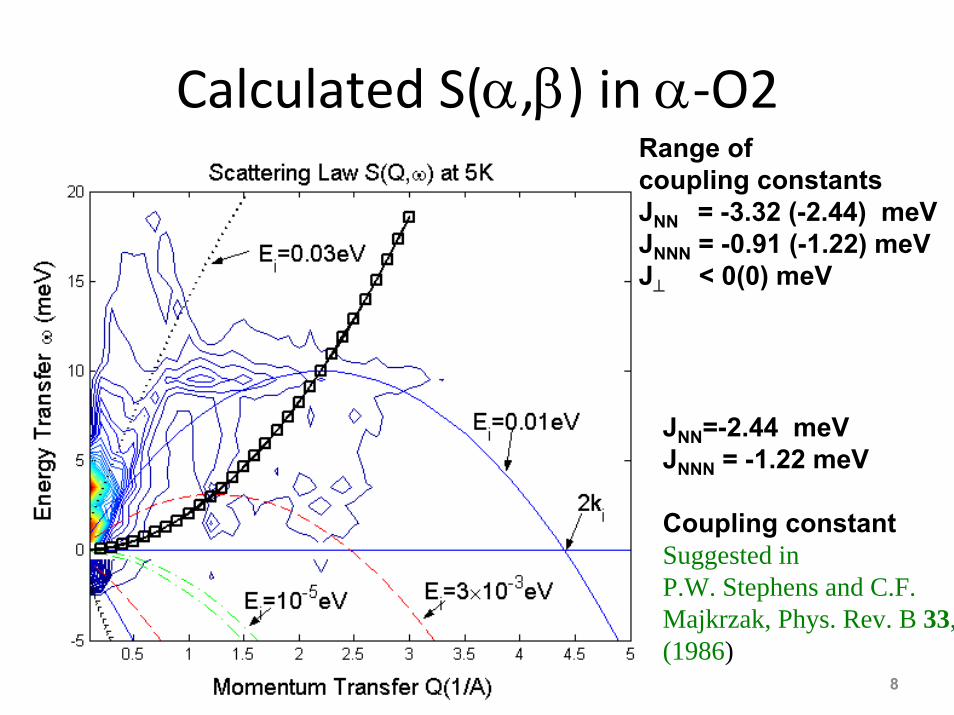
Calculated S(α,β) in α‐O2
8
JNN=-2.44 meVJNNN = -1.22 meV
Coupling constant Suggested in P.W. Stephens and C.F. Majkrzak, Phys. Rev. B 33,(1986)
Range of coupling constantsJNN = -3.32 (-2.44) meVJNNN = -0.91 (-1.22) meVJ⊥ < 0(0) meV
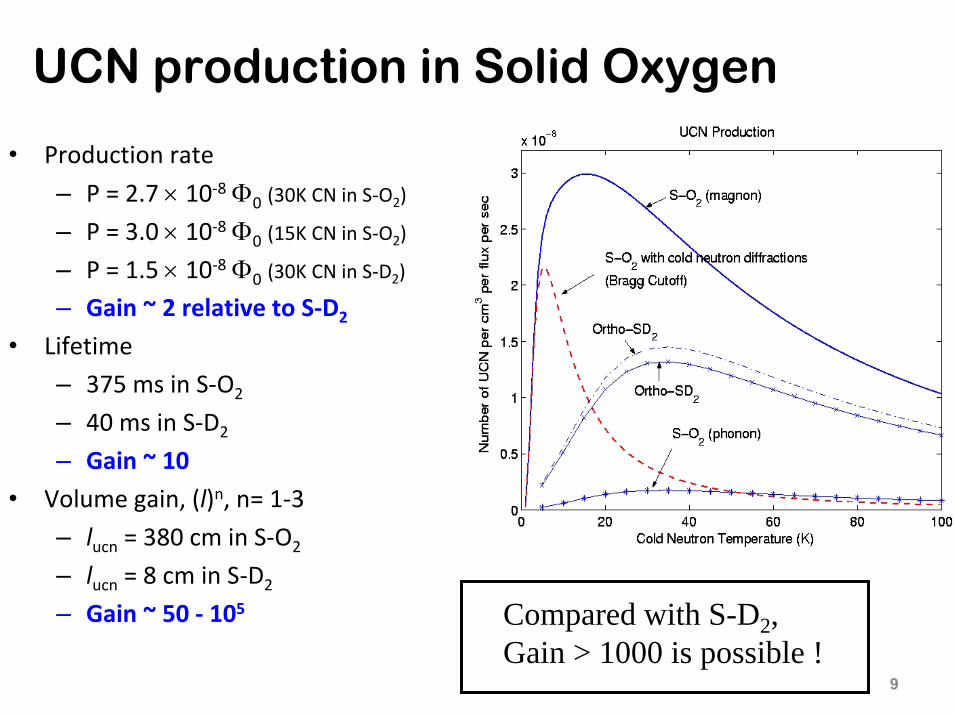
UCN production in Solid Oxygen
• Production rate
– P = 2.7 × 10‐8 Φ0 (30K CN in S‐O2)
– P = 3.0 × 10‐8 Φ0 (15K CN in S‐O2)
– P = 1.5 × 10‐8 Φ0 (30K CN in S‐D2)
– Gain ~ 2 relative to S‐D2
• Lifetime
– 375 ms in S‐O2
– 40 ms in S‐D2
– Gain ~ 10
• Volume gain, (l)n, n= 1‐3
– lucn = 380 cm in S‐O2
– lucn = 8 cm in S‐D2
– Gain ~ 50 ‐ 105
9
Compared with S-D2, Gain > 1000 is possible !
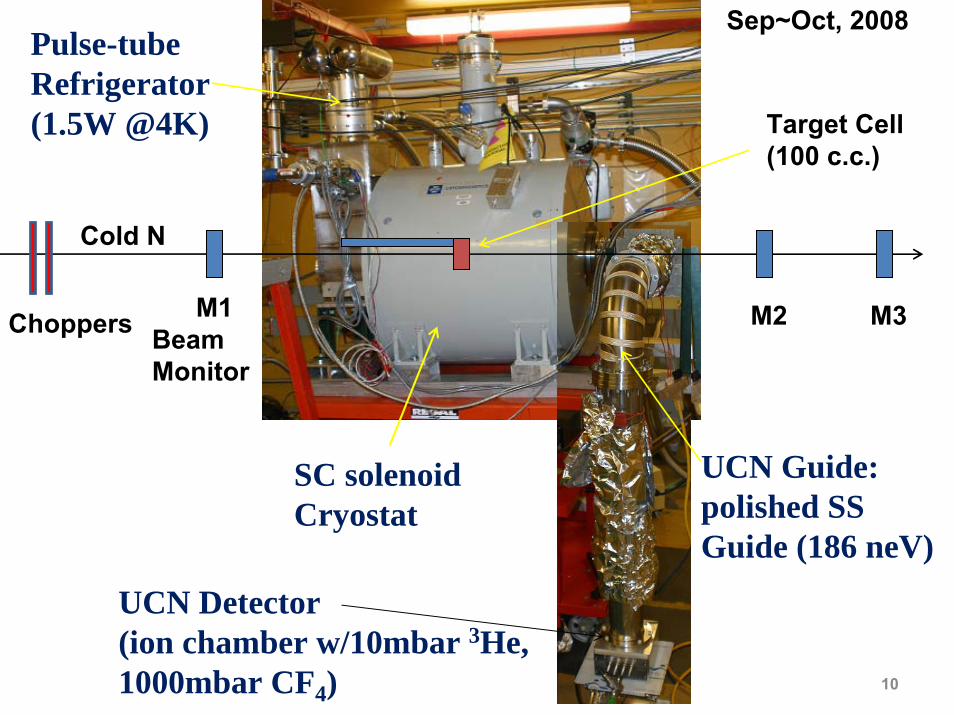
10
SC solenoid Cryostat
Pulse-tubeRefrigerator(1.5W @4K)
Cold N
M1BeamMonitor
M2 M3
UCN Guide:polished SS Guide (186 neV)
UCN Detector(ion chamber w/10mbar 3He, 1000mbar CF4)
Target Cell (100 c.c.)
Choppers
Sep~Oct, 2008

Low Statistics Measurements
Cold Neutrons~3×10⁶ n/cm2-s
M1 M2 M3
10 cm ∅
BG : 300 Hz
0.16 Hz
0.03 Hz
÷ 2000
÷ 5.3UCN signal rate ~ 0.34 Hz (D2)
0.15 Hz (O2)S/N ~ 5/1 for O2
Bird’s Eye View
B4CBorated PE
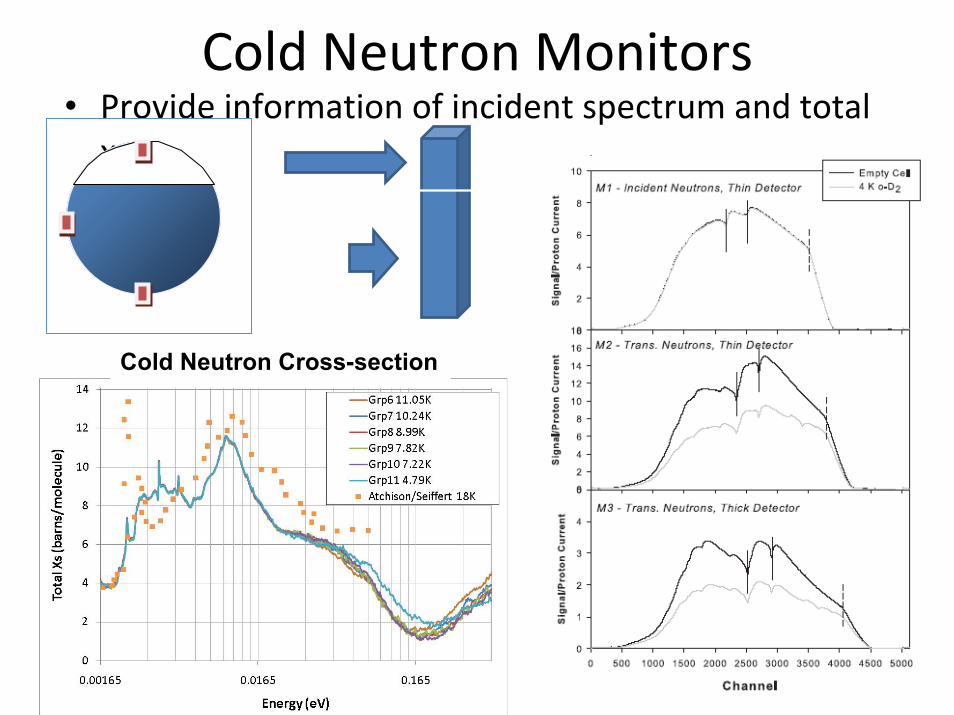
Cold Neutron Monitors• Provide information of incident spectrum and total xs
12
Cold Neutron Cross-section
A
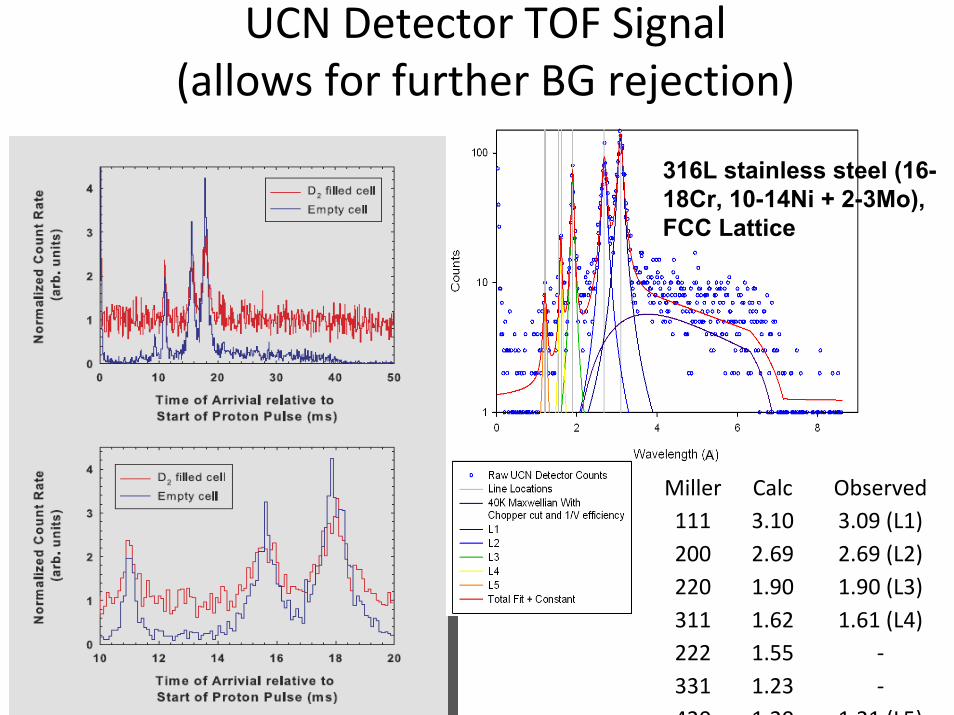
Miller Calc Observed111 3.10 3.09 (L1)200 2.69 2.69 (L2)220 1.90 1.90 (L3)311 1.62 1.61 (L4)222 1.55 ‐331 1.23 ‐420 1 20 1 21 (L5)
316L stainless steel (16-18Cr, 10-14Ni + 2-3Mo), FCC Lattice
UCN Detector TOF Signal(allows for further BG rejection)
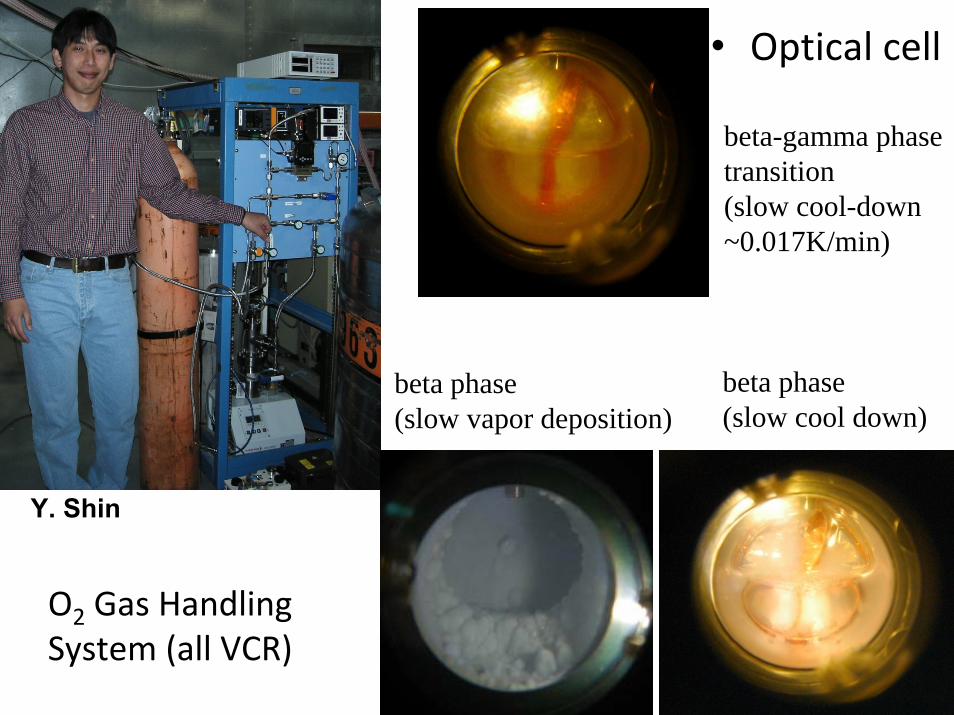
O2 Gas Handling System (all VCR)
• Optical cell
14
beta-gamma phase transition(slow cool-down~0.017K/min)
Y. Shin
beta phase (slow vapor deposition)
beta phase (slow cool down)

Comparison between D2 & O2
16
Source: 3.7 cm cell, 6 cm I.D., UCN extracted from downstream
Bears no significance in predicting the performance of a full-scale source.
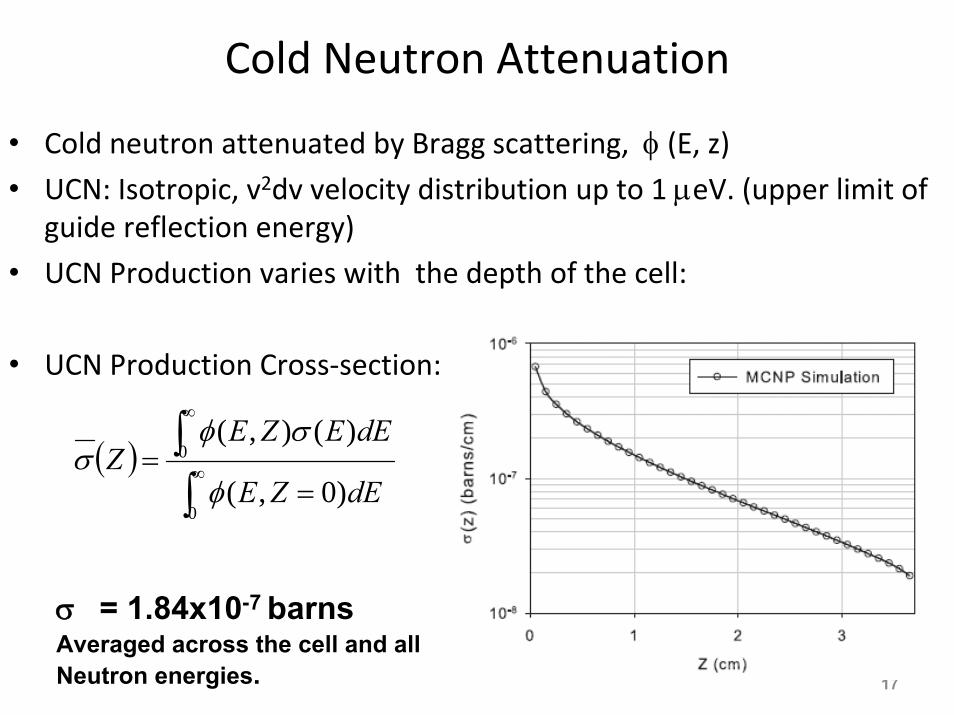
Cold Neutron Attenuation
• Cold neutron attenuated by Bragg scattering, φ (E, z)
• UCN: Isotropic, v2dv velocity distribution up to 1 μeV. (upper limit of guide reflection energy)
• UCN Production varies with the depth of the cell:
• UCN Production Cross‐section:
17
σ = 1.84x10⁻⁷ barnsAveraged across the cell and all Neutron energies.
( )∫∫
∞
∞
==
0
0
)0,(
)(),(
dEZE
dEEZEZ
φ
σφσ
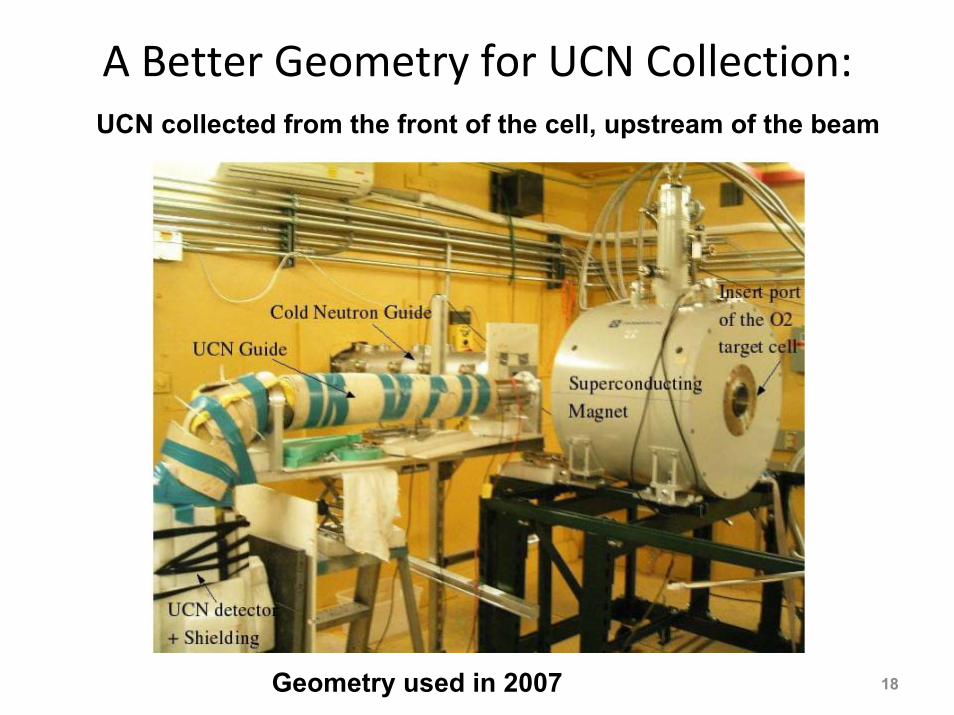
A Better Geometry for UCN Collection:
18
UCN collected from the front of the cell, upstream of the beam
Geometry used in 2007
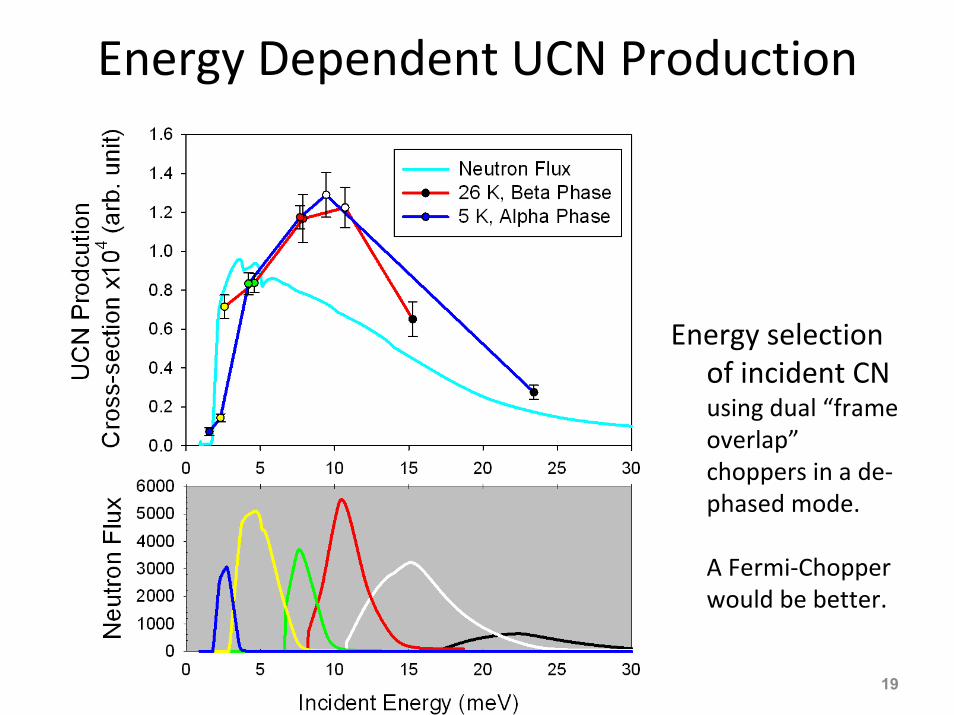
Energy Dependent UCN Production
Energy selection of incident CN using dual “frame overlap”choppers in a de‐phased mode.
A Fermi‐Chopper would be better.
19

20
DCS Measurement

21
DCS Measurement
22
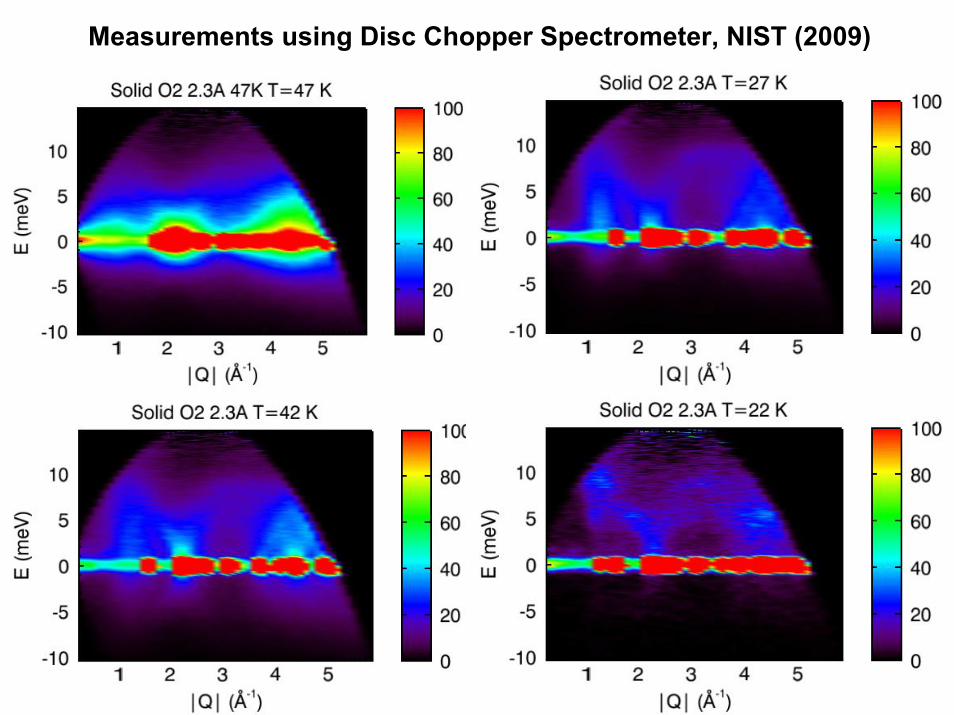
Measurements using Disc Chopper Spectrometer, NIST (2009)
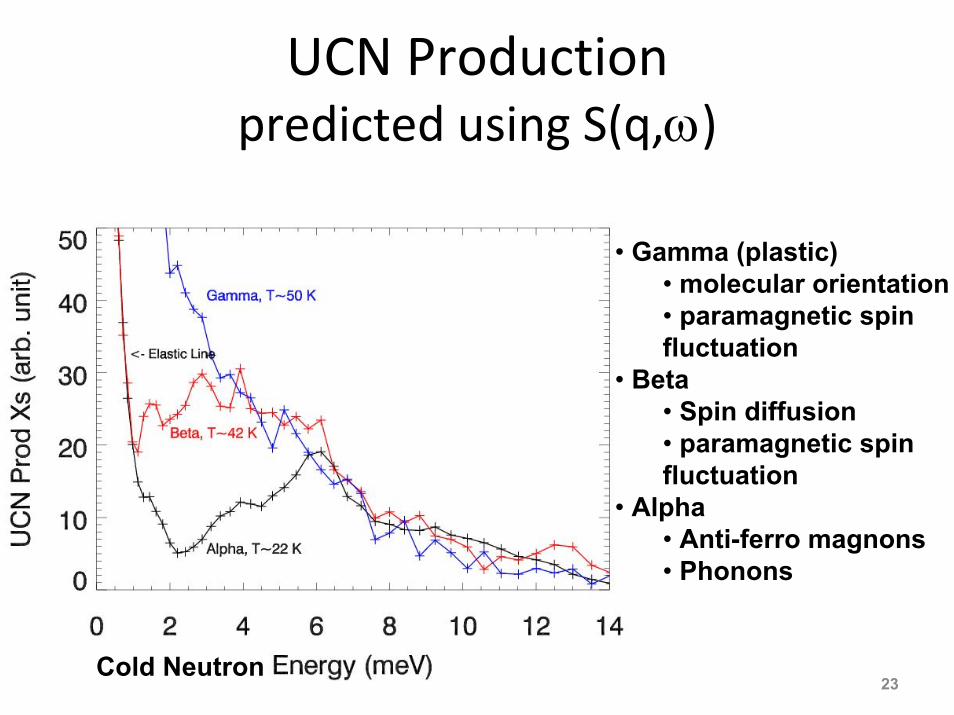
UCN Production predicted using S(q,ω)
23
• Gamma (plastic)• molecular orientation• paramagnetic spin fluctuation
• Beta• Spin diffusion• paramagnetic spin fluctuation
• Alpha• Anti-ferro magnons• Phonons
Cold Neutron
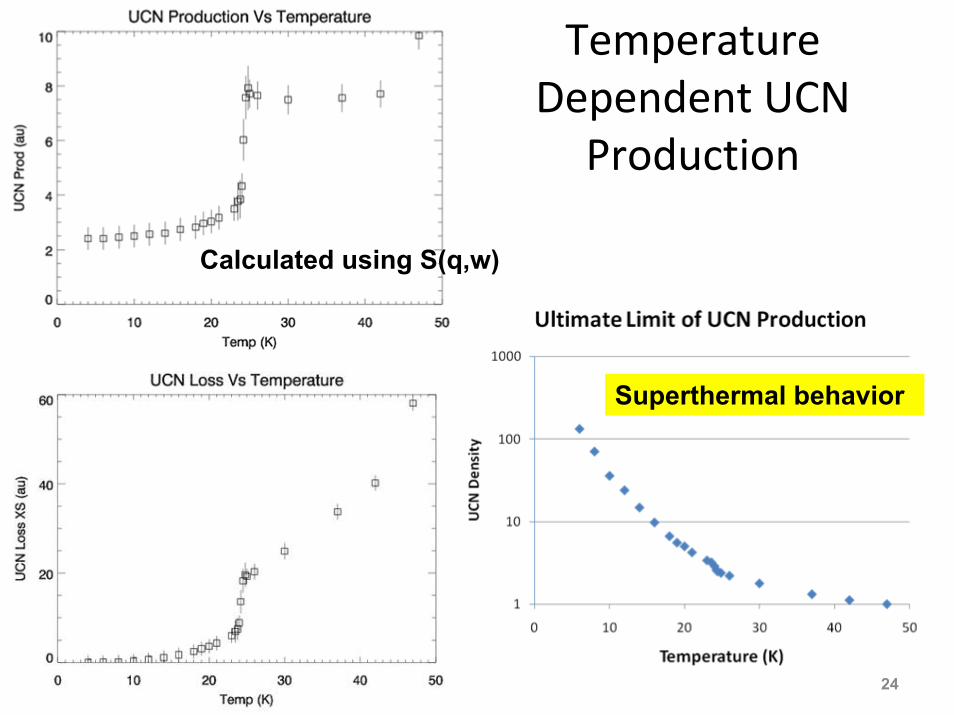
Temperature Dependent UCN
Production
24
Calculated using S(q,w)
Superthermal behavior

Volume Dependence
25
small
medium
large ??
α-O2
Note that the UCN production in the β-phase is already saturated.
α-O2 β-O2 γ-O2
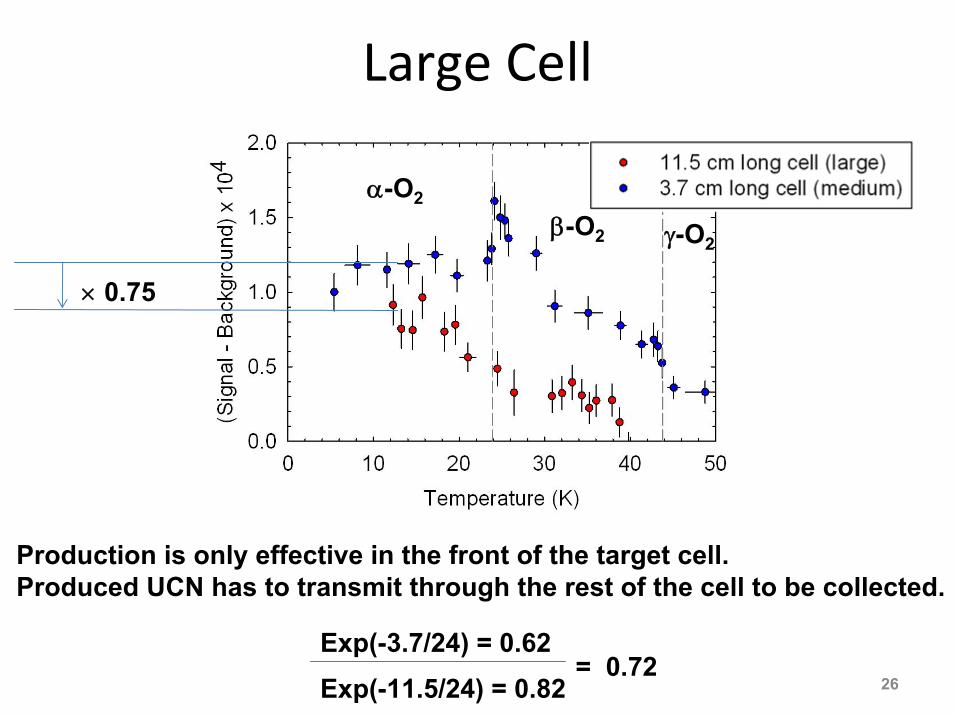
Large Cell
26
× 0.75
Exp(-3.7/24) = 0.62Exp(-11.5/24) = 0.82
= 0.72
Production is only effective in the front of the target cell.Produced UCN has to transmit through the rest of the cell to be collected.
α-O2
β-O2 γ-O2
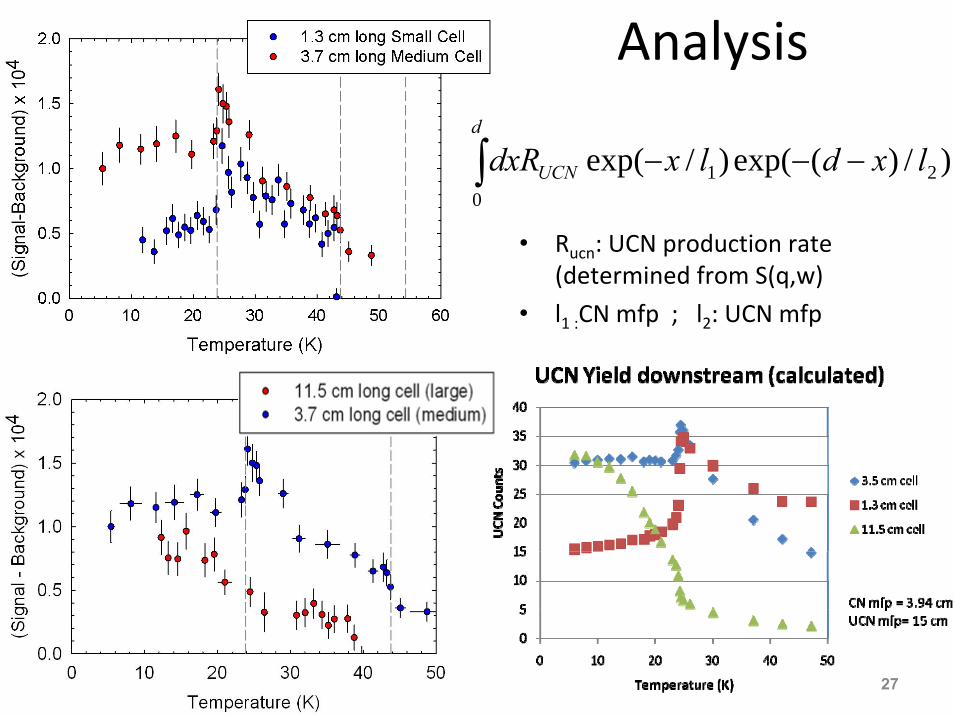
Analysis
• Rucn: UCN production rate (determined from S(q,w)
• l1 :CN mfp ; l2: UCN mfp
27
∫ −−−d
UCN lxdlxdxR0
21 )/)(exp()/exp(
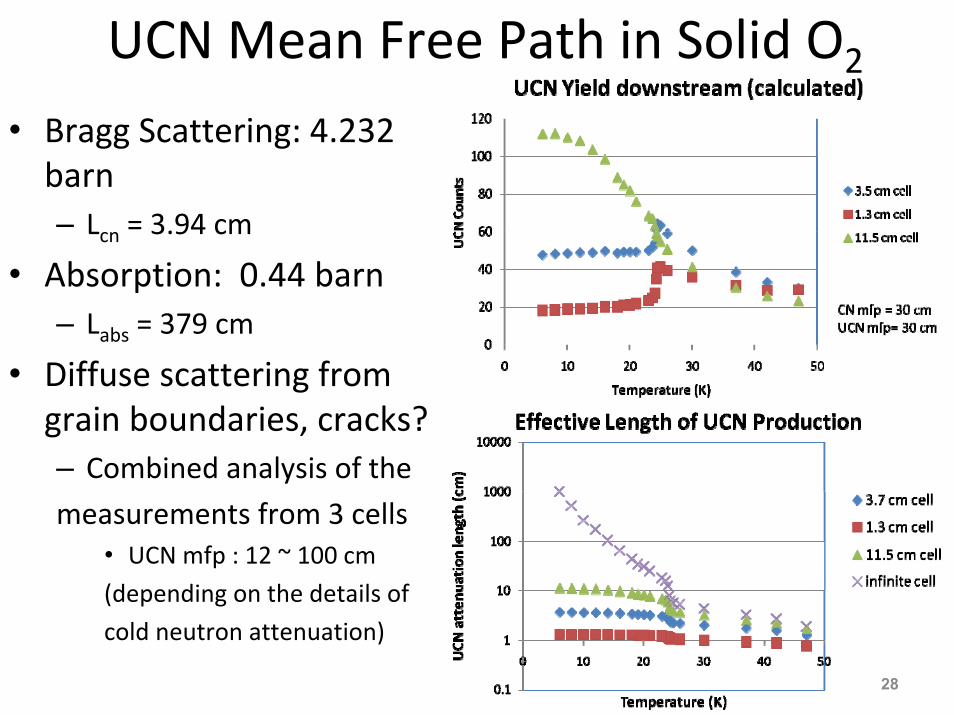
UCN Mean Free Path in Solid O2
• Bragg Scattering: 4.232 barn– Lcn = 3.94 cm
• Absorption: 0.44 barn – Labs = 379 cm
• Diffuse scattering from grain boundaries, cracks?– Combined analysis of the
measurements from 3 cells• UCN mfp : 12 ~ 100 cm
(depending on the details of
cold neutron attenuation)
28
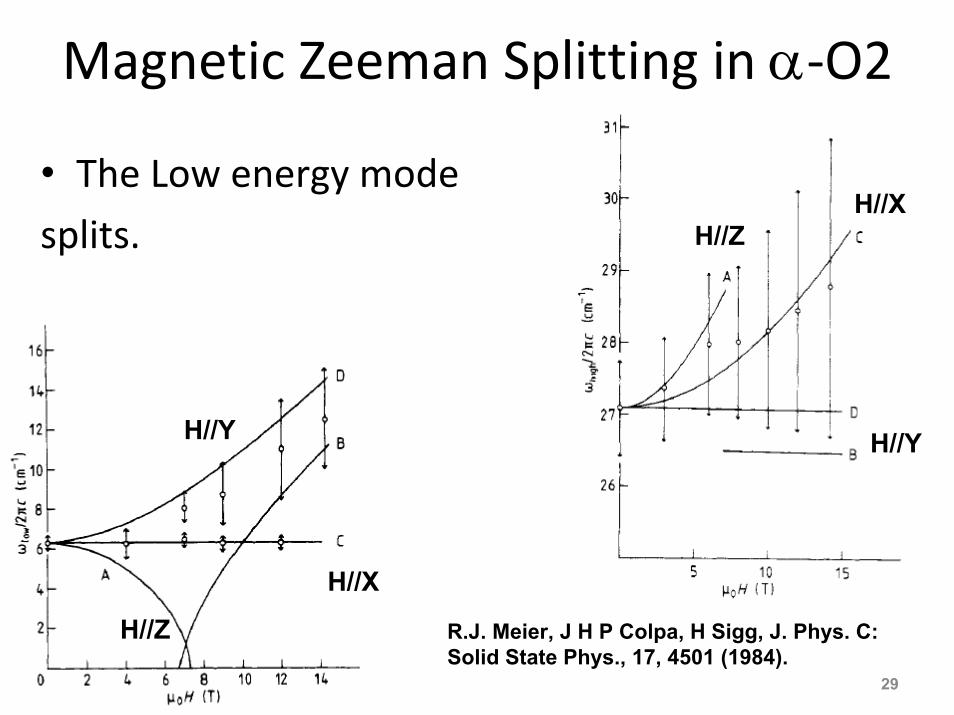
Magnetic Zeeman Splitting in α‐O2
• The Low energy mode
splits.
29
R.J. Meier, J H P Colpa, H Sigg, J. Phys. C: Solid State Phys., 17, 4501 (1984).
H//Z
H//Y
H//X
H//ZH//X
H//Y
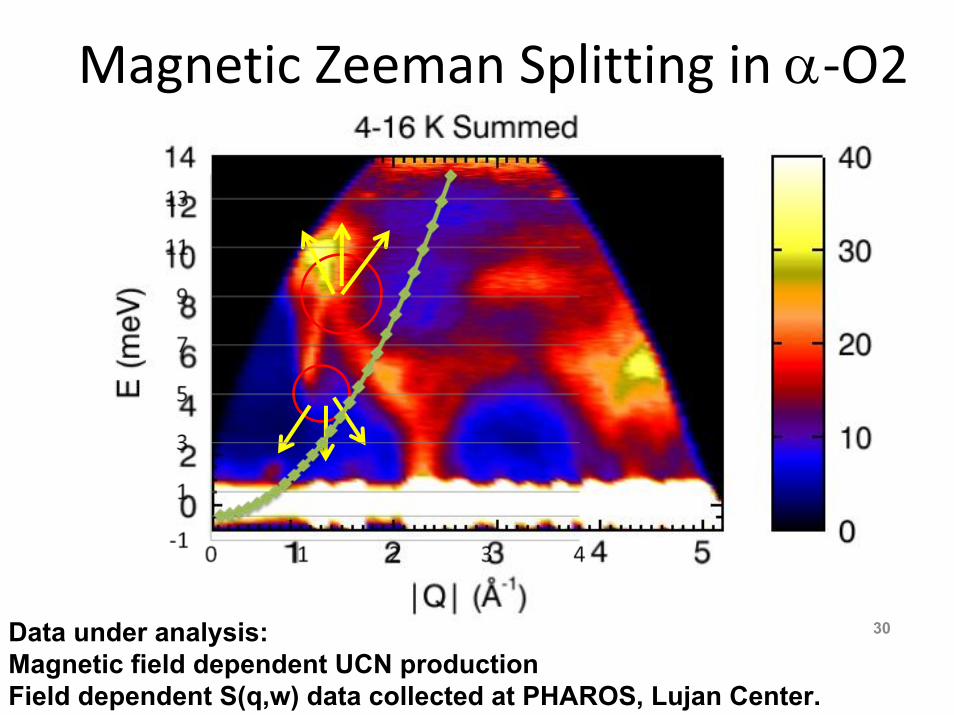
Magnetic Zeeman Splitting in α‐O2
30Data under analysis:Magnetic field dependent UCN productionField dependent S(q,w) data collected at PHAROS, Lujan Center.

Summaries on O2 UCN Source
• β‐O2 has large downscattering (upscattering) cross‐sections– Thin film source (< 2 cm)
• α‐O2 has a smaller UCN cross‐section– UCN Upscattering length > 10 cm (for T < 20K)
– In order to see the superthermal behavior, we need a cell with length > 10 cm.
• Volume scaling is non‐trivial– Bragg scattering of cold neutrons limit the size of the UCN source (especially important for coherent scatters)
– However, one could use a geometry to use multiple‐Bragg scattering and increase the effective length of the source.31
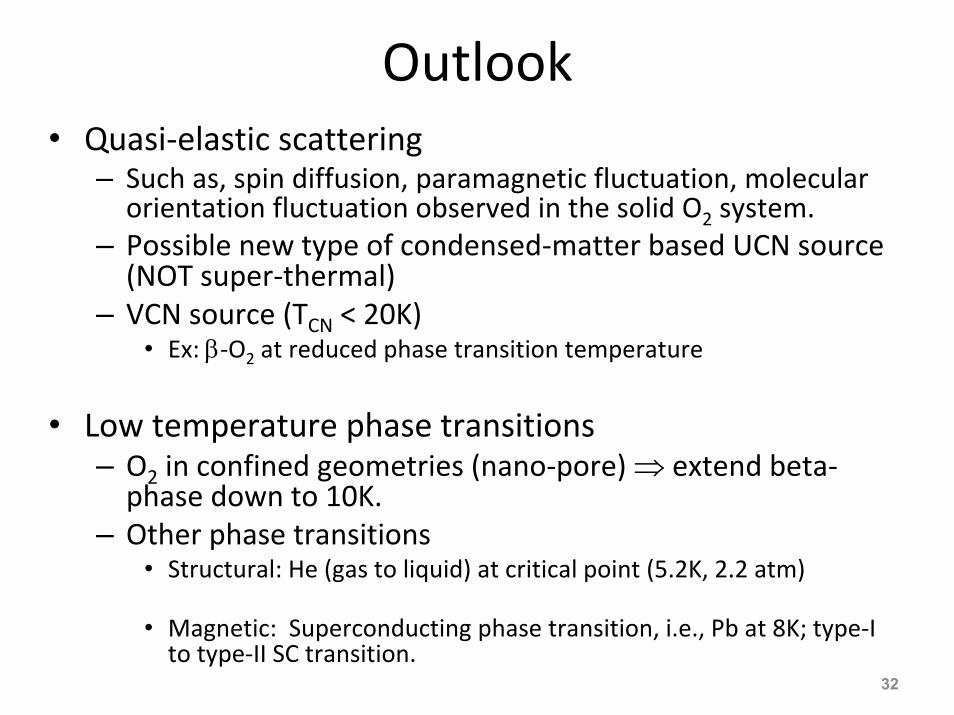
Outlook• Quasi‐elastic scattering
– Such as, spin diffusion, paramagnetic fluctuation, molecular orientation fluctuation observed in the solid O2 system.
– Possible new type of condensed‐matter based UCN source (NOT super‐thermal)
– VCN source (TCN < 20K)• Ex: β‐O2 at reduced phase transition temperature
• Low temperature phase transitions– O2 in confined geometries (nano‐pore) ⇒ extend beta‐phase down to 10K.
– Other phase transitions• Structural: He (gas to liquid) at critical point (5.2K, 2.2 atm)
• Magnetic: Superconducting phase transition, i.e., Pb at 8K; type‐I to type‐II SC transition.
32
Summaries• First observation of UCN production from magnetic excitation.
• Solid Oxygen has comparable UCN production to solid deuterium. If “properly designed”, its low absorption and long UCN lifetime continue to make it an attractive candidate for an intense UCN source.– Large dimension source (1mx1mx1m) is challenging. Cold neutrons don’t penetrate deep inside the source, because of Bragg scatterings.
– The effective large dimension could be achieved with the “flux trap” idea.
33
Our Group at IUCF
Ultra-Cold Neutrons, Neutron EDM, Electron EDM34

Backup Slides
35
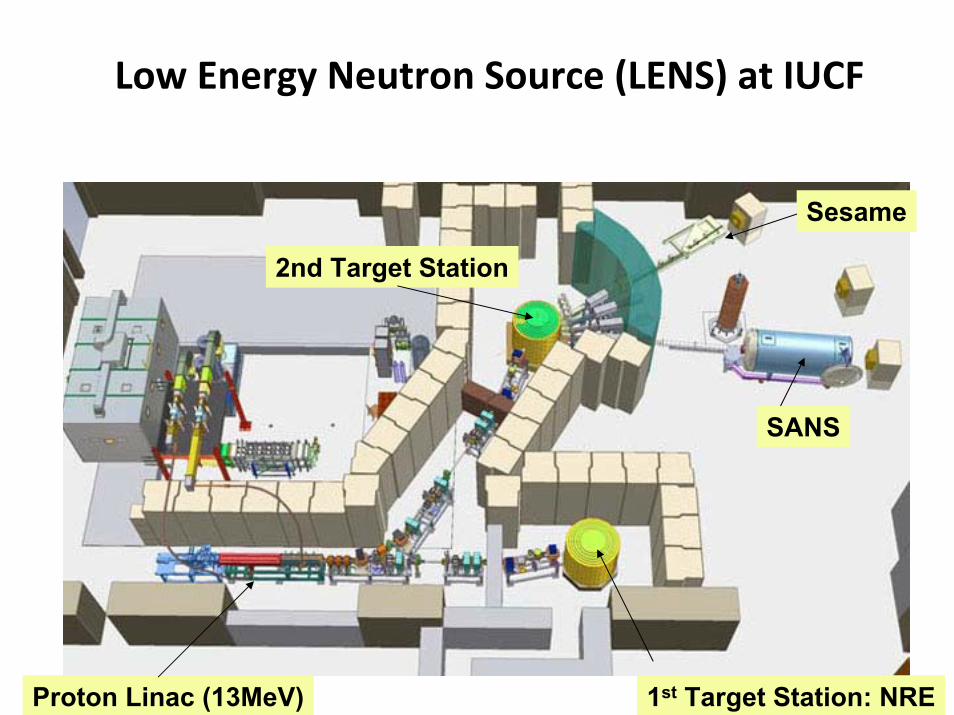
Low Energy Neutron Source (LENS) at IUCF
36Proton Linac (13MeV) 1st Target Station: NRE
2nd Target Station
SANS
Sesame
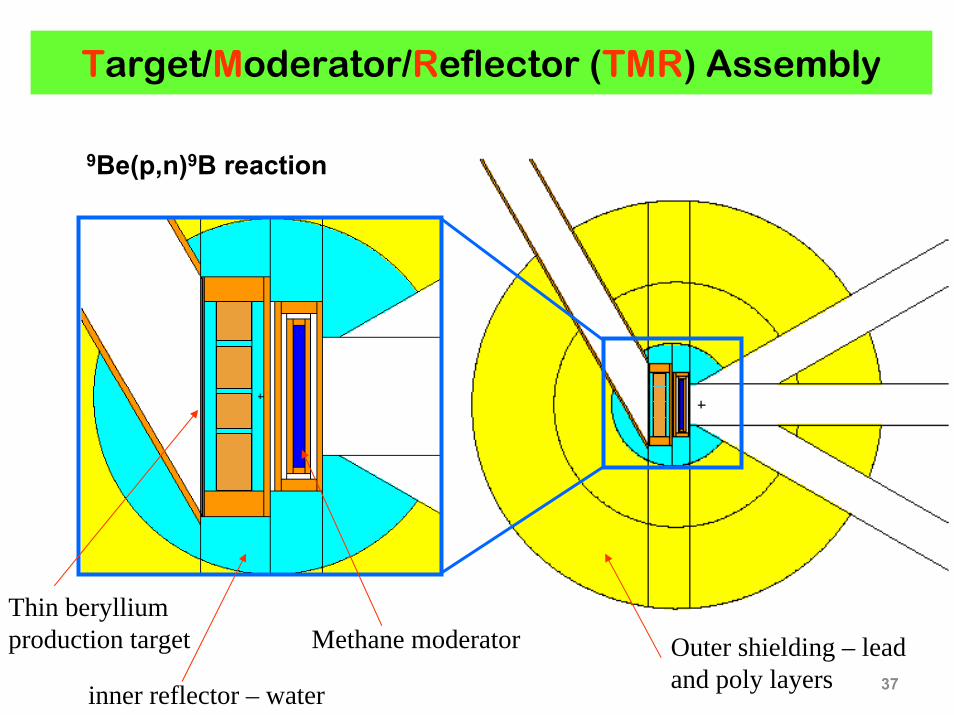
Target/Moderator/Reflector (TMR) Assembly
37
Thin beryllium production target Methane moderator Outer shielding – lead
and poly layersinner reflector – water
9Be(p,n)9B reaction
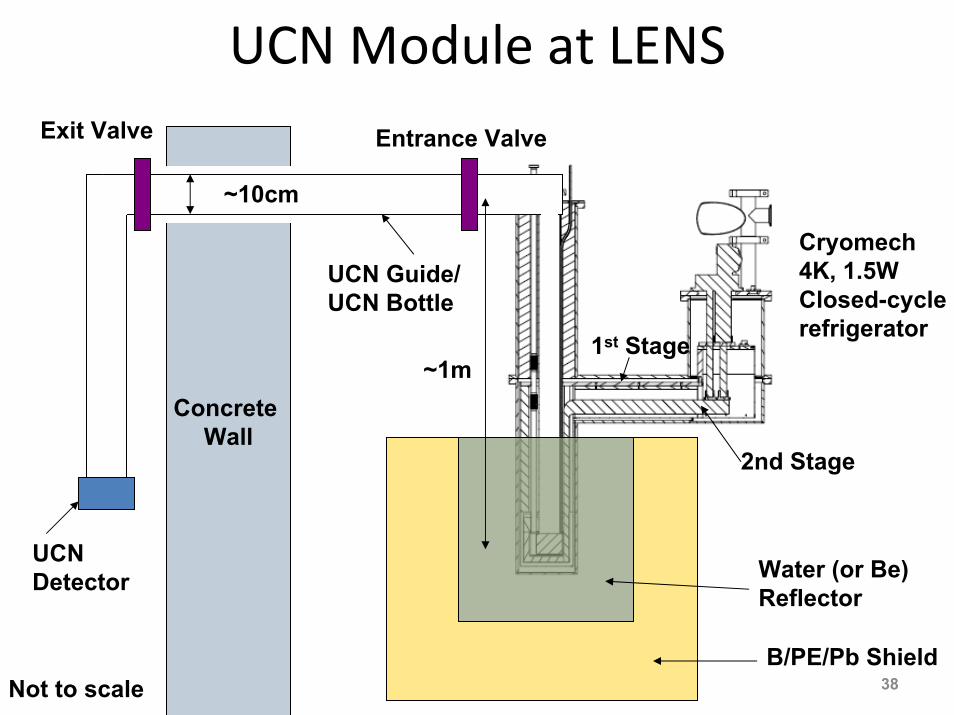
UCN Module at LENS
38
Concrete Wall
Cryomech4K, 1.5WClosed-cyclerefrigerator
2nd Stage
1st Stage
Water (or Be)Reflector
UCN Guide/UCN Bottle
UCN Detector
B/PE/Pb Shield
~1m
~10cm
Entrance ValveExit Valve
Not to scale

Kernel of the UCN Module
39
Beryllium Reflector
Water cooled production target
(Phase II LENS)
4K Polyethylene
Cold Flux Trap
Solid Oxygen UCN Converter

0.00E+005.00E-051.00E-041.50E-042.00E-042.50E-043.00E-043.50E-044.00E-044.50E-04
-20 -15 -10 -5 0 5 10 15 20
Y Position (cm)
0-5
meV
Flu
x (n
/cm
^2/s
rc) mAscm
nsrccm
n⋅⋅
×→⋅
× −2
102
4 108.1108.3
40
Using a 2.0 cm thick trap, 1000 cc solid oxygen source we can model the volume average cold flux in the oxygen as a function of position. 1 cm left of center is optimal.
The peak cold flux is MCNP by C. Lavelle
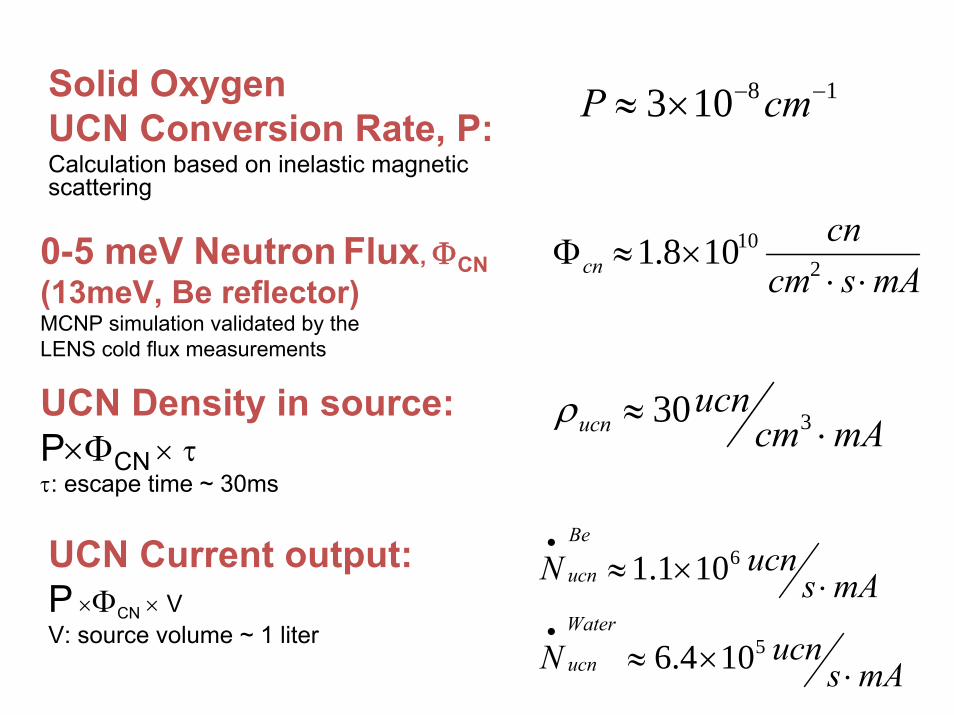
18103 −−×≈ cmP
mAcmucn
ucn ⋅≈ 330ρ
41
mAscmcn
cn ⋅⋅×≈Φ 2
10108.1
Solid Oxygen UCN Conversion Rate, P:Calculation based on inelastic magnetic scattering
0-5 meV Neutron Flux, ΦCN(13meV, Be reflector)MCNP simulation validated by theLENS cold flux measurements
UCN Density in source:P×ΦCN × ττ: escape time ~ 30ms
UCN Current output:P ×ΦCN × VV: source volume ~ 1 liter
mAsucnN
mAsucnN
Water
ucn
Be
ucn
⋅×≈
⋅×≈
•
•
5
6
104.6
101.1
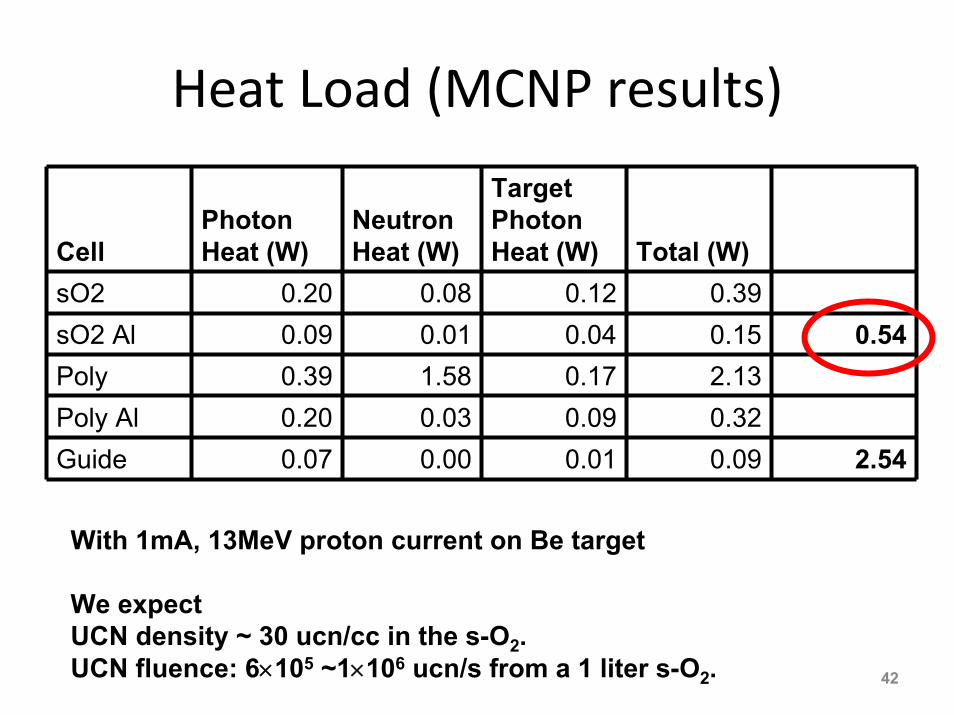
Heat Load (MCNP results)
CellPhoton Heat (W)
Neutron Heat (W)
Target Photon Heat (W) Total (W)
sO2 0.20 0.08 0.12 0.39sO2 Al 0.09 0.01 0.04 0.15 0.54Poly 0.39 1.58 0.17 2.13Poly Al 0.20 0.03 0.09 0.32Guide 0.07 0.00 0.01 0.09 2.54
42
With 1mA, 13MeV proton current on Be target
We expect UCN density ~ 30 ucn/cc in the s-O2.UCN fluence: 6×10⁵ ~1×10⁶ ucn/s from a 1 liter s-O2.
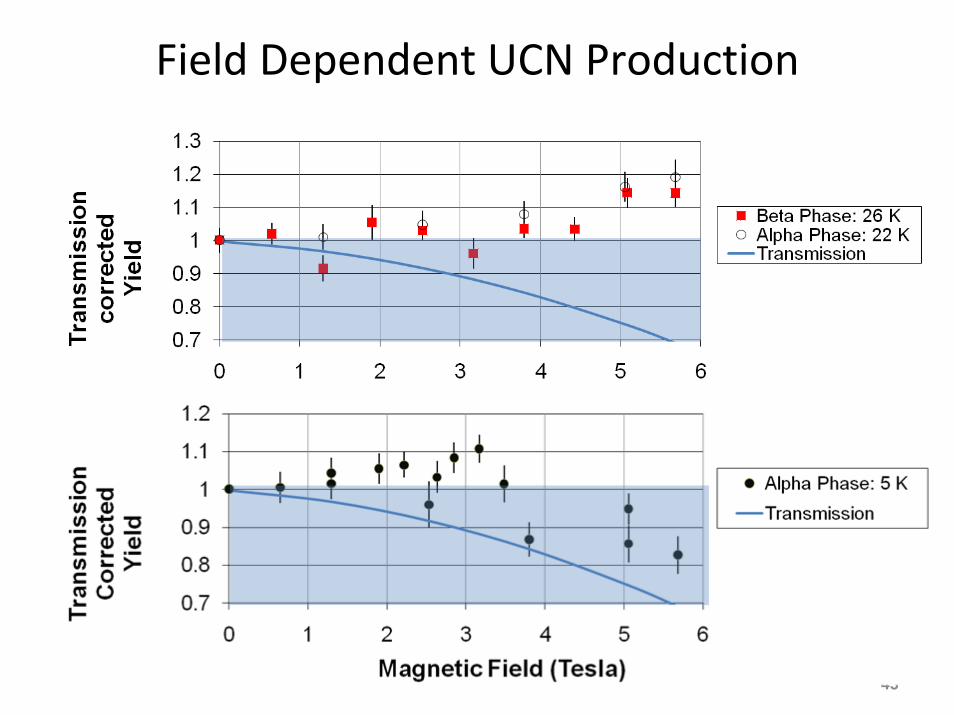
Field Dependent UCN Production
43
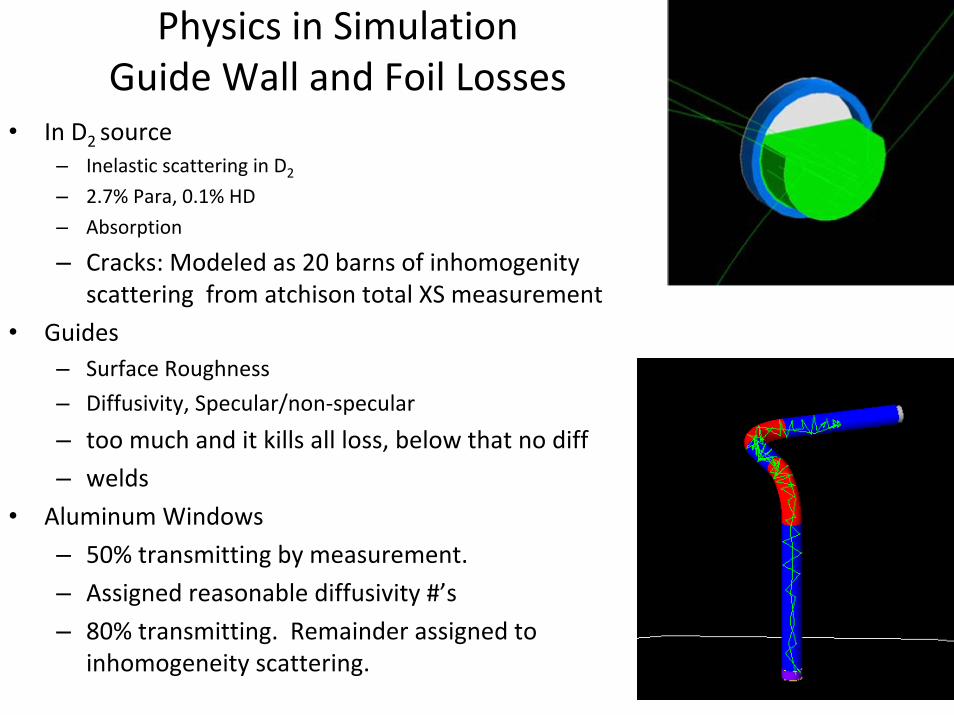
Physics in Simulation Guide Wall and Foil Losses
• In D2 source– Inelastic scattering in D2
– 2.7% Para, 0.1% HD
– Absorption
– Cracks: Modeled as 20 barns of inhomogenity scattering from atchison total XS measurement
• Guides – Surface Roughness
– Diffusivity, Specular/non‐specular
– too much and it kills all loss, below that no diff
– welds
• Aluminum Windows
– 50% transmitting by measurement.
– Assigned reasonable diffusivity #’s
– 80% transmitting. Remainder assigned to inhomogeneity scattering.
44
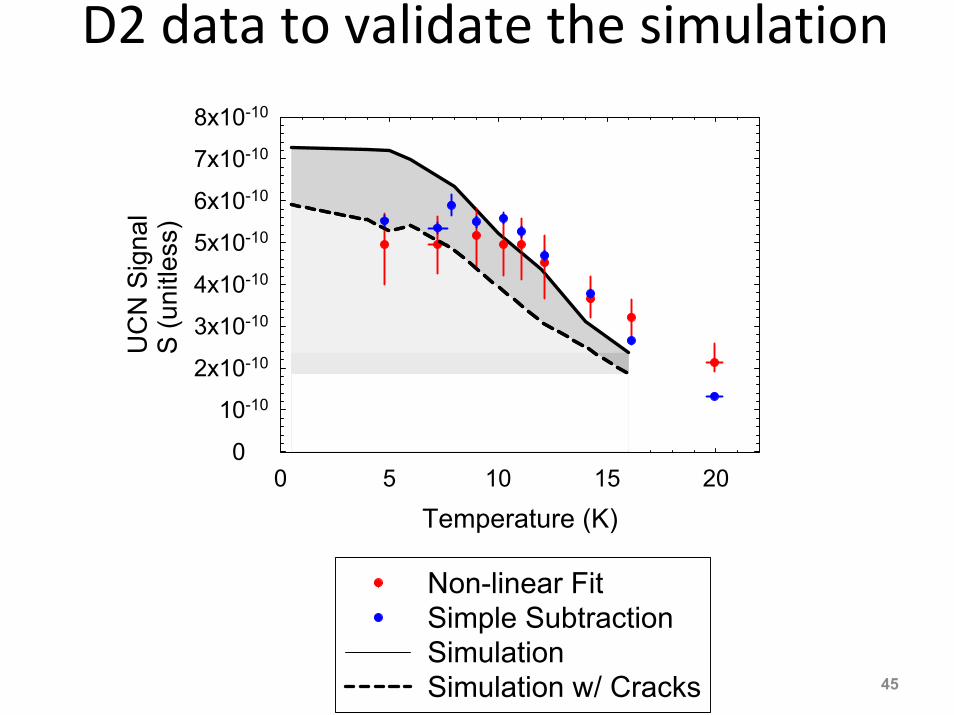
D2 data to validate the simulation
45
Temperature (K)0 5 10 15 20
UC
N S
igna
lS
(uni
tless
)
0
10-10
2x10⁻¹⁰
3x10⁻¹⁰
4x10⁻¹⁰
5x10⁻¹⁰
6x10⁻¹⁰
7x10⁻¹⁰
8x10⁻¹⁰
Non-linear FitSimple SubtractionSimulationSimulation w/ Cracks

UCN Production Rate
46
• Cold Neutron Flux8×106 n/cm2-s (S. Penttila)
• Detector efficiency– 80% under the full energy peak
– 50% transmission
• Guide transport efficiency (Geant4 simulation)– 6% with Al cell (0.010” thick) + 2 meters of SS guide
• UCN production rate:
0.15 /s = (8×10⁶ n/cm2‐s) × P × 100 cm3 × 0.8 × 0.5 × 0.06P ≈ 0.8 × 10‐8 Φ ucn/cm3‐s : agrees with the calculation
47
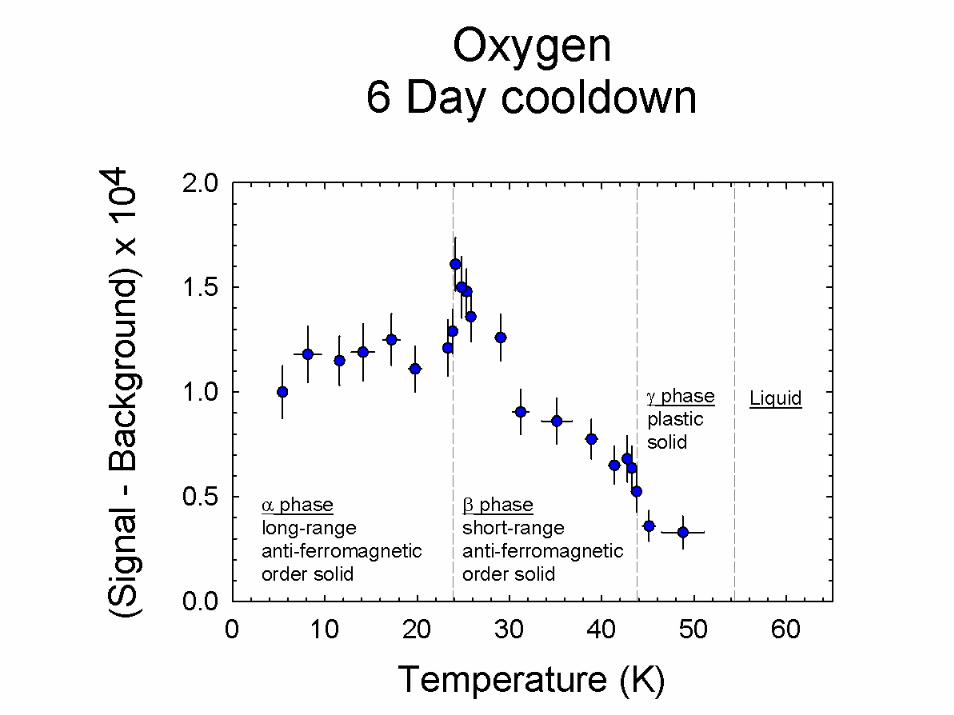
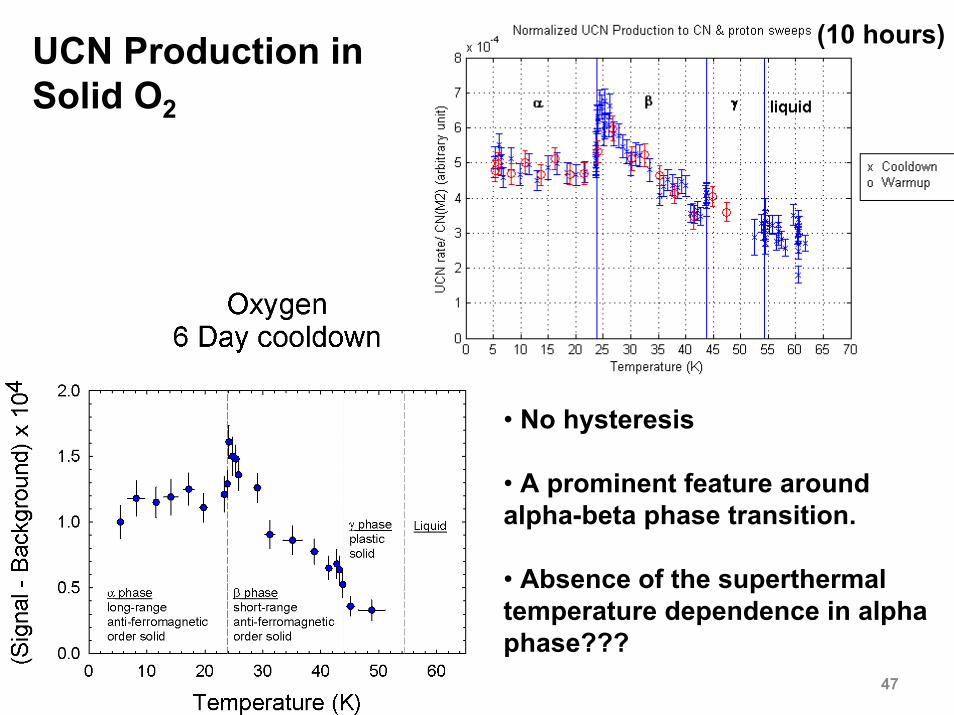
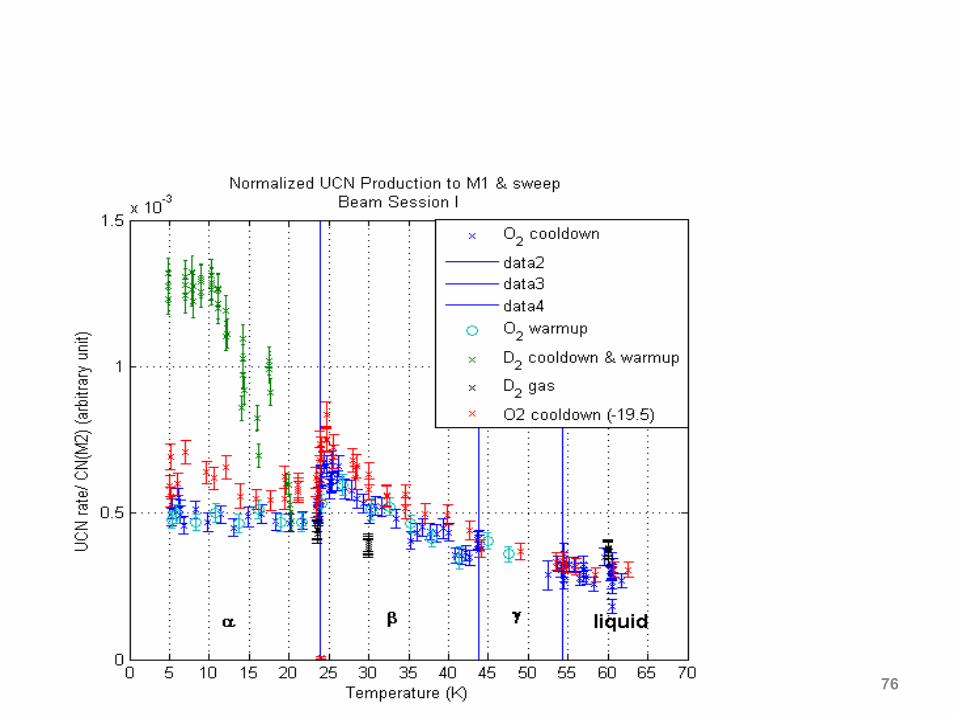
• No hysteresis
• A prominent feature around alpha-beta phase transition.
• Absence of the superthermal temperature dependence in alpha phase???
UCN Production in Solid O2
(10 hours)

Magnetic Critical Scattering
48
Frequency spectrum of the spontaneous fluctuations in magnetization??? W. Marshall, R.D. Lowde
“magnetic correlations and neutron scattering”
UCN productionIn our geometry
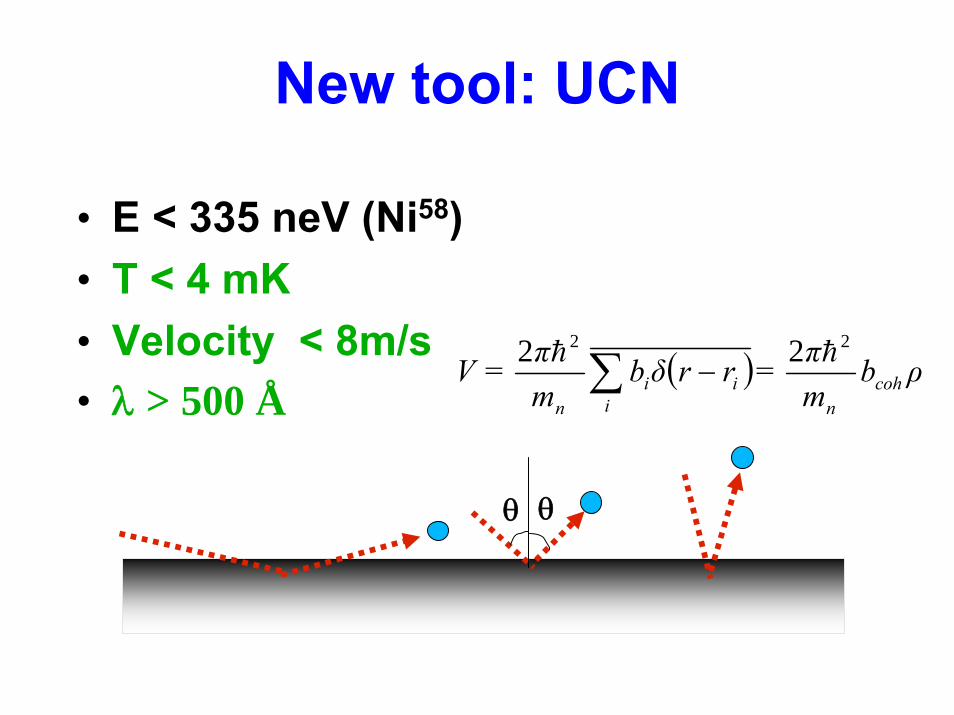
New tool: UCN
θ θ
• E < 335 neV (Ni58) • T < 4 mK• Velocity < 8m/s• λ > 500 Å
( ) ρbmπ=rrδb
mπ=V coh
niii
n
22 22 hh ∑ −
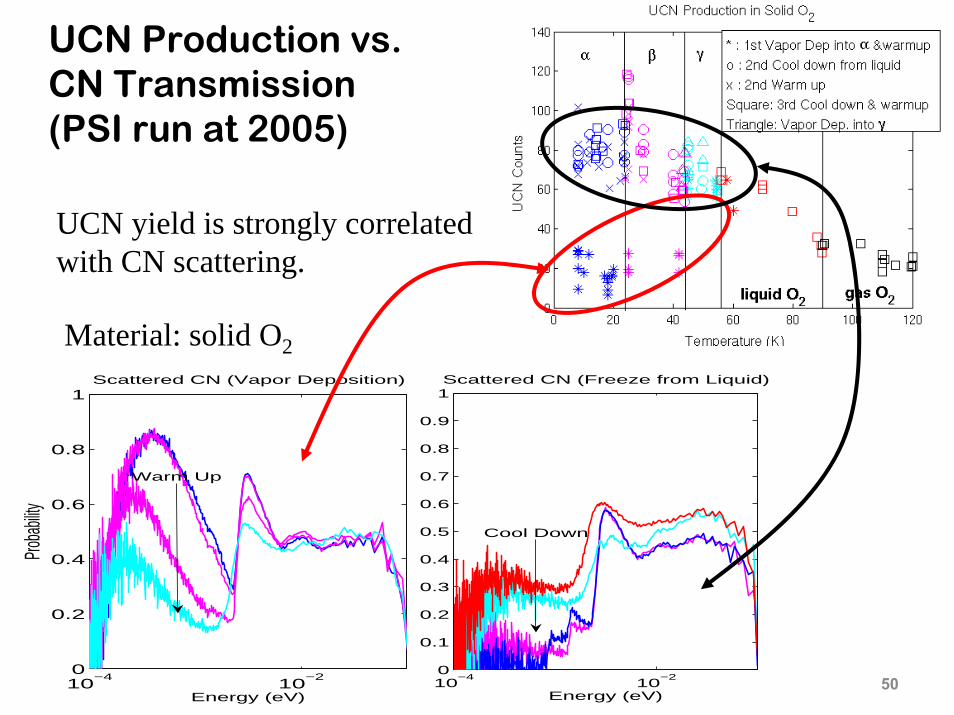
UCN Production vs. CN Transmission(PSI run at 2005)
5010−4
10−2
0
0.2
0.4
0.6
0.8
1
Energy (eV)
Proba
bility
Scattered CN (Vapor Deposition)
10−4
10−2
0
0.1
0.2
0.3
0.4
0.5
0.6
0.7
0.8
0.9
1
Energy (eV)
Scattered CN (Freeze from Liquid)
Warm Up
Cool Down
UCN yield is strongly correlated with CN scattering.
Material: solid O2
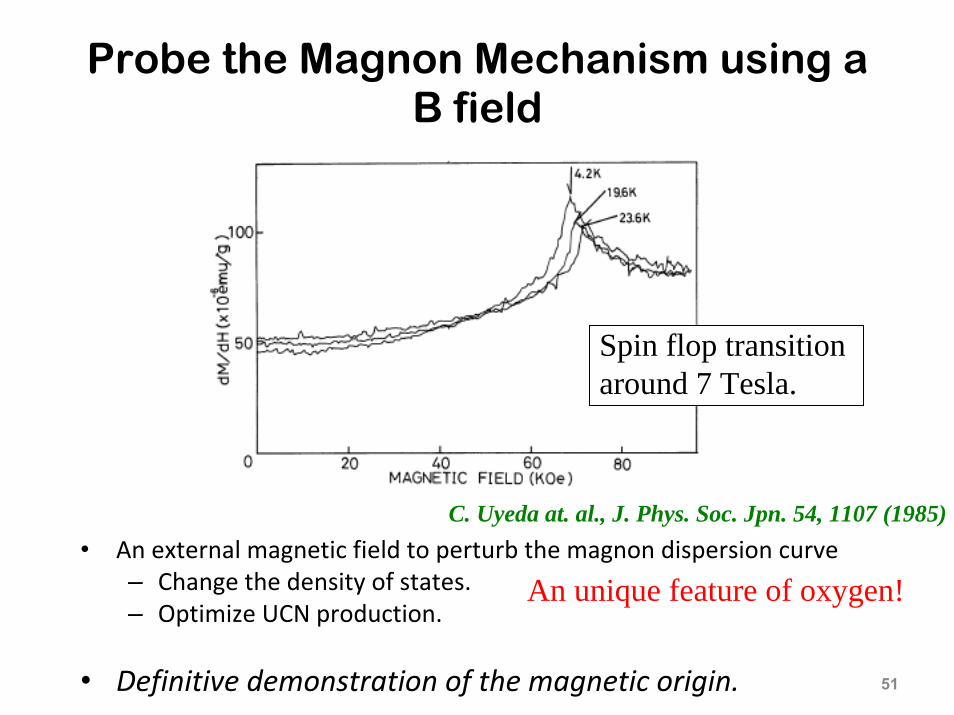
Probe the Magnon Mechanism using a B field
• An external magnetic field to perturb the magnon dispersion curve– Change the density of states.– Optimize UCN production.
• Definitive demonstration of the magnetic origin. 51
C. Uyeda at. al., J. Phys. Soc. Jpn. 54, 1107 (1985)
An unique feature of oxygen!
Spin flop transition around 7 Tesla.
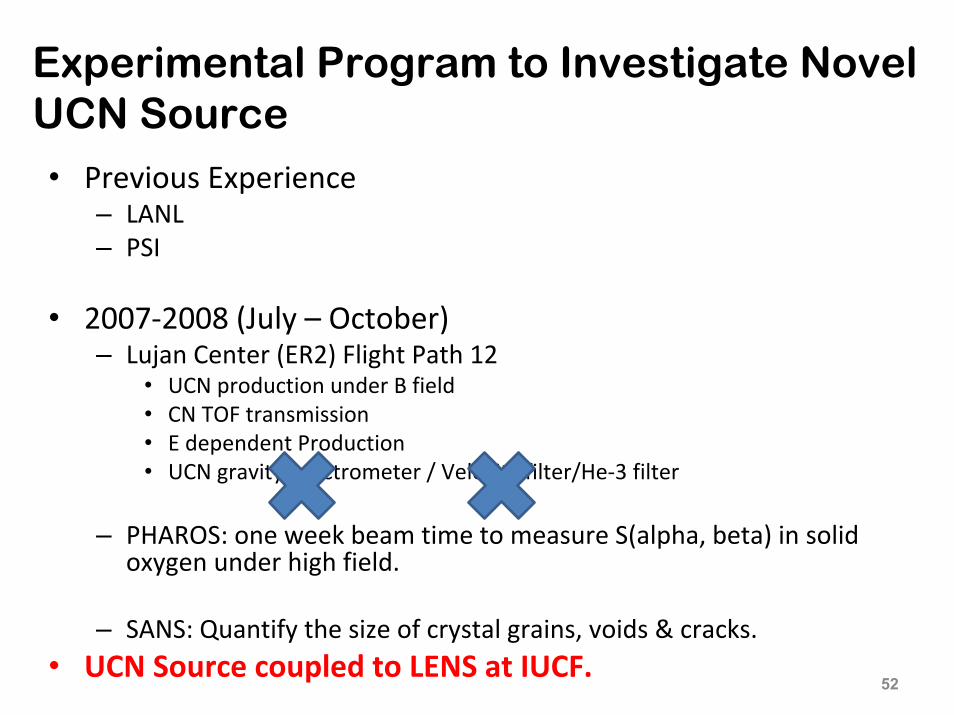
Experimental Program to Investigate Novel UCN Source • Previous Experience
– LANL– PSI
• 2007‐2008 (July – October)– Lujan Center (ER2) Flight Path 12
• UCN production under B field• CN TOF transmission • E dependent Production• UCN gravity spectrometer / Velocity filter/He‐3 filter
– PHAROS: one week beam time to measure S(alpha, beta) in solid oxygen under high field.
– SANS: Quantify the size of crystal grains, voids & cracks.• UCN Source coupled to LENS at IUCF.
52
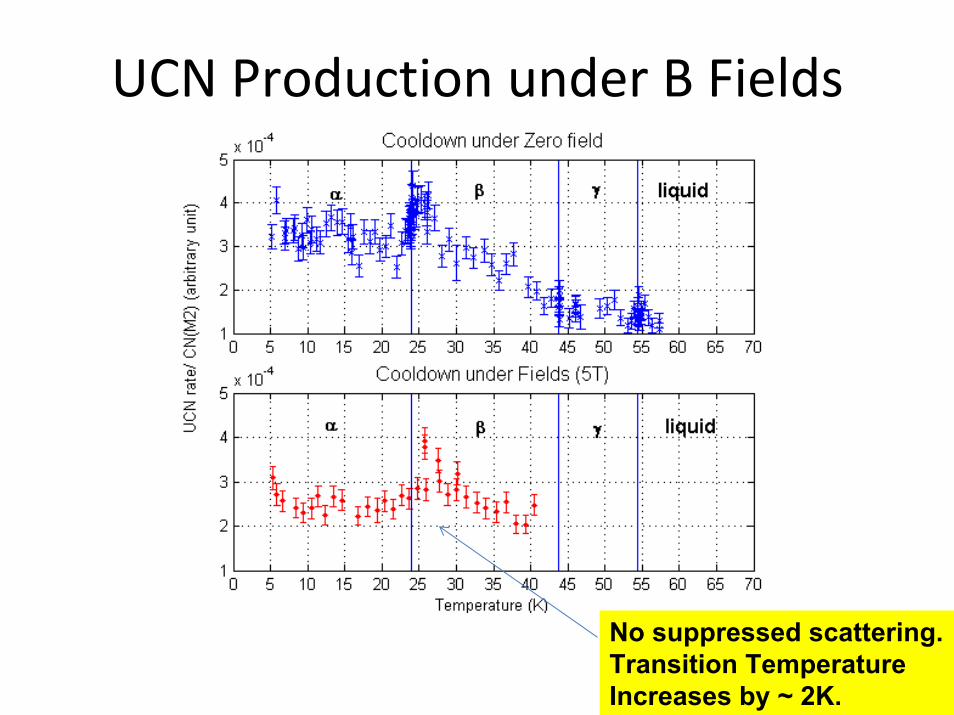
UCN Production under B Fields
53
No suppressed scattering.Transition TemperatureIncreases by ~ 2K.
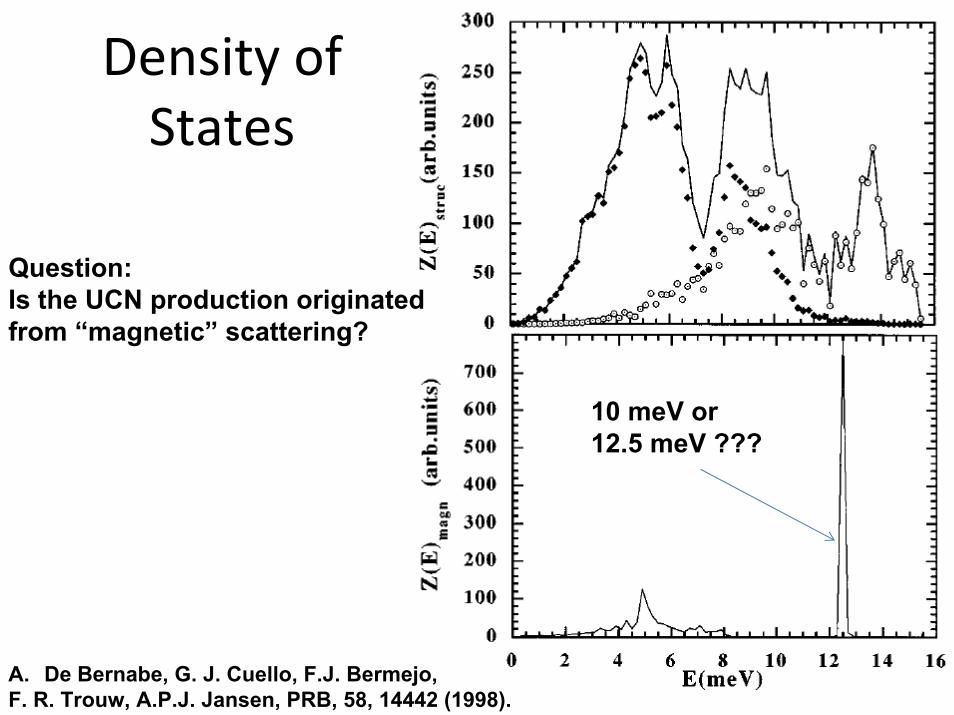
Density of States
54A. De Bernabe, G. J. Cuello, F.J. Bermejo, F. R. Trouw, A.P.J. Jansen, PRB, 58, 14442 (1998).
10 meV or 12.5 meV ???
Question:Is the UCN production originatedfrom “magnetic” scattering?
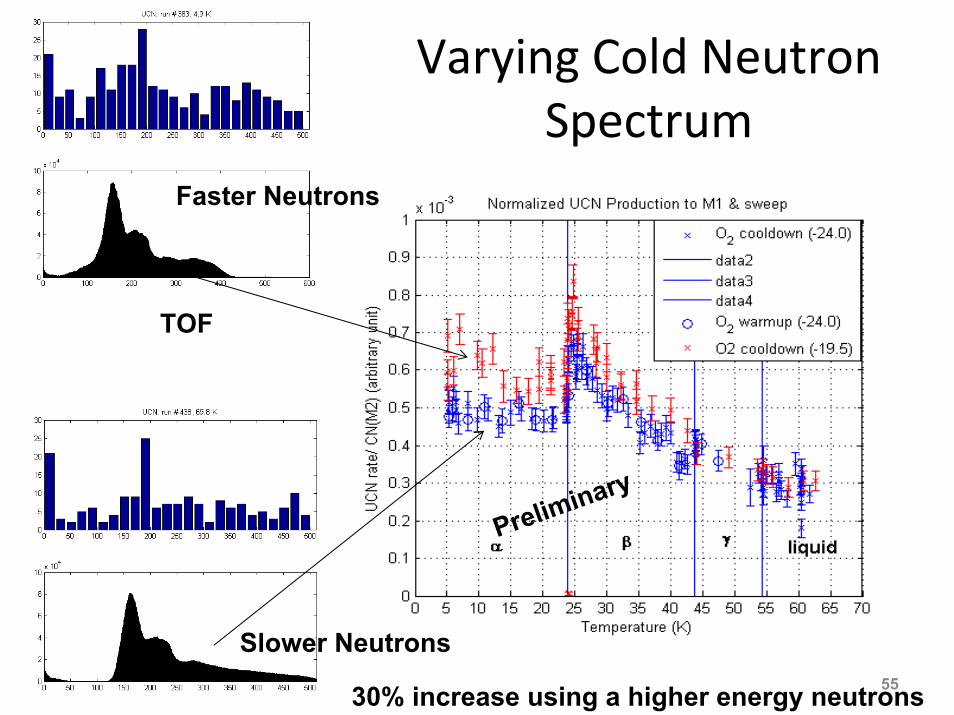
Varying Cold Neutron Spectrum
55
Preliminary
30% increase using a higher energy neutrons
TOF
Faster Neutrons
Slower Neutrons

Scaling to Neutron Current
• Seppo Pentilla, Chris Crawford, Yun Shin Conducted Absolute Neutron Spectrum Measurement immediately following our run.
April 3, 2009 Christopher M. Lavelle, IUCF 56
]//[)(1056.5 24000
20001
5 scmniMi
cn ∑=
•×=φ ]//[1065.8 26 scmncn ×=φ
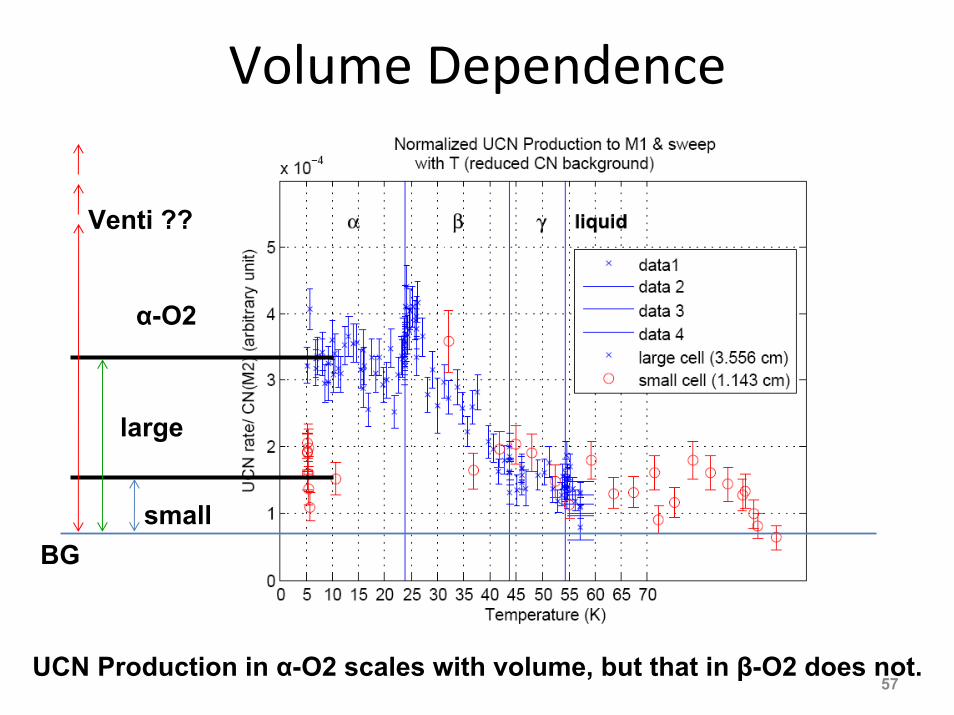
Volume Dependence
57UCN Production in α-O2 scales with volume, but that in β-O2 does not.
BGsmall
large
Venti ??
α-O2
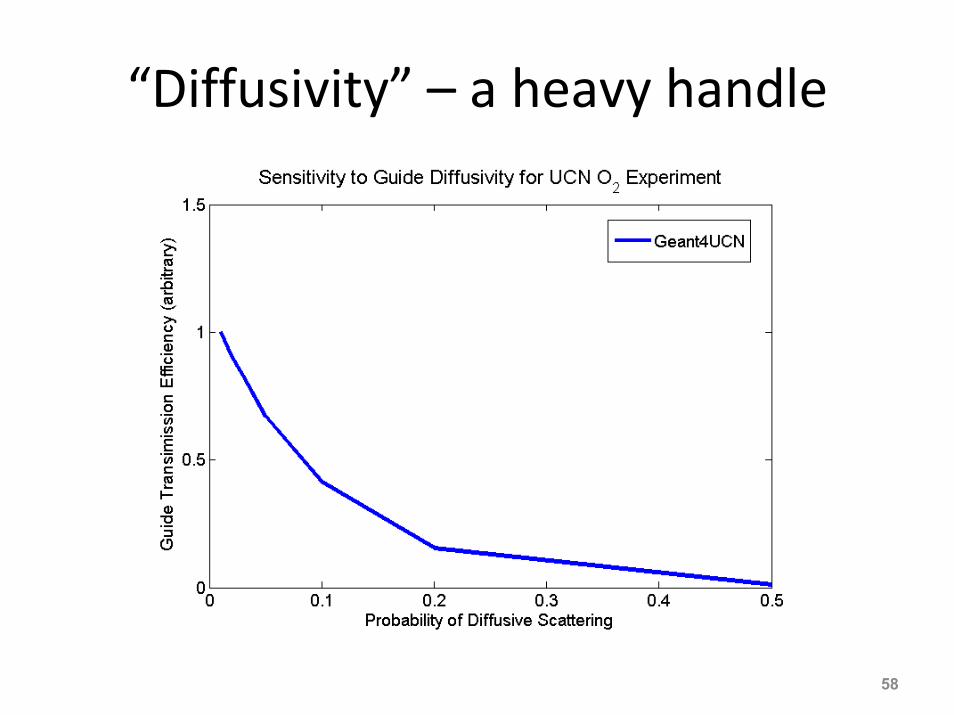
“Diffusivity” – a heavy handle
58
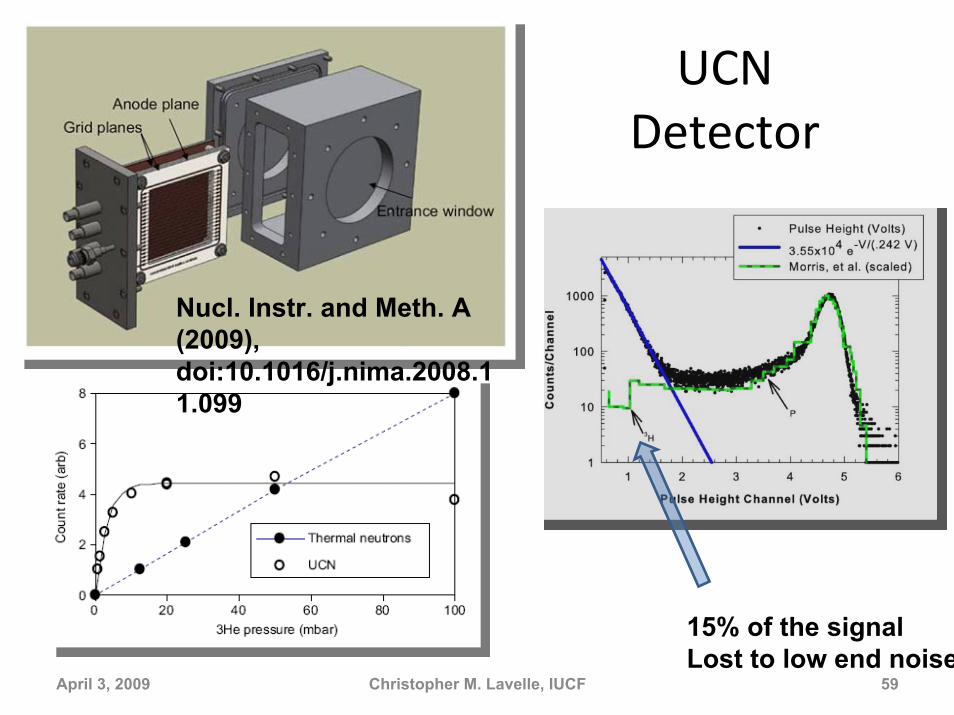
UCN Detector
April 3, 2009 Christopher M. Lavelle, IUCF 59
Nucl. Instr. and Meth. A (2009), doi:10.1016/j.nima.2008.11.099
15% of the signalLost to low end noise
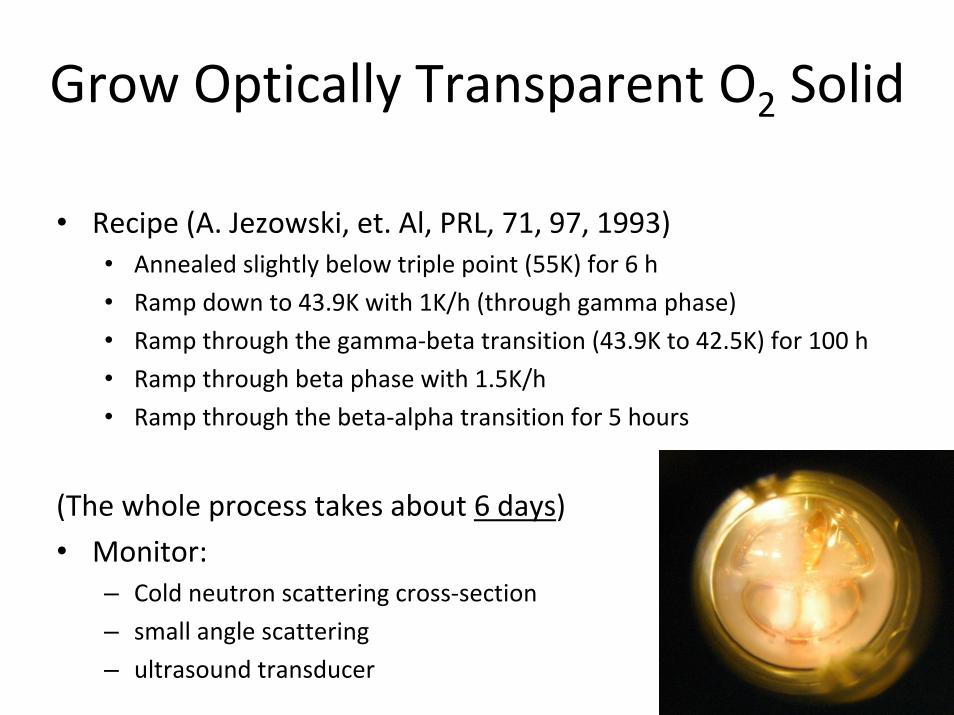
Grow Optically Transparent O2 Solid
• Recipe (A. Jezowski, et. Al, PRL, 71, 97, 1993)• Annealed slightly below triple point (55K) for 6 h
• Ramp down to 43.9K with 1K/h (through gamma phase)
• Ramp through the gamma‐beta transition (43.9K to 42.5K) for 100 h
• Ramp through beta phase with 1.5K/h
• Ramp through the beta‐alpha transition for 5 hours
(The whole process takes about 6 days)
• Monitor: – Cold neutron scattering cross‐section
– small angle scattering
– ultrasound transducer60

61
• Incoherent scattering (σinc = 2.04 barn)• The difference of singlet and triplet scattering
• Coherent contribution ( σ coh= 5.59 barn)– In a cold neutron flux with a continuous spectrum, more
neutrons could participate in the UCN production.
UCN production in Solid D2
(1,1.73,0)
(1,1,0)
(1,0,0)
• Nuclear Absorption ( σ abs= 0.0005 barn for 2200m/s neutrons)
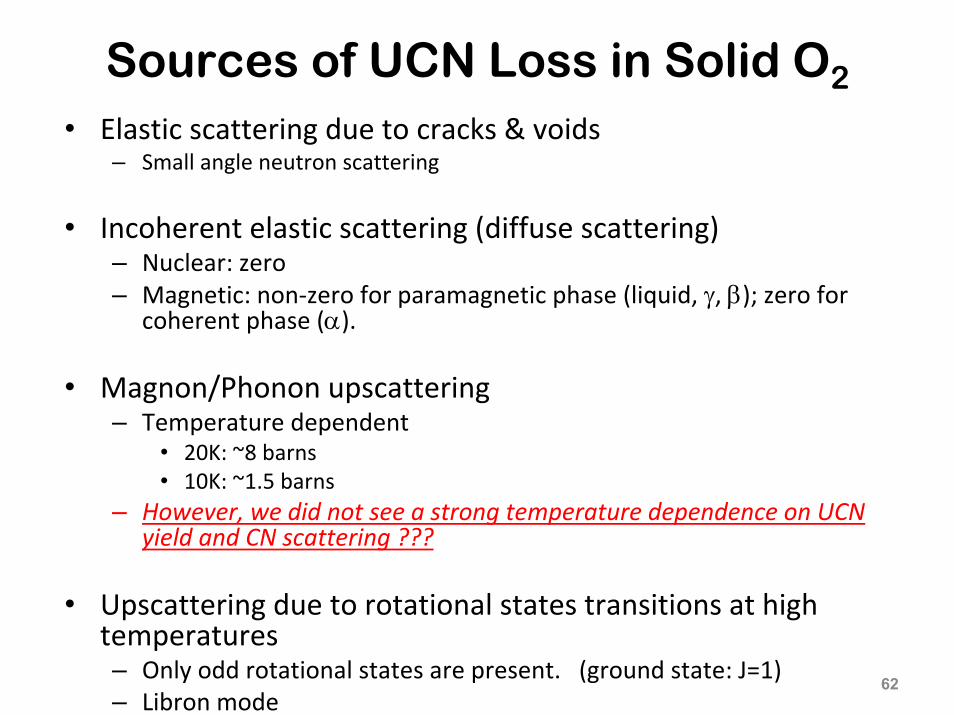
Sources of UCN Loss in Solid O2
• Elastic scattering due to cracks & voids– Small angle neutron scattering
• Incoherent elastic scattering (diffuse scattering)– Nuclear: zero– Magnetic: non‐zero for paramagnetic phase (liquid, γ, β); zero for
coherent phase (α).
• Magnon/Phonon upscattering– Temperature dependent
• 20K: ~8 barns• 10K: ~1.5 barns
– However, we did not see a strong temperature dependence on UCN yield and CN scattering ???
• Upscattering due to rotational states transitions at high temperatures– Only odd rotational states are present. (ground state: J=1)– Libron mode
62
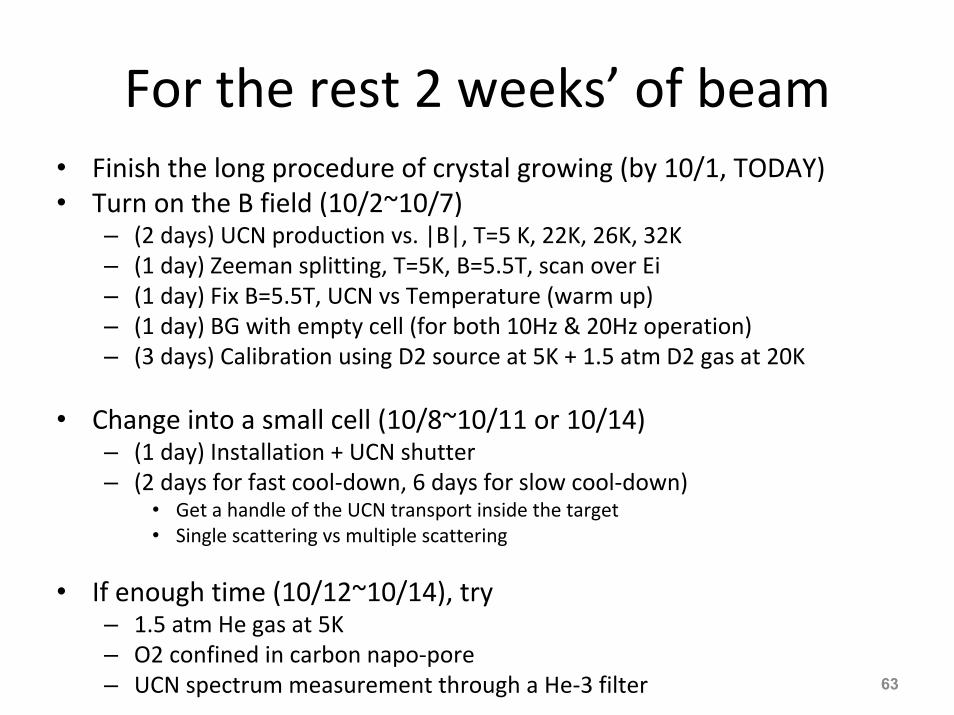
For the rest 2 weeks’ of beam• Finish the long procedure of crystal growing (by 10/1, TODAY)• Turn on the B field (10/2~10/7)
– (2 days) UCN production vs. |B|, T=5 K, 22K, 26K, 32K – (1 day) Zeeman splitting, T=5K, B=5.5T, scan over Ei– (1 day) Fix B=5.5T, UCN vs Temperature (warm up) – (1 day) BG with empty cell (for both 10Hz & 20Hz operation)– (3 days) Calibration using D2 source at 5K + 1.5 atm D2 gas at 20K
• Change into a small cell (10/8~10/11 or 10/14)– (1 day) Installation + UCN shutter– (2 days for fast cool‐down, 6 days for slow cool‐down)
• Get a handle of the UCN transport inside the target• Single scattering vs multiple scattering
• If enough time (10/12~10/14), try– 1.5 atm He gas at 5K– O2 confined in carbon napo‐pore– UCN spectrum measurement through a He‐3 filter 63

Challenges
• 1.8 K cryogenic.– Larger gamma heating and smaller thermal conductivity than S‐D2 ⇒ challenges on cryogenic engineering
– Requires a fast thermal break (50K to 2K) over a few cm.
• Shortened UCN mean free path – Polycrystalline sample formation – Ozone formation ⇒ additional incoherent scattering, resulting in a
reduced mean free path. (Low radiation level at LENS helps.) 64
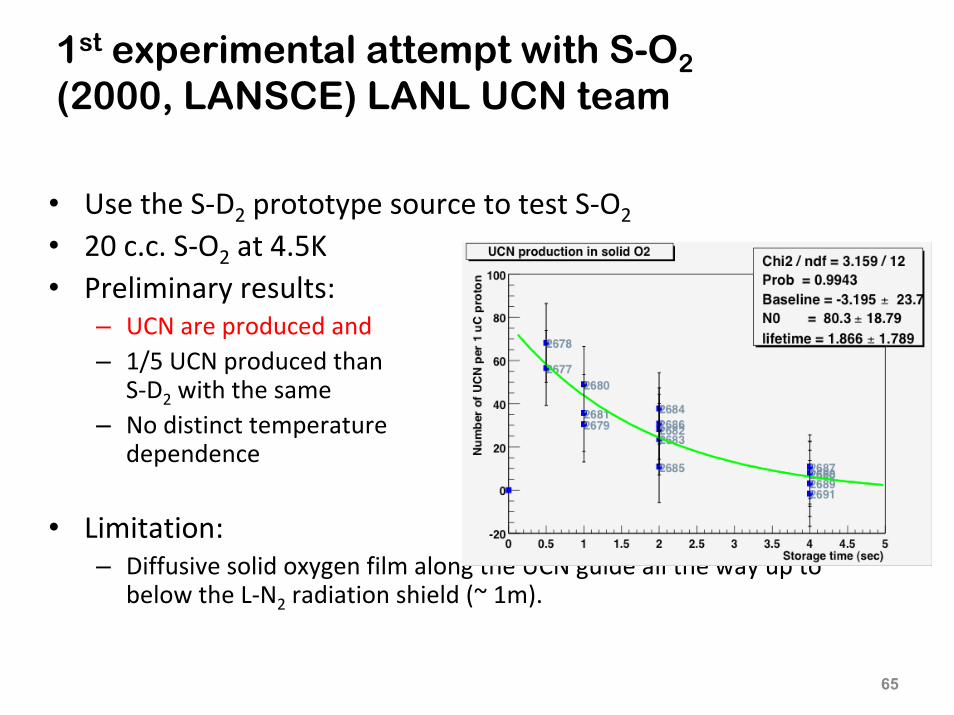
1st experimental attempt with S-O2
(2000, LANSCE) LANL UCN team
• Use the S‐D2 prototype source to test S‐O2
• 20 c.c. S‐O2 at 4.5K• Preliminary results:
– UCN are produced and bottled.– 1/5 UCN produced than from
S‐D2 with the same condition– No distinct temperature
dependence
• Limitation: – Diffusive solid oxygen film along the UCN guide all the way up to
below the L‐N2 radiation shield (~ 1m).
65

Measurement of the UCN production efficiency of solid D2 and comparison with the
solid cryogenic materials CD4 and O2
Collaboration
F. Atchison, B. Blau, B. van den Brandt, T. Brys, M. Daum, P. Hautle, R. Henneck, S. Heule, M. Kasprzak, K. Kirch, A. Knecht, J. A. Konter, A.
Pichlmaier, M. Wohlmuther, G. Zsigmond (PSI)
K. Bodek, M. Kuzniak, J. Zejma (Jagiellonian University)P. Geltenbort, C. Plonka (ILL)A. Holley, A. R. Young (NCSU)
C.‐Y. Liu, Y. Shin (IU)C. L. Morris, A. Saunders, (LANL)Y. Pokotilovski (JINR, Dubna)
D. Tortorella (TUM)66
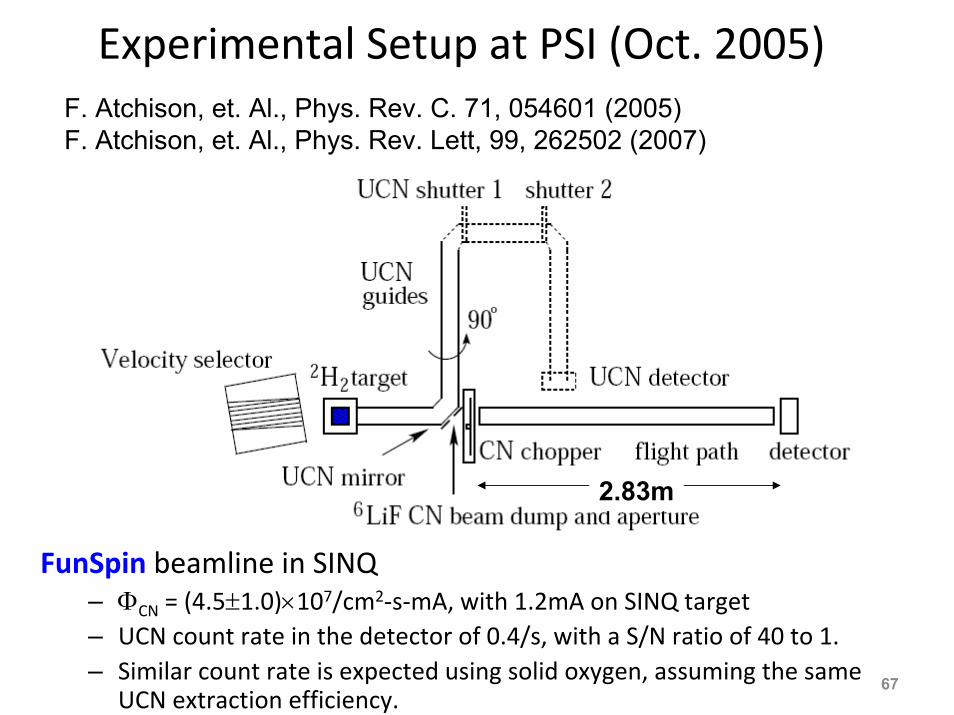
Experimental Setup at PSI (Oct. 2005)
FunSpin beamline in SINQ– ΦCN = (4.5±1.0)×107/cm2‐s‐mA, with 1.2mA on SINQ target– UCN count rate in the detector of 0.4/s, with a S/N ratio of 40 to 1.– Similar count rate is expected using solid oxygen, assuming the same
UCN extraction efficiency.67
F. Atchison, et. Al., Phys. Rev. C. 71, 054601 (2005) F. Atchison, et. Al., Phys. Rev. Lett, 99, 262502 (2007)
2.83m
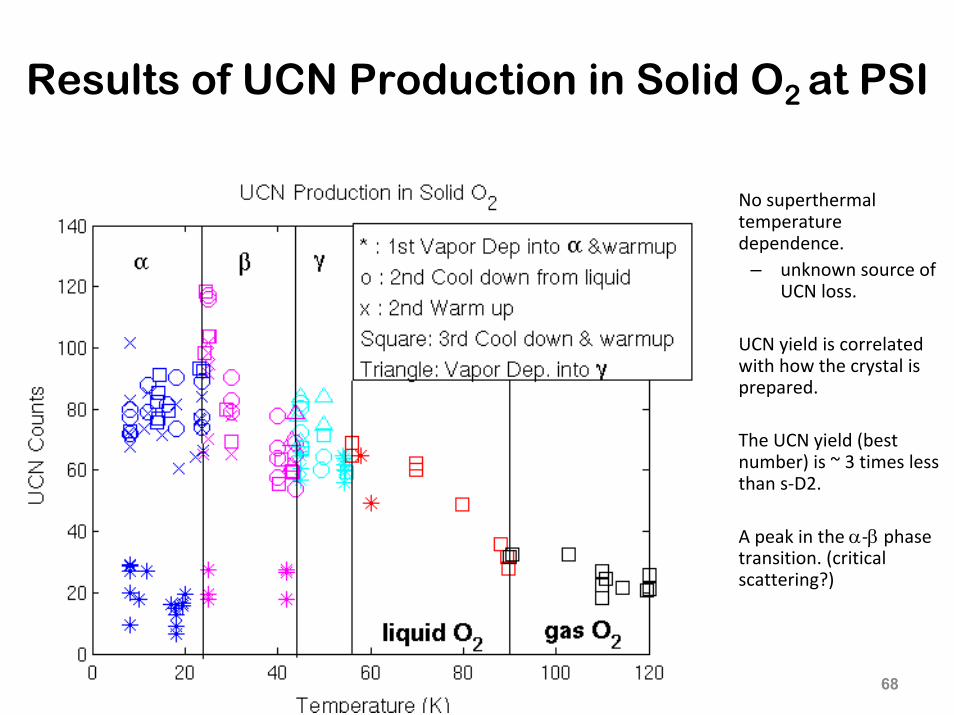
Results of UCN Production in Solid O2 at PSI
• No superthermal temperature dependence.
– unknown source of UCN loss.
• UCN yield is correlated with how the crystal is prepared.
• The UCN yield (best number) is ~ 3 times less than s‐D2.
• A peak in the α‐β phase transition. (critical scattering?)
68

Cold Neutron Transmission (TOF)
• Less scattering compared with D2.
• Bragg edges
• Additional Bragg peak in α‐phase. ⇒ the presence of a magnetic ordering.
69
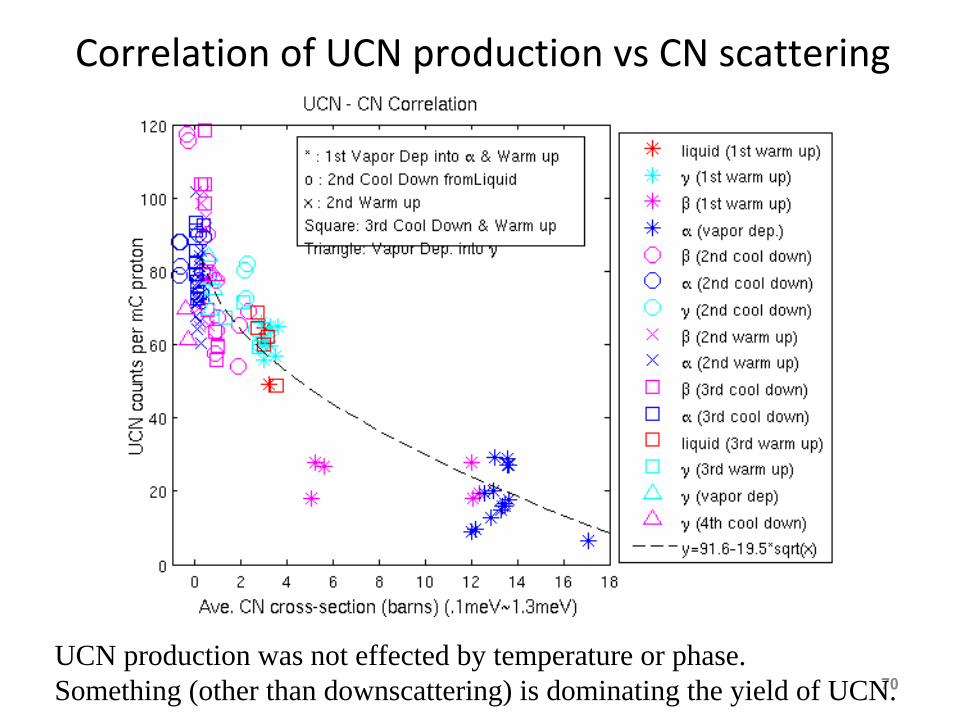
Correlation of UCN production vs CN scattering
70UCN production was not effected by temperature or phase.Something (other than downscattering) is dominating the yield of UCN.
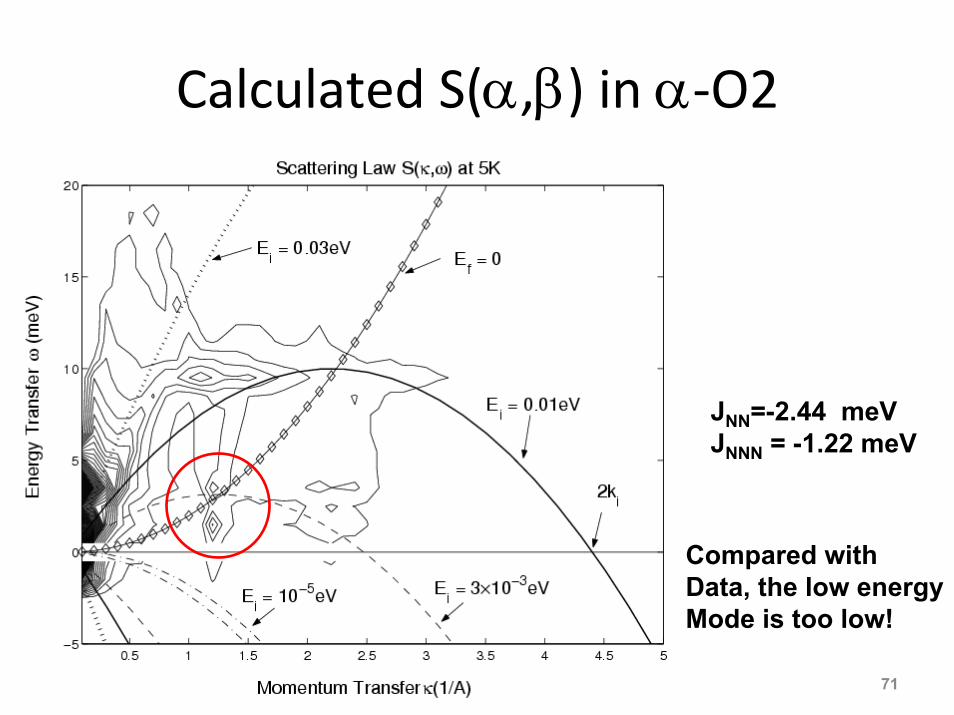
Calculated S(α,β) in α‐O2
71
JNN=-2.44 meVJNNN = -1.22 meV
Compared with Data, the low energyMode is too low!
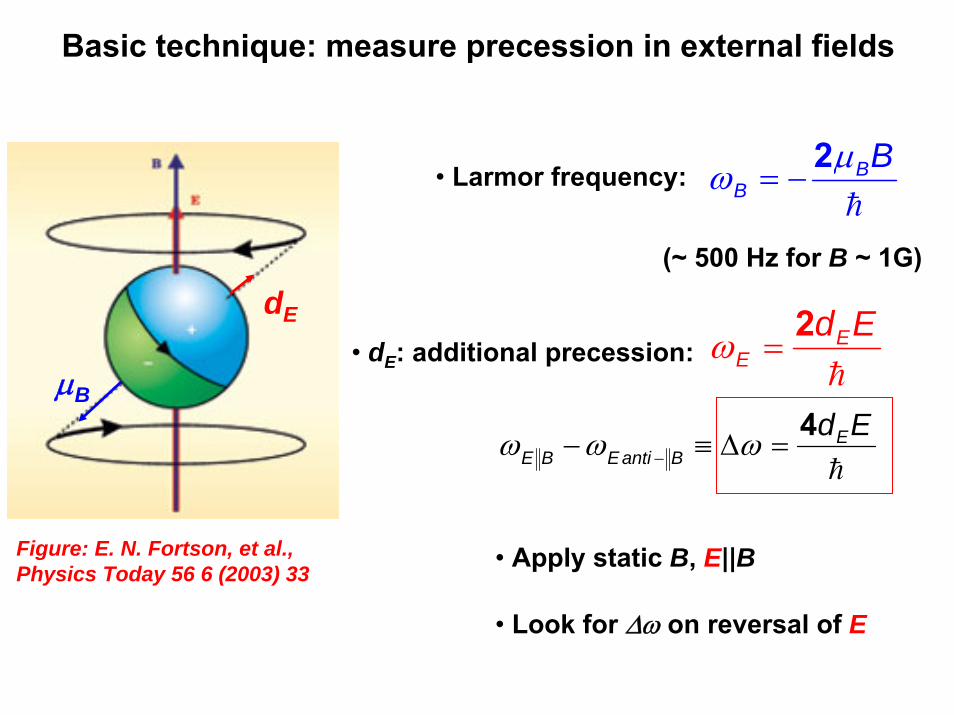
Basic technique: measure precession in external fields
h
BBB
μω 2−=
h
EdEE
2=ω
h
EdEBantiEBE
4=Δ≡− − ωωω
• Apply static B, E||B
• Look for Δω on reversal of E
• Larmor frequency:
(~ 500 Hz for B ~ 1G)
μB
dE
• dE: additional precession:
Figure: E. N. Fortson, et al., Physics Today 56 6 (2003) 33
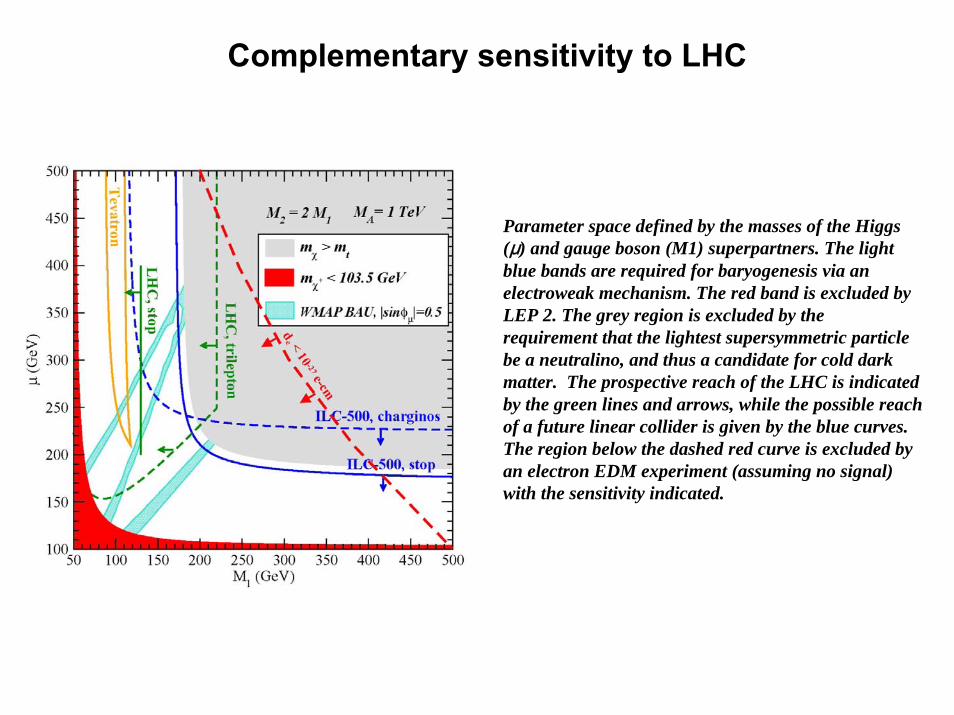
Complementary sensitivity to LHC
Parameter space defined by the masses of the Higgs (μ) and gauge boson (M1) superpartners. The light blue bands are required for baryogenesis via an electroweak mechanism. The red band is excluded by LEP 2. The grey region is excluded by the requirement that the lightest supersymmetric particle be a neutralino, and thus a candidate for cold dark matter. The prospective reach of the LHC is indicated by the green lines and arrows, while the possible reach of a future linear collider is given by the blue curves. The region below the dashed red curve is excluded by an electron EDM experiment (assuming no signal) with the sensitivity indicated.
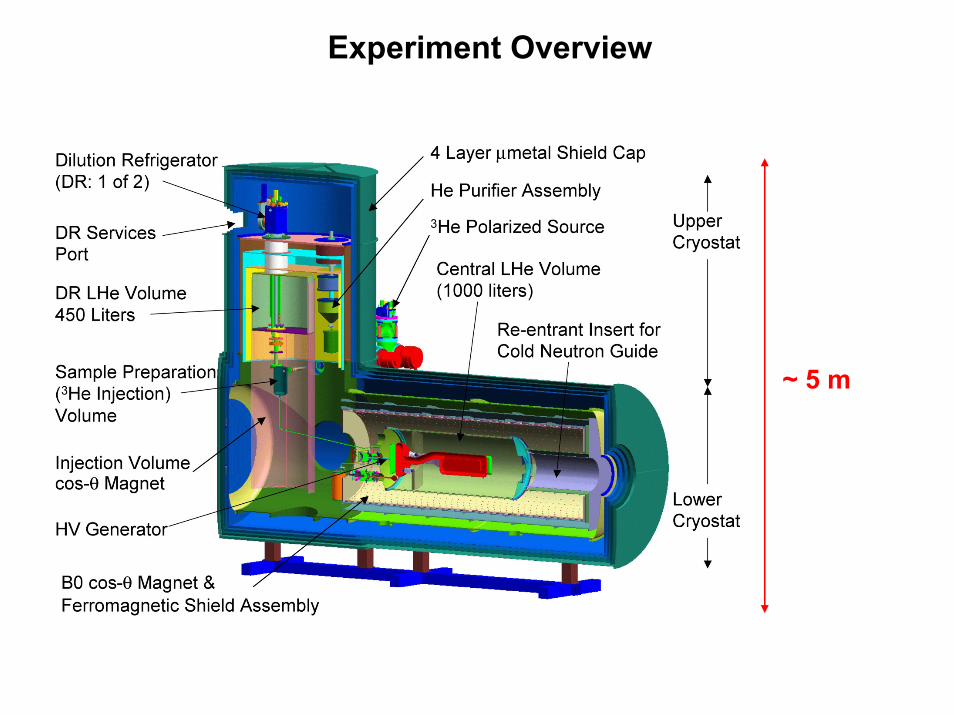
Experiment Overview
~ 5 m
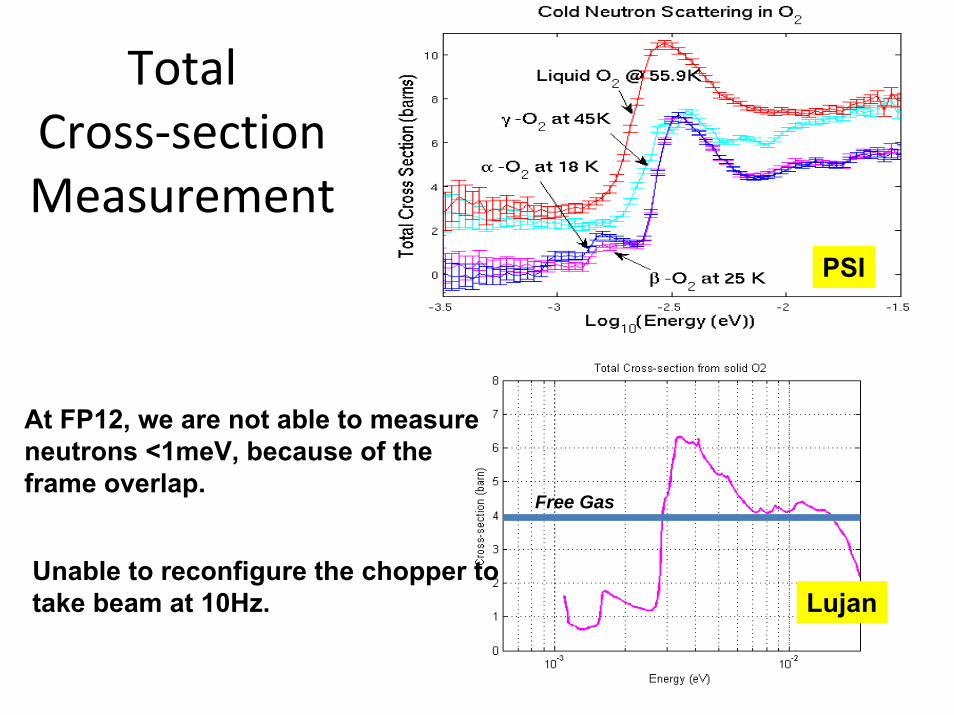
Total Cross‐section Measurement
75
PSI
Lujan
At FP12, we are not able to measureneutrons <1meV, because of the frame overlap.
Unable to reconfigure the chopper to take beam at 10Hz.
Free Gas
76

77
Superthermal UCN Production
Landau-Feynman's dispersiocurve for superfluid 4He
Kinetic energy of a free neutron
11 K
0.7/Å
( ) ( )( ) ( )Tω~ωnωn+=
σσ
vnσσΦ=τP=ρ
up
down
updownucn /exp11
0 ∝⎟⎟⎠
⎞⎜⎜⎝
⎛×
Superthermal gain
( ) ( ) 1/exp1
−Tω=ωn
Two level system:
9 A CN°
UCN
• Superfluid 4He– Energy excitation is isotropic.– Neutron scattering is isotropic.
• UCN can accumulate until the production rate = loss rate
R. Golub and J. M. Pendlebury, Phys. Lett, A53, 133 (1975)