new constraints on massive carbon release and recovery ...jzachos/pubs/penman... · with these new...
TRANSCRIPT

Environmental Research Letters
LETTER • OPEN ACCESS
New constraints on massive carbon release and recovery processesduring the Paleocene-Eocene Thermal MaximumTo cite this article: Donald E Penman and James C Zachos 2018 Environ. Res. Lett. 13 105008
View the article online for updates and enhancements.
This content was downloaded from IP address 108.168.239.94 on 08/12/2018 at 15:58

Environ. Res. Lett. 13 (2018) 105008 https://doi.org/10.1088/1748-9326/aae285
LETTER
New constraints onmassive carbon release and recovery processesduring the Paleocene-Eocene Thermal Maximum
Donald EPenman1 and JamesCZachos2
1 Department ofGeology&Geophysics, YaleUniversity, NewHaven, CT 06511,United States of America2 Earth and Planetary Science, University of California, Santa Cruz, CA 95060,United States of America
E-mail: [email protected]
Keywords:PETM, carbon cycle, ocean acidification
Supplementarymaterial for this article is available online
AbstractRecent geochemical and sedimentological evidence constrains the response of seawater chemistry tocarbon injection during the Paleocene-Eocene ThermalMaximum (PETM): foraminiferal boron-based proxy records constrain themagnitude and duration of surface ocean acidification, while newdeep sea records document a carbonate compensation depth (CCD) over-shoot during the recovery.Such features can be used tomore tightly constrain simulations of the event within carbon cyclemodels, and thus testmechanisms for carbon release, buffering, and sequestration.Weuse theLOSCAR carbon cyclemodel to examine first the onset of, and then recovery from the PETM.Wesystematically varied themass, rate, and location of C release alongwith changes in ocean circulationpatterns as well as initial conditions such as pre-event pCO2 and the strength of weathering feedbacks.A range of input parameters produced output that successfully conformed to observationalconstraints on the event’s onset. However, none of the successful scenarios featured surface seawateraragonite or calcite undersaturation at even peak PETMconditions (in contrast to anthropogenicacidification projections), andmost runs featured approximately a doubling of pCO2 relative to pre-event conditions (suggesting a high PETMclimate sensitivity). Further runs test scenarios of the bodyand recovery of the PETMagainst records of sustained acidification followed by rapid pH recovery inboron records, as well as the timing and depth of the CCDovershoot. Successful scenarios all require asustained release of carbon overmany tens of thousands of years following the onset (comparable tothemass released during the onset) and removal of carbon (likely as burial of organic carbon inaddition to elevated chemical weathering rates) during the recovery. This sequence of events isconsistent with a short-lived feedback involving the release of 13C-depleted C in response to initialwarming followed by its subsequent sequestration during the cooling phase.
Introduction
The Paleocene-Eocene Thermal Maximum (PETM,∼56Ma) involved the geologically rapid release ofthousands of petagrams of 12C-enriched carbon(Dickens et al 1997, Panchuk et al 2008, Zeebeet al 2009, Cui et al 2011) into the ocean-atmospheresystem, resulting in global warming (Dunkley-Joneset al 2013), ocean acidification (Zachos et al 2005,Penman et al 2014, Babila et al 2016, Babila et al 2018),and varied yet pronounced impacts on marine andterrestrial biota (Thomas and Shackleton 1996, Wing
et al 2005, Gibbs et al 2016). The event is oftenconsidered a geologic point of comparison to currentanthropogenic CO2 release, offering the opportunityto improve our understanding of the response ofclimate, biota, and the carbon cycle to rapid carboninjection (Alley 2016). However, evaluating how thePETM compares to anthropogenic emissions requiresaccurate estimates of the mass and rate of carbonrelease during the PETM, as well as the strength offeedback processes responsible for terminating theevent. Numerous sources and mechanisms have beenproposed for carbon release during the PETM,
OPEN ACCESS
RECEIVED
27 June 2018
REVISED
18 September 2018
ACCEPTED FOR PUBLICATION
19 September 2018
PUBLISHED
18October 2018
Original content from thisworkmay be used underthe terms of the CreativeCommonsAttribution 3.0licence.
Any further distribution ofthis workmustmaintainattribution to theauthor(s) and the title ofthework, journal citationandDOI.
© 2018TheAuthor(s). Published by IOPPublishing Ltd

including methane clathrate dissociation (Dickenset al 1995, Zeebe et al 2009), organic carbon oxidation(Cui et al 2011, Bowen 2013), comet impact (Kentet al 2003, Schaller et al 2016), and North Atlanticvolcanism (Svensen et al 2004, Storey et al 2007,Frieling et al 2016). Each of these mechanisms isassociated with a feasible δ13C andmass of carbon andduration of release. However, due to the limits ofchronologic tools that can be applied in deep time, theactual rate of the onset is not yet sufficiently wellconstrained to test allmechanisms.
Several modeling studies have assessed scenariosfor carbon release and sequestration during thePETM. Zeebe et al (2009) and Panchuk et al (2008)used records of sedimentary CaCO3 reduction duringthe acidification phase to estimate the carbon releasemass, whereas Gutjahr et al (2017) used single-siteboron isotopes and δ13C to constrain scenarios of car-bon emissions and sequestration in an Earth systemmodel. Each of these studies presents one or two sce-narios that most closely conform to a single dataset,without simultaneously considering constraintsimposed by different types of data (e.g. carbonatechemistry proxies alongside global CaCO3 records), orexploring the range of carbon release scenariosallowed by the uncertainty in proxy reconstructions.Furthermore, recent geochemical and sedimentologi-cal evidence from novel records of the PETM haveimproved constraints on the response of seawater car-bonate chemistry and carbonate burial patterns dur-ing the PETM, which allow the re-evaluation andrefinement of scenarios of the event using carbon cyclemodeling.
The most direct evidence of ocean acidificationcomes from recent studies utilizing the boron con-centration and isotopes in planktic foraminifera(Penman et al 2014, Babila et al 2016, Gutjahret al 2017, Babila et al 2018). At ODP Sites 1209, 689,
and 690 (Penman et al 2014, Babila et al 2018)(figure 1) and at sites along the New Jersey margin(Babila et al 2016), the B/Ca proxy, which herein istreated as a qualitative proxy for acidification (Allenet al 2011, Penman et al 2014, Uchikawa et al 2015,Haynes et al 2017, Uchikawa et al 2017), shows a rapid∼30%–40% decrease at the event onset, followed by aplateau of low values and finally a recovery to near pre-event levels in step with the carbon isotope excursion(CIE, figure 2). This decrease is consistent with a rapid(similar to the CIE onset rate), global, and sustained(similar to the CIE body duration) acidification of thesurface ocean. At ODP Sites 1209, 865, 401, and 1263,a record of the boron isotopic composition (δ11B, adirect proxy for seawater pH) of surface-dwellingplanktic foraminifers corroborates the acidificationsuggested by B/Ca records (Penman et al 2014, Gut-jahr et al 2017, Babila et al 2018), and allows for itsquantification. Due to the differing sensitivity of δ11Bat different pH, the estimate forΔpHacross the PETMis a function of assumed initial pH, but for a reason-able assumption of pre-event (Paleocene) pH, the∼1‰ decrease in planktic δ11B across the P-E bound-ary represents acidification of approximately 0.3pH units (Penman et al 2014, Babila et al 2018). Thisfalls within the higher end of the range of simluatedΔpH assuming various carbon inputs (Panchuket al 2008, Zeebe et al 2009, Ridgwell andSchmidt 2010).
Additional evidence for the response of ocean car-bonate chemistry during the PETM is the decrease inwt% CaCO3 in sediment cores globally (Zachoset al 2005, Zeebe and Zachos 2007), a consequence ofrapid shoaling of the CCD as the injection of CO2 intothe oceans decreases pH and carbonate saturationstate in tandem (Hönisch et al 2012). These records(Zachos et al 2005) also show how the CCD graduallyrecovered as seafloor carbonate dissolution and
Figure 1.Map of all sites providing data for carbonate chemistry constraints placed onPETM simulationswith Eocene geography byColorado PlateauGeosystems (http://cpgeosystems.com/index.html).
2
Environ. Res. Lett. 13 (2018) 105008

negative feedbacks restored ocean carbonate satur-ation. Numerical and conceptual models of thelong-term carbon cycle predict that these negativefeedbacks should have caused a period of carbonateoversaturation (relative to pre-event levels) during therecovery, wherein the build-up of alkalinity in theocean would have caused an ‘overshoot’ of the CCD(Dickens et al 1997, Zeebe and Zachos 2013). Elevatedcarbonate burial during this period of oversaturationrepresents the long-term removal of not only theexternal carbon input, but also the carbonate dissolvedduring the initial acidification phase, the suppressionof calcification during that phase (Luo et al 2016), andmost importantly, the elevated delivery of alkalinity tothe oceans by accelerated terrestrial chemical weath-ering. Evidence for enhanced weathering during thePETM comes from sedimentary records of Osmiumisotopes (Ravizza et al 2001, Wieczorek et al 2013,Dickson et al 2015) and a pulse of silica burial in theNorth Atlantic (Penman 2016). The first direct
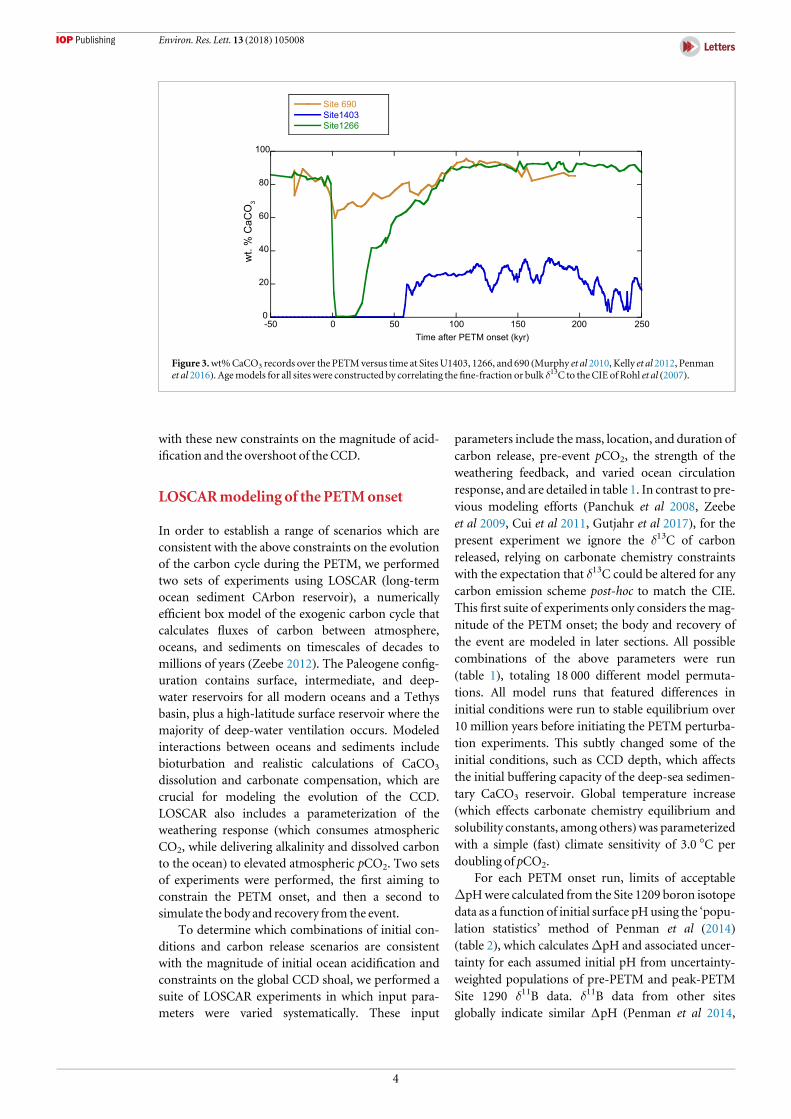
evidence of a subsequent CCD overshoot was recentlyrecovered in the North Atlantic at IODP Site U1403.This abyssal (paleo-water depth=4400 m) site fea-tures a transition from Paleocene carbonate-barrenclay to Eocene sediments containing 10%–40% carbo-nate (Norris et al 2014) starting in the early stages ofthe recovery interval of the CIE (Penman et al 2016).The approximate timing of the CCD overshoot at SiteU1403 correlates well with existing records of elevatedwt% CaCO3 elsewhere (figure 3) (Zachos et al 2005,Kelly et al 2010,Murphy et al 2010). The depth, timingand magnitude of the carbonate overshoot providesadditional key observations on the evolution of theCCDduring the PETMand can thus be used inmodelsto constrain carbon fluxes.
This study aims to estimate carbon fluxes utilizingthe latest observations on changes in ocean carbonatechemistry during the PETM. To this end, we use a car-bon cycle model to determine a range of scenarios forcarbon release and sequestration that are consistent
Figure 2.Bulk carbonate δ13C (Colosimo et al 2005,McCarren et al 2008, Kelly et al 2012), planktic foraminifer δ11B (Penmanet al 2014), and planktic foraminifer B/Ca from all sites versus time. Red symbols are surface-dwellers, blue symbols are thermoclinedwellers.M.vel=Morozovella velascoensis, A.sol=Acaranina soldadoensis, A.p5c=Acaranina praepentacamerata, Sub=genusSubbotinae. For B/Ca, open symbols are SouthernOcean (Sites 689 and 690), closed symbols areNorth Pacific (Site 1209). Agemodels were generated for all sites by correlating thefine fraction or bulk carbonate δ13C to that of Rohl et al (2007), and in the case ofSites 689 and 690 used the tie points of Kelly et al (2012). Error bars on δ11B represent 2 standard errors of repeatmeasurements. Errorbars onB/Ca represent two standard deviations of repeatmeasurements of an in-house foraminiferal carbonate standard (7%).
3
Environ. Res. Lett. 13 (2018) 105008
with these new constraints on the magnitude of acid-ification and the overshoot of the CCD.
LOSCARmodeling of the PETMonset
In order to establish a range of scenarios which areconsistent with the above constraints on the evolutionof the carbon cycle during the PETM, we performedtwo sets of experiments using LOSCAR (long-termocean sediment CArbon reservoir), a numericallyefficient box model of the exogenic carbon cycle thatcalculates fluxes of carbon between atmosphere,oceans, and sediments on timescales of decades tomillions of years (Zeebe 2012). The Paleogene config-uration contains surface, intermediate, and deep-water reservoirs for all modern oceans and a Tethysbasin, plus a high-latitude surface reservoir where themajority of deep-water ventilation occurs. Modeledinteractions between oceans and sediments includebioturbation and realistic calculations of CaCO3
dissolution and carbonate compensation, which arecrucial for modeling the evolution of the CCD.LOSCAR also includes a parameterization of theweathering response (which consumes atmosphericCO2, while delivering alkalinity and dissolved carbonto the ocean) to elevated atmospheric pCO2. Two setsof experiments were performed, the first aiming toconstrain the PETM onset, and then a second tosimulate the body and recovery from the event.
To determine which combinations of initial con-ditions and carbon release scenarios are consistentwith the magnitude of initial ocean acidification andconstraints on the global CCD shoal, we performed asuite of LOSCAR experiments in which input para-meters were varied systematically. These input
parameters include themass, location, and duration ofcarbon release, pre-event pCO2, the strength of theweathering feedback, and varied ocean circulationresponse, and are detailed in table 1. In contrast to pre-vious modeling efforts (Panchuk et al 2008, Zeebeet al 2009, Cui et al 2011, Gutjahr et al 2017), for thepresent experiment we ignore the δ13C of carbonreleased, relying on carbonate chemistry constraintswith the expectation that δ13C could be altered for anycarbon emission scheme post-hoc to match the CIE.This first suite of experiments only considers the mag-nitude of the PETM onset; the body and recovery ofthe event are modeled in later sections. All possiblecombinations of the above parameters were run(table 1), totaling 18 000 different model permuta-tions. All model runs that featured differences ininitial conditions were run to stable equilibrium over10 million years before initiating the PETM perturba-tion experiments. This subtly changed some of theinitial conditions, such as CCD depth, which affectsthe initial buffering capacity of the deep-sea sedimen-tary CaCO3 reservoir. Global temperature increase(which effects carbonate chemistry equilibrium andsolubility constants, among others)was parameterizedwith a simple (fast) climate sensitivity of 3.0 °C perdoubling of pCO2.
For each PETM onset run, limits of acceptableΔpHwere calculated from the Site 1209 boron isotopedata as a function of initial surface pHusing the ‘popu-lation statistics’ method of Penman et al (2014)(table 2), which calculatesΔpH and associated uncer-tainty for each assumed initial pH from uncertainty-weighted populations of pre-PETM and peak-PETMSite 1290 δ11B data. δ11B data from other sitesglobally indicate similar ΔpH (Penman et al 2014,
Figure 3.wt%CaCO3 records over the PETMversus time at Sites U1403, 1266, and 690 (Murphy et al 2010, Kelly et al 2012, Penmanet al 2016). Agemodels for all sites were constructed by correlating thefine-fraction or bulk δ13C to theCIE of Rohl et al (2007).
4
Environ. Res. Lett. 13 (2018) 105008
Gutjahr et al 2017, Babila et al 2018) during the PETMonset. Runs were deemed consistent if the Pacific sur-face pHdecline during the event onset fell within thoserun-specific limits, and if the initial CCD shoaling(minimum CCD subtracted from pre-event CCD)exceeded 2 km in the Atlantic and was restricted to lessthan 500 m in the Pacific, in accordance with existingrecords of the CCD (see table 1 caption) (Colosimo
et al 2005, Zachos et al 2005, Zeebe and Zachos 2007,Sluijs et al 2012).
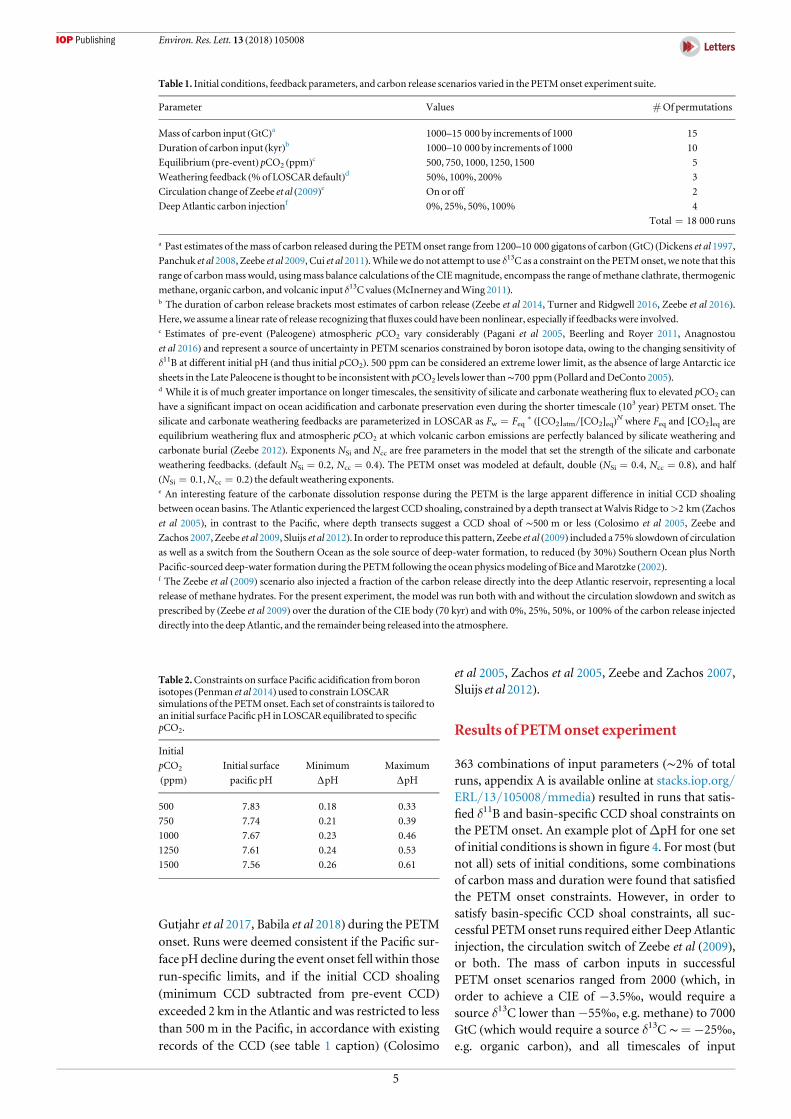
Results of PETMonset experiment
363 combinations of input parameters (∼2% of totalruns, appendix A is available online at stacks.iop.org/ERL/13/105008/mmedia) resulted in runs that satis-fied δ11B and basin-specific CCD shoal constraints onthe PETM onset. An example plot ofΔpH for one setof initial conditions is shown in figure 4. Formost (butnot all) sets of initial conditions, some combinationsof carbon mass and duration were found that satisfiedthe PETM onset constraints. However, in order tosatisfy basin-specific CCD shoal constraints, all suc-cessful PETMonset runs required either Deep Atlanticinjection, the circulation switch of Zeebe et al (2009),or both. The mass of carbon inputs in successfulPETM onset scenarios ranged from 2000 (which, inorder to achieve a CIE of −3.5‰, would require asource δ13C lower than−55‰, e.g. methane) to 7000GtC (which would require a source δ13C ∼= −25‰,e.g. organic carbon), and all timescales of input
Table 1. Initial conditions, feedback parameters, and carbon release scenarios varied in the PETMonset experiment suite.
Parameter Values #Of permutations
Mass of carbon input (GtC)a 1000–15 000 by increments of 1000 15
Duration of carbon input (kyr)b 1000–10 000 by increments of 1000 10
Equilibrium (pre-event) pCO2 (ppm)c 500, 750, 1000, 1250, 1500 5
Weathering feedback (%of LOSCARdefault)d 50%, 100%, 200% 3
Circulation change of Zeebe et al (2009)e On or off 2
DeepAtlantic carbon injectionf 0%, 25%, 50%, 100% 4
Total=18 000 runs
a Past estimates of themass of carbon released during the PETMonset range from 1200–10 000 gigatons of carbon (GtC) (Dickens et al 1997,Panchuk et al 2008, Zeebe et al 2009, Cui et al 2011).While we do not attempt to use δ13C as a constraint on the PETMonset, we note that this
range of carbonmass would, usingmass balance calculations of the CIEmagnitude, encompass the range ofmethane clathrate, thermogenic
methane, organic carbon, and volcanic input δ13C values (McInerney andWing 2011).b The duration of carbon release brackets most estimates of carbon release (Zeebe et al 2014, Turner and Ridgwell 2016, Zeebe et al 2016).Here, we assume a linear rate of release recognizing thatfluxes could have been nonlinear, especially if feedbacks were involved.c Estimates of pre-event (Paleogene) atmospheric pCO2 vary considerably (Pagani et al 2005, Beerling and Royer 2011, Anagnostou
et al 2016) and represent a source of uncertainty in PETM scenarios constrained by boron isotope data, owing to the changing sensitivity of
δ11B at different initial pH (and thus initial pCO2). 500 ppm can be considered an extreme lower limit, as the absence of large Antarctic ice
sheets in the Late Paleocene is thought to be inconsistent with pCO2 levels lower than∼700 ppm (Pollard andDeConto 2005).d While it is of much greater importance on longer timescales, the sensitivity of silicate and carbonate weathering flux to elevated pCO2 can
have a significant impact on ocean acidification and carbonate preservation even during the shorter timescale (103 year) PETM onset. The
silicate and carbonate weathering feedbacks are parameterized in LOSCAR as Fw=Feq* ([CO2]atm/[CO2]eq)
N where Feq and [CO2]eq areequilibrium weathering flux and atmospheric pCO2 at which volcanic carbon emissions are perfectly balanced by silicate weathering and
carbonate burial (Zeebe 2012). Exponents NSi and Ncc are free parameters in the model that set the strength of the silicate and carbonate
weathering feedbacks. (default NSi=0.2, Ncc=0.4). The PETM onset was modeled at default, double (NSi=0.4, Ncc=0.8), and half
(NSi=0.1,Ncc=0.2) the default weathering exponents.e An interesting feature of the carbonate dissolution response during the PETM is the large apparent difference in initial CCD shoaling
between ocean basins. The Atlantic experienced the largest CCD shoaling, constrained by a depth transect atWalvis Ridge to>2 km (Zachoset al 2005), in contrast to the Pacific, where depth transects suggest a CCD shoal of ∼500 m or less (Colosimo et al 2005, Zeebe and
Zachos 2007, Zeebe et al 2009, Sluijs et al 2012). In order to reproduce this pattern, Zeebe et al (2009) included a 75% slowdown of circulation
as well as a switch from the Southern Ocean as the sole source of deep-water formation, to reduced (by 30%) Southern Ocean plus North
Pacific-sourced deep-water formation during the PETM following the ocean physicsmodeling of Bice andMarotzke (2002).f The Zeebe et al (2009) scenario also injected a fraction of the carbon release directly into the deep Atlantic reservoir, representing a local
release of methane hydrates. For the present experiment, the model was run both with and without the circulation slowdown and switch as
prescribed by (Zeebe et al 2009) over the duration of the CIE body (70 kyr) and with 0%, 25%, 50%, or 100% of the carbon release injected
directly into the deepAtlantic, and the remainder being released into the atmosphere.
Table 2.Constraints on surface Pacific acidification fromboronisotopes (Penman et al 2014) used to constrain LOSCARsimulations of the PETMonset. Each set of constraints is tailored toan initial surface Pacific pH in LOSCAR equilibrated to specificpCO2.
Initial
pCO2
(ppm)Initial surface
pacific pH
Minimum
ΔpHMaximum
ΔpH
500 7.83 0.18 0.33
750 7.74 0.21 0.39
1000 7.67 0.23 0.46
1250 7.61 0.24 0.53
1500 7.56 0.26 0.61
5
Environ. Res. Lett. 13 (2018) 105008
considered here (1000–10 000 years) generated con-formable PETM onset simulations when combinedwith specific initial conditions and carbon inputs.
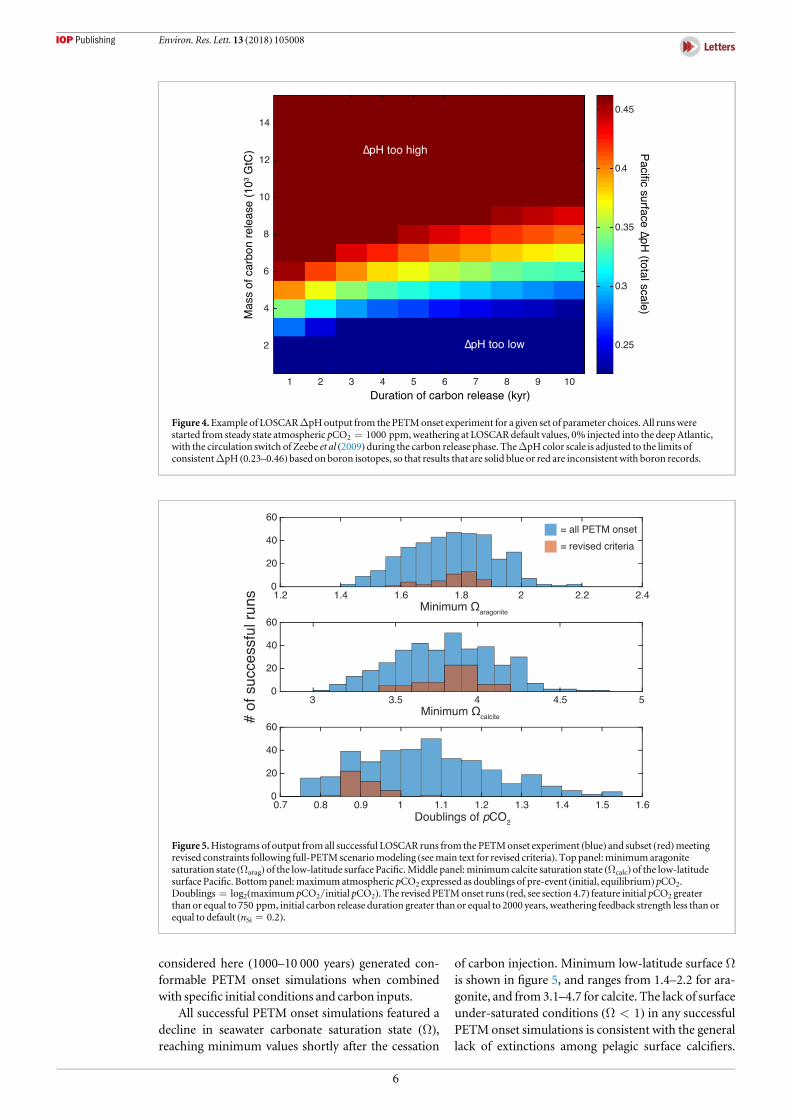
All successful PETM onset simulations featured adecline in seawater carbonate saturation state (Ω),reaching minimum values shortly after the cessation
of carbon injection. Minimum low-latitude surface Ωis shown in figure 5, and ranges from 1.4–2.2 for ara-gonite, and from3.1–4.7 for calcite. The lack of surfaceunder-saturated conditions (Ω<1) in any successfulPETM onset simulations is consistent with the generallack of extinctions among pelagic surface calcifiers.
Figure 4.Example of LOSCARΔpHoutput from the PETMonset experiment for a given set of parameter choices. All runswerestarted from steady state atmospheric pCO2=1000 ppm,weathering at LOSCARdefault values, 0% injected into the deepAtlantic,with the circulation switch of Zeebe et al (2009) during the carbon release phase. TheΔpH color scale is adjusted to the limits ofconsistentΔpH (0.23–0.46) based on boron isotopes, so that results that are solid blue or red are inconsistent with boron records.
Figure 5.Histograms of output from all successful LOSCAR runs from the PETMonset experiment (blue) and subset (red)meetingrevised constraints following full-PETMscenariomodeling (seemain text for revised criteria). Top panel:minimumaragonitesaturation state (Ωarag) of the low-latitude surface Pacific.Middle panel:minimumcalcite saturation state (Ωcalc) of the low-latitudesurface Pacific. Bottompanel:maximumatmospheric pCO2 expressed as doublings of pre-event (initial, equilibrium) pCO2.Doublings=log2(maximum pCO2/initial pCO2). The revised PETMonset runs (red, see section 4.7) feature initial pCO2 greaterthan or equal to 750 ppm, initial carbon release duration greater than or equal to 2000 years, weathering feedback strength less than orequal to default (nSi=0.2).
6
Environ. Res. Lett. 13 (2018) 105008

Table 3. LOSCARparameters for three simulations (low, intermediate, and high carbon release) of the full PETM including body and recovery. Carbon leak refers to carbon released to the atmosphere over 70 kyr following the initial carbonpulse, and carbon removal refers to carbon removed from the atmosphere over the subsequent 50 kyr.
Simulation
Equilibrium (initial) pCO2
(ppm)Initial carbon
pulse (GtC)Pulse duration
(years)%DeepAtlantic
injection Circulation switch?
Weathering feedback
strength
Carbon
leak (GtC)Carbon
removal (GtC)
Small release 500 2000 1000 50 Yes 100% 6100 4500
Medium release 750 3300 5000 0 Yes 75% 3800 3800
Large release 1500 7000 10 000 25 Yes 200% 14 700 4200
7
Environ.R
es.Lett.13(2018)105008

This suggests that at least in the case of the PETM,marine calcifiers were able to cope with reductions(over thousands of years) in Ω in the above rangethrough geographic migration, adaptation, and evol-ution. The magnitude and rate of Ω reduction in suc-cessful PETM onset simulations, however, stands instark contrast to future simulations of anthropogenicocean acidification, which is currently occurringmuch faster than the PETM onset and is projected toreach a more severe Ωminimum in coming centuries(Caldeira and Wicket 2003, Cui et al 2011, Zeebe andZachos 2013).
Comparing the range of pCO2 increase (maximumpCO2 versus initial pCO2) in successful scenariosof the PETM onset with existing estimates of theglobal temperature increase during the PETM onset(Dunkley-Jones et al 2013) can be used to constrainclimate sensitivity (expressed herein as the temper-ature increase in response to a doubling of pCO2, orS2x) on 103-year timescales during the PETM onset.Due to the wide range (500–1500 ppm) in initial atmo-spheric pCO2 in successful runs, the absolute pCO2
increase is highly variable (from a minimum increaseof ∼350 ppm in runs started from an initial pCO2 of500 ppm to a maximum increase of ∼1700 ppm inruns started at 1500 ppm). However, the pCO2
increase expressed as the number of doublings ofinitial pCO2 is much more similar among successfulruns, limited to the range of 0.8–1.5 doublings ofpCO2. Combined with 4 °C–5 °C of global temper-ature increase during the PETM (e.g. Dunkley-Joneset al 2013), this range in pCO2 increase implies103 year climate sensitivities of 2.7 °C–6.2 °C per dou-bling of pCO2. This range overlaps with the high endof climate sensitivities considered by the IPCC (Parryet al 2007) for anthropogenic warming (1.5 °C–4.5 °Cper doubling of pCO2).
Full PETMscenarios
The above suite of experiments only considers carbo-nate chemistry constraints on the onset of the PETM(the first 1000–10 000 years). However, the eventlasted at least an additional 100 000 years (Rohlet al 2007, Murphy et al 2010) and observations ofcarbonate chemistry during the remainder of the CIEand the recovery interval can be used to constrain anemissions trajectory and recovery for a full PETMscenario using LOSCAR. Three sets of observationsargue for a sustained ‘leak’ of carbon after the initiallarge carbon release: the prolonged plateau of mini-mum δ13C (the ‘body’ of the CIE) in most records(Zeebe et al 2009), the sustained acidifications inrecords of planktic foraminifer δ11B and B/Ca globally(Babila et al 2018), both of which would otherwisebegin to recover immediately following emissionscessation, and the delayed CCD overshoot at SiteU1403 (Penman et al 2016), which would occur
shortly (within a few tens of thousands of years) afterthe cessation of carbon emissions in the absence of asustained leak.
For modeling the body and recovery of the PETM,LOSCAR was modified from the standard Paleogenesetup (Zeebe et al 2009, Zeebe 2012) with the seafloorbathymetry and sediments more finely subdivided to100 m water depth bins (from the default 500 m reso-lution) so that CCD evolution could be modeled at afiner scale (see methods of Henehan et al 2016). Threescenarios of the PETM onset were selected represent-ing small, intermediate, and large carbon releases(table 3) that all satisfied the carbonate chemistry con-strains on the onset of the event. Following this initialcarbon release, we introduced a sustained ‘leak’ of car-bon lasting 70 kyr (the approximate duration of theCIE body, Rohl et al 2007). The mass of the leak wasiteratively adjusted in order to achieve a plateau ofnear-constant, decreased pH in accordance with theshape of δ11B andB/Ca records.
A key feature of the PETM that reflects the processof carbon sequestration is the rate of the recovery.After the body of the CIE, δ13C recovers withinapproximately 50 kyr, which is thought to be too rapidto be explained by silicate weathering alone (Bowenand Zachos 2010). The δ11B and B/Ca records ofocean acidification (figure 2) also recover within asimilar time frame, farmore quickly than some carboncyclemodels of the PETM (e.g. Zeebe et al 2009)whichrely on silicate weathering alone as the long-term car-bon sequestration process. These two corroboratinglines of evidence suggest that some process for remov-ing 13C-depleted carbon (i.e. organic) from the exo-genic carbon cycle (e.g. Bowen and Zachos 2010,Bowen 2013) must have operated during the PETMrecovery. In order to replicate the rapidity of thepH (and δ13C) recovery in our full PETM scenarios,carbon removal from the atmosphere was introducedto those same three simulations of the PETM onsetand body. The length of carbon removal was set as theduration of the δ13C recovery in Rohl et al (2007) (anadditional 50 000 years after the end of the body of theCIE) and the δ13C of carbon removed was set at−25‰, consistent with organic carbon burial. Theamount of carbon removed was iteratively adjusted toobtain a pH recovery consistent with the Site 1209δ11B record (Penman et al 2014).
Sustaining acidified conditions for 70 kyr requiresa continuous input (leak) of carbon in all full PETMscenarios, but the total mass of leaked carbon requiredvaries considerably depending on the mass of theinitial C release during the onset of the event. In thecase of the low initial C release scenario (figure 6, aspike of 2000 GtC in 1000 years), an additional 6100GtC is needed to sustain surface acidification in the fullPETM scenario, an amount that far surpasses theinitial release. This is a consequence of the briefinput duration (1000 years) which is shorter than afull ocean mixing time. The small carbon injection
8
Environ. Res. Lett. 13 (2018) 105008

(2000 GtC) is enough to depress surface ocean pH inaccordance with δ11B estimates at t=1000 years,however on longer timescales this carbon ismixed intothe deep ocean, so large additional emissions are nee-ded to keep the surface acidified. A large, sustained
leak would seem to be required of any PETM scenariothat invoked a carbon release shorter than the oceanmixing time. Invoking 6100 GtC as a leak following a2000 GtC pulse is problematic: 6100 GtC is larger thanthe entire modern terrestrial biosphere including soil
Figure 6. LowC release full PETMscenario. Black lines=only the initial C pulse, red lines= pulse leakC, blue lines=pulse, leak,and removal. DashedCCD lines represent the Pacific, solid lines represent the Atlantic.
Figure 7.HighC release full PETMscenario. Black lines=only the initial C pulse, red lines= pulse leakC, blue lines=pulse, leak,and removal. DashedCCD lines represent the Pacific, solid lines represent the Atlantic.
9
Environ. Res. Lett. 13 (2018) 105008
carbon (∼2700 GtC, Wang et al 2010). Furthermore,the carbon isotopic composition of the larger leakwould have to be significantlymore 13C-enriched thanthe initial release in order to reproduce the shape ofthe CIE, which features a rapid onset (a result of thecarbon pulse) followed by ∼70 kyr minimum. Thiswould require an initial pulse of highly 13C-depletedcarbon (e.g. methane), followed by a more 13C-heavyleak. While this may be supplied by repeated volcanicevents (Frieling et al 2016), it is difficult to imaginevolcanism acting as a feedback or response to an initialtrigger, so invoking that sequence of C release wouldrely on very fortuitous timing.
At the other extreme, in the case of the high Crelease scenario (figure 7, 7000 GtC over 10 000 years),an additional 14 700 GtC are required over 60 000years to sustain acidification in the full PETM sce-nario. The main reason for this very large leak is thatthis simulation (and indeed, all PETM onset simula-tions that can accommodate such a large initial releasewithout violating CCD constrains) is run with doubleLOSCAR’s default weathering feedback strength,which works to expedite pH recovery relative to sce-narios run at default weathering strength. Hence,more carbon is needed to keep pH depressed (as con-strained by the boron records) despite a greater weath-ering flux. A side effect of this massive carbon leakcombined with rapid weathering is the completedecoupling of pH and Ω, which recovers far morequickly and results in a CCDovershoot that occurs toosoon (in conflict with the overshoot documented atSite 1403) and is too large, covering the entire seafloorto a depth of 6.5 km, the deepest sediment level inLOSCAR. This stands in conflict with records of thePETM from the deep sea, for example Site 1211 whichremains carbonate barren (hence below the CCD)throughout the event (Colosimo et al 2005).
In the intermediate C release scenario (figure 8,3300 GtC over 5000 years, which is longer than theocean mixing time), a leak of an additional 3800 GtCover 65 000 years is required to sustain acidification.The resulting CCD curves fall within constraintsthroughout the event, and a CCD overshoot in theAtlantic occurs ∼75 000 years after the CIE onset, inlinewith the record at Site 1403.
After the PETM body, all three of the pulse+leak(without C removal) scenarios feature a recovery insurface pH that is far more gradual and prolongedthan indicated by the δ11B-based pH record. In orderto match the rapidity of the pH recovery, removal oforganic carbon (δ13C=−25‰) from the atmosphereover ∼50 kyr was required. In the case of the low Crelease scenario (figure 6), 4500 GtC were removed,while 3800 and 4200 GtC were removed in the inter-mediate (figure 8) and high (figure 7) release scenarios,respectively. In all cases, removal of carbon acts totemporarily deepen the CCD, aiding the CCD over-shoot during the PETMrecovery.
The intermediate carbon release full PETM sce-nario most closely conforms to all constraints on car-bonate chemistry over the PETM. In order to generatea CIE of−3.5‰, the intermediate carbon release sce-nario requires a carbon input of −38‰, which couldbe interpreted as a mixture of organic carbon andmethane. Interestingly, in this scenario (and all con-formable scenarios that feature sustained acidifica-tion) at least half the total carbon release occurs afterthe initial onset, suggesting a significant slow positivefeedback between warming and carbon release. Bothmethane (Dickens et al 1995, Zeebe 2013) and terres-trial organic carbon (Bowen 2013) have been proposedas potential long-term feedbacks capable of releasingcarbon at similar rates to the leak in the intermediaterelease scenario (∼0.1 GtC yr−1) over tens of thou-sands of years. Given that much of the carbon releasedduring the PETM was the result of a gradual flux, it ispossible that the flux was generated by volcanism(Frieling et al 2016), or was part of a positive feedback(s) to a modest initial warming, either the result ofsome small trigger (such has volcanism, Svensenet al 2004) or simply the crossing of a temperaturethreshold during the warming trend across the LatePaleocene—Early Eocene (Lunt et al 2011). Identify-ing the exact source of these feedbacks will prove achallenging but necessary endeavor as they may beimportant components of the Earth System on103–105 year time-scales following current anthro-pogenic carbon release.
Revised criteria for the PETMonset
The inconsistencies of the low and high C release fullPETM scenarios with the sustained acidification andrapid recovery of the PETM can be used to furtherconstrain the range of realistic scenarios in the PETMonset experiment. We can now exclude runs thatfeature greater than default weathering strength (forexample the high C release full PETM scenario) on thebasis of the rapidity of CCD recovery/overshoot thatconflicts with constraints including the timing ofthe CCD overshoot at Site U1403. Additionally, weexclude runs starting from an initial pCO2 of 500 ppm,which conflicts with the lack of Antarctic ice sheetsduring the Paleogene and the theoretical ∼700 ppmthreshold for their initiation (DeConto and Pollard2003). Once those runs are excluded, only 43 simula-tions of the PETM onset are considered successful(referred to as revised PETM onset), and span a muchnarrower range of input and output parameters(figure 5). Only runs starting from an initial pCO2 of750 or 1000 ppmv are consistent with the revisedrequirements, and require an initial carbon release(not including ‘leak’ carbon) of 3000 or 4000 GtC,although the input duration of the initial C releaseduring the PETM onset still spans 2000–10 000 years.All of the successful revised PETM onset runs require
10
Environ. Res. Lett. 13 (2018) 105008

the ocean circulation switch of Zeebe et al 2009, withvariable deep Atlantic injection (from 0%–100%).Minimum surface Pacific Ω in the successful revisedPETM onset runs ranges from 1.6–1.9 for aragoniteand from 3.5–4.1 for calcite, far less severe thanpredicted for future anthropogenic acidification(figure 9) and occurring far more slowly. The pCO2
increase in successful revised PETM onset runs rangesfrom 0.8–1.1 doublings of pCO2, which, when com-bined with estimates of 4 °C–5 °C of global temper-ature increase during the PETM (Dunkley-Joneset al 2013), is consistent with a 103 year climatesensitivity of 3.6 °C–6.2 °C per doubling of pCO2
during the PETM onset, which overlaps only with thehigher end of climate sensitivities considered by theIPCC (Parry et al 2007) (1.5 °C–4.5 °C per doubling ofpCO2).
While the intermediate C release scenario is con-sistent with all available constraints on carbonatechemistry over the PETM, the assumptions madeabout pre-PETM initial conditions in the intermediaterelease scenario represent a source of uncertainty. Fur-ther constraining several free parameters in the modelwould help to improve confidence in a consistentPETM scenario. Initial (Paleocene) pCO2 is not
precisely known (Beerling and Royer 2011), and thewide range of possible values introduces considerableuncertainty on the magnitude of ocean acidificationused to constrain PETM scenarios. Progress is beingmade (Anagnostou et al 2016), but additional, con-cordant estimates of paleo-CO2 for the Late Paleocenewould greatly improve quantitative interpretation ofδ11B records of the event and improve confidence inPETM simulations. We use the age model of Rohl et al(2007) for full PETM scenarios, however, alternativeage models (e.g. Murphy et al 2010) are available thatsuggest a longer duration of the CIE body, and a fasterrecovery. Full PETM scenarios conforming to such anage model would require additional carbon releasedduring the ‘leak’ and more depleted carbon removedat a faster rate during the recovery. The strength of theweathering feedback is also an area of uncertainty thatgreatly affects the range of possible PETM simulations.The simple parameterization of weathering in LOS-CAR as a function of pCO2 is unlikely to completelyrepresent the complex interaction between pCO2,continental temperatures, global hydrology, and soilchemistry that determine the rates of silicate and car-bonate weathering. Further constraining PETM sce-narios requires a more complete mechanistic
Figure 8. Intermediate C release full PETMscenario. Black lines=only the initial C pulse, red lines= pulse leakC, bluelines=pulse, leak, and removal. DashedCCD lines represent the Pacific, solid lines represent the Atlantic.
11
Environ. Res. Lett. 13 (2018) 105008

understanding of the global response of chemicalweathering rates to pCO2/temperature increase and/or additional observations to quantify silicate weath-ering change over the PETM (e.g. Ravizza et al 2001,Penman 2016).
Comparison to anthropogenic carbonemissions
New constraints on the evolution of the carbon cycleduring the PETM have quantitatively refined recon-structions of this ancient global warming event,allowing a re-evaluation of its utility as an analog forcontemporary anthropogenic emissions. The onset ofthe PETM involved the release of a mass of carbonsimilar to that projected for ‘business as usual’ anthro-pogenic fossil fuel emissions (Parry et al 2007), butdistributed over a duration an order of magnitudelonger (figure 9). This slower rate allowed for CO2 tobemixed into the deep ocean as it was released, insteadof remaining concentrated in the atmosphere andsurface ocean, as is anticipated to occur on the shortterm in response to comparatively more rapid and
short-lived anthropogenic emissions. This sparedEarth’s surface from extremely high temperaturesresulting from a short-lived peak in pCO2, and sparedthe surface ocean from a rapid and severe decline inpH and Ω on similarly short timescales (Zeebe andZachos 2013). Intriguingly, the recovery of the PETMwas delayed for tens of thousands of years by thesustained release of additional carbon. It is as yetunclear if this leak of carbon was supplied by a positivefeedback to initial warming, such as oxidizing terres-trial organic carbon (Bowen 2013) or destabilizingseafloor methane hydrates (Dickens et al 1995,Zeebe 2013) that might be important players in thecarbon cycle’s response to anthropogenic emissions,or from an external carbon source unique to thePETM, such as sustained volcanism (Frielinget al 2016). Furthermore, when the PETMrecovery didbegin, it proceeded farmore quickly than expected as aresult of the silicate weathering feedback alone.Identifying the causes and effects of the carbon fluxesoperating during the body and recovery of the PETMmay be key to anticipating the future of the carboncycle over the next tens to hundreds of thousands ofyears.
Figure 9.Comparison of our optimal PETMsimulationwith the LOSCAR anthropogenic simulation of Zeebe andZachos (2013)featuring the release of 5000 GtC over 500 years.
12
Environ. Res. Lett. 13 (2018) 105008
Acknowledgments
We thank Richard Zeebe for supplying code andassistance with the LOSCAR model. This work wassupported by the Richard Foster Flint postdoctoralfellowship to DEP, and by NSF grant OCE-1220615to JCZ.
ORCID iDs
Donald E Penman https://orcid.org/0000-0003-4191-0505
References
AllenKA,Hoenisch B, Eggins S, Yu J, SperoH J and ElderfieldH2011Controls on boron incorporation in cultured tests of theplanktic foraminifer Orbulina universaEarth Planet. Sci. Lett.309 291–301
Alley RB 2016Aheatedmirror for future climate Science 352 151–2Anagnostou E, John EH, EdgarKM, Foster GL, Ridgwell A,
Inglis GN, Pancost RD, LuntD J and Pearson PN2016Changing atmospheric CO2 concentrationwas the primarydriver of early Cenozoic climateNature 533 380–4
Babila T, PenmanD,Hönisch B, KellyD, Bralower T,Rosenthal Y andZachos J 2018Capturing the global signatureof surface ocean acidification during the Palaeocene-EoceneThermalMaximumPhil. Trans.A 376 20170072
Babila T L, Rosenthal Y,Wright J D andMiller KG2016Acontinental shelf perspective of ocean acidification andtemperature evolution during the Paleocene-EoceneThermalMaximumGeology 44 275–8
BeerlingD andRoyerDL 2011Convergent cenozoic CO2 historyNat. Geosci. 4 418–20
Bice K L andMarotzke J 2002Could changing ocean circulationhave destabilizedmethane hydrate at the Paleocene/Eoceneboundary?—art. no. 1018Paleoceanography 17 1018
BowenG J 2013 Up in smoke: a role for organic carbon feedbacks inPaleogene hyperthermalsGlob. Planet. Change 109 18–29
BowenG J andZachos J C 2010Rapid carbon sequestration at thetermination of the Palaeocene-Eocene thermalmaximumNat. Geosci. 3 866–9
Caldeira K andWicketME2003Anthropogenic carbon and oceanpHNature 425 365
ColosimoAB, Bralower T J andZachos J C 2005 Evidence forlysocline shoaling andmethane hydrate dissociation at thePaleocene-Eocene ThermalMaximumon Shatsky Rise, ODPLeg 198 Proc. ODP, Sci. Results ed T J Bralower et al vol 198(College Station, TX:OceanDrilling Program)
Cui Y, KumpLR, Ridgwell A J, Charles A J, JuniumCK,Diefendorf A F, FreemanKH,UrbanNMandHarding I C2011 Slow release of fossil carbon during the Palaeocene-EoceneThermalMaximumNat. Geosci. 4 481–5
DeContoRMandPollardD2003RapidCenozoic glaciation ofAntarctica induced by declining atmospheric CO2Nature 421245–9
DickensGR, CastilloMMandWalker J CG 1997A blast of gas inthe latest Paleocene: simulating first-order effects ofmassivedissociation of oceanicmethane hydrateGeology 25 259–62
DickensGR,Oneil J R, ReaDK andOwenRM1995Dissociation ofoceanicmethane hydrate as a cause of the carbon isotopeexcursion at the end of the PaleocenePaleoceanography 10965–71
DicksonA J, CohenA S, CoeA L,DaviesM, Shcherbinina EA andGavrilov YO2015Evidence for weathering and volcanismduring the PETM fromArcticOcean and Peri-Tethysosmium isotope records Palaeogeogr. Palaeoclimatol.Palaeoecol. 438 300–7
Dunkley-Jones T, LuntD J, SchmidtDN, Ridgwell A, Sluijs A,Valdes P J andMaslinM2013Climatemodel and proxy dataconstraints on oceanwarming across the Paleocene-EoceneThermalMaximumEarth-Sci. Rev. 125 123–45
Frieling J, SvensenHH, Planke S, CramwinckelM J, SelnesH andSluijs A 2016Thermogenicmethane release as a cause for thelong duration of the PETM Proc. Natl Acad. Sci. 113 12059–64
Gibbs S J, BownPR, Ridgwell A, Young J R, PoultonA J andO’Dea SA 2016Oceanwarming, not acidification, controlledcoccolithophore response during past greenhouse climatechangeGeology 44 59–62
GutjahrM,Ridgwell A, Sexton P F, Anagnostou E, Pearson PN,PälikeH,Norris RD, Thomas E and Foster GL 2017Verylarge release ofmostly volcanic carbon during thePalaeocene–Eocene ThermalMaximumNature 548 573
Haynes L L,Hönisch B,Dyez KA,HollandK, Rosenthal Y, FishCR,Subhas AV andRae JW2017Calibration of the B/Ca proxyin the planktic foraminiferOrbulina universa to Paleoceneseawater conditions Paleoceanography 32 580–99
HenehanM J,Hull PM, PenmanDE, Rae JW and SchmidtDN2016 Biogeochemical significance of pelagic ecosystemfunction: an end-Cretaceous case studyPhil. Trans. R. Soc.B371 20150510
Hönisch B, Ridgwell A, SchmidtDN, Thomas E, Gibbs S J, Sluijs A,Zeebe R, KumpL,Martindale RC andGreene S E 2012Thegeological record of ocean acidification Science 335 1058–63
KellyDC,Nielsen TMand Schellenberg S A 2012Carbonatesaturation dynamics during the Paleocene-Eocene ThermalMaximum: Bathyal constraints fromODP sites 689 and 690in theWeddell Sea (SouthAtlantic)Mar. Geol. 303 75–86
KellyDC,Nielsen TM J,McCarrenHK, Zachos J C andRohlU2010 Spatiotemporal patterns of carbonate sedimentation inthe SouthAtlantic: implications for carbon cycling during thePaleocene-Eocene ThermalMaximumPalaeogeogr.Palaeoclimatol. Palaeoecol. 293 30–40
KentDV,Cramer B S, Lanci L,WangD,Wright J D andVan der VooR 2003A case for a comet impact trigger for thePaleocene/Eocene thermalmaximumand carbon isotopeexcursion Earth Planet. Sci. Lett. 211 13–26
LuntD J, Ridgwell A, Sluijs A, Zachos J, Hunter S andHaywoodA2011Amodel for orbital pacing ofmethane hydratedestabilization during the PalaeogeneNat. Geosci. 4 775–8
LuoY, BoudreauB P,DickensGR, Sluijs A andMiddelburg J J 2016An alternativemodel for CaCO3 over-shooting during thePETM: biological carbonate compensation Earth Planet. Sci.Lett. 453 223–33
McCarrenH, Thomas E,HasegawaT, RöhlU andZachos J C 2008Depth dependency of the Paleocene-Eocene carbon isotopeexcursion: paired benthic and terrestrial biomarker records(OceanDrilling ProgramLeg 208,Walvis Ridge)Geochem.Geophys. Geosyst. 9
McInerney FA andWing S 2011The Paleocene-Eocene ThermalMaximum: a perturbation of carbon cycle, climate, andbiospherewith implications for the futureAnnu. Rev. EarthPlanet. Sci. 39 489–516
Murphy BH, FarleyKA andZachos J C 2010An extraterrestrial He-3-based timescale for the Paleocene-Eocene ThermalMaximum (PETM) fromWalvis Ridge, IODP site 1266Geochim. Cosmochim. Acta 74 5098–108
Norris R,Wilson P, BlumP, Fehr A, Agnini C, BornemannA,Boulila S, BownP, CournedeC and FriedrichO2014 SiteU1403Proc. IntegratedOceanDrilling Program p 98
PaganiM, Zachos J C, FreemanKH, Tipple B andBohaty S 2005Marked decline in atmospheric carbon dioxideconcentrations during the Paleogene Science 309 600–3
ParryML,Canziani O, Palutikof J, Van der Linden P andHansonC(ed) 2007Climate change 2007-impacts, adaptation andvulnerability:Working group II contribution to the fourthassessment report of the IPCC (CambridgeUniversity Press)
PanchukK, Ridgwell A andKumpLR 2008 Sedimentary responseto Paleocene-Eocene ThermalMaximumcarbon release: amodel-data comparisonGeology 36 315–8
13
Environ. Res. Lett. 13 (2018) 105008

PenmanDE2016 Silicate weathering andNorth Atlantic silicaburial during the Paleocene-Eocene ThermalMaximumGeology 44 731–4
PenmanDE,Hönisch B, Zeebe RE, Thomas E andZachos J C 2014Rapid and sustained surface ocean acidification during thePaleocene-Eocene ThermalMaximumPaleoceanography 29357–69
PenmanDE, Turner SK, Sexton P F,Norris RD,DicksonA J,Boulila S, Ridgwell A, Zeebe RE, Zachos J C andCameronA2016An abyssal carbonate compensation depth overshoot inthe aftermath of the Palaeocene-Eocene ThermalMaximumNat. Geosci. 9 575
PollardD andDeContoRM2005Hysteresis inCenozoic Antarcticice-sheet variationsGlob. Planet. Change 45 9–21
RavizzaG,Norris RN, Blusztajn J andAubryMP2001An osmiumisotope excursion associatedwith the late Paleocene thermalmaximum: evidence of intensified chemical weatheringPaleoceanography 16 155–63
Ridgwell A and SchmidtDN2010 Past constraints on thevulnerability ofmarine calcifiers tomassive carbon dioxidereleaseNat. Geosci. 3 196–200
RohlU,Westerhold T, Bralower T J andZachos J C 2007On theduration of the Paleocene-Eocene ThermalMaximum(PETM)Geochem.Geophys. Geosyst. 8
SchallerMF, FungMK,Wright J D, KatzME andKentDV2016Impact ejecta at the Paleocene-Eocene boundary Science 354225–9
Sluijs A, Zachos J C andZeebe RE 2012Constraints onhyperthermalsNat. Geosci. 5 231
StoreyM,DuncanRA and Swisher CC III 2007 Paleocene-EoceneThermalMaximumand the opening of theNortheastAtlantic Science 316 587–9
SvensenH, Planke S,Malthe-SorenssenA, Jamtveit B,Myklebust R,EidemTR andRey S S 2004Release ofmethane from avolcanic basin as amechanism for initial Eocene globalwarmingNature 429 524–7
Thomas E and ShackletonN J 1996The Paleocene-Eocene benthicforaminiferal extinction and stable isotope anomalies (SpecialPublications) vol 101 (London:Geological Society) pp 401–41
Turner SK andRidgwell A 2016Development of a novel empiricalframework for interpreting geological carbon isotopeexcursions, with implications for the rate of carbon injectionacross the PETMEarth Planet. Sci. Lett. 435 1–13
Uchikawa J, HarperDT, PenmanDE, Zachos J C andZeebe RE2017 Influence of solution chemistry on the boron content ininorganic calcite grown in artificial seawaterGeochim.Cosmochim. Acta 218 291–307
Uchikawa J, PenmanDE, Zachos J C andZeebe RE 2015Experimental evidence for kinetic effects onB/Ca insynthetic calcite: implications for potential B(OH)4− andB(OH)3 incorporationGeochim. Cosmochim. Acta 150171–91
WangY, LawR and Pak B 2010A globalmodel of carbon, nitrogenand phosphorus cycles for the terrestrial biosphereBiogeosciences 7 2261–82
Wieczorek R, FantleMS, KumpLR andRavizzaG 2013Geochemical evidence for volcanic activity prior to andenhanced terrestrial weathering during the Paleocene EoceneThermalMaximumGeochim. Cosmochim. Acta 119 391–410
Wing S L,HarringtonG J, Smith FA, Bloch J I, BoyerDMandFreemanKH2005Transient floral change and rapid globalwarming at the Paleocene-Eocene boundary Science 310993–6
Zachos J C et al 2005Rapid acidification of the ocean during thePaleocene-Eocene ThermalMaximum Science 308 1611–5
Zeebe R 2012 LOSCAR: long-term ocean-atmosphere-sedimentcarbon cycle reservoirmodel v2. 0.4Geosci.Model Dev. 5149–66
Zeebe RE 2013What caused the long duration of the Paleocene-EoceneThermalMaximum? Paleoceanography 28 440–52
Zeebe RE,DickensGR, Ridgwell A, Sluijs A andThomas E 2014Onset of carbon isotope excursion at the Paleocene-EoceneThermalMaximum tookmillennia, not 13 yearsProc. NatlAcad. Sci. 111E1062–3
Zeebe RE, Ridgwell A andZachos J C 2016Anthropogenic carbonrelease rate unprecedented during the past 66million yearsNat. Geosci. 9 325–9
Zeebe RE andZachos J C 2007Reversed deep-sea carbonate ionbasin gradient during Paleocene-Eocene ThermalMaximumPaleoceanography and Paleoclimatology 22
Zeebe RE andZachos J C 2013 Long-term legacy ofmassive carboninput to the Earth system: anthropocene versus Eocene Phil.Trans. R. Soc.A 371 20120006
Zeebe RE, Zachos J C andDickensGR 2009Carbon dioxide forcingalone insufficient to explain Palaeocene-Eocene ThermalMaximumwarmingNat. Geosci. 2 576–80
14
Environ. Res. Lett. 13 (2018) 105008