new england clean power l project overvie · new england clean power link -overview ... vermont...
TRANSCRIPT

SEPTEMBER 2015
NEW ENGLAND CLEAN POWER LINK
Project Overview
2
Legal Disclaimer
This Project Overview contains certain forward-looking statements which reflect TDI-NE’s beliefs and assumptionsbased on available information as of the publication date of the Project Overview. Actual events may differ fromthose predicted in these forward-looking statements and potential customers are advised not to place unduereliance on any forward-looking statements. TDI-NE: (1) does not make any representation or warranty, express orimplied, as to the accuracy or completeness of the information contained in this Project Overview; (2) expresslydisclaims any obligation to revise or update the contents of this Project Overview; (3) shall have no liability resultingfrom a potential customer’s use of the information contained in this Project Overview; and (4) urges potentialcustomers to rely upon their own investigations, due diligence, and analysis in evaluating the New England CleanPower Link.

3
� NECPL PROJECT OVERVIEW
� TIMELINE AND OUTREACH
� REGULATORY OVERVIEW
� VALUE PROPOSITION
� PROJECT DEMAND
NECPL PROJECT
OVERVIEW

4
New England Clean Power Link - Overview
New England Clean Power Link Overview
- 1,000 MW buried HVDC transmission project
- 154 mile route from Canadian border to Ludlow, VT
- $1.2B estimated project cost
- Target in-service of 2019; 40+ year expected operating life
- Experienced management team currently also developing the Champlain Hudson Power Express project in New York
Business Model
- The Clean Power Link is a merchant transmission project regulated by FERC that will sell transmission rights at negotiated rates through an Open Solicitation process
Regulatory & Siting
- Expected to be fully permitted by the end of 2015
- Permitting advancing with no public opposition
- Project is viewed as having very minimal environmental impacts
- All required land for overland route under control
- Support from local communities
Environmental & Economic
- Expected to reduce up to 3.3MM tons-per-year of CO2
- Low impact footprint – submerged and underground installation on established ROW’s and through Lake Champlain
- Significant economic benefits in Vermont and New England

5
Proposed Project Route – Lake Champlain
Cable Section Mile
Proposed
Installation
Lake Champlain 0 – 2(1) HDD / Diver Lay
Lake Champlain 2 – 22 Jet Plow
Lake Champlain 22 – 73Lay on Bottom
Lake Champlain 73 – 97HDD / Jet or Shear Plow
• 97+ miles to be installed on Vermont side of Lake Champlain
• Use of Lake for Project is authorized by the State of Vermont
• Specific route, installation techniques, and impacts reviewed by State and Federal Agencies
• Cable burial only proposed in depths less than 150 feet
• Time and cost efficiencies will be attained with lake installation vs. standard overland installation
Lake Route: Benson - Alburgh
Proposed Installation Techniques Photo of a Jet Plow
(1) The initial approximately 0.5 miles from the US-Canada border to Lake Champlain is buried underground.

6
Proposed Project Route – Overland
Road Right of Way to be Utilized
Overland Route Proposed through 13 Towns to Ludlow Interconnection Point• 57 miles along Public Rights of Way or TDI-
NE controlled land
─ 43 miles on VT State Roads
─ 10 miles on Town Roads or TDI-NE controlled property
─ 3.5 miles on VT State Railroad
• TDI-NE has Agreements with the State and Towns for the use of these Rights of Way
• Cables to be installed in 4’ wide trench next to paved roads and under dirt roads
7
NECPL – Project Benefits
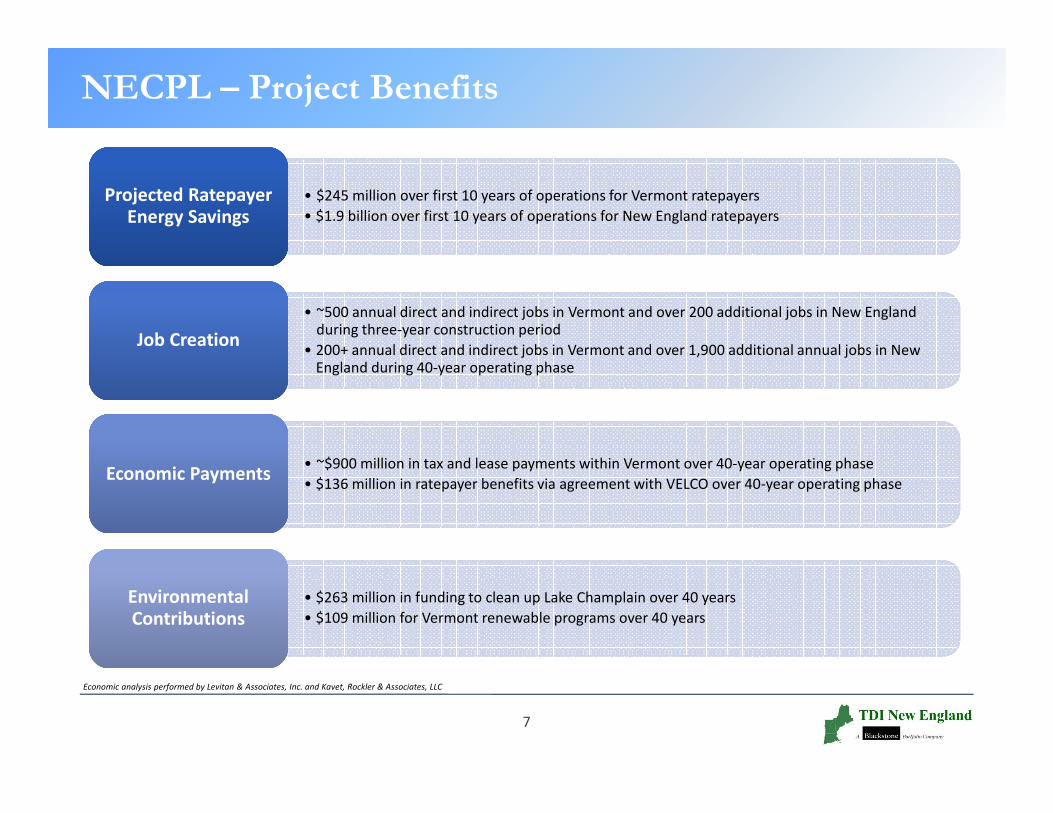
Economic analysis performed by Levitan & Associates, Inc. and Kavet, Rockler & Associates, LLC
• $245 million over first 10 years of operations for Vermont ratepayers
• $1.9 billion over first 10 years of operations for New England ratepayersProjected Ratepayer
Energy SavingsProjected Ratepayer
Energy Savings
• ~500 annual direct and indirect jobs in Vermont and over 200 additional jobs in New England during three-year construction period
• 200+ annual direct and indirect jobs in Vermont and over 1,900 additional annual jobs in New England during 40-year operating phase
Job CreationJob Creation
• ~$900 million in tax and lease payments within Vermont over 40-year operating phase
• $136 million in ratepayer benefits via agreement with VELCO over 40-year operating phaseEconomic PaymentsEconomic Payments
• $263 million in funding to clean up Lake Champlain over 40 years
• $109 million for Vermont renewable programs over 40 yearsEnvironmental ContributionsEnvironmental Contributions

8
Proven HVDC/VSC Technology
• Proven high voltage direct current (HVDC) technology that is ideal for efficiently transporting electricity long distances with minimal losses
• Two, five to six inch diameter cables are buried/submerged along the entire route; minimal maintenance required
• XLPE cables are solid-state and do not contain liquids
• Nominal operating voltage of +/- 300 to 320 kV
XLPE HVDC Cable
• Utilizes Voltage Source Converter technology to convert power from DC to AC (and vice versa)
• Provides reactive power (voltage support) that stabilizes the electric grid
VSC Converter Station

9
� NECPL PROJECT OVERVIEW
� TIMELINE AND OUTREACH
� REGULATORY OVERVIEW
� VALUE PROPOSITION
� PROJECT DEMAND
TIMELINE AND OUTREACH

10
NECPL – Timeline

11
Extensive and Ongoing Outreach
“The TDI-NE project developers have already
reached agreements to use rights of way for the
project. They also involved communities,
landowners, and activists early in the process. The
input provided led to important new analysis of
impacts and project modifications.”
Sandy Levine, Attorney with Conservation Law
Foundation, Rutland Herald, July 19, 2015
• State / Federal Agencies, Nonprofits, Elected Officials, Utilities, Town Officials, Environmental & Business Groups
Initial Stakeholder Outreach
Initial Stakeholder Outreach
• Hundreds of meetings with Town Managers, Town Officials, Select Boards, Abutters, Interested Citizens, RDCs, RPCs, etc.
Local & Regional Outreach
Local & Regional Outreach
• Six local open house meetings held
• Lake Symposium held to provide overview of Lake Installation
Local Information Meetings
Local Information Meetings
• DOE Hearings
• VT DPS Town Meetings
• VT PSB Public Hearing and Tour
• VT ANR Permit Hearings
Formal Agency-Led Public Meetings
Formal Agency-Led Public Meetings

12
� NECPL PROJECT OVERVIEW
� TIMELINE AND OUTREACH
� REGULATORY OVERVIEW
� VALUE PROPOSITION
� PROJECT DEMAND
REGULATORY OVERVIEW
13
VT State PermittingCertificate of Public Good (Section 248)
Federal PermittingPresidential Permit
Federal PermittingArmy Corps of Engineers
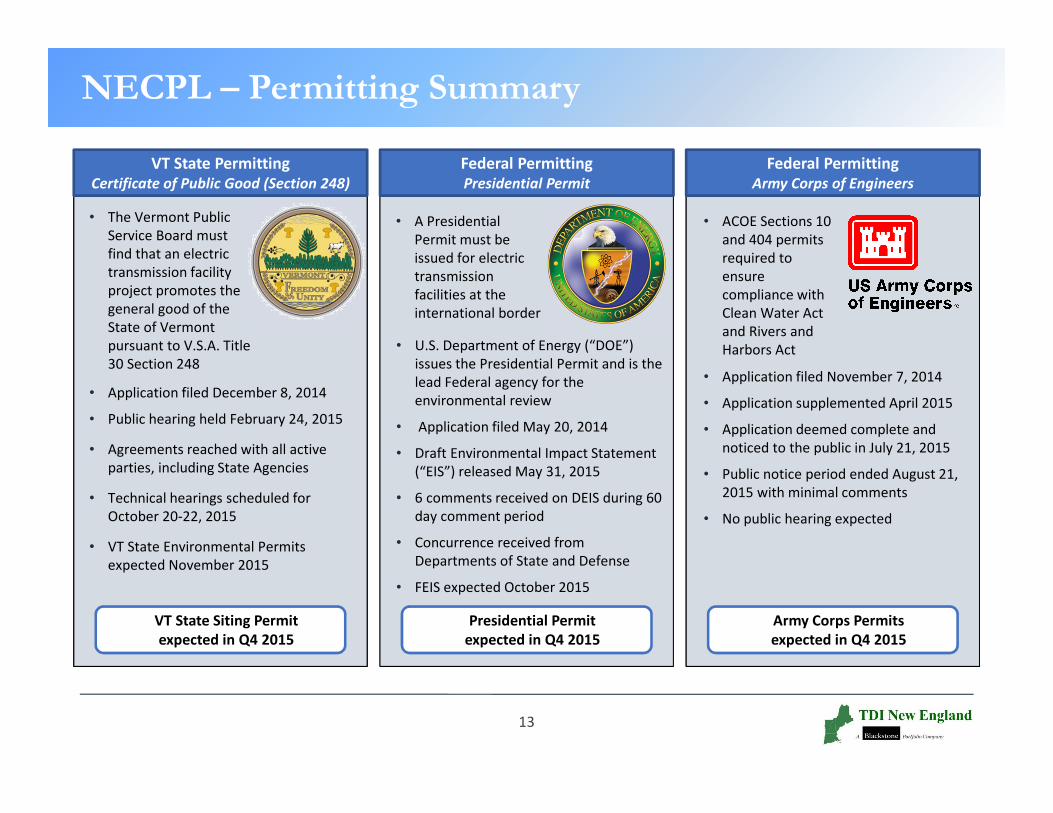
• The Vermont Public Service Board must find that an electric transmission facility project promotes the general good of the State of Vermont pursuant to V.S.A. Title 30 Section 248
• Application filed December 8, 2014
• Public hearing held February 24, 2015
• Agreements reached with all active parties, including State Agencies
• Technical hearings scheduled for October 20-22, 2015
• VT State Environmental Permits expected November 2015
• A Presidential Permit must be issued for electric transmission facilities at the international border
• U.S. Department of Energy (“DOE”) issues the Presidential Permit and is the lead Federal agency for the environmental review
• Application filed May 20, 2014
• Draft Environmental Impact Statement (“EIS”) released May 31, 2015
• 6 comments received on DEIS during 60 day comment period
• Concurrence received from Departments of State and Defense
• FEIS expected October 2015
• ACOE Sections 10 and 404 permits required to ensure compliance with Clean Water Act and Rivers and Harbors Act
• Application filed November 7, 2014
• Application supplemented April 2015
• Application deemed complete and noticed to the public in July 21, 2015
• Public notice period ended August 21, 2015 with minimal comments
• No public hearing expected
NECPL – Permitting Summary
VT State Siting Permit
expected in Q4 2015
Presidential Permit
expected in Q4 2015
Army Corps Permits
expected in Q4 2015
14
Vermont State Siting Overview
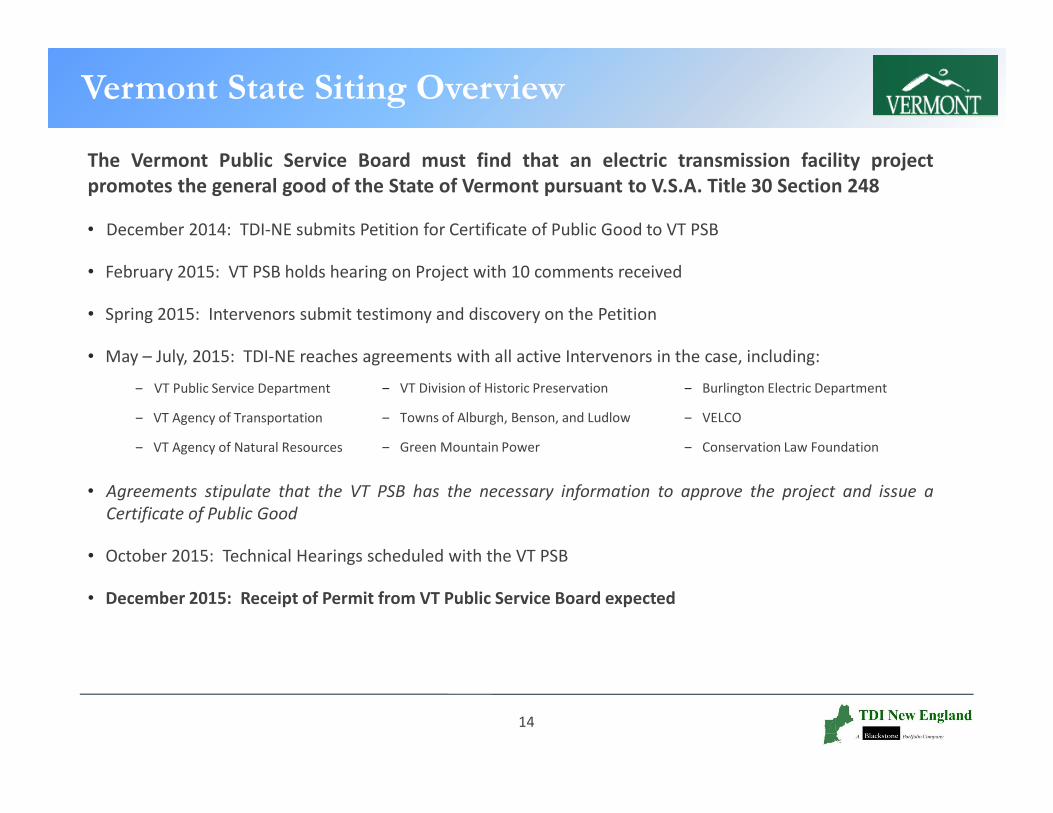
The Vermont Public Service Board must find that an electric transmission facility project
promotes the general good of the State of Vermont pursuant to V.S.A. Title 30 Section 248
• December 2014: TDI-NE submits Petition for Certificate of Public Good to VT PSB
• February 2015: VT PSB holds hearing on Project with 10 comments received
• Spring 2015: Intervenors submit testimony and discovery on the Petition
• May – July, 2015: TDI-NE reaches agreements with all active Intervenors in the case, including:
‒ VT Public Service Department
‒ VT Agency of Transportation
‒ VT Agency of Natural Resources
• Agreements stipulate that the VT PSB has the necessary information to approve the project and issue a
Certificate of Public Good
• October 2015: Technical Hearings scheduled with the VT PSB
• December 2015: Receipt of Permit from VT Public Service Board expected
‒ VT Division of Historic Preservation
‒ Towns of Alburgh, Benson, and Ludlow
‒ Green Mountain Power
‒ Burlington Electric Department
‒ VELCO
‒ Conservation Law Foundation

15
Vermont State Permit Overview
In addition to the PSB Siting Process, TDI-NE must obtain several environmental permits
from the Vermont Agency of Natural Resources to construct the Project.
• Winter 2015: TDI-NE submits applications for required State Environmental Permits including:
‒ Operational Stormwater Permit
‒ Construction Stormwater Permit
‒ Lake Encroachment Permits
‒ Stream Alteration Permit
• July – August, 2015: TDI-NE revises and resubmits certain applications based on State feedback
• September 2015: Permits to be noticed
• October 2015: Hearings on draft permits expected
• November 2015: VT ANR Permits expected to be issued
‒ Wetland Permit
‒ Floodplain Permit
‒ Water Quality Certificate
16
Presidential Permit Overview
• May 2014: Application submitted
• Fall 2014: Scoping completed; 12 scoping comments received by the DOE
• May 2015: Draft EIS released by DOE
• June 2015: 60 day comment period begins
• August 2015: Draft EIS comment period concludes with seven comments received
• August 2015: Department of State and Defense confirm that they have no objection to DOE issuing a permit
• October 2015: Final EIS expected to be released
• November 2015: Record of Decision expected
• December 2015: DOE expected to issue Presidential Permit
An Environmental Impact Statement (“EIS”) must be completed for the Project. The U.S.
Department of Energy (“DOE”) is the lead Federal Agency for this process.

17
Army Corps of Engineers Permit Overview
• November 2014: TDI-NE submits Section 10 and 404 Applications to US Army Corps of Engineers
• April 2015: After consultation with the US Army Corps, the Application is revised and resubmitted
• July 2015: Application deemed complete and noticed to the public
• August 2015: Public notice period ended with minimal comments
• No public hearing scheduled
• November 2015: Permit expected to be issued by the
Army Corps
Section 10 of the Rivers and Harbors Act and Section 404 of the Clean Water Act require that
permits must be obtained from the US Army Corps of Engineers in order to construct the Project.

18
Interconnection Status (U.S. and Canada)
U.S. Interconnection
• October 2013: Original Interconnection Request
(Q425) filed with ISO-NE for US Interconnection
• February 2015: System Impact Studies work by PTI-
Siemens completed and submitted to ISO-NE
• February 2015: ISO-NE issued new ETU Procedures
and NECPL assigned new Queue Position (Q501)
• Q2-2016: ISO-NE studies expected to be complete
for the Project
Canadian Interconnection
• October 2013: Interconnection Request filed with
Hydro- Quebec TransÉnergie for Canadian
Interconnection (177T)
• February 2014: Signed System Impact Study
Agreement
• Q4-2015: Interconnection studies expected to be
completed in Quebec
Proposed Interconnection Location near Coolidge Substation in Ludlow
Proposed Converter Station
Coolidge 345 kV AC Substation

19
NECPL – FERC Approval (Open Solicitation)
On March 10, 2014, FERC issued an order granting authority to TDI-NE to sell
transmission rights on the NECPL at negotiated rates
• FERC’s Order authorizes TDI-NE to allocatetransmission capacity on the project through anopen solicitation
• The Open Solicitation requires TDI-NE to 1)broadly solicit interest from potential customers,and 2) allocate transmission capacity in a mannerthat is not unduly discriminatory or preferential
• TDI-NE anticipates commencing the OpenSolicitation process early in the fourth quarter of2015

20
� NECPL PROJECT OVERVIEW
� TIMELINE AND OUTREACH
� REGULATORY OVERVIEW
� VALUE PROPOSITION
� PROJECT DEMAND
VALUE PROPOSITION

21
NECPL – Project Need
• New England Governors and Eastern Canadian Premiers issue Sept. 2013 resolution on Energy (37-1), recognizing the need to increase Canadian Hydro in New England
• Governors and Eastern Canadian Premiers have reaffirmed their commitment to increased renewable imports at Meetings in April, 2015 (CT) and August, 2015 (Newfoundland)
New England Governors
New England Governors
• ISO-NE states 3,500 MW of generation will retire by 2018 within New England
• ISO-NE states an additional 6,000 MW of existing generation at risk of retiring within New England
Power Plant RetirementsPower Plant Retirements
• All six New England States are within the top 11 nationally in the price of electricity
• New England is moving to increase Canadian hydro and wind imports as a counterweight to natural gas, which in 2014 comprised approximately 44% of the region’s electricity production
• Overdependence on Natural Gas resulted in approximately $3 billion in additional electricity costs to Region during 2014 winter
ISO-NE: Fuel Diversity & Regional
Power / Capacity Prices
ISO-NE: Fuel Diversity & Regional
Power / Capacity Prices
• All six New England State have aggressive Renewable Portfolio Standards
• Massachusetts Global Warming Solutions Act (25% GHG reduction below 1990 levels by 2020 and 80% by 2050) largest driver of clean energy in New England
Climate Change Objectives
Climate Change Objectives

22
• ISO-NE, one of the most liquid U.S. wholesale power markets, covers the six New England states with peak demand in 2014 of approximately 24,443 MW
• ISO-NE operates several markets, acts as system operator, and is responsible for transmission and other aspects of planning for New England
• ISO-NE is subject to Federal Energy Regulatory Commission (FERC) jurisdiction
• The two principal ISO-NE markets are the energy market and the Forward Capacity Market (FCM)
• Renewable Energy Credits (RECs) in ISO-NE also add significant revenue for qualifying resources
• Other ISO-NE characteristics:
‒ 6.5 million households and businesses; population of 14 million
‒ ~350 generators
‒ ~31,000 MW of generating capacity
‒ Over 8,500 miles of high-voltage transmission lines
‒ 13 existing interconnections to power systems in New York & Canada
‒ All-time peak demand of 28,130 MW on August 2, 2006
‒ $10.5B traded in wholesale electricity markets in 2014 ($9.1B in energy markets, $1.4B in capacity and ancillary services markets)
‒ More than 400 buyers & sellers in the market
New England 2014 Energy Mix by Fuel Type
Market Opportunities – ISO-NE Overview
Wholesale Load Zones in New England
Source: ISO-NE 2015 Regional Electricity Outlook.
23
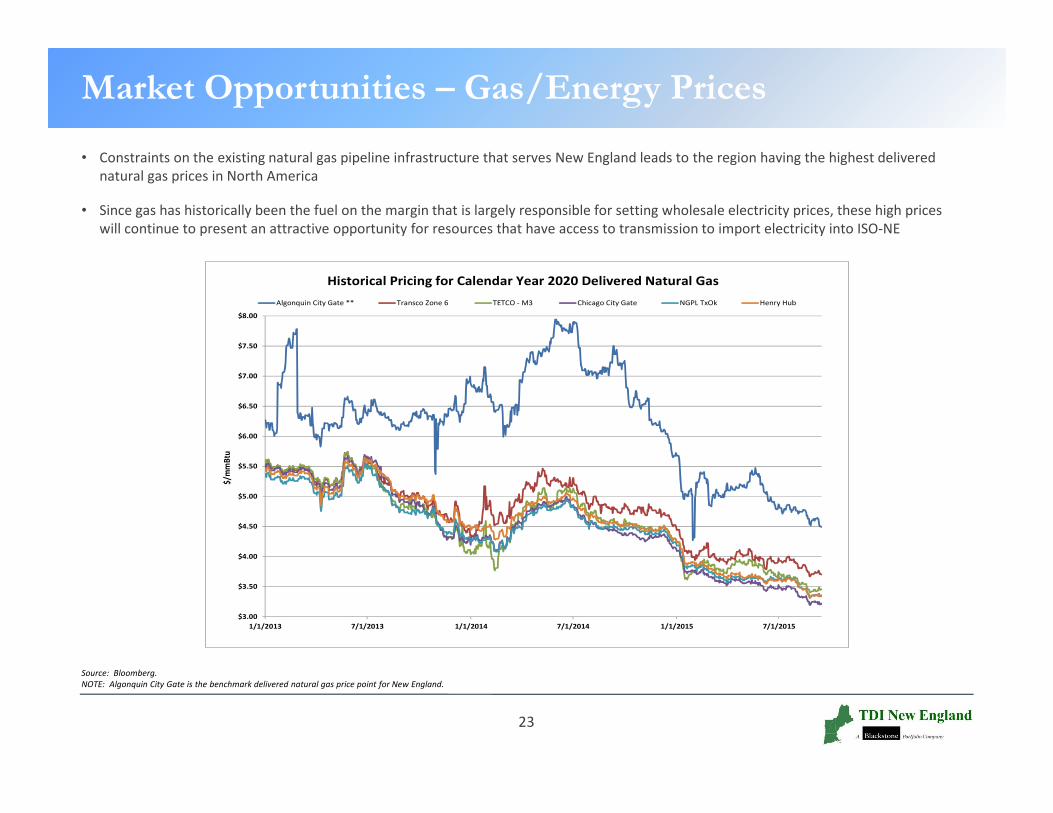
Source: Bloomberg.
NOTE: Algonquin City Gate is the benchmark delivered natural gas price point for New England.
$3.00
$3.50
$4.00
$4.50
$5.00
$5.50
$6.00
$6.50
$7.00
$7.50
$8.00
1/1/2013 7/1/2013 1/1/2014 7/1/2014 1/1/2015 7/1/2015
Algonquin City Gate ** Transco Zone 6 TETCO - M3 Chicago City Gate NGPL TxOk Henry Hub
$/m
mB
tu
Historical Pricing for Calendar Year 2020 Delivered Natural Gas
Market Opportunities – Gas/Energy Prices
• Constraints on the existing natural gas pipeline infrastructure that serves New England leads to the region having the highest delivered natural gas prices in North America
• Since gas has historically been the fuel on the margin that is largely responsible for setting wholesale electricity prices, these high prices will continue to present an attractive opportunity for resources that have access to transmission to import electricity into ISO-NE

24
Market Opportunities – Energy Prices
Source: Bloomberg as of 9/15/15.
• Energy prices in New England are expected to be in-line with New York City, one of the most expensive energy markets in the U.S.

25
$0.00
$2.00
$4.00
$6.00
$8.00
$10.00
$12.00
2007 2008 2009 2010 2011 2012 2013 2014 2015 2016 2017 2018 2019 2020
ISO-NE PJM NY ROS
$/k
W-M
th
Historical and Forecasted Capacity Prices
Source: ISO-NE, NYISO, PJM, LEI, ICF, and PA Consulting
Market Opportunities – Capacity Market
• With the implementation of the sloped demand curve, pay for performance penalties for generators with capacity supply obligations, and the planned retirement of significant nuclear/coal/oil generation, capacity prices in ISO-NE have outpaced those of surrounding regions and are expected to remain strong into the future

26
Source: Bloomberg as of September 9, 2015.
NOTE: Capacity Prices all converted to $/MWh for comparison
• When combining energy, capacity and REC prices together, ISO-NE provides renewable resources with access to import transmission and forecasted strong economics relative to the rest of the country
Market Opportunities – RECs
State REC ID Name Tenor $/MWh
Texas Texas Wind REC 2017 $0.75
California CA Bucket 3 2015 $1.00
Indiana Wind REC BH/FH 2015 $1.00
New Jersey NJ Class 1 2017 $16.50
Pennsylvania PA Tier 1 2017 $15.88
New York NYSERDA RFP 2554 10-yr term $34.95
Massachusetts MA Class 1 2017 $48.00
(in $/MWh) ERCOT-N NYISO-A NYISO-J NEPOOL PJM-W PJM-E SP-15 NP-15 MISO
Cal '20 OnPeak $37.00 $38.00 $51.80 $51.55 $40.15 $48.60 $40.20 $39.90 $38.70
Cal '20 OffPeak $25.25 $25.75 $35.10 $37.15 $28.70 $33.40 $34.00 $33.90 $28.35
Cal '20 ATC $30.75 $31.45 $42.85 $43.90 $34.05 $40.50 $37.45 $37.25 $33.20
Capacity n/a $9.19 $18.79 $13.52 $9.11 $9.11 n/a n/a $8.56
REC's $0.75 $34.95 $34.95 $48.00 $15.88 $16.50 $1.00 $1.00 $1.00
(REC Year) 2017 RFP 2554 2017 2017 2017 2015 2015
REC ID Name GE TX Wind NYSERDA MA Class 1 PA Tier 1 NJ Class 1 CA Bucket 3 Wind REC BH/FH
Total $31.50 $75.59 $96.59 $105.42 $59.04 $66.11 $38.45 $38.25 $42.76
• Due to aggressive RPS standards coupled with a difficult greenfield regulatory environment for siting new generation resources, Renewable Energy Credits (RECs) in New England are the most valuable in the country

27
Greenhouse Gas Reduction Goals
Source: Rhode Island State Energy Plan presentation (April 2014).
State GHG Reduction Goal Source
Massachusetts 80% below 1990 by 2050 2008 MA Global Warming Solutions Act
Connecticut 80% below 2001 by 2050 2008 CT Global Warming Solutions Act
Vermont 75% below 1990 by 2050 10 V.S.A. § 578
New Hampshire 80% below 1990 by 2050 New Hampshire Climate Action Plan (2009)
Maine 75-80% below 2003 long-term Act to Provide Leadership in Addressing the Threat of Climate Change (2003)
Rhode Island 75-85% below 2002 long-term Rhode Island Greenhouse Gas Action Plan (2002)
• Every New England State has adopted a legislative or executive goal of an approximately 80% reduction in greenhouse gas emissions by ~2050
28
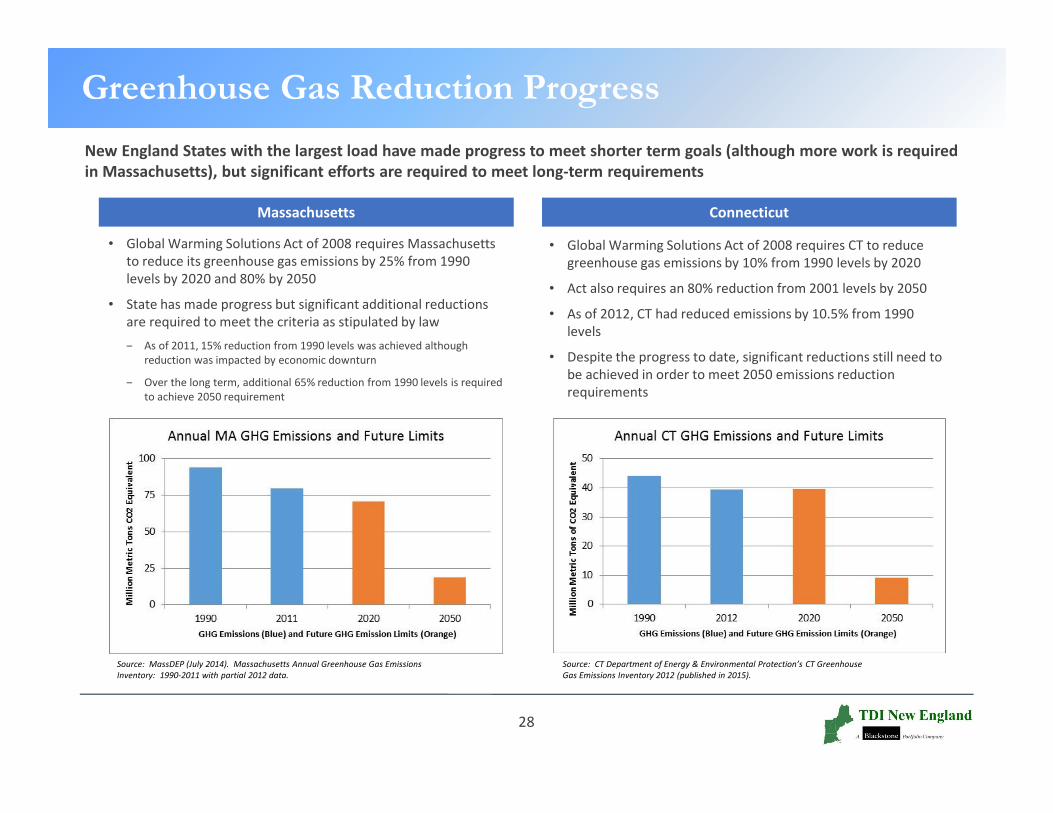
New England States with the largest load have made progress to meet shorter term goals (although more work is required
in Massachusetts), but significant efforts are required to meet long-term requirements
Greenhouse Gas Reduction Progress
Massachusetts Connecticut
• Global Warming Solutions Act of 2008 requires Massachusetts to reduce its greenhouse gas emissions by 25% from 1990 levels by 2020 and 80% by 2050
• State has made progress but significant additional reductions are required to meet the criteria as stipulated by law
‒ As of 2011, 15% reduction from 1990 levels was achieved although reduction was impacted by economic downturn
‒ Over the long term, additional 65% reduction from 1990 levels is required to achieve 2050 requirement
Source: MassDEP (July 2014). Massachusetts Annual Greenhouse Gas Emissions
Inventory: 1990-2011 with partial 2012 data.
• Global Warming Solutions Act of 2008 requires CT to reduce greenhouse gas emissions by 10% from 1990 levels by 2020
• Act also requires an 80% reduction from 2001 levels by 2050
• As of 2012, CT had reduced emissions by 10.5% from 1990 levels
• Despite the progress to date, significant reductions still need to be achieved in order to meet 2050 emissions reduction requirements
Source: CT Department of Energy & Environmental Protection’s CT Greenhouse
Gas Emissions Inventory 2012 (published in 2015).
29
� NECPL PROJECT OVERVIEW
� TIMELINE AND OUTREACH
� REGULATORY OVERVIEW
� VALUE PROPOSITION
� PROJECT DEMAND
PROJECT DEMAND
30
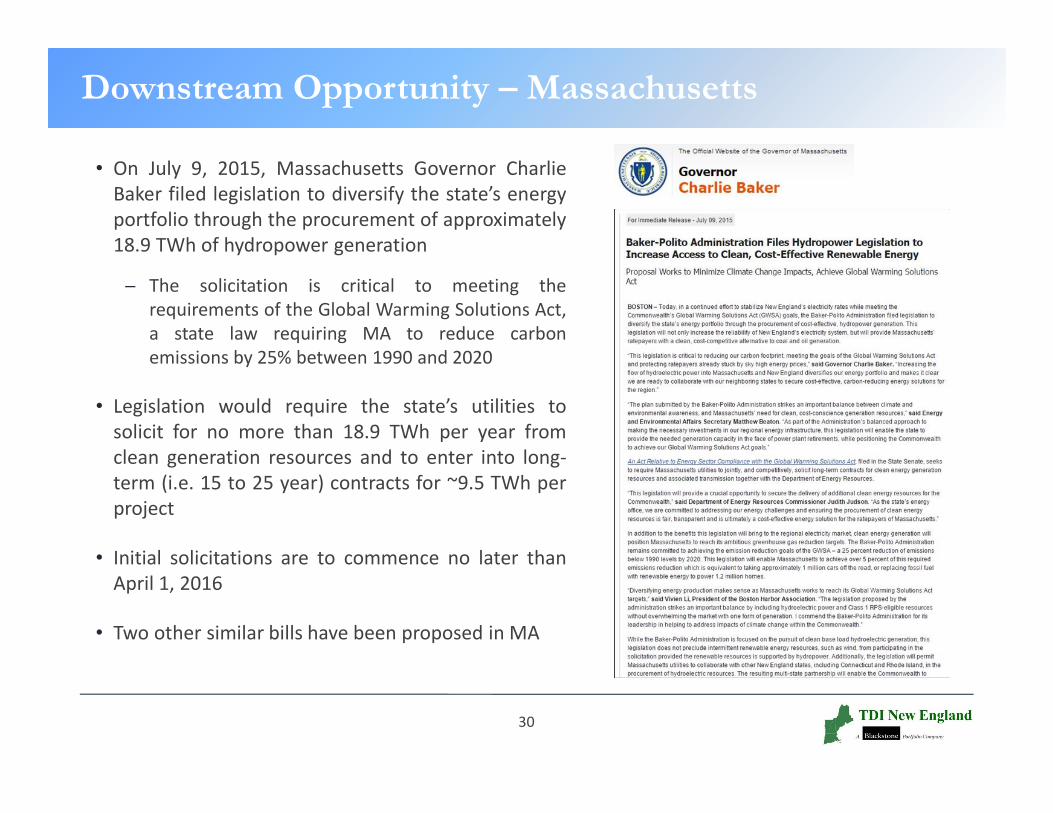
Downstream Opportunity – Massachusetts
• On July 9, 2015, Massachusetts Governor CharlieBaker filed legislation to diversify the state’s energyportfolio through the procurement of approximately18.9 TWh of hydropower generation
─ The solicitation is critical to meeting therequirements of the Global Warming Solutions Act,a state law requiring MA to reduce carbonemissions by 25% between 1990 and 2020
• Legislation would require the state’s utilities tosolicit for no more than 18.9 TWh per year fromclean generation resources and to enter into long-term (i.e. 15 to 25 year) contracts for ~9.5 TWh perproject
• Initial solicitations are to commence no later thanApril 1, 2016
• Two other similar bills have been proposed in MA

31
Downstream Opportunity – Tri-State RFP
• RFP sponsored by CT, MA, and RI for Hydro and Class Irenewables
• Solicitation is smaller relative to potential MA legislation
• PPAs would only be for energy – capacity to participatein the FCM (per CT statutes)
• Final RFP expected to be issued in October, 2015
• More advanced than MA legislation although one yearfrom final RFP issuance to approval
• Soliciting parties want incremental clean energy
─ For imports, defined as increase in imports to New England
• Includes a transmission only option
─ Can incorporate a negotiated rate rather than cost-of-service
─ Payments tied to actual incremental clean energy delivered
32
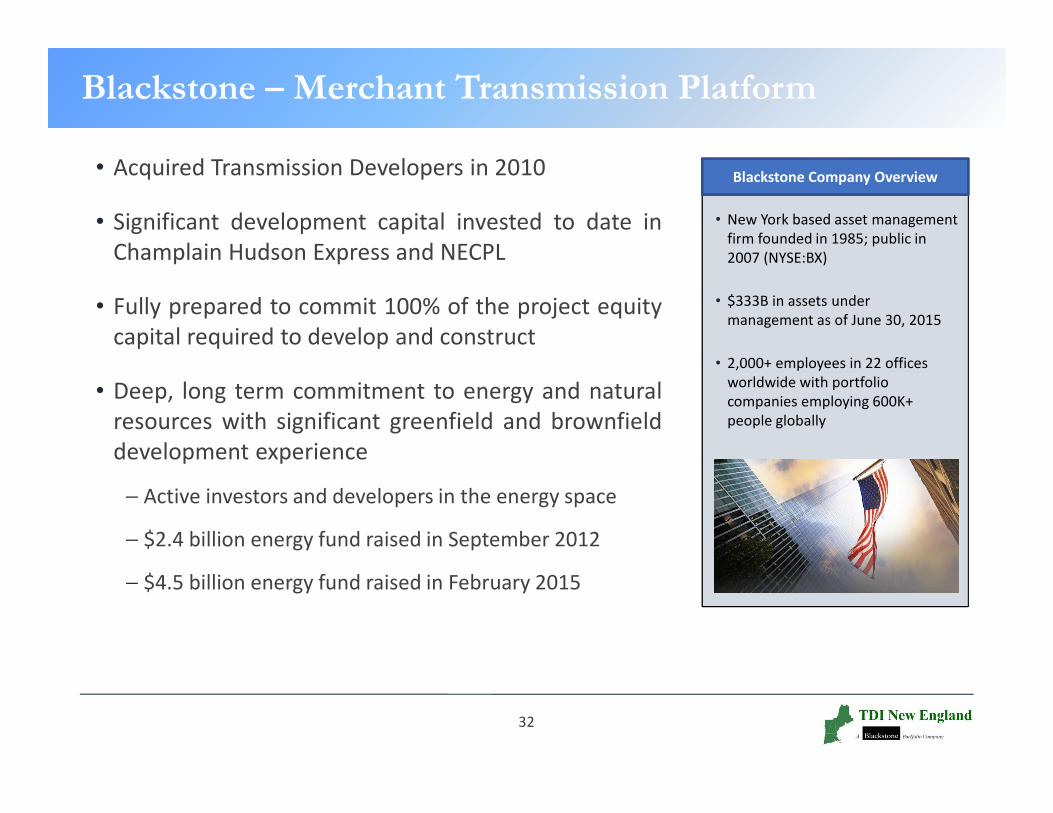
Blackstone – Merchant Transmission Platform
• Acquired Transmission Developers in 2010
• Significant development capital invested to date inChamplain Hudson Express and NECPL
• Fully prepared to commit 100% of the project equitycapital required to develop and construct
• Deep, long term commitment to energy and naturalresources with significant greenfield and brownfielddevelopment experience
− Active investors and developers in the energy space
− $2.4 billion energy fund raised in September 2012
− $4.5 billion energy fund raised in February 2015
Blackstone Company Overview
• New York based asset management firm founded in 1985; public in 2007 (NYSE:BX)
• $333B in assets under management as of June 30, 2015
• 2,000+ employees in 22 offices worldwide with portfolio companies employing 600K+ people globally

33
Additional Information
Company Website: www.transmissiondevelopers.com
Project Website: www.necplink.com
Project NEPA (DOE EIS) Website: www.necplinkeis.com
VT State Siting Website: www.psb.vermont.gov/docketsandprojects/electric/8400
Project Regulatory Documents: www.necplink.com/regulatory-documents.php
Champlain Hudson Power Express Website: www.chpexpress.com
34
Contact Information
TDI New EnglandPO Box 155
Charlotte, VT 05445(802) [email protected]
www.necplink.com
Contact: Josh Bagnato | [email protected] | (802) 885-3890