new england common assessment program 11 science ess1 (9–11) ... predict the likelihood for an...
TRANSCRIPT
NEW ENGLAND COMMON ASSESSMENT PROGRAM
Released ItemsSupport Materials
2013
Grade 11Science
1NECAP 2013 Grade 11 Science Released Items_V2
NECAP 2013 RELEASED ITEMSGRADE 11 SCIENCE
Grade 11 Science Released Item Information
Item Number Big Idea1 Assessment Target
Depth of Knowledge
CodeItem Type 2 Answer Key
Total Possible Points
1 INQ PS 1-1 2 MC C 1
2 SAE PS 2-6 2 MC D 1
3 INQ PS 3-8 2 MC C 1
4 POC ESS 1-1 2 MC B 1
5 POC ESS 1-3 1 MC D 1
6 SAE ESS 3-8 2 MC B 1
7 POC ESS 1-1 2 CR 4
8 POC LS 1-2 2 MC C 1
9 INQ LS 3-6 2 MC C 1
10 FAF LS 3-8 1 MC A 1
Grade 11 Science Released Inquiry Task Information
Item Number Big Idea1 Inquiry ConstructDepth of
Knowledge Code
Item Type 2Total
Possible Points
1 INQ 12 2 SA 2
2 INQ 11 2 SA 2
3 INQ 2 3 CR 3
4 INQ 1 3 SA 2
5 INQ 8 2 CR 3
6 INQ 12 2 SA 2
7 INQ 12 3 SA 2
8 INQ 12 2 SA 2
1Big Idea: NOS = Nature of Science, SAE = Systems and Energy, MAS = Models and Scale, POC = Patterns of Change, FAF = Form and Function, INQ = Scientifi c Inquiry
2Item Type: MC = Multiple Choice, CR = Constructed Response, SA = Short Answer
2NECAP 2013 Grade 11 Science Released Items_V2
NECAP 2013 RELEASED ITEMSGRADE 11 SCIENCE
219600.011 219601 C Common, CMN
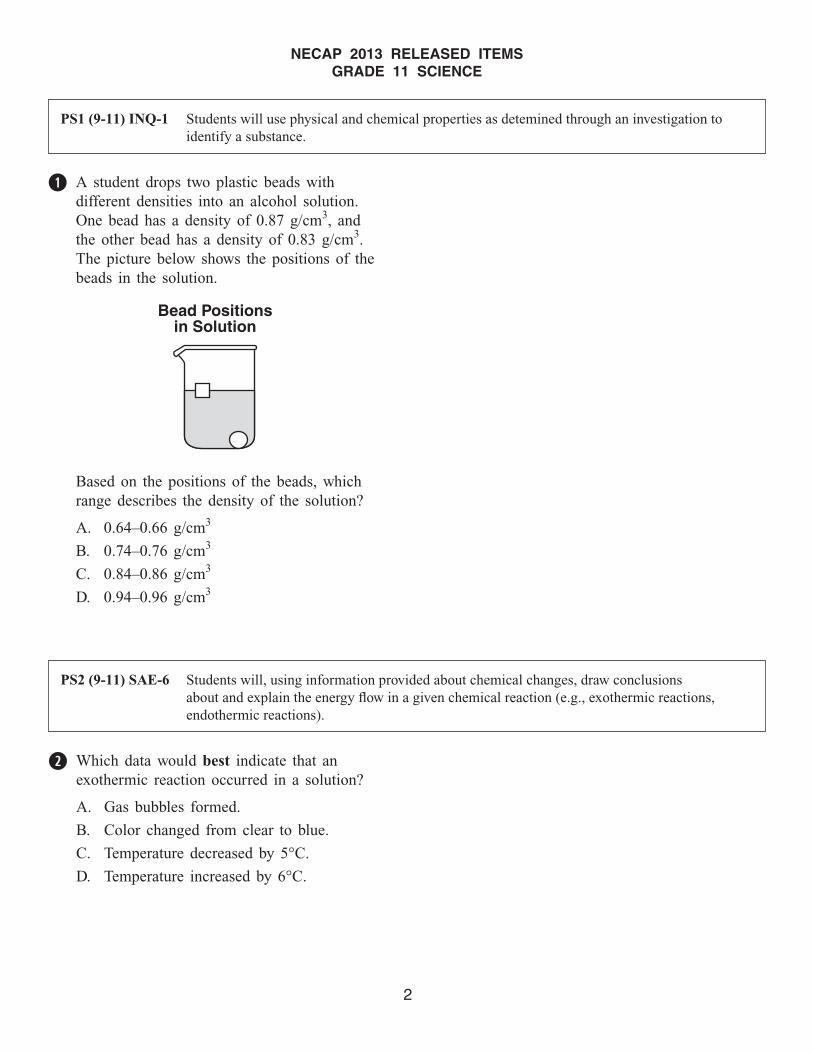
q A student drops two plastic beads with different densities into an alcohol solution. One bead has a density of 0.87 g/cm3, and the other bead has a density of 0.83 g/cm3. The picture below shows the positions of the beads in the solution.
Bead Positionsin Solution
Based on the positions of the beads, which range describes the density of the solution?
A. 0.64–0.66 g/cm3
B. 0.74–0.76 g/cm3
C. 0.84–0.86 g/cm3
D. 0.94–0.96 g/cm3
219502.009 219503 D Common, CMN
w Which data would best indicate that an exothermic reaction occurred in a solution?
A. Gas bubbles formed.
B. Color changed from clear to blue.
C. Temperature decreased by 5°C.
D. Temperature increased by 6°C.
PS1 (9-11) INQ-1 Students will use physical and chemical properties as detemined through an investigation to identify a substance.
PS2 (9-11) SAE-6 Students will, using information provided about chemical changes, draw conclusions about and explain the energy fl ow in a given chemical reaction (e.g., exothermic reactions, endothermic reactions).
3NECAP 2013 Grade 11 Science Released Items_V2
NECAP 2013 RELEASED ITEMSGRADE 11 SCIENCE
60176.006 60178 C Common, CMN
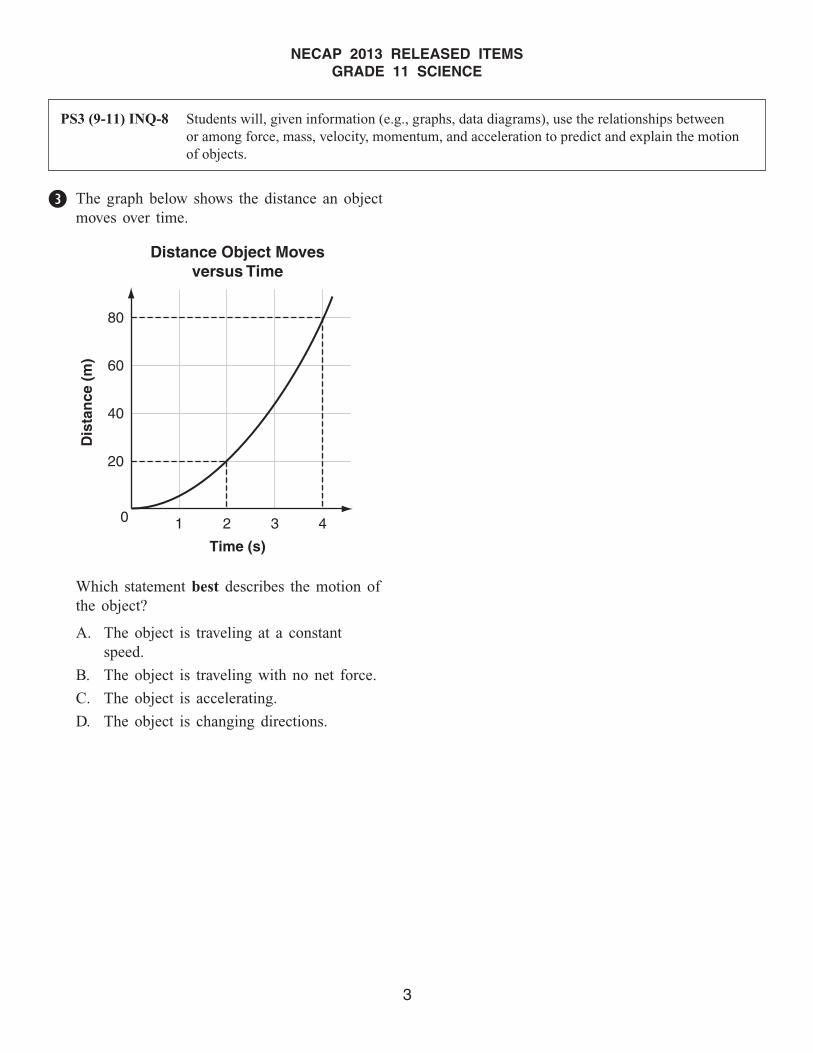
e The graph below shows the distance an object moves over time.
210 3 4
20
40
60
80
Dis
tan
ce (
m)
Time (s)
Distance Object Movesversus Time
Which statement best describes the motion of the object?
A. The object is traveling at a constant speed.
B. The object is traveling with no net force.
C. The object is accelerating.
D. The object is changing directions.
PS3 (9-11) INQ-8 Students will, given information (e.g., graphs, data diagrams), use the relationships between or among force, mass, velocity, momentum, and acceleration to predict and explain the motion of objects.
4NECAP 2013 Grade 11 Science Released Items_V2
NECAP 2013 RELEASED ITEMSGRADE 11 SCIENCE
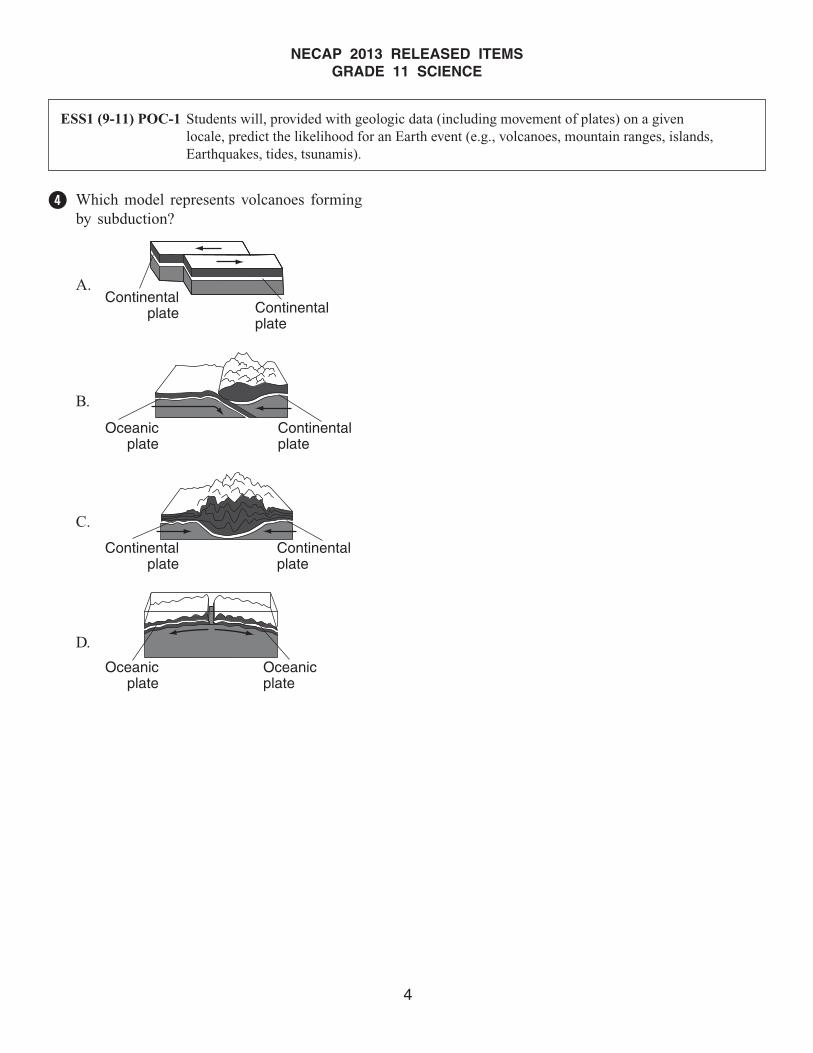
ESS1 (9-11) POC-1 Students will, provided with geologic data (including movement of plates) on a given locale, predict the likelihood for an Earth event (e.g., volcanoes, mountain ranges, islands, Earthquakes, tides, tsunamis).
146938.007 146939 B Common, CMN
r Which model represents volcanoes forming by subduction?
A.
Continentalplate
Continentalplate
B.
Oceanicplate
Continentalplate
C.
Continentalplate
Continentalplate
D.
Oceanicplate
Oceanicplate
5NECAP 2013 Grade 11 Science Released Items_V2
NECAP 2013 RELEASED ITEMSGRADE 11 SCIENCE
ESS1 (9–11) POC-3 Students will explain how internal and external sources of heat (energy) fuel geologic processes (e.g., rock cycle, plate tectonics, sea fl oor spreading).
89256.006 D Common, CMN
t Why do many mountains have cores made of metamorphic rocks?
A. Metamorphic rocks are the only rocks that form underground.
B. Metamorphic rocks are the only rocks found in mountains.
C. Metamorphic rocks are pushed down from Earth’s surface when plates collide.
D. Metamorphic rocks are formed by heat and pressure when mountains form.
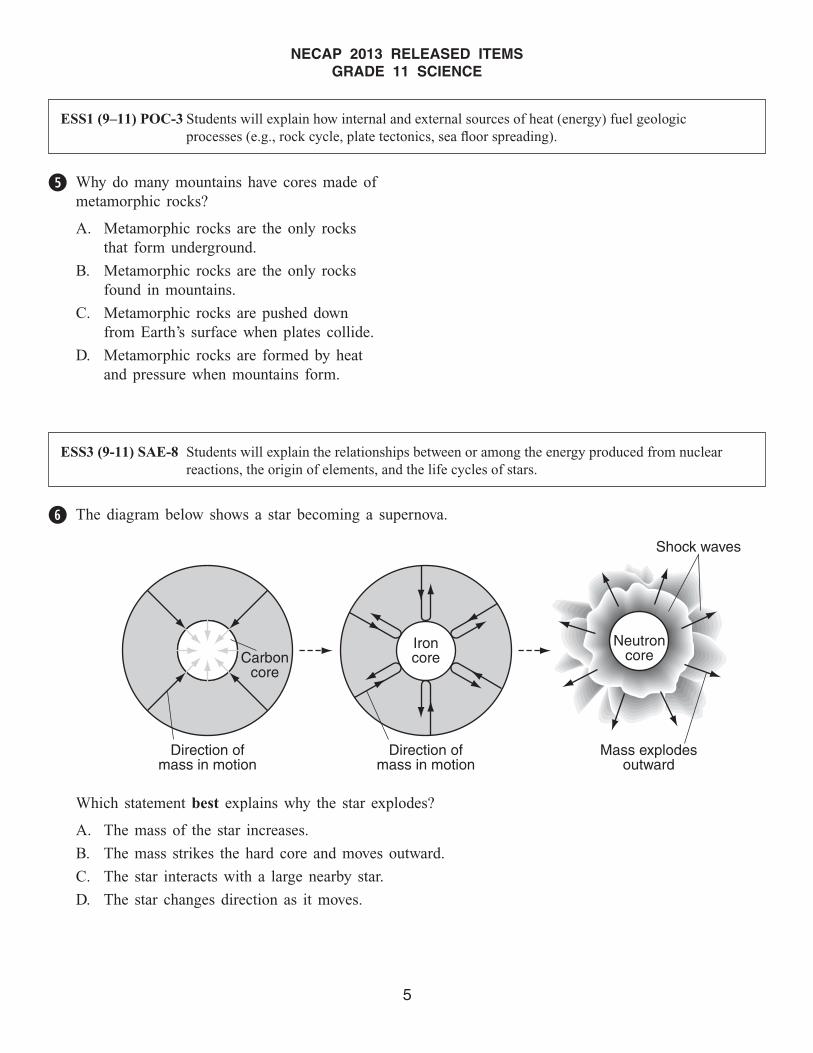
ESS3 (9-11) SAE-8 Students will explain the relationships between or among the energy produced from nuclear reactions, the origin of elements, and the life cycles of stars.
146946.006 146947 B Common, CMN
y The diagram below shows a star becoming a supernova.
Ironcore
Direction ofmass in motion
Direction ofmass in motion
Carboncore
Mass explodesoutward
Neutroncore
Shock waves
Which statement best explains why the star explodes?
A. The mass of the star increases.
B. The mass strikes the hard core and moves outward.
C. The star interacts with a large nearby star.
D. The star changes direction as it moves.
6NECAP 2013 Grade 11 Science Released Items_V2
NECAP 2013 RELEASED ITEMSGRADE 11 SCIENCE
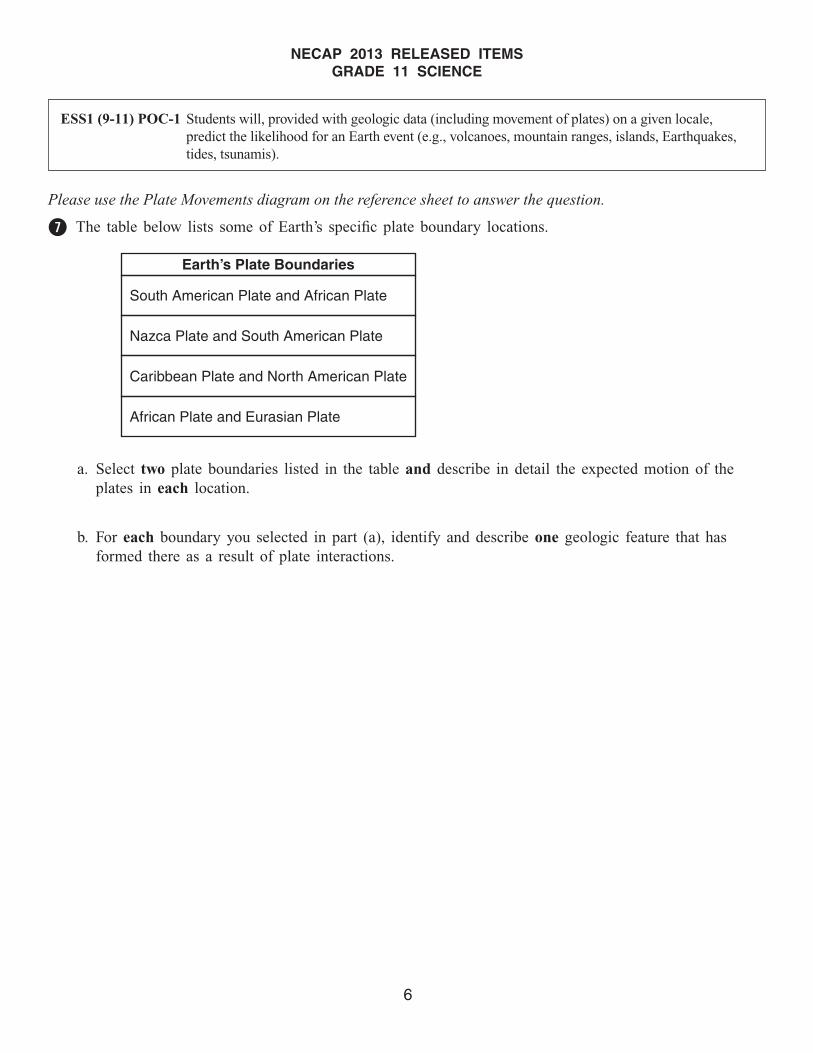
ESS1 (9-11) POC-1 Students will, provided with geologic data (including movement of plates) on a given locale, predict the likelihood for an Earth event (e.g., volcanoes, mountain ranges, islands, Earthquakes, tides, tsunamis).
59987.012 59988 Common, CMN
Please use the Plate Movements diagram on the reference sheet to answer the question.
u The table below lists some of Earth’s specifi c plate boundary locations.
Earth’s Plate Boundaries
South American Plate and African Plate
Nazca Plate and South American Plate
Caribbean Plate and North American Plate
African Plate and Eurasian Plate
a. Select two plate boundaries listed in the table and describe in detail the expected motion of the plates in each location.
b. For each boundary you selected in part (a), identify and describe one geologic feature that has formed there as a result of plate interactions.
7NECAP 2013 Grade 11 Science Released Items_V2
NECAP 2013 RELEASED ITEMSGRADE 11 SCIENCE
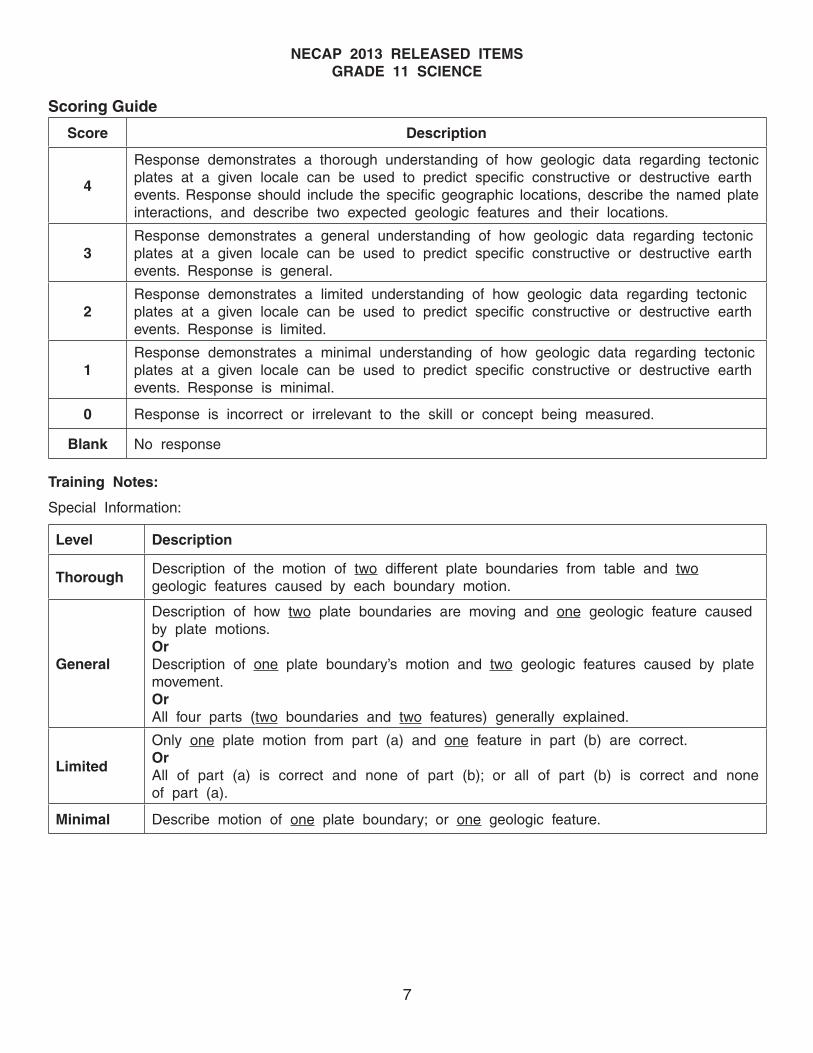
Scoring Guide
Score Description
4
Response demonstrates a thorough understanding of how geologic data regarding tectonicplates at a given locale can be used to predict specifi c constructive or destructive earthevents. Response should include the specifi c geographic locations, describe the named plateinteractions, and describe two expected geologic features and their locations.
3Response demonstrates a general understanding of how geologic data regarding tectonicplates at a given locale can be used to predict specifi c constructive or destructive earthevents. Response is general.
2Response demonstrates a limited understanding of how geologic data regarding tectonicplates at a given locale can be used to predict specifi c constructive or destructive earthevents. Response is limited.
1Response demonstrates a minimal understanding of how geologic data regarding tectonicplates at a given locale can be used to predict specifi c constructive or destructive earthevents. Response is minimal.
0 Response is incorrect or irrelevant to the skill or concept being measured.
Blank No response
Training Notes:
Special Information:
Level Description
ThoroughDescription of the motion of two different plate boundaries from table and two geologic features caused by each boundary motion.
General
Description of how two plate boundaries are moving and one geologic feature caused by plate motions. Or Description of one plate boundary’s motion and two geologic features caused by plate movement. Or All four parts (two boundaries and two features) generally explained.
Limited
Only one plate motion from part (a) and one feature in part (b) are correct. Or All of part (a) is correct and none of part (b); or all of part (b) is correct and none of part (a).
Minimal Describe motion of one plate boundary; or one geologic feature.
8NECAP 2013 Grade 11 Science Released Items_V2
NECAP 2013 RELEASED ITEMSGRADE 11 SCIENCE
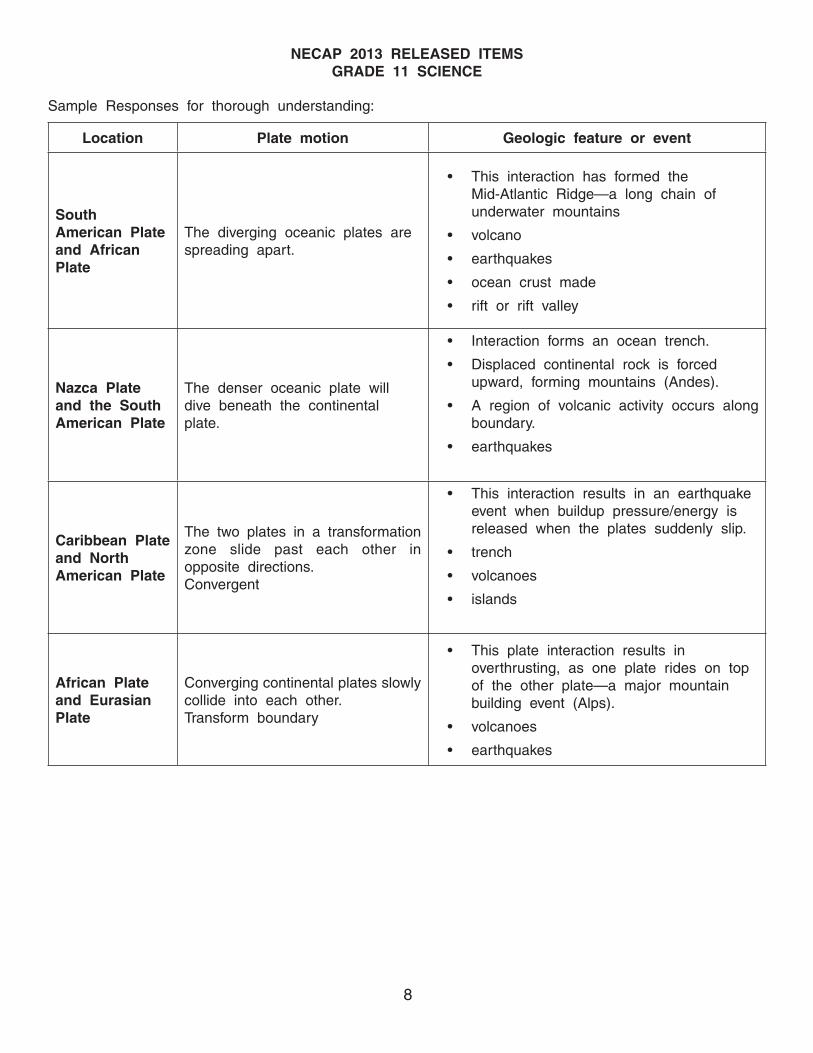
Sample Responses for thorough understanding:
Location Plate motion Geologic feature or event
South American Plate and African Plate
The diverging oceanic plates are spreading apart.
• This interaction has formed the Mid-Atlantic Ridge—a long chain of underwater mountains
• volcano
• earthquakes
• ocean crust made
• rift or rift valley
Nazca Plate and the South American Plate
The denser oceanic plate will dive beneath the continental plate.
• Interaction forms an ocean trench.
• Displaced continental rock is forced upward, forming mountains (Andes).
• A region of volcanic activity occurs along boundary.
• earthquakes
Caribbean Plate and North American Plate
The two plates in a transformation zone slide past each other in opposite directions.Convergent
• This interaction results in an earthquake event when buildup pressure/energy is released when the plates suddenly slip.
• trench
• volcanoes
• islands
African Plate and Eurasian Plate
Converging continental plates slowly collide into each other.Transform boundary
• This plate interaction results in overthrusting, as one plate rides on top of the other plate—a major mountain building event (Alps).
• volcanoes
• earthquakes
9NECAP 2013 Grade 11 Science Released Items_V2
NECAP 2013 RELEASED ITEMSGRADE 11 SCIENCE
u
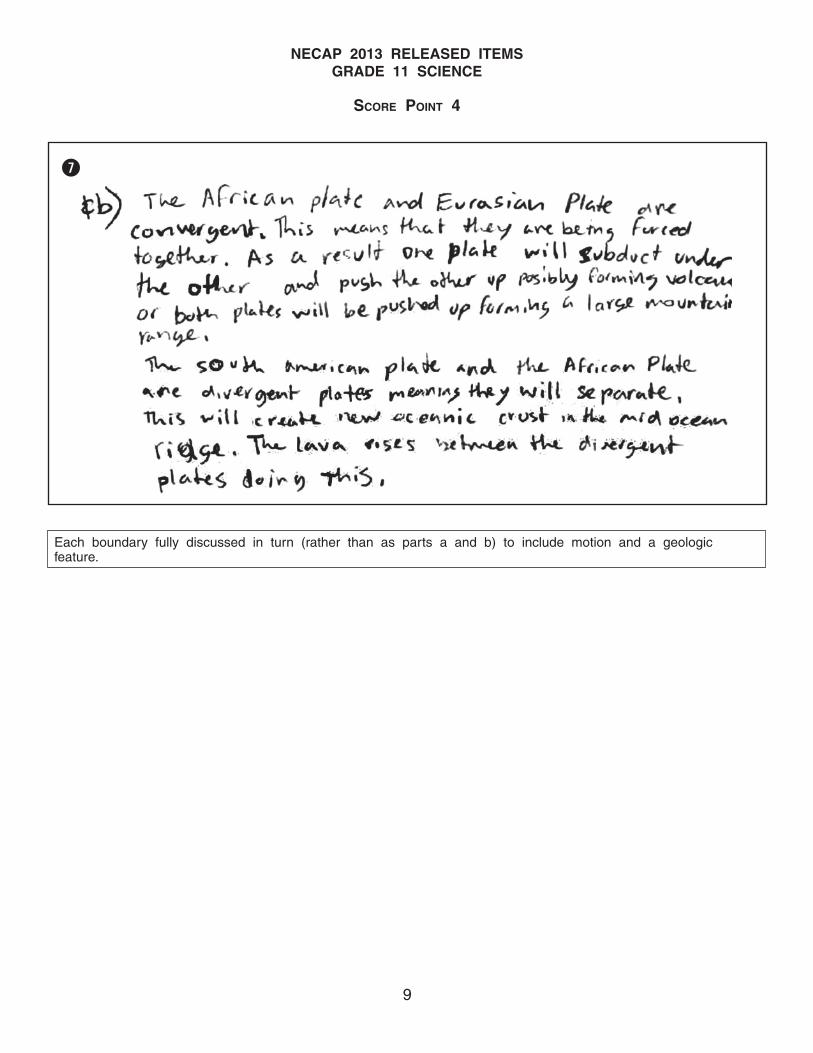
SCORE POINT 42103000110
Each boundary fully discussed in turn (rather than as parts a and b) to include motion and a geologic feature.
10NECAP 2013 Grade 11 Science Released Items_V2
NECAP 2013 RELEASED ITEMSGRADE 11 SCIENCE
u
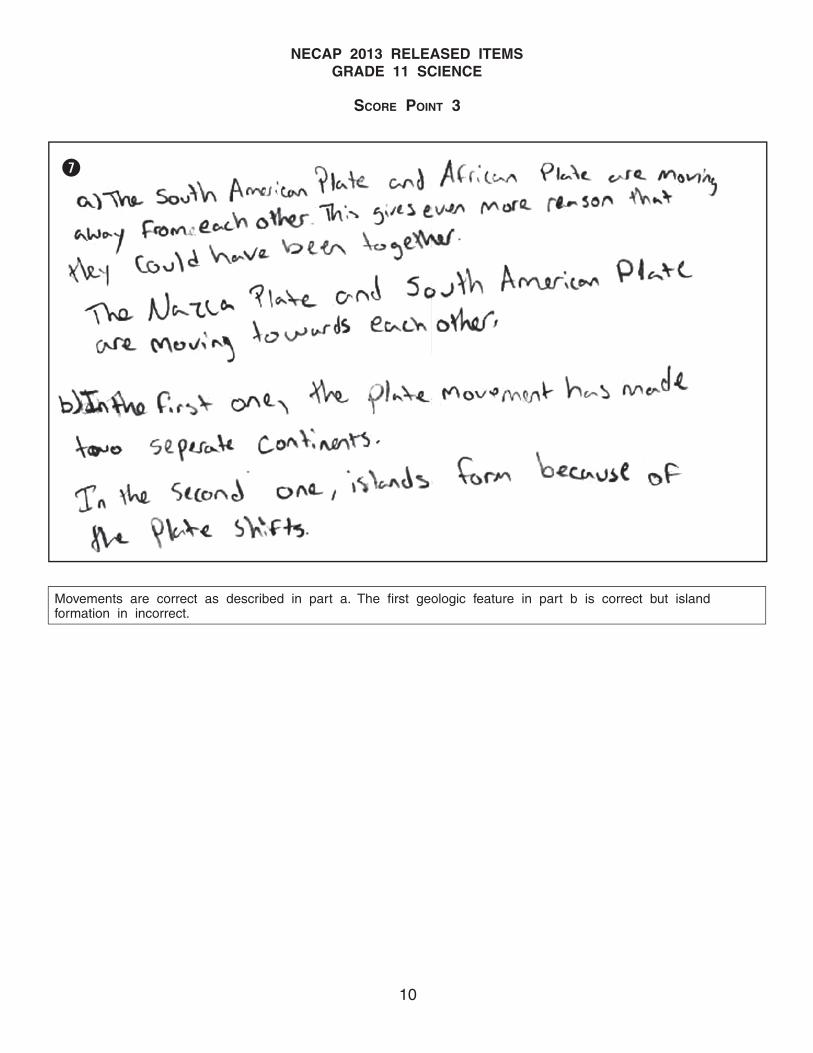
SCORE POINT 32103000232
Movements are correct as described in part a. The fi rst geologic feature in part b is correct but island formation in incorrect.
11NECAP 2013 Grade 11 Science Released Items_V2
NECAP 2013 RELEASED ITEMSGRADE 11 SCIENCE
u
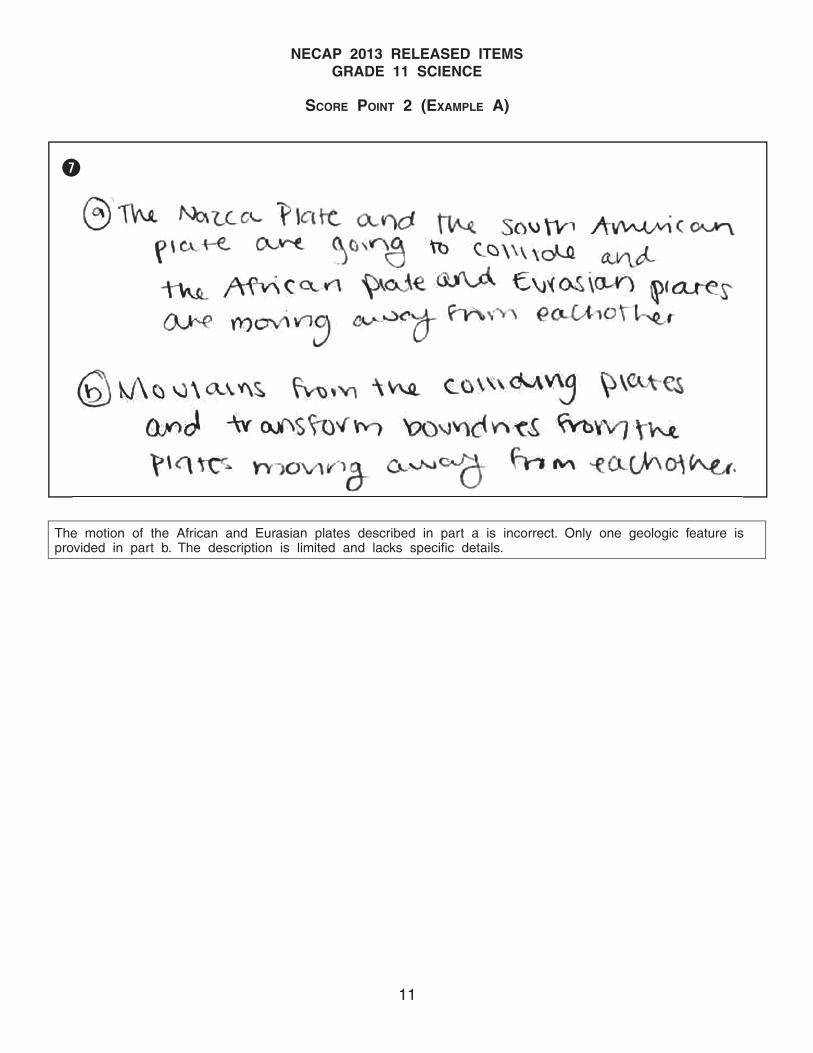
SCORE POINT 2 (EXAMPLE A)2103000087
The motion of the African and Eurasian plates described in part a is incorrect. Only one geologic feature is provided in part b. The description is limited and lacks specifi c details.
12NECAP 2013 Grade 11 Science Released Items_V2
NECAP 2013 RELEASED ITEMSGRADE 11 SCIENCE
u
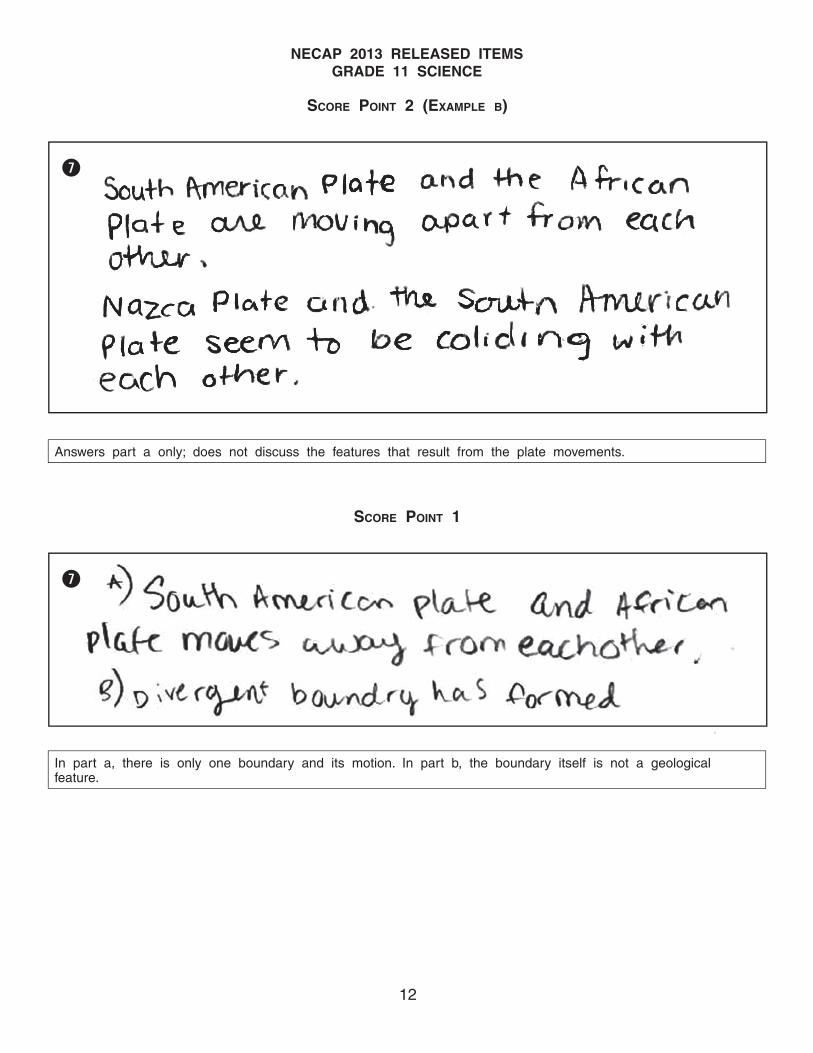
SCORE POINT 12103000257
In part a, there is only one boundary and its motion. In part b, the boundary itself is not a geological feature.
u
SCORE POINT 2 (EXAMPLE B)2103000235
Answers part a only; does not discuss the features that result from the plate movements.
13NECAP 2013 Grade 11 Science Released Items_V2
NECAP 2013 RELEASED ITEMSGRADE 11 SCIENCE
u
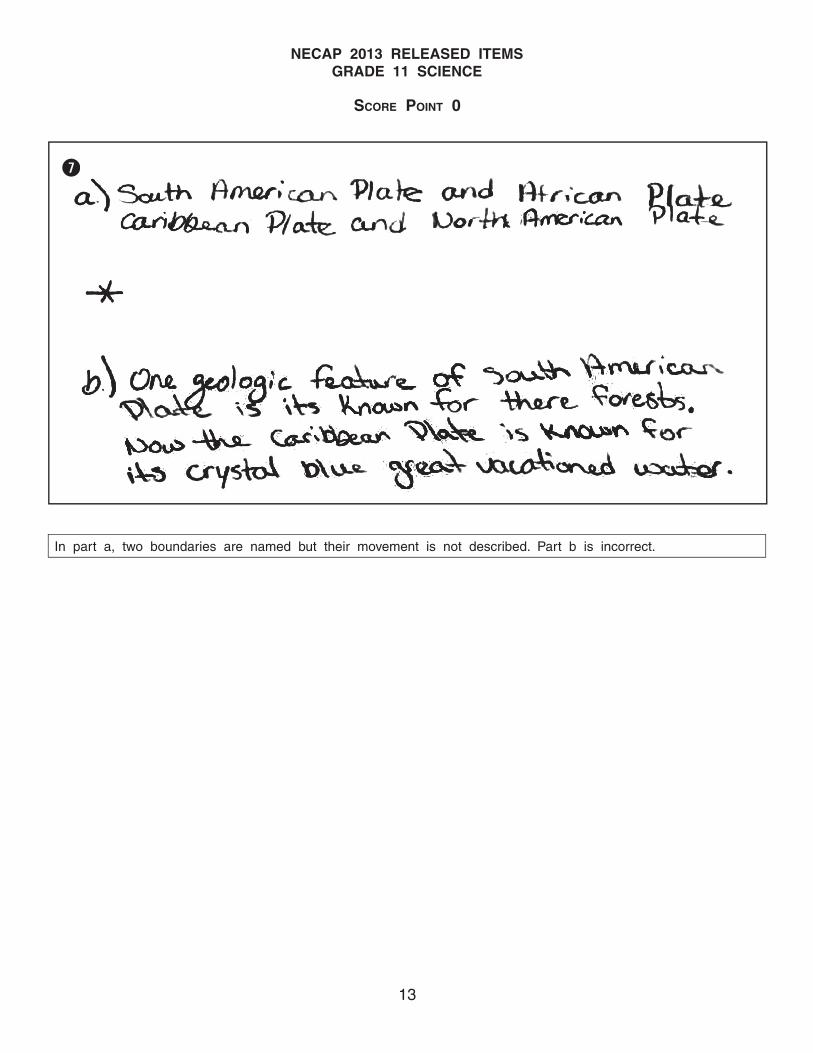
SCORE POINT 02103000270
u
In part a, two boundaries are named but their movement is not described. Part b is incorrect.
14NECAP 2013 Grade 11 Science Released Items_V2
NECAP 2013 RELEASED ITEMSGRADE 11 SCIENCE
48387.008 48388 C Common, CMN
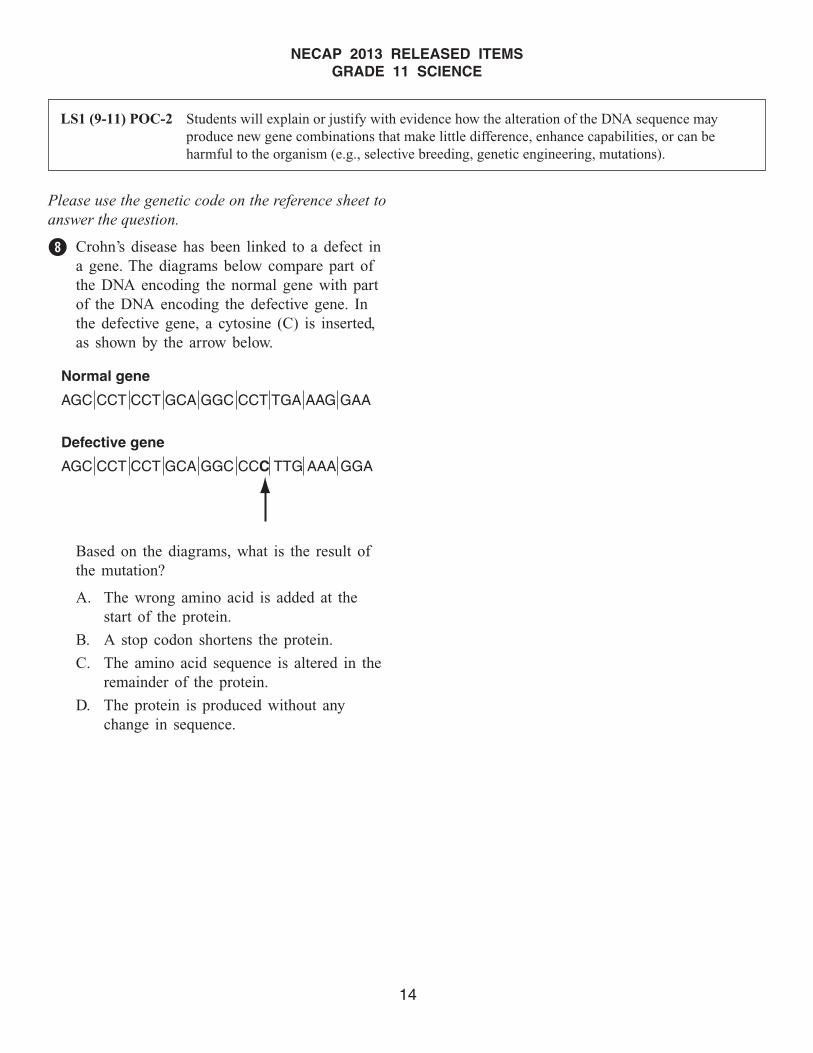
Please use the genetic code on the reference sheet to answer the question.
i Crohn’s disease has been linked to a defect in a gene. The diagrams below compare part of the DNA encoding the normal gene with part of the DNA encoding the defective gene. In the defective gene, a cytosine (C) is inserted, as shown by the arrow below.
Normal gene
AGC CCT CCT GCA GGC CCT TGA AAG GAA
Defective gene
AGC CCT CCT GCA GGC CCC TTG AAA GGA
Based on the diagrams, what is the result of the mutation?
A. The wrong amino acid is added at the start of the protein.
B. A stop codon shortens the protein.
C. The amino acid sequence is altered in the remainder of the protein.
D. The protein is produced without any change in sequence.
LS1 (9-11) POC-2 Students will explain or justify with evidence how the alteration of the DNA sequence may produce new gene combinations that make little difference, enhance capabilities, or can be harmful to the organism (e.g., selective breeding, genetic engineering, mutations).
15NECAP 2013 Grade 11 Science Released Items_V2
NECAP 2013 RELEASED ITEMSGRADE 11 SCIENCE
48409.008 48410 C Common, CMN
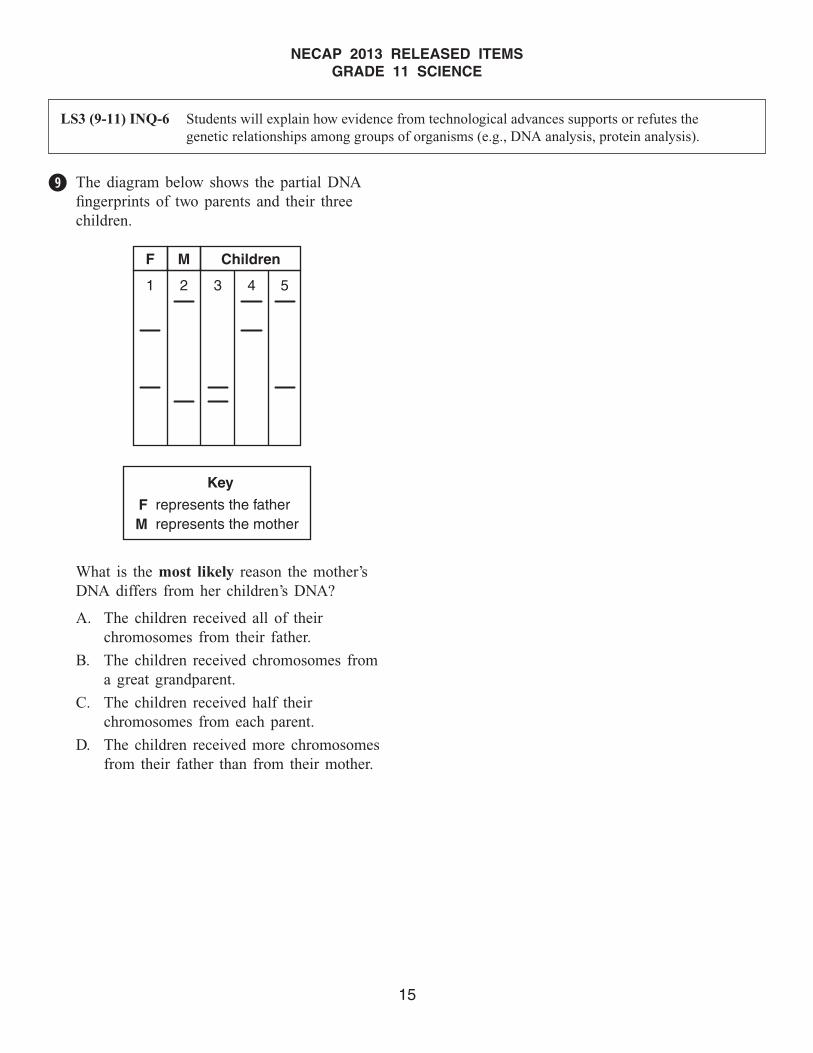
o The diagram below shows the partial DNA fi ngerprints of two parents and their three children.
1 2 3 4 5
ChildrenF M
Key
FM
represents the fatherrepresents the mother
What is the most likely reason the mother’s DNA differs from her children’s DNA?
A. The children received all of their chromosomes from their father.
B. The children received chromosomes from a great grandparent.
C. The children received half their chromosomes from each parent.
D. The children received more chromosomes from their father than from their mother.
LS3 (9-11) INQ-6 Students will explain how evidence from technological advances supports or refutes the genetic relationships among groups of organisms (e.g., DNA analysis, protein analysis).
16NECAP 2013 Grade 11 Science Released Items_V2
NECAP 2013 RELEASED ITEMSGRADE 11 SCIENCE
48425.007 48426 A Common, CMN
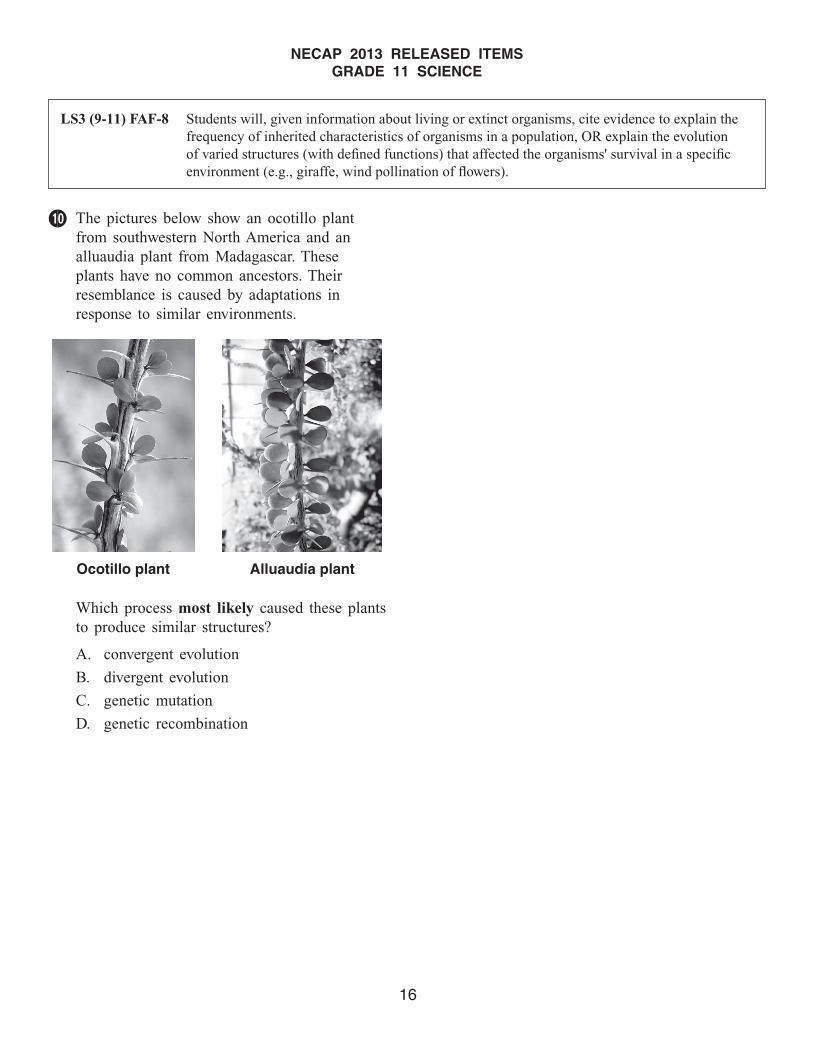
1) The pictures below show an ocotillo plant from southwestern North America and an alluaudia plant from Madagascar. These plants have no common ancestors. Their resemblance is caused by adaptations in response to similar environments.
Ocotillo plant Alluaudia plant
Which process most likely caused these plants to produce similar structures?
A. convergent evolution
B. divergent evolution
C. genetic mutation
D. genetic recombination
LS3 (9-11) FAF-8 Students will, given information about living or extinct organisms, cite evidence to explain the frequency of inherited characteristics of organisms in a population, OR explain the evolution of varied structures (with defi ned functions) that affected the organisms' survival in a specifi c environment (e.g., giraffe, wind pollination of fl owers).
17NECAP 2013 Grade 11 Science Released Items_V2
NECAP 2013 RELEASED INQUIRY TASKGRADE 11 SCIENCE
Broad Area of Inquiry: Developing and Evaluating ExplanationsInquiry Construct 12: Use evidence to support and justify interpretations and conclusions or explain how
the evidence refutes the hypothesis
248620.000 Pool: Trial New
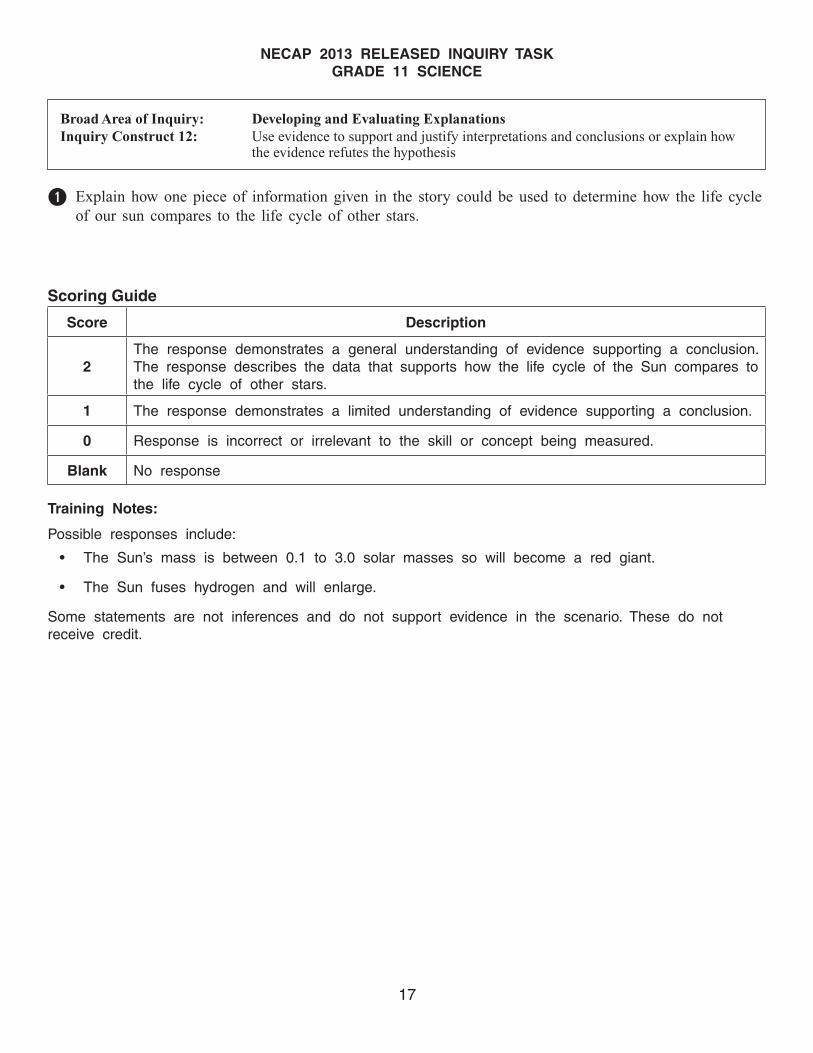
q Explain how one piece of information given in the story could be used to determine how the life cycle of our sun compares to the life cycle of other stars.
Scoring Guide
Score Description
2The response demonstrates a general understanding of evidence supporting a conclusion. The response describes the data that supports how the life cycle of the Sun compares to the life cycle of other stars.
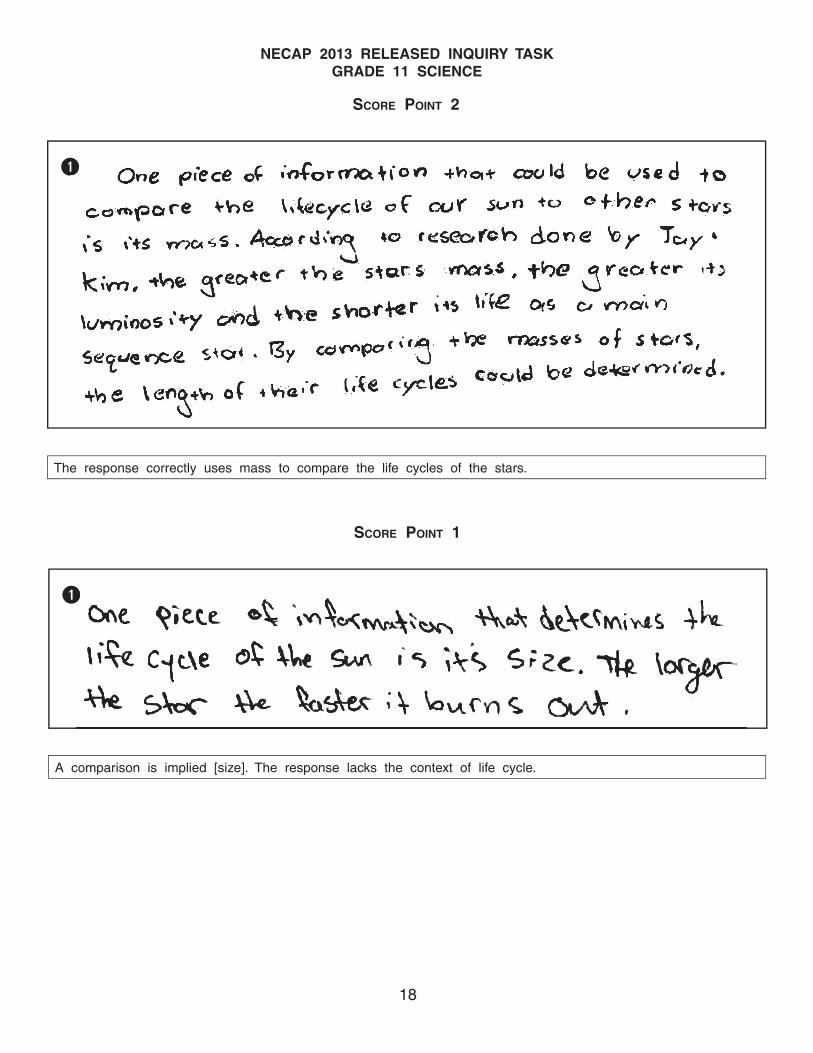
1 The response demonstrates a limited understanding of evidence supporting a conclusion.
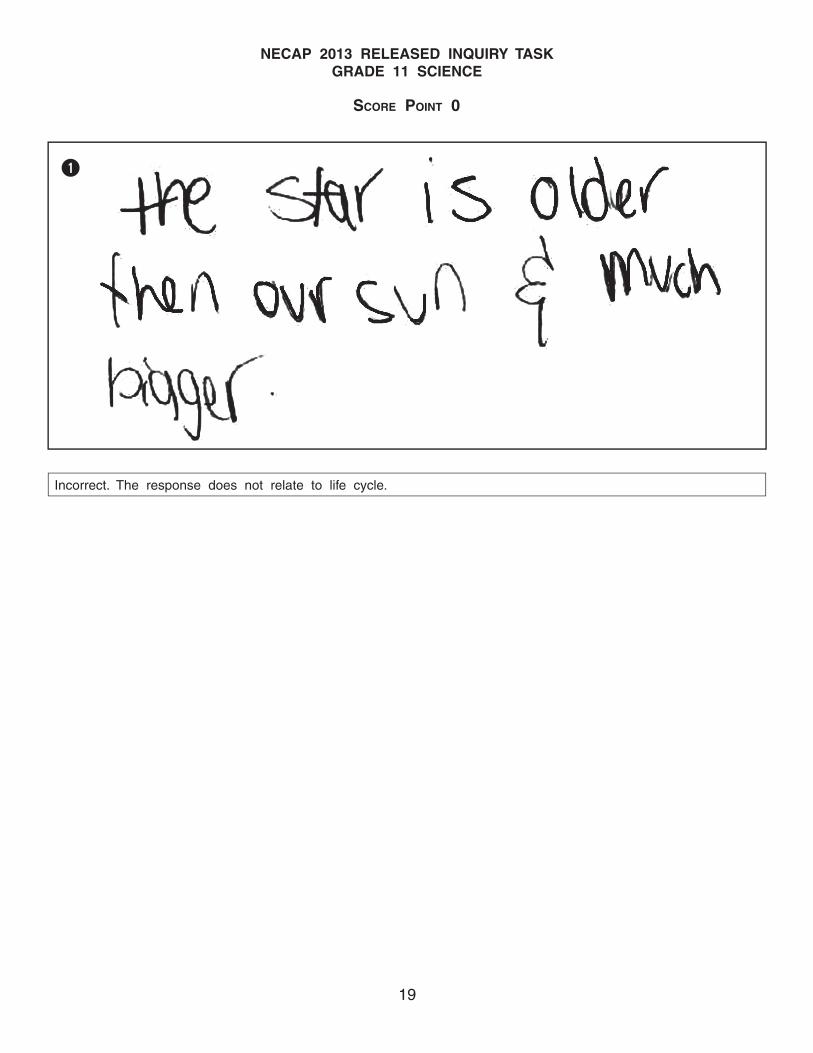
0 Response is incorrect or irrelevant to the skill or concept being measured.
Blank No response
Training Notes:
Possible responses include:
• The Sun’s mass is between 0.1 to 3.0 solar masses so will become a red giant.
• The Sun fuses hydrogen and will enlarge.
Some statements are not inferences and do not support evidence in the scenario. These do not receive credit.
18NECAP 2013 Grade 11 Science Released Items_V2
NECAP 2013 RELEASED INQUIRY TASKGRADE 11 SCIENCE
q
SCORE POINT 22101001195
The response correctly uses mass to compare the life cycles of the stars.
q
SCORE POINT 12101001352
A comparison is implied [size]. The response lacks the context of life cycle.
q
q
19NECAP 2013 Grade 11 Science Released Items_V2
NECAP 2013 RELEASED INQUIRY TASKGRADE 11 SCIENCE
q
SCORE POINT 02101000584
Incorrect. The response does not relate to life cycle.
20NECAP 2013 Grade 11 Science Released Items_V2
NECAP 2013 RELEASED INQUIRY TASKGRADE 11 SCIENCE
Broad Area of Inquiry: Developing and Evaluating ExplanationsInquiry Construct 11: Analyze data, including determining if data are relevant, artifact, irrelevant, or
anomalous
248621.000 Pool: Trial New
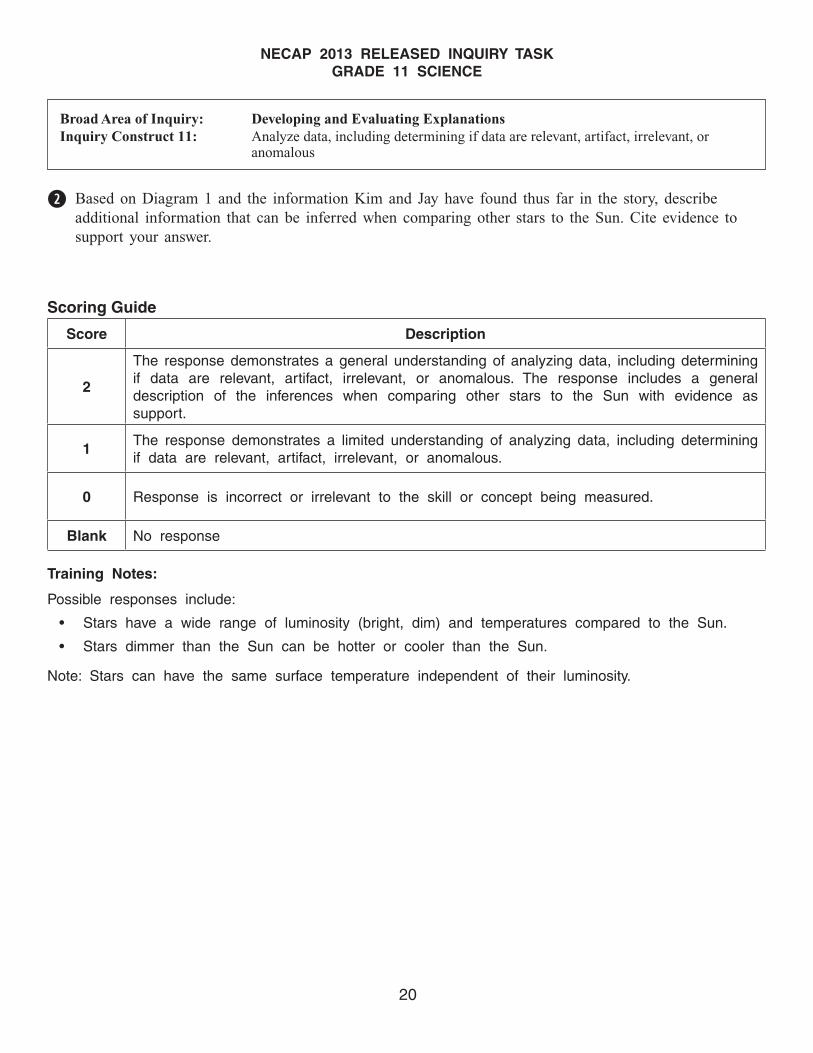
w Based on Diagram 1 and the information Kim and Jay have found thus far in the story, describe additional information that can be inferred when comparing other stars to the Sun. Cite evidence to support your answer.
Scoring Guide
Score Description
2
The response demonstrates a general understanding of analyzing data, including determining if data are relevant, artifact, irrelevant, or anomalous. The response includes a general description of the inferences when comparing other stars to the Sun with evidence as support.
1The response demonstrates a limited understanding of analyzing data, including determining if data are relevant, artifact, irrelevant, or anomalous.
0 Response is incorrect or irrelevant to the skill or concept being measured.
Blank No response
Training Notes:
Possible responses include:
• Stars have a wide range of luminosity (bright, dim) and temperatures compared to the Sun.
• Stars dimmer than the Sun can be hotter or cooler than the Sun.
Note: Stars can have the same surface temperature independent of their luminosity.
21NECAP 2013 Grade 11 Science Released Items_V2
NECAP 2013 RELEASED INQUIRY TASKGRADE 11 SCIENCE
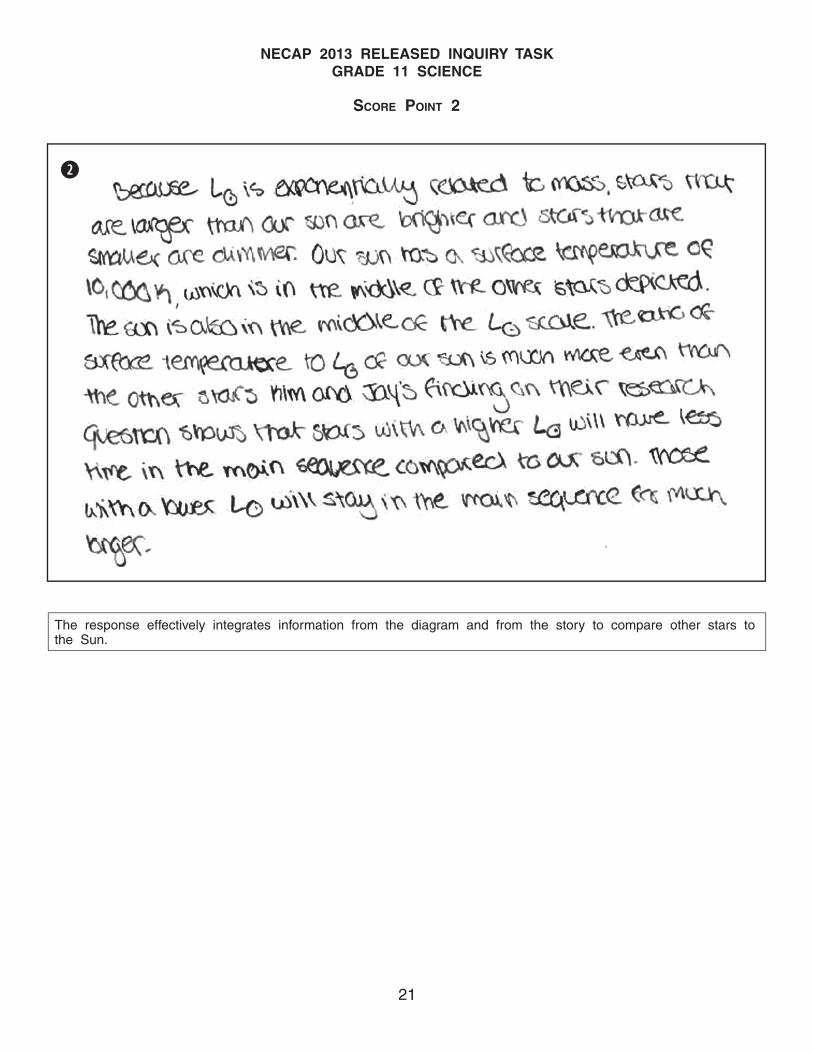
w
The response effectively integrates information from the diagram and from the story to compare other stars to the Sun.
SCORE POINT 22101000341
w
22NECAP 2013 Grade 11 Science Released Items_V2
NECAP 2013 RELEASED INQUIRY TASKGRADE 11 SCIENCE
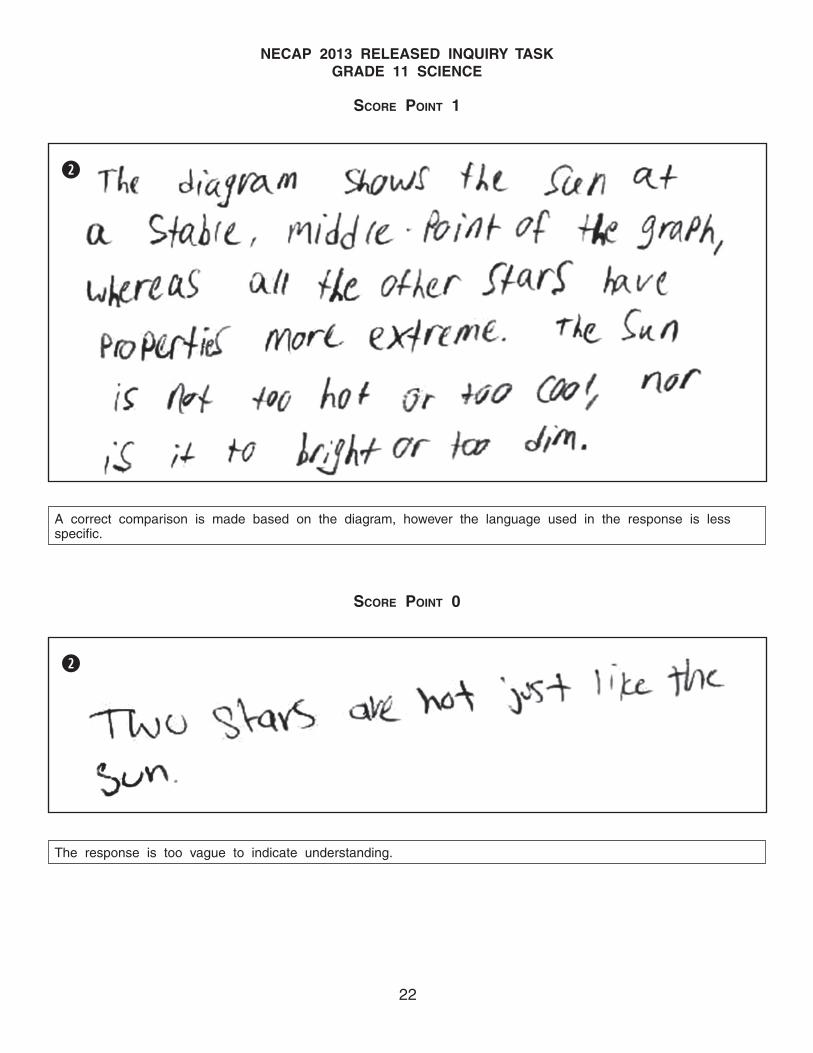
w
A correct comparison is made based on the diagram, however the language used in the response is less specifi c.
SCORE POINT 12101000595
w
The response is too vague to indicate understanding.
SCORE POINT 02101000784
23NECAP 2013 Grade 11 Science Released Items_V2
NECAP 2013 RELEASED INQUIRY TASKGRADE 11 SCIENCE
Broad Area of Inquiry: Formulating Questions & HypothesizingInquiry Construct 2: Construct coherent argument in support of a question, hypothesis, prediction.
248622.000 248623 Pool: Trial New
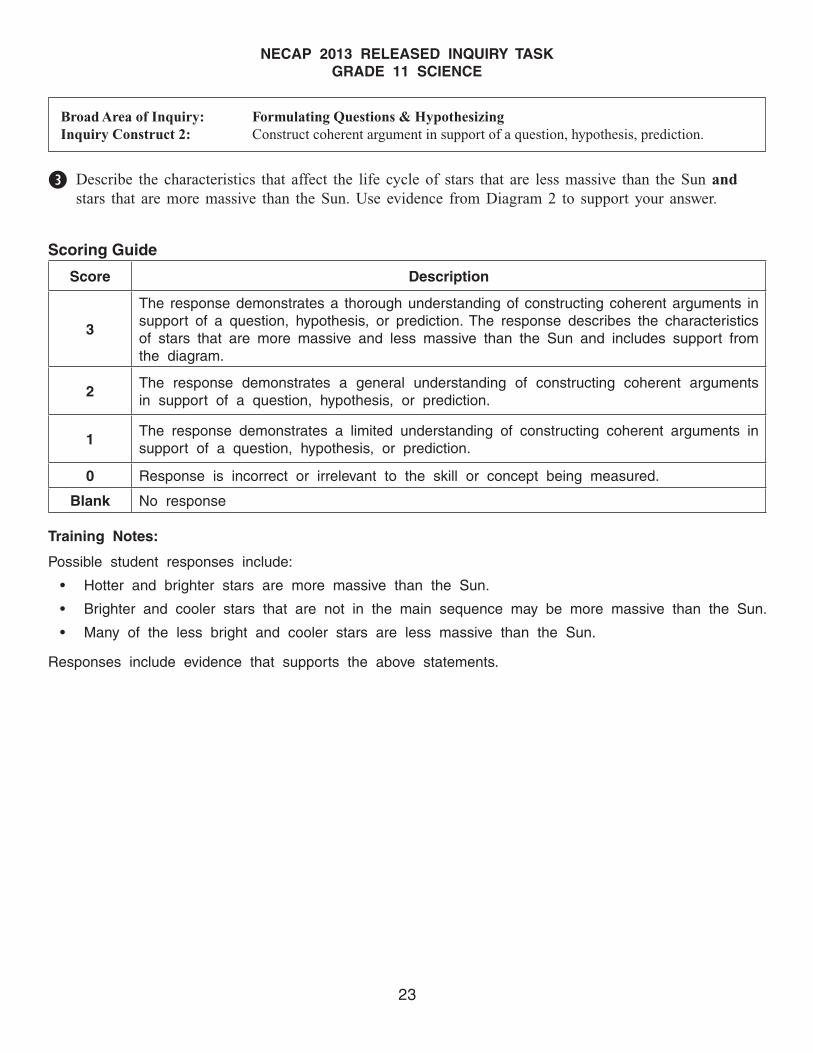
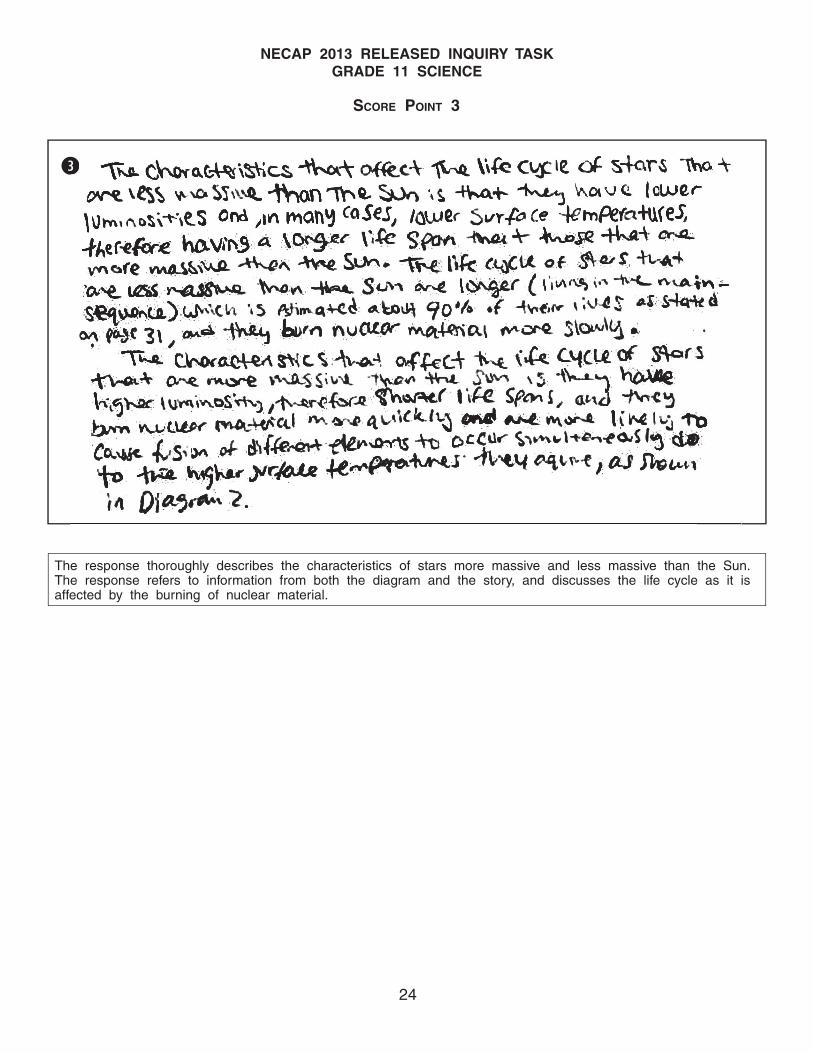
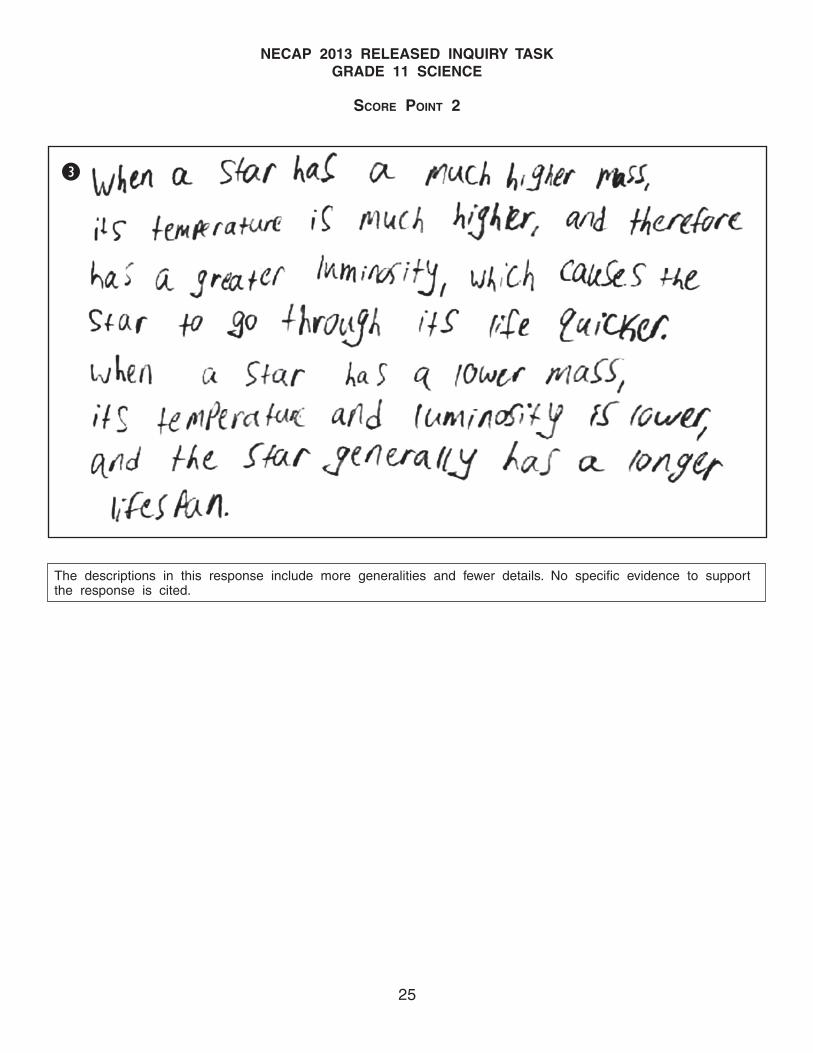
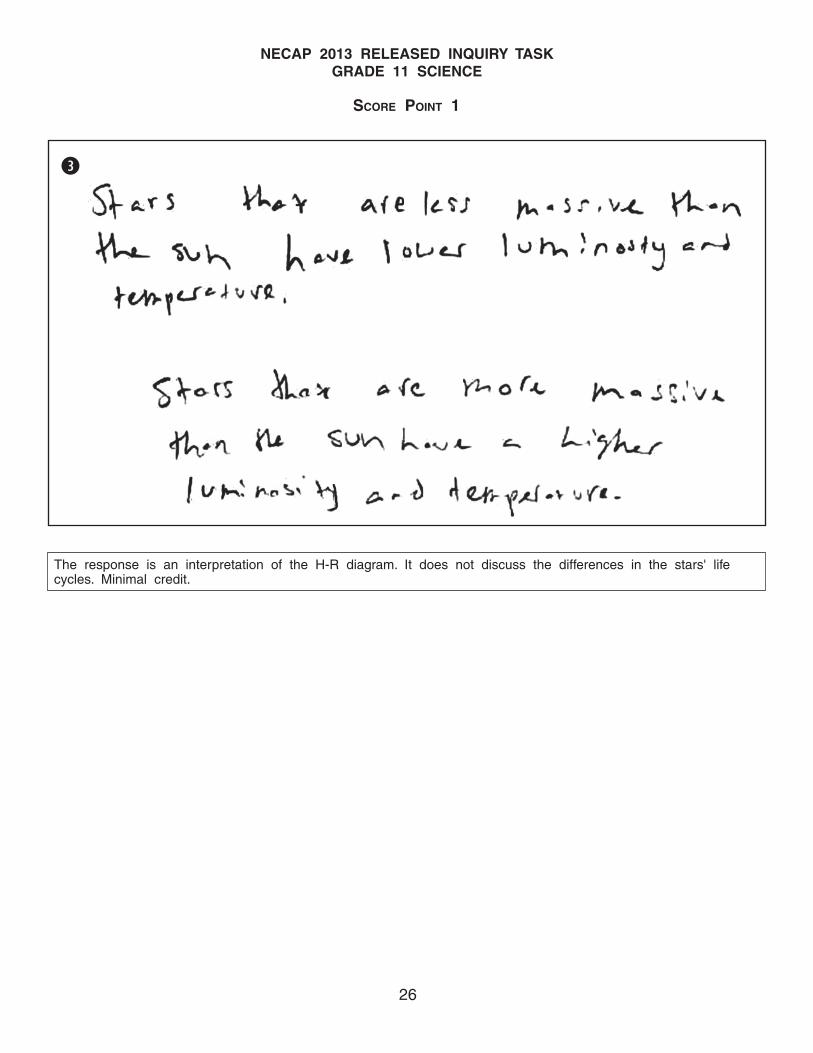
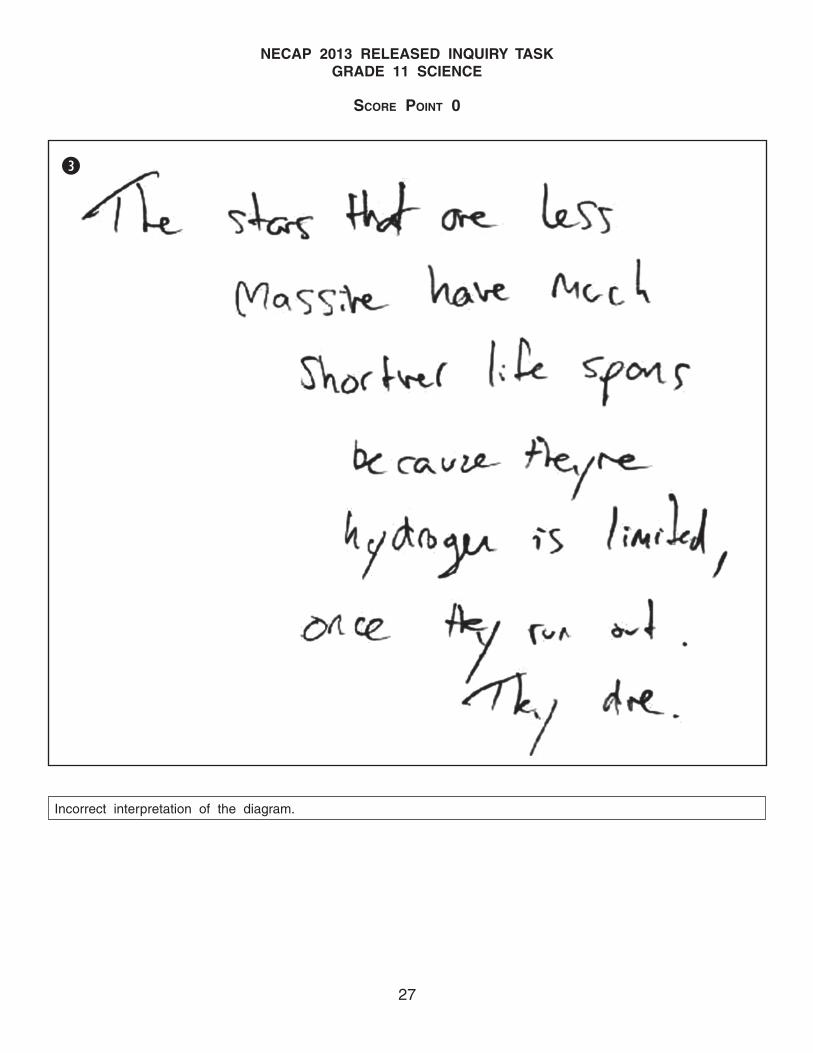
e Describe the characteristics that affect the life cycle of stars that are less massive than the Sun and stars that are more massive than the Sun. Use evidence from Diagram 2 to support your answer.
Scoring Guide
Score Description
3
The response demonstrates a thorough understanding of constructing coherent arguments in support of a question, hypothesis, or prediction. The response describes the characteristics of stars that are more massive and less massive than the Sun and includes support from the diagram.
2The response demonstrates a general understanding of constructing coherent arguments in support of a question, hypothesis, or prediction.
1The response demonstrates a limited understanding of constructing coherent arguments in support of a question, hypothesis, or prediction.
0 Response is incorrect or irrelevant to the skill or concept being measured.
Blank No response
Training Notes:
Possible student responses include:
• Hotter and brighter stars are more massive than the Sun.
• Brighter and cooler stars that are not in the main sequence may be more massive than the Sun.
• Many of the less bright and cooler stars are less massive than the Sun.
Responses include evidence that supports the above statements.
24NECAP 2013 Grade 11 Science Released Items_V2
NECAP 2013 RELEASED INQUIRY TASKGRADE 11 SCIENCE
e
The response thoroughly describes the characteristics of stars more massive and less massive than the Sun. The response refers to information from both the diagram and the story, and discusses the life cycle as it is affected by the burning of nuclear material.
SCORE POINT 32101001271
e
25NECAP 2013 Grade 11 Science Released Items_V2
NECAP 2013 RELEASED INQUIRY TASKGRADE 11 SCIENCE
e
The descriptions in this response include more generalities and fewer details. No specifi c evidence to support the response is cited.
SCORE POINT 22101000595
26NECAP 2013 Grade 11 Science Released Items_V2
NECAP 2013 RELEASED INQUIRY TASKGRADE 11 SCIENCE
e
The response is an interpretation of the H-R diagram. It does not discuss the differences in the stars' life cycles. Minimal credit.
SCORE POINT 12101000777
27NECAP 2013 Grade 11 Science Released Items_V2
NECAP 2013 RELEASED INQUIRY TASKGRADE 11 SCIENCE
e
Incorrect interpretation of the diagram.
SCORE POINT 02101001102
28NECAP 2013 Grade 11 Science Released Items_V2
NECAP 2013 RELEASED INQUIRY TASKGRADE 11 SCIENCE
Broad Area of Inquiry: Formulating Questions & HypothesizingInquiry Construct 1: Analyze information from observations, research, or experimental data for the
purpose of formulating a question, hypothesis, or prediction.
248624.000 248625 Pool: Trial New
r Based on Diagram 2, predict the luminosity (L⊙) and temperature (K) of a star with a solar mass of 100 MSun. Use evidence from Diagram 2 and information from the story to support your answer.
Scoring Guide
Score Description
2The response demonstrates a general understanding of analyzing information from observations, research, or experimental data for the purpose of formulating a prediction. The response predicts the luminosity of a star with 100 MSun and supports prediction with evidence.
1The response demonstrates a limited understanding of analyzing information from observations, research, or experimental data for the purpose of formulating a prediction.
0 The response is incorrect or irrelevant to the skill or concept being measured.
Blank No response
Training Notes:
The star would have a much higher luminosity and temperature than the 100 MSun star (which is the highest on the graph).
Note: must include reasoning to support the answer.
29NECAP 2013 Grade 11 Science Released Items_V2
NECAP 2013 RELEASED INQUIRY TASKGRADE 11 SCIENCE
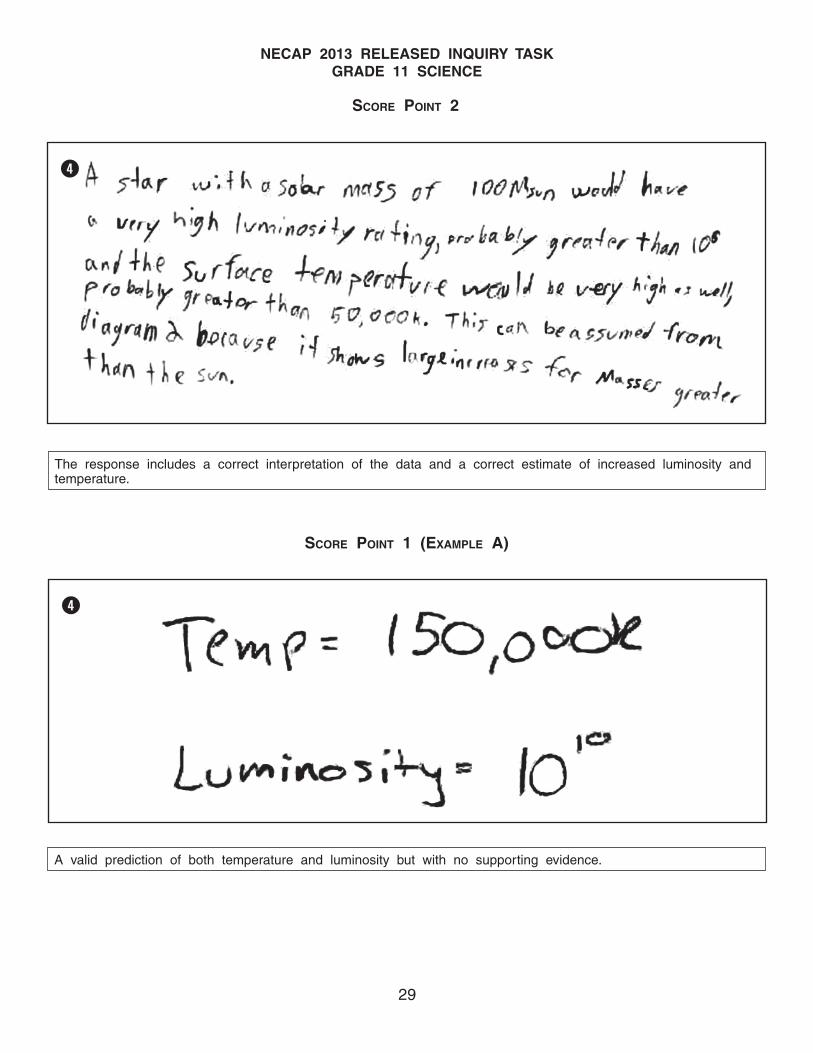
SCORE POINT 221010001181
r
The response includes a correct interpretation of the data and a correct estimate of increased luminosity and temperature.
SCORE POINT 1 (EXAMPLE A)2101000313
r
A valid prediction of both temperature and luminosity but with no supporting evidence.
30NECAP 2013 Grade 11 Science Released Items_V2
NECAP 2013 RELEASED INQUIRY TASKGRADE 11 SCIENCE
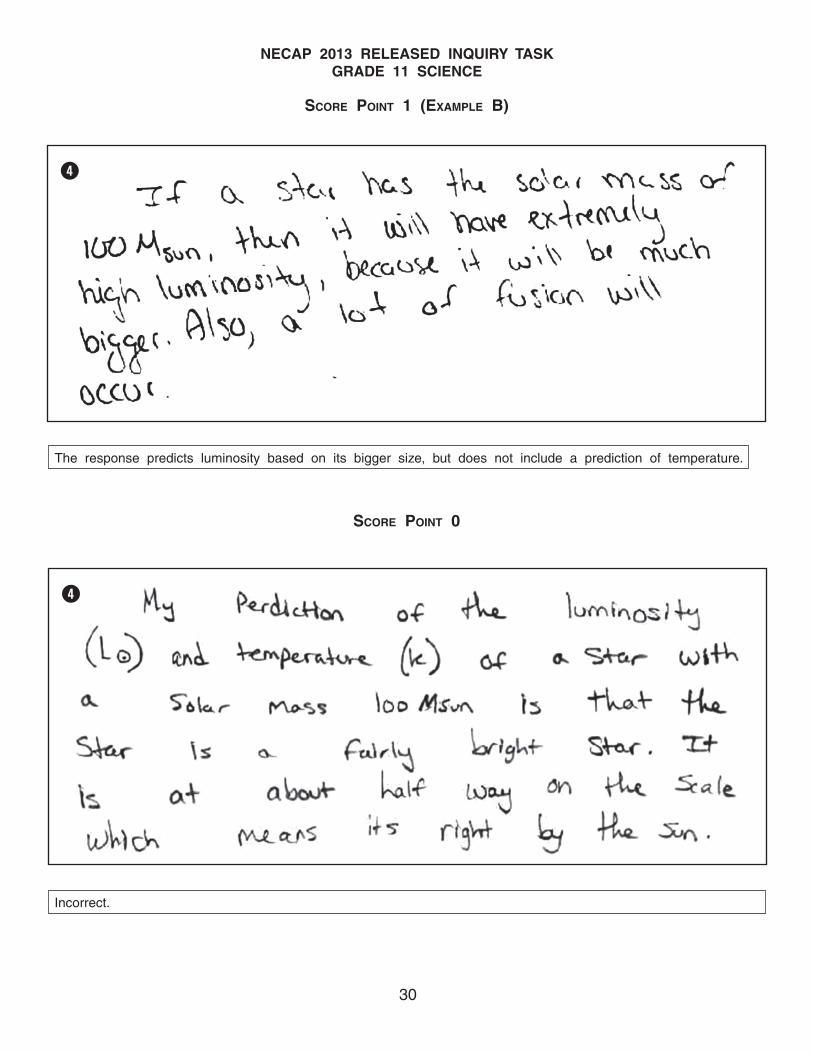
SCORE POINT 1 (EXAMPLE B)
21010000508
r
The response predicts luminosity based on its bigger size, but does not include a prediction of temperature.
SCORE POINT 0
21010000551
r
Incorrect.
31NECAP 2013 Grade 11 Science Released Items_V2
NECAP 2013 RELEASED INQUIRY TASKGRADE 11 SCIENCE
Broad Area of Inquiry: Conducting InvestigationsInquiry Construct 8: Use accepted methods for organizing, representing, and manipulating data.
248626.000 248627 Pool: Trial New
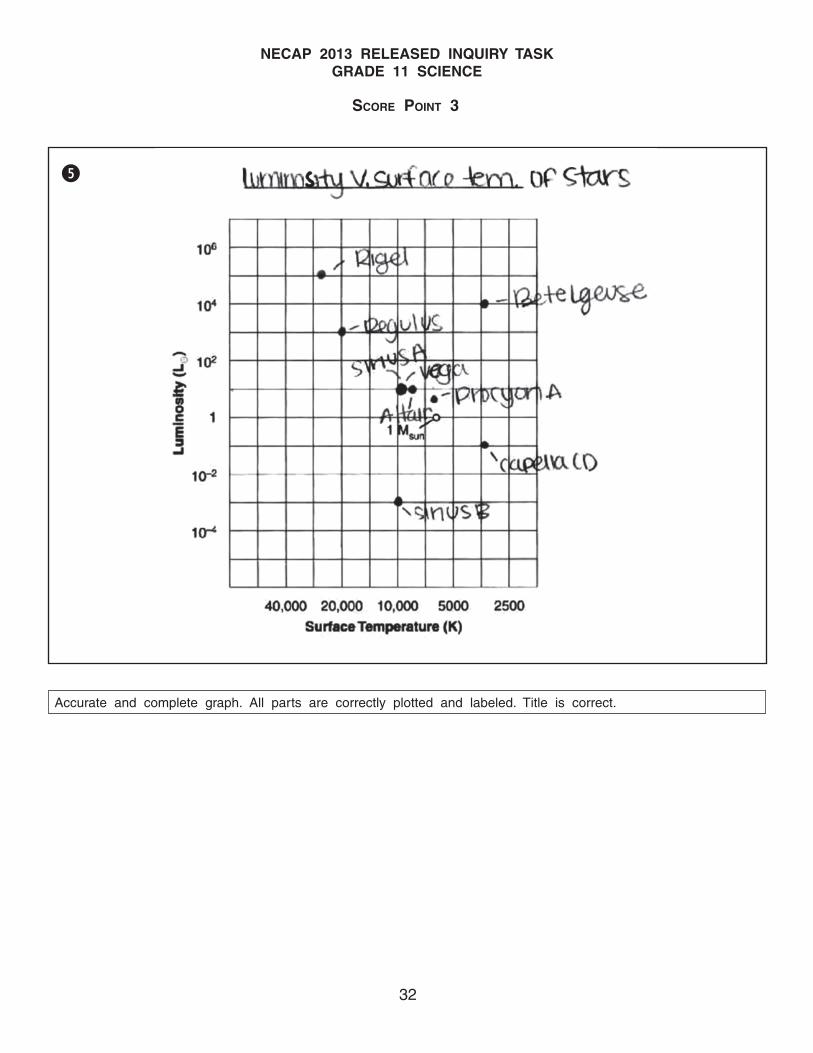
t On the grid provided, construct a scatter plot of the stars included in Data Table 1. Be sure to correctly label and title your scatter plot and identify (label) the stars.
Scoring Guide
Score Description
3The response demonstrates a thorough understanding of how to accurately represent data in a graph. The response includes a sctter plot of the data that has an appropriate title.
2The response demonstrates a general understanding of how to accurately represent data in a graph.
1The response demonstrates a limited understanding of how to accurately represent data in a graph.
0 Response is incorrect or irrelevant to the skill or concept being measured.
Blank No response
Training Notes:
• Title: Luminosity (L⊙) vs. Temperature (K)
• All stars need to be labeled.
• All stars need to be accurately plotted for a 3-point score.
32NECAP 2013 Grade 11 Science Released Items_V2
NECAP 2013 RELEASED INQUIRY TASKGRADE 11 SCIENCE
SCORE POINT 32101000631
t
Accurate and complete graph. All parts are correctly plotted and labeled. Title is correct.
33NECAP 2013 Grade 11 Science Released Items_V2
NECAP 2013 RELEASED INQUIRY TASKGRADE 11 SCIENCE
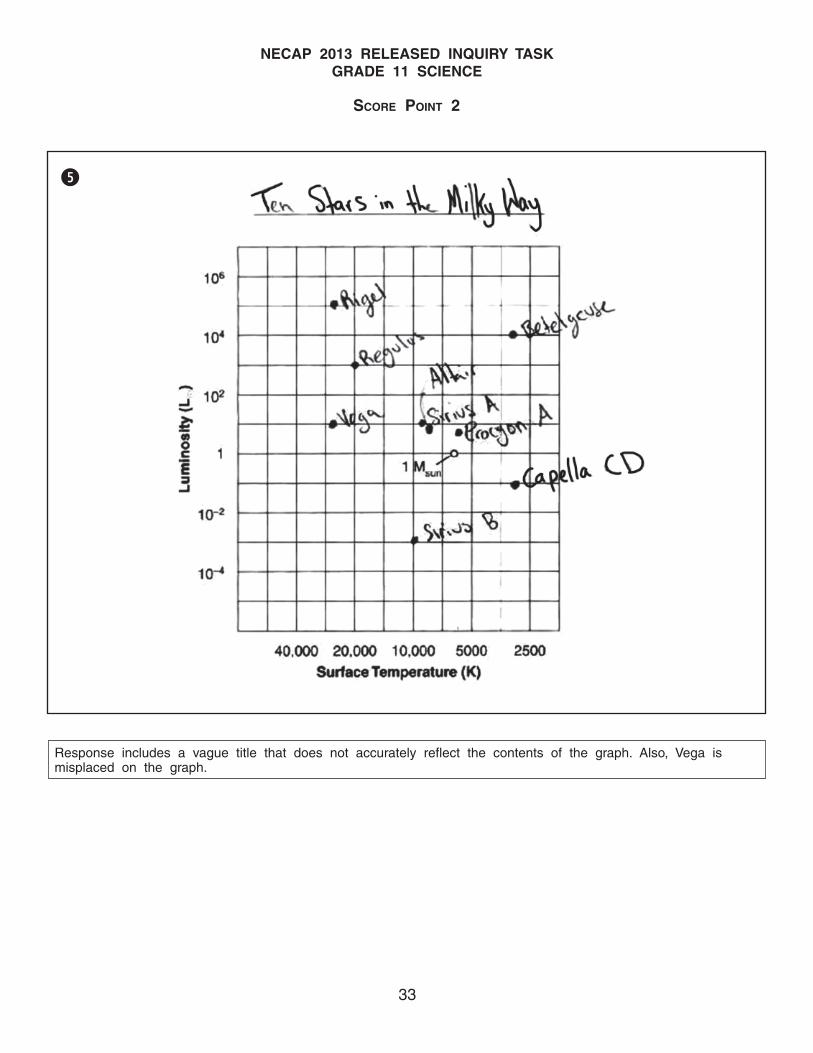
SCORE POINT 2
2101001098
t
Response includes a vague title that does not accurately refl ect the contents of the graph. Also, Vega is misplaced on the graph.
34NECAP 2013 Grade 11 Science Released Items_V2
NECAP 2013 RELEASED INQUIRY TASKGRADE 11 SCIENCE
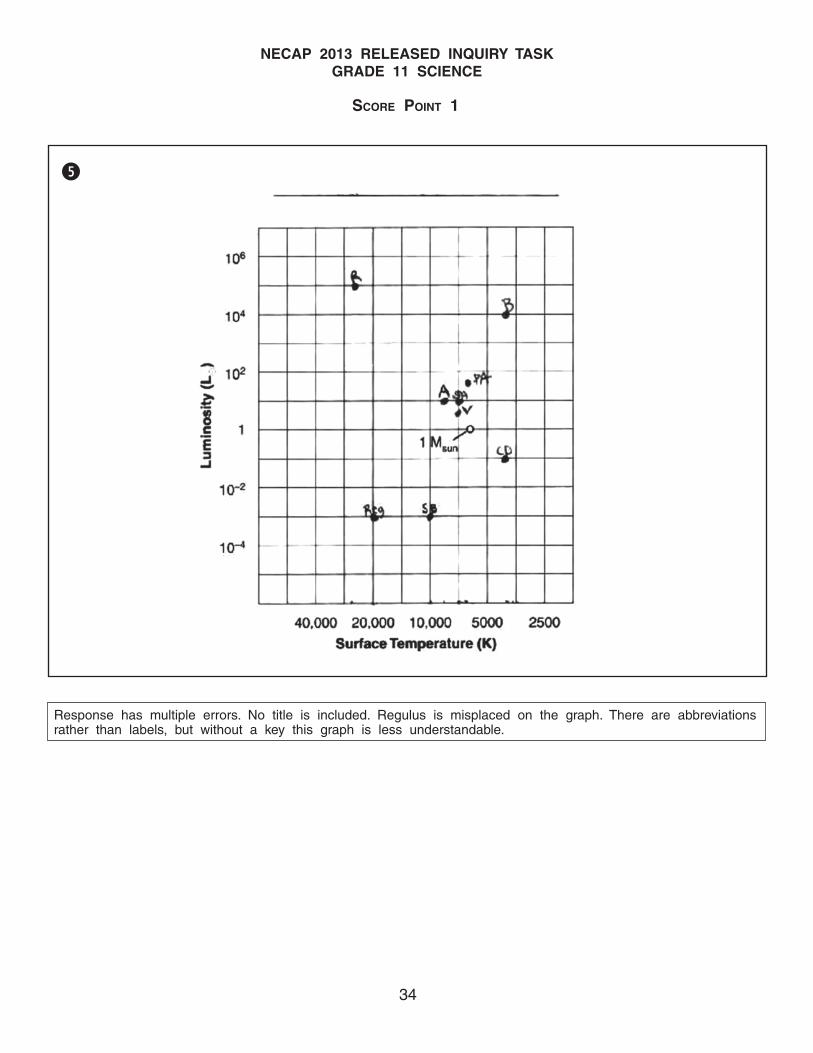
SCORE POINT 1
2101000889
t
Response has multiple errors. No title is included. Regulus is misplaced on the graph. There are abbreviations rather than labels, but without a key this graph is less understandable.
35NECAP 2013 Grade 11 Science Released Items_V2
NECAP 2013 RELEASED INQUIRY TASKGRADE 11 SCIENCE
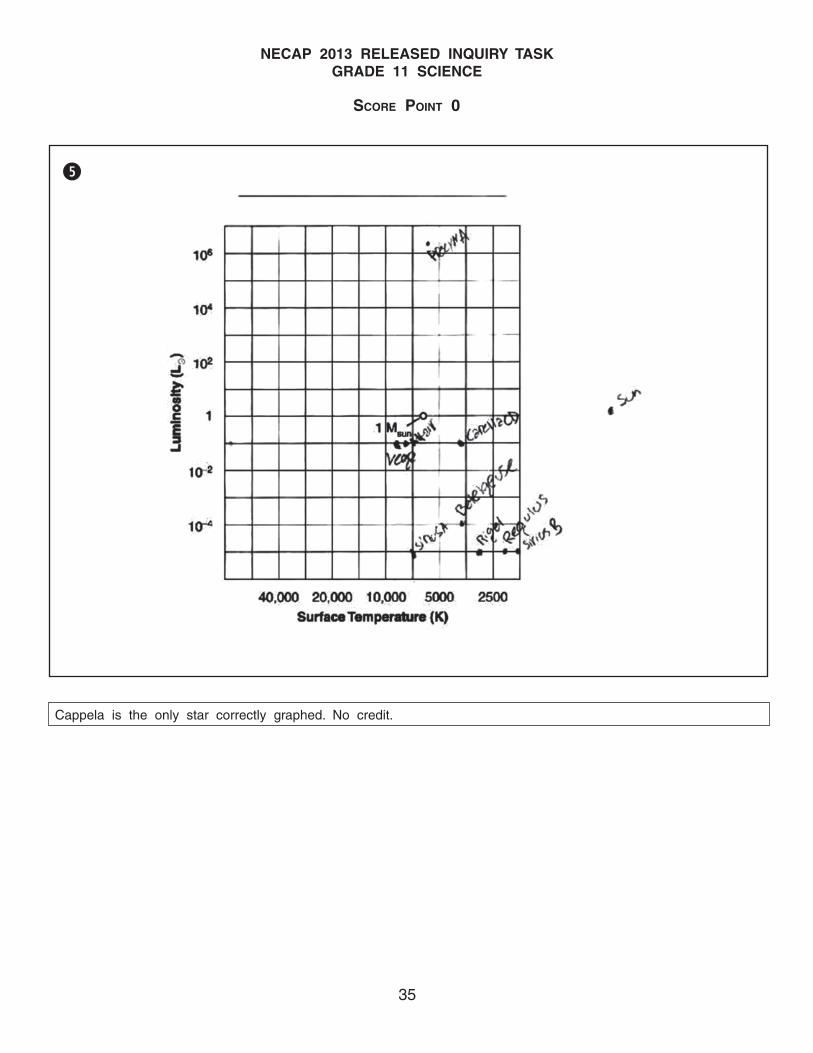
SCORE POINT 0
2101000454
t
Cappela is the only star correctly graphed. No credit.
36NECAP 2013 Grade 11 Science Released Items_V2
NECAP 2013 RELEASED INQUIRY TASKGRADE 11 SCIENCE
Broad Area of Inquiry: Developing and Evaluating ExpectationsInquiry Construct 12: Use evidence to support and justify interpretations and conclusions or explain how
the evidence refutes the hypothesis.
248628.000 Pool: Trial New
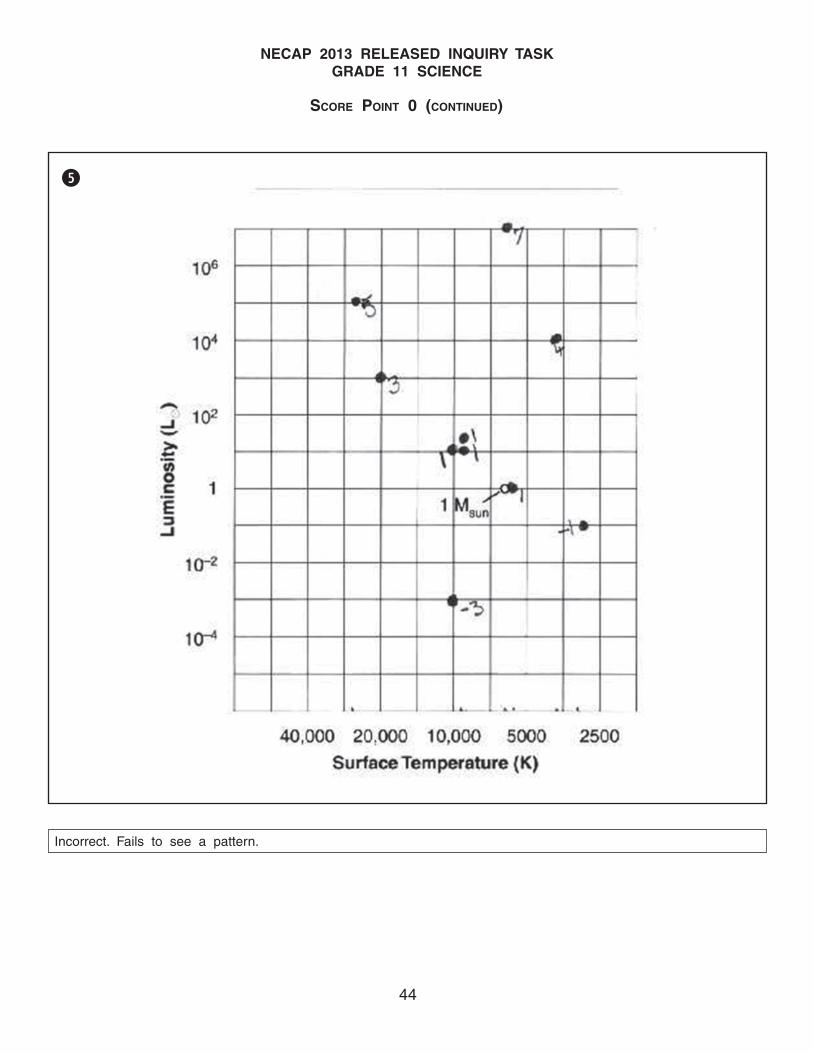
y Identify which stars in Data Table 1 or your scatter plot do not fi t well with the pattern of the other stars in your scatter plot. Use your data to describe how these stars compare to the Sun.
Scoring Guide
Score Description
2The response demonstrates a general understanding of how to support and justify interpretations and conclusions or explain how the evidence refutes the hypothesis. The response identifi es the stars outside the main sequence and describes how they compare to the Sun.
1The response demonstrates a limited understanding of how to support and justify interpretations and conclusions or explain how the evidence refutes the hypothesis.
0 The response is incorrect or irrelevant to the skill or concept being measured.
Blank No response
Training Notes:
Possible student responses for the star include:
• Betelgeuse
• Sirius B
Possible student responses for the comparison to the Sun: For Betelgeuse: The star is larger (mass) than the Sun. The star is cooler than the Sun. For Sirius B: The star is at the end of its life as a white dwarf. The star is smaller than the Sun.
37NECAP 2013 Grade 11 Science Released Items_V2
NECAP 2013 RELEASED INQUIRY TASKGRADE 11 SCIENCE
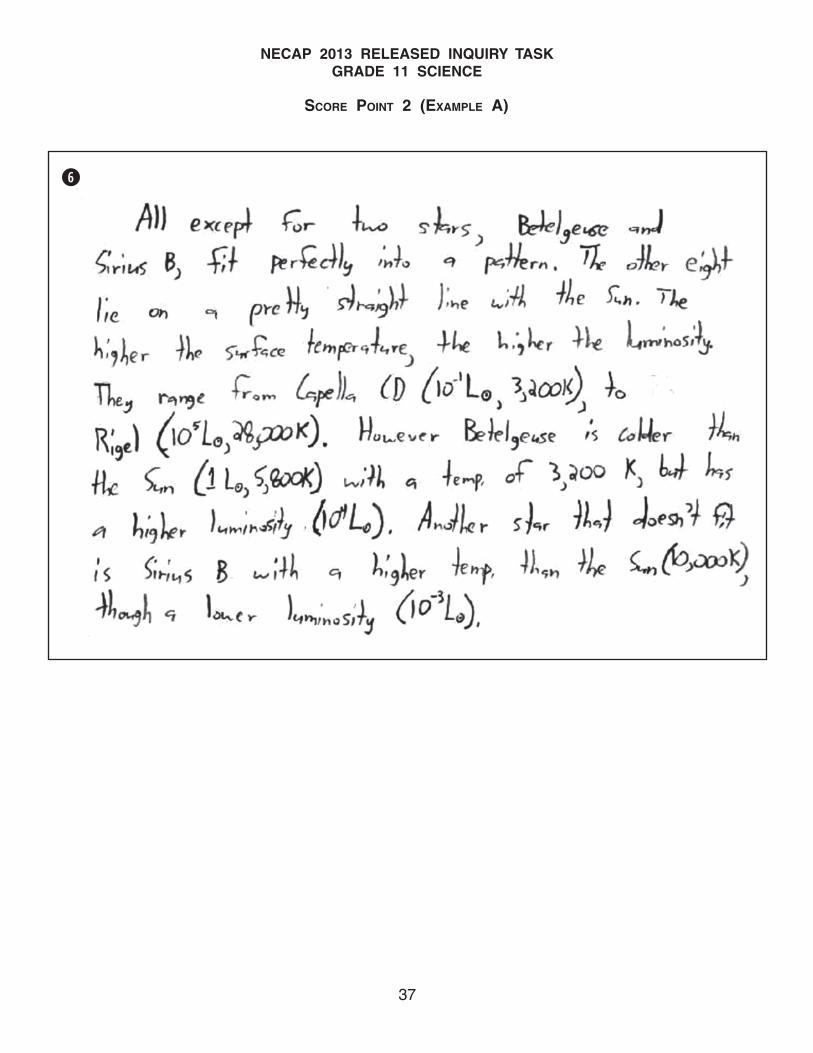
SCORE POINT 2 (EXAMPLE A)
2101001018
y
38NECAP 2013 Grade 11 Science Released Items_V2
NECAP 2013 RELEASED INQUIRY TASKGRADE 11 SCIENCE
t
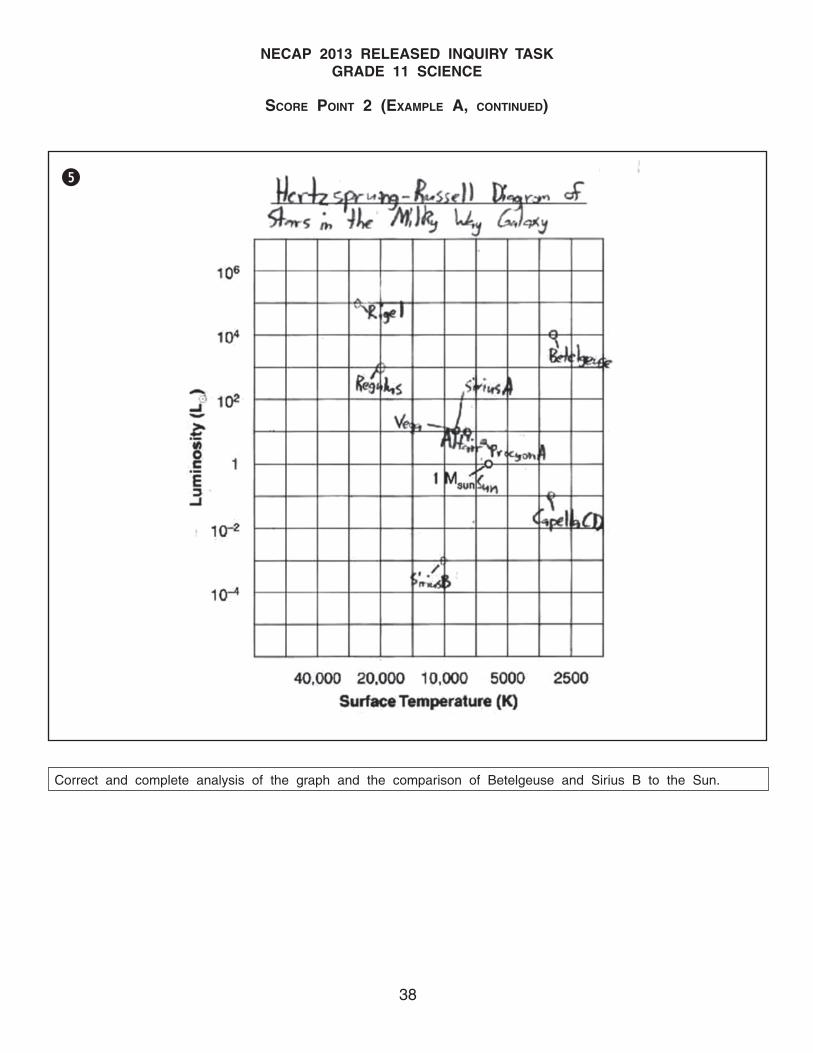
SCORE POINT 2 (EXAMPLE A, CONTINUED)
2101001018
Correct and complete analysis of the graph and the comparison of Betelgeuse and Sirius B to the Sun.
39NECAP 2013 Grade 11 Science Released Items_V2
NECAP 2013 RELEASED INQUIRY TASKGRADE 11 SCIENCE
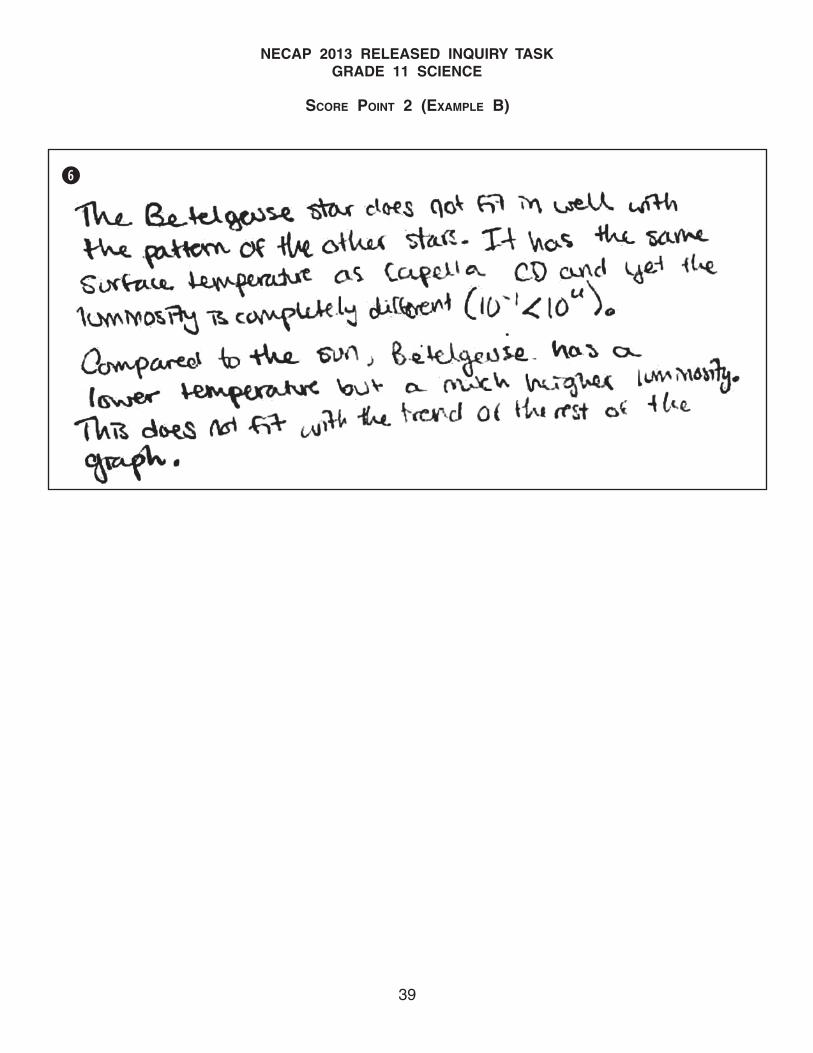
SCORE POINT 2 (EXAMPLE B)
2101000628
y
40NECAP 2013 Grade 11 Science Released Items_V2
NECAP 2013 RELEASED INQUIRY TASKGRADE 11 SCIENCE
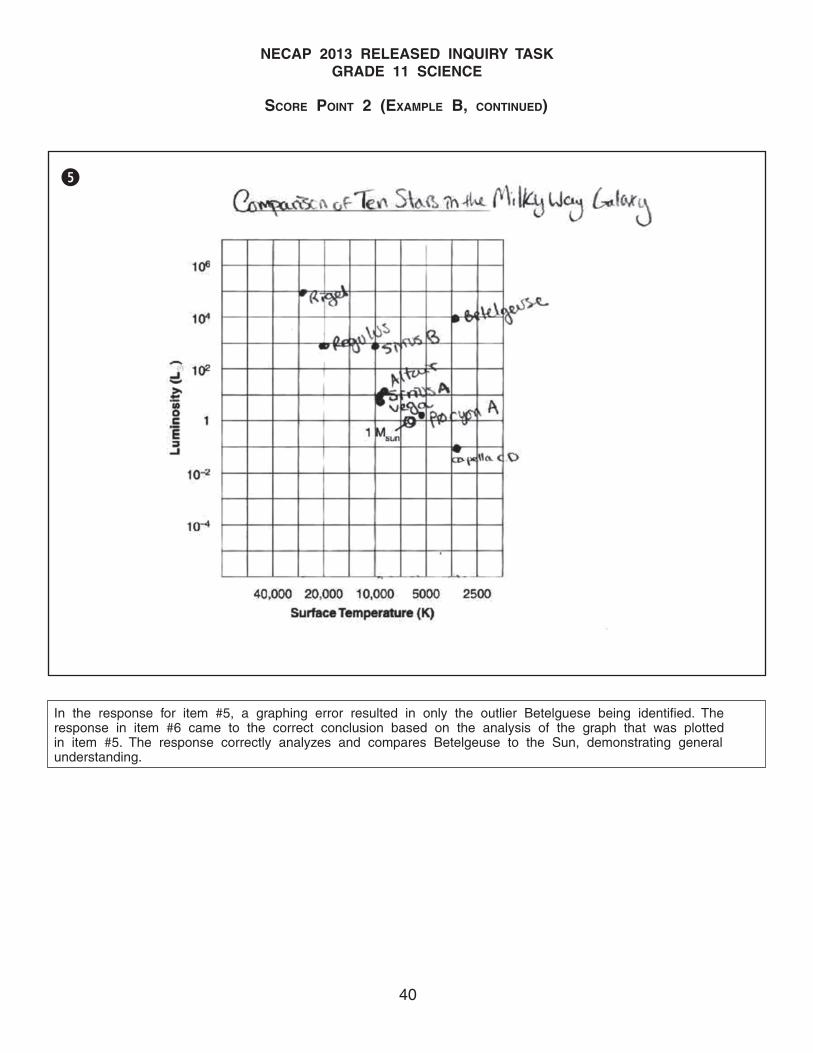
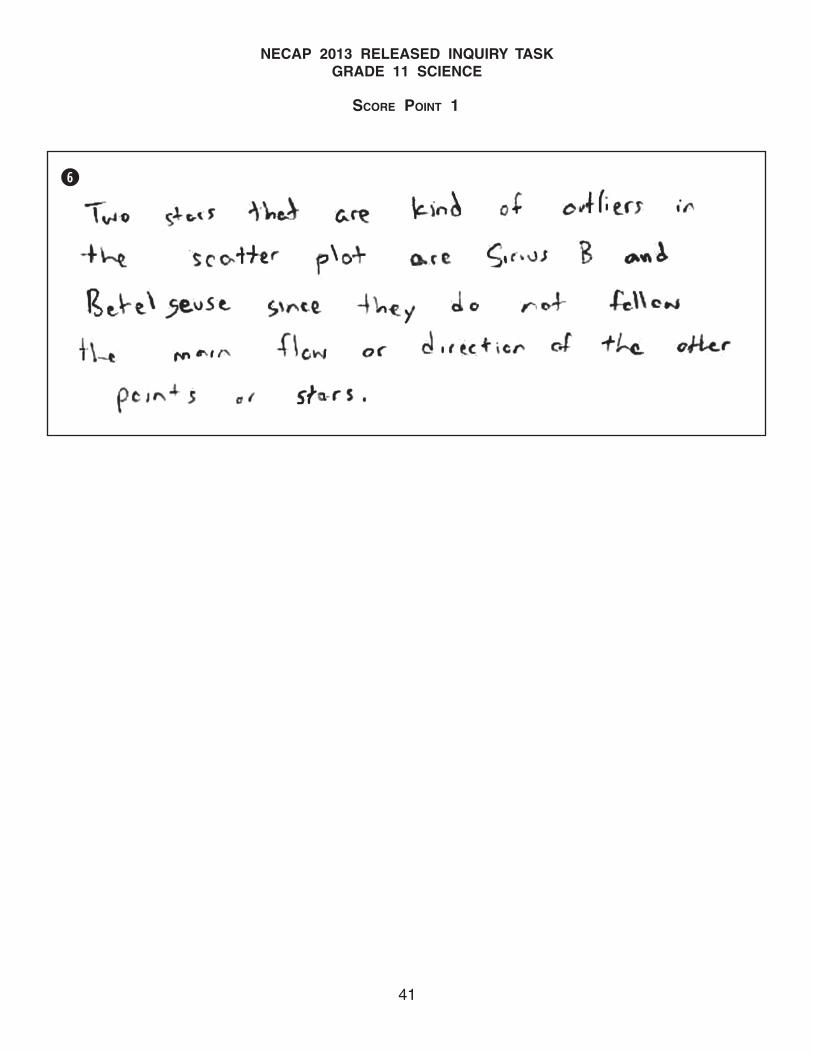
SCORE POINT 2 (EXAMPLE B, CONTINUED)
2101000628
t
In the response for item #5, a graphing error resulted in only the outlier Betelguese being identifi ed. The response in item #6 came to the correct conclusion based on the analysis of the graph that was plotted in item #5. The response correctly analyzes and compares Betelgeuse to the Sun, demonstrating general understanding.
41NECAP 2013 Grade 11 Science Released Items_V2
NECAP 2013 RELEASED INQUIRY TASKGRADE 11 SCIENCE
SCORE POINT 1
2101000602
y
42NECAP 2013 Grade 11 Science Released Items_V2
NECAP 2013 RELEASED INQUIRY TASKGRADE 11 SCIENCE
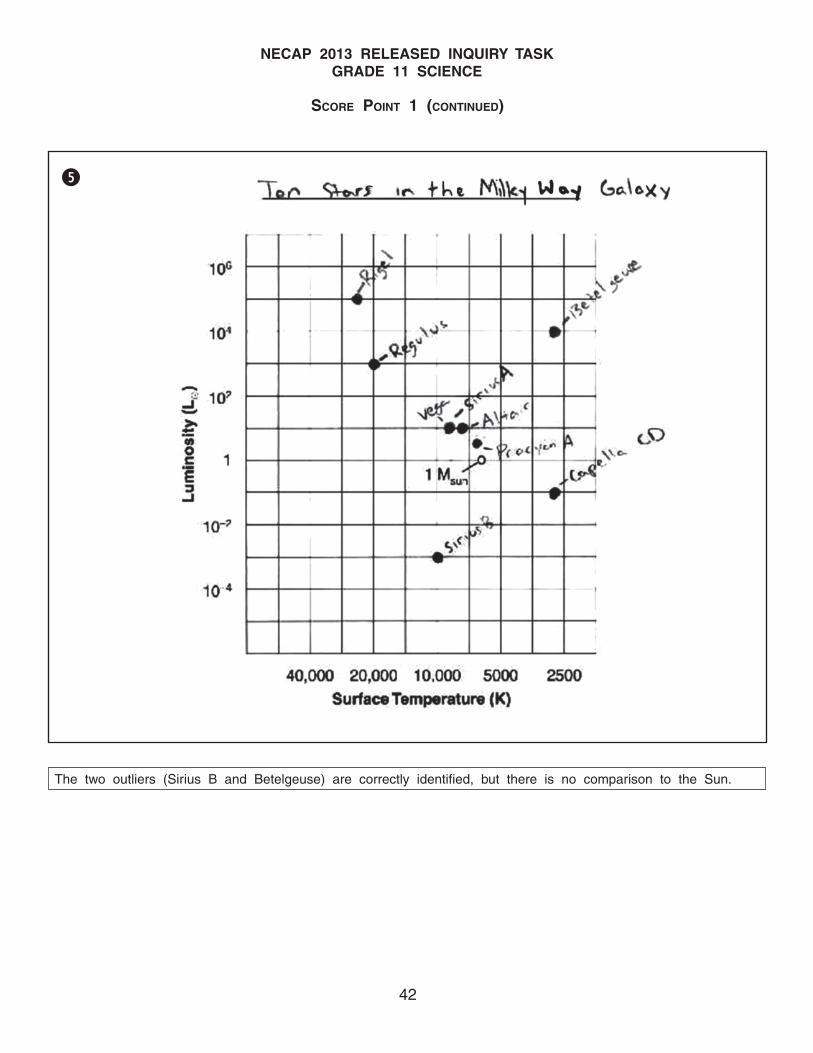
SCORE POINT 1 (CONTINUED)
2101000602
t
The two outliers (Sirius B and Betelgeuse) are correctly identifi ed, but there is no comparison to the Sun.
43NECAP 2013 Grade 11 Science Released Items_V2
NECAP 2013 RELEASED INQUIRY TASKGRADE 11 SCIENCE
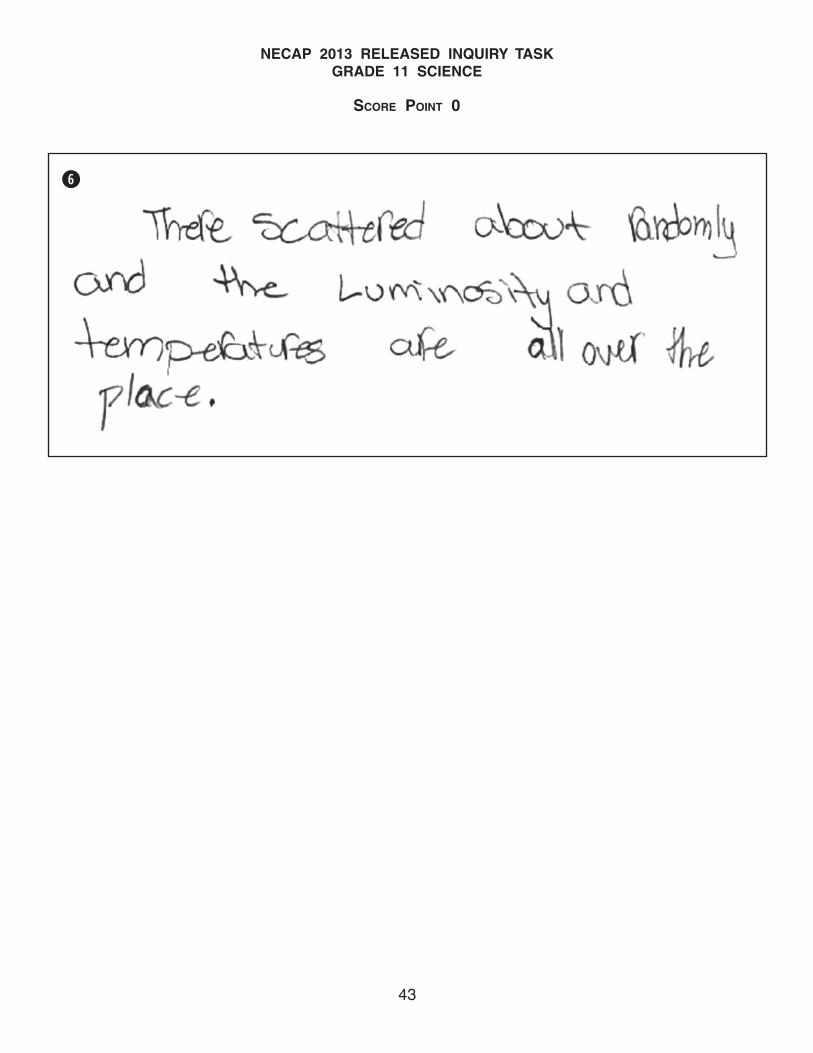
SCORE POINT 0
2101000614
y
44NECAP 2013 Grade 11 Science Released Items_V2
NECAP 2013 RELEASED INQUIRY TASKGRADE 11 SCIENCE
SCORE POINT 0 (CONTINUED)
2101000614
t
Incorrect. Fails to see a pattern.
45NECAP 2013 Grade 11 Science Released Items_V2
NECAP 2013 RELEASED INQUIRY TASKGRADE 11 SCIENCE
Broad Area of Inquiry: Developing and Evaluating ExpectationsInquiry Construct 12: Use evidence to support and justify interpretations and conclusions or explain how
the evidence refutes the hypothesis.
248629.000 Pool: Trial New
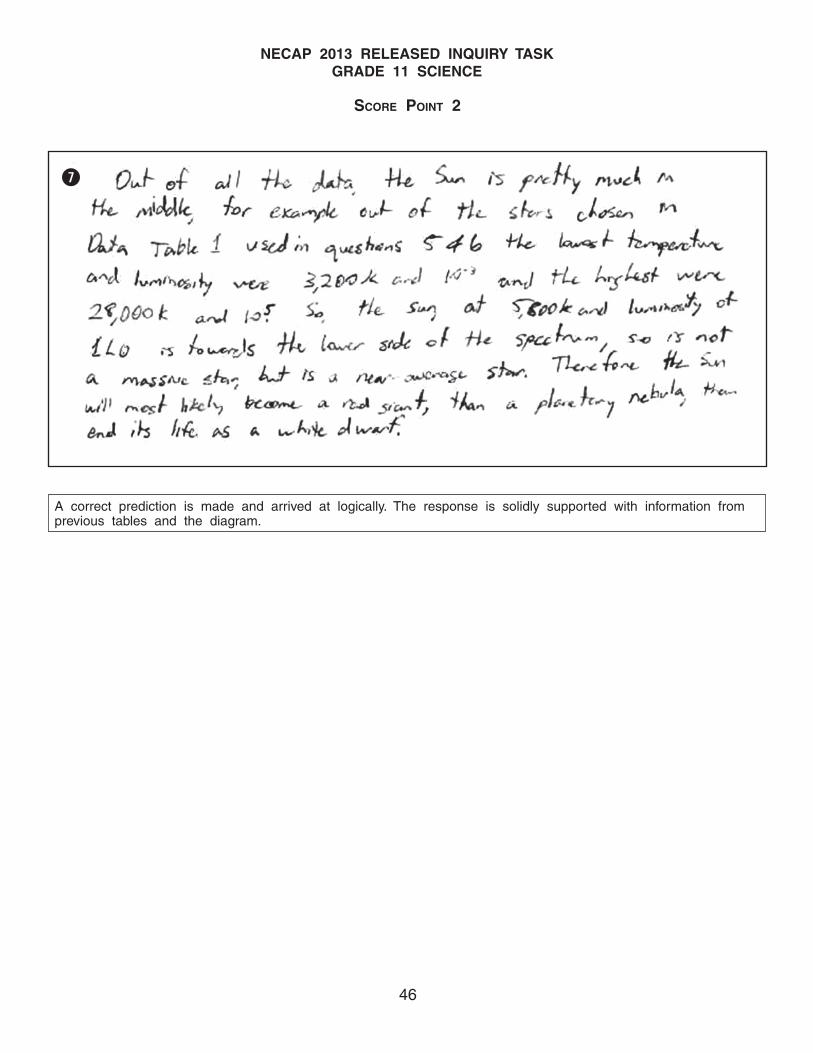
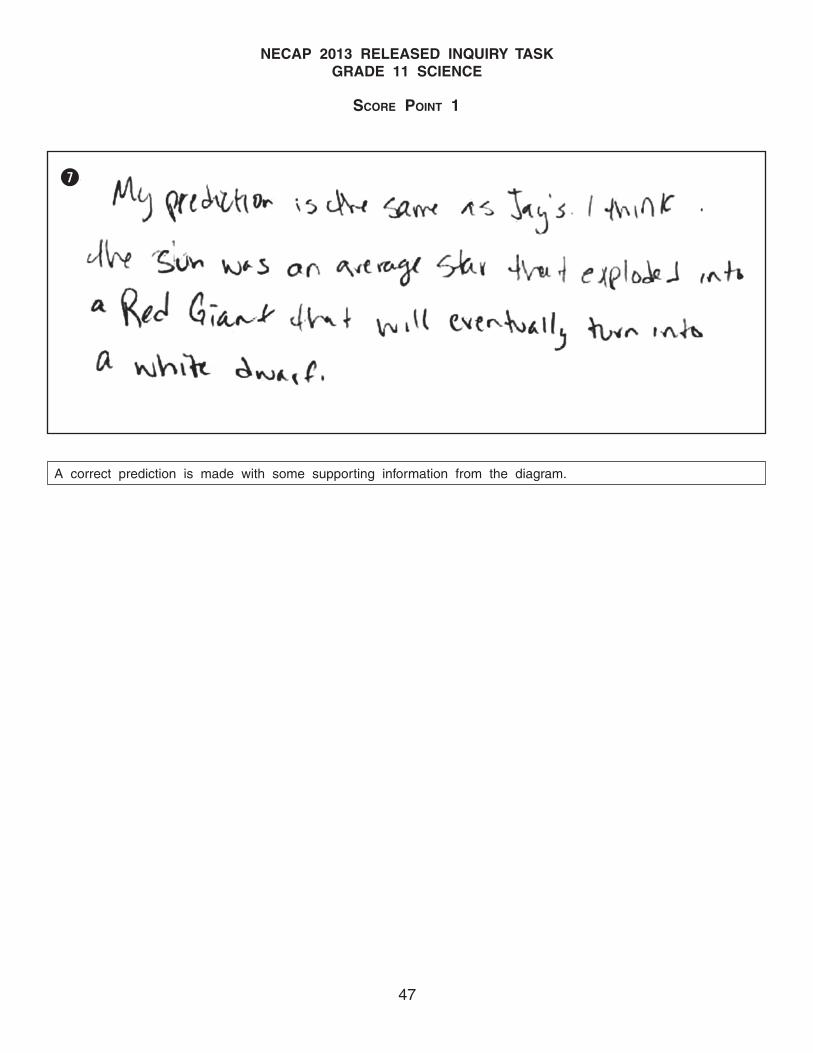
u Choose the prediction that most accurately represents the life cycle path the Sun will follow. Use information from the Life Cycle of a Star diagram to support your answer.
Scoring Guide
Score Description
2The response demonstrates a general understanding of how to support and justify interpretations and conclusions or explain how the evidence refutes the hypothesis. The response identifi es the most accurate prediction and explains why.
1The response demonstrates a limited understanding of how to support and justify interpretations and conclusions or explain how the evidence refutes the hypothesis.
0 The response is incorrect or irrelevant to the skill or concept being measured.
Blank No response
Training Notes:
Possible explanations include that Jay's prediction is most accurate:
• Based on the temperature and luminosity, the Sun will follow the average star path because the Sun has a solar mass of 1 and the temperature and luminosity of an average star.
• Based on its mass, the Sun doesn't have the characteristics to follow the massive star path because it isn't hot/luminous enough.
46NECAP 2013 Grade 11 Science Released Items_V2
NECAP 2013 RELEASED INQUIRY TASKGRADE 11 SCIENCE
SCORE POINT 2
2101000578
u
A correct prediction is made and arrived at logically. The response is solidly supported with information from previous tables and the diagram.
47NECAP 2013 Grade 11 Science Released Items_V2
NECAP 2013 RELEASED INQUIRY TASKGRADE 11 SCIENCE
SCORE POINT 1
2101000735
u
A correct prediction is made with some supporting information from the diagram.
48NECAP 2013 Grade 11 Science Released Items_V2
NECAP 2013 RELEASED INQUIRY TASKGRADE 11 SCIENCE
SCORE POINT 0
2101000415
u
Incorrect.
49NECAP 2013 Grade 11 Science Released Items_V2
NECAP 2013 RELEASED INQUIRY TASKGRADE 11 SCIENCE
Broad Area of Inquiry: Developing and Evaluating ExpectationsInquiry Construct 12: Use evidence to support and justify interpretations and conclusions or explain how
the evidence refutes the hypothesis.
248630.000 Pool: Trial New
i Use information from Diagram 2 to support or refute the idea that the new star is a main-sequence star.
Scoring Guide
Score Description
2The response demonstrates a general understanding of how to support and justify interpretations and conclusions or explain how the evidence refutes the hypothesis. The response identifi es the most accurate prediction and explains why.
1The response demonstrates a limited understanding of how to support and justify interpretations and conclusions or explain how the evidence refutes the hypothesis.
0 The response is incorrect or irrelevant to the skill or concept being measured.
Blank No response
Training Notes:
The star is not main sequence because its temperature and luminosity are off the main sequence line, which means it has a much higher mass than the Sun.
50NECAP 2013 Grade 11 Science Released Items_V2
NECAP 2013 RELEASED INQUIRY TASKGRADE 11 SCIENCE
SCORE POINT 2
2101000944
The response is correct, with valid support, though the response does not directly relate the extreme temperature and luminosity to a high mass.
i
SCORE POINT 1
2101000433
The response is a vague reference to the star being an outlier.
i
51NECAP 2013 Grade 11 Science Released Items_V2
NECAP 2013 RELEASED INQUIRY TASKGRADE 11 SCIENCE
SCORE POINT 0
2101000569
Incorrect. The new star will be larger than 10MSun.
i