new estimates of potential impacts of sea level rise in poland
TRANSCRIPT

NHESSD3, 2493–2536, 2015
New estimates ofpotential impacts of
sea level rise inPoland
D. Paprotny andP. Terefenko
Title Page
Abstract Introduction
Conclusions References
Tables Figures
J I
J I
Back Close
Full Screen / Esc
Printer-friendly Version
Interactive Discussion
Discussion
Paper
|D
iscussionP
aper|
Discussion
Paper
|D
iscussionP
aper|
Nat. Hazards Earth Syst. Sci. Discuss., 3, 2493–2536, 2015www.nat-hazards-earth-syst-sci-discuss.net/3/2493/2015/doi:10.5194/nhessd-3-2493-2015© Author(s) 2015. CC Attribution 3.0 License.
This discussion paper is/has been under review for the journal Natural Hazards and EarthSystem Sciences (NHESS). Please refer to the corresponding final paper in NHESS if available.
New estimates of potential impacts of sealevel rise and coastal floods in PolandD. Paprotny1 and P. Terefenko2
1Department of Hydraulic Engineering, Faculty of Civil Engineering and Geosciences,Delft University of Technology, Stevinweg 1, 2628 CN Delft, the Netherlands2Remote Sensing and Marine Cartography Unit, Faculty of Geosciences,University of Szczecin, Mickiewicza 18, 70-383 Szczecin, Poland
Received: 23 March 2015 – Accepted: 25 March 2015 – Published: 14 April 2015
Correspondence to: D. Paprotny ([email protected])
Published by Copernicus Publications on behalf of the European Geosciences Union.
2493
NHESSD3, 2493–2536, 2015
New estimates ofpotential impacts of
sea level rise inPoland
D. Paprotny andP. Terefenko
Title Page
Abstract Introduction
Conclusions References
Tables Figures
J I
J I
Back Close
Full Screen / Esc
Printer-friendly Version
Interactive Discussion
Discussion
Paper
|D
iscussionP
aper|
Discussion
Paper
|D
iscussionP
aper|
Abstract
Polish coastal zone is thought to be of the most exposed to sea level rise in Europe.With climate change expected to raise mean sea levels between 26 and 200 cm bythe end of the century, and storms increasing in severity, accurate estimates of thosephenomena are needed. Recent advances in quality and availability of spatial data5
in Poland made in possible to revisit previous estimates. Up-to-date detailed informa-tion on land use, population and buildings were used to calculate inundation risk at abroad range of scenarios. Inclusion, though imperfect, of flood defences from a high-resolution digital elevation model contributes to a further improvement of estimates.The results revealed that even by using a static “bathtub fill” approach the amount of10
land, population or assets at risk has been significantly revised down. Sea level riseor storm surges are unlikely to reach intensity required to cause significant damageto the economy or endanger the population. The exposure of different kinds of assetsand sectors of the economy varies to a large extent, though the structural breakdownof potential losses is remarkably stable between scenarios.15
1 Introduction
Contemporary sea level rise, triggered by the changing climate, is major threat tocoastal areas. Global mean sea level has risen by 21 cm between 1880 and 2009(Church and White, 2011). Around 10 % of world population lives in low-elevationcoastal zones, including 7 % of Europeans (McGranahan et al., 2007). Projections by20
IPCC (Church et al., 2013) indicate a possibility of a further increase by 26–98 cm bythe end of the century, though a rise by 140–200 cm is suggested by other authors(e.g. Pfeffer et al., 2008; Rahmstorf, 2007). The pace of water level rise in the PolishBaltic Sea coast is generally in line with global estimates. Tide gauge in Świnoujście, inthe western part, has one of the longest instrumental records in the world (Permanent25
Service for Mean Sea Level, 2015) and during 1811–2006 a trend of 0.4 mmyr−1 was
2494

NHESSD3, 2493–2536, 2015
New estimates ofpotential impacts of
sea level rise inPoland
D. Paprotny andP. Terefenko
Title Page
Abstract Introduction
Conclusions References
Tables Figures
J I
J I
Back Close
Full Screen / Esc
Printer-friendly Version
Interactive Discussion
Discussion
Paper
|D
iscussionP
aper|
Discussion
Paper
|D
iscussionP
aper|
observed here, accelerating to 1.0 mmyr−1 during 1947–2006 (Wiśniewski et al., 2011).The values increase moving eastward: Kołobrzeg (central part of the Polish coast)recorded an increase of 0.5 mm during 1901–2006 and 1.4 mm during 1947–2006,while Gdańsk (eastern coast) observed 1.6 mm during 1886–2006 and 2.5 mm during1947–2006. The difference is largely due to uneven isostatic movement of the crust.5
Satellite altimetry reveals that the rise in water levels is virtually the same at variousoffshore locations in the southern Baltic Sea. It amounts to 3.3 mmyr−1 between 1992and 2012 (Stramska and Chudziak, 2013), a pace very similar to the world ocean av-erage.
At a shorter timescale, the coasts are endangered by storm surges. Several large10
coastal floods occurred in late 19th and early 20th century, with a few calmer decadesthereafter. More recently, however, storms are on the rise: the number of surges ex-ceeding the warning level of 570 cm (i.e. about 70 cm above mean) soared from abouttwo per year in the 1950s to six per year in 2000s (Wiśniewski and Wolski, 2009). Usu-ally the event is too short to cause damages inland. However, during a storm surge15
in January 1983 water levels exceeded 1.3 m above average along the majority of thecoast, affecting many locations, particularly in the eastern part. In the Żuławy regiona total of 50 km2 of land was flooded and almost 1300 people were evacuated (Bed-narczyk et al., 2006). Wiśniewski and Wolski (2009) estimated that a 100 year coastalflood could be as high as 1.95 m above average in Kołobrzeg, while a 1000 year flood20
might reach 2.5 m (the highest value actually recorded was 2.22 m, in 1872). Long-lasting storm surges, even though relatively insignificant at the coast, can cause a flooddozens of kilometres inland, on the low-lying banks of Odra or Vistula rivers. Water in-flux from the sea due to northerly winds at times increases water levels above themaximum observed at the coast (Wiśniewski and Kowalewska-Kalkowska, 2007). The25
highest recorded water level in Szczecin, located almost 70 km inland, was 1.54 mabove average during a storm surge in 1913 (Richter et al., 2012). The most recentstorm surge resulting in a large inflow of seawater into the river network occurred in2009, causing losses of several million PLN in locations all over the coast, mainly in
2495

NHESSD3, 2493–2536, 2015
New estimates ofpotential impacts of
sea level rise inPoland
D. Paprotny andP. Terefenko
Title Page
Abstract Introduction
Conclusions References
Tables Figures
J I
J I
Back Close
Full Screen / Esc
Printer-friendly Version
Interactive Discussion
Discussion
Paper
|D
iscussionP
aper|
Discussion
Paper
|D
iscussionP
aper|
the eastern part (KZGW, 2011). Across the whole region, flood defences protect thelowest areas, particularly around river mouths and coastal lakes, while the rest of thecoast is screened from storm surges by dunes and cliffs.
It is generally considered (Church et al., 2013; Hunter, 2010; Xu and Huang, 2013;Wróblewski, 1994) that with the increase of mean sea levels also the extreme levels will5
soar. Rare events could therefore appear more frequently, while areas not consideredas endangered today would become at risk in the future. It is therefore necessary toassess the number of persons and value of assets which could be at stake. In Poland,comprehensive research on coastal flood risk considering sea level rise (SLR) wasoriginally spawned by IPCC’s first assessment report released in 1990. Rotnicki and10
Borówka (1991) used 1 : 25 000 topographic maps to calculate the area threatenedby rising waters along with a quantification of elements affected, such as land use,infrastructure, settlements and their population. According to an expanded version ofthat study (Rotnicki et al., 1995), a 2.5 m SLR could impact 2700 km2 of land, including93 km2 of settlements, 374 km of railways, 906 km of roads and 297 000 people. Pluijm15
et al. (1992) used their data to obtain monetary value of land and structures at risk.The results indicated that a one-metre rise of mean sea levels would result in a lossof assets worth 24 % of 1990 gross domestic product (GDP). Several studies basedon the aforementioned publications also have been published (Zeidler, 1997; Pruszakand Zawadzka, 2005, 2008). Additionally, Poland was included in studies on global20
and European flood risk, with country-specific data most recently provided by Boselloet al. (2012). All of these studies used only low-resolution data and were kept on a highdegree of generalization. Also, only a limited set of statistics is provided by all thosestudies and for only a few scenarios of water level rise; global studies mostly do notshow country-specific data (e.g. Hinkel et al., 2014) or quote Zeidler’s (1997) study.25
More recently, due to the obligations imposed by the European Union’s “flood direc-tive” (EU, 2007), the national government ordered preparation of flood risk maps forselected regions of Poland. They were published in 2013 by the National Water Man-agement Authority (KZGW, 2015). Their main advantage is the use of up-to-date, de-
2496

NHESSD3, 2493–2536, 2015
New estimates ofpotential impacts of
sea level rise inPoland
D. Paprotny andP. Terefenko
Title Page
Abstract Introduction
Conclusions References
Tables Figures
J I
J I
Back Close
Full Screen / Esc
Printer-friendly Version
Interactive Discussion
Discussion
Paper
|D
iscussionP
aper|
Discussion
Paper
|D
iscussionP
aper|
tailed and high-resolution data, including lidar-derived digital elevation models (DEMs),aerial photography, land surveys and administrative registers. However, the main focushave been put on river floods, while only parts of the coast were investigated. More-over, no sea level rise impacts were assessed, while the analysis of storm surges waslimited only to one or two scenarios, depending on location. Finally, the results of flood5
risk calculations are provided only as a graphical representation on maps and the onlyaggregate statistics provided are the estimates of exposed population by settlement.The total value of assets at risk remains undisclosed.
In the light of the above, there is clearly a need for a high-resolution assessment ofpossible social and economic impacts of storm surges and sea level rise in Poland. In10
this paper we aim to provide more precise estimates of population and assets at risk ata broad range of scenarios, using the up-to-date and detailed cartographic materials,which have become available only recently. Most importantly, the digital elevation modelused here includes the majority of flood defences in the area, which were missing inother studies.15
2 Materials and methods
2.1 Polish Baltic Sea coast
The Baltic Sea is a non-tidal, semi-enclosed and shallow body of brackish water. Ex-change of water through the Danish Straits is the primary regulator of water levels inthe basin, causing dangerous surges primarily at its southern and eastern coasts (Ek-20
man, 2009; Wolski et al., 2014). Poland is one of 14 countries with access to the Balticand has a 500 km long, diversified coastline. At various locations along the coast thereare sections of cliffs made of Pleistocene deposits, totalling around 90 km, or 18 % ofentire coastline. Areas where they exist are not endangered directly by floods (theycan be up to 70 m high on Wolin Island), though their retreat due to erosion is a source25
of threat related to storm surges and sea level rise (Schwarzer et al., 2003; Kolander
2497

NHESSD3, 2493–2536, 2015
New estimates ofpotential impacts of
sea level rise inPoland
D. Paprotny andP. Terefenko
Title Page
Abstract Introduction
Conclusions References
Tables Figures
J I
J I
Back Close
Full Screen / Esc
Printer-friendly Version
Interactive Discussion
Discussion
Paper
|D
iscussionP
aper|
Discussion
Paper
|D
iscussionP
aper|
et al., 2013). Apart from an alluvial section in the Puck Lagoon (less than 3 % of total),the remainder is a spit- and barrier-type coast, with dunes ranging in height from lessthan 2 up to 49 m. Behind the dunes, coastal plains of glacial or fluvioglacial origin filledmostly with peat are usually observed. Their surface is only 1–3 ma.s.l. Depressionsoccur occasionally in the surroundings of shallow and relatively large coastal lakes5
such as Łebsko, Jamno or Gardno (Tomczak, 1995). The biggest area laying belowsea level are is the Vistula river delta, known as Żuławy Wiślane. At some locationsthe elevation is 1.8 m below mean sea level, hence the area needs to be protected bya complex system of dykes, channels, sluices and pumping stations.
Two large, shallow lagoons also exist in the Polish coastal zone, bookending the10
coast at the borders with neighbouring states. Szczecin Lagoon is the outlet of Odrariver and is separated from open sea by Usedom and Wolin Islands, therefore it isconnected to the Baltic only by three narrow straits, including one in Germany. VistulaLagoon is a long and narrow body of water limited by the Vistula Spit and has only onestrait to connect it with the sea (it is located outside Poland).15
The coastal zone itself is not particularly vital to the national economy. Barely 0.6 %of total employment is in the maritime sectors (shipping, shipbuilding, fishery etc.),while only a limited amount of goods and passengers move through Polish ports. It isnot densely inhabited: the total population of municipalities with direct access to thesea was 1 070 000 in 2013, with three fourths concentrated the Tricity agglomeration20
(Gdańsk, Sopot, Gdynia). That is 2.8 % of Polish residents and excluding the Tricitythe population density in this area is a mere 90 persons per km2, below the nationalaverage of 123. Additional 516 000 persons live in municipalities containing “internalmaritime waters” (as Szczecin and Vistula lagoons are collectively named by the gov-ernment along with some other waters which enable access to ports), mainly in the25
harbour city of Szczecin (CSO, 2015).However, the coast is by far the most popular vacation destination in Poland. 35 %
of all overnight stays in accommodation establishments during July–August 2013 oc-curred in 55 municipalities considered by Eurostat as coastal regions (CSO, 2015).
2498

NHESSD3, 2493–2536, 2015
New estimates ofpotential impacts of
sea level rise inPoland
D. Paprotny andP. Terefenko
Title Page
Abstract Introduction
Conclusions References
Tables Figures
J I
J I
Back Close
Full Screen / Esc
Printer-friendly Version
Interactive Discussion
Discussion
Paper
|D
iscussionP
aper|
Discussion
Paper
|D
iscussionP
aper|
That corresponds to an average 71 tourists per 100 residents during the summer. Theeconomies of many coastal resorts are completely dependent on this short holidayseason (Łonyszyn and Terefenko, 2014). Any damages to infrastructure and buildingscould therefore dampen the economic prospects of those localities.
The study area, as referred to hereafter, includes all municipalities in which there is5
some land laying no more than 5 m above mean sea level. There are 86 such munic-ipalities, including 22 that further divide into a town and rural area. That gives a totalof 108 basic administrative units with a combined population of 2.4 m (census, 2011).Figure 1 outlines the study area within the Polish coastal zone.
2.2 Data sources10
Two main sources of data were used in this study: the topographic objects database,containing information on land use as well as buildings, and a digital elevation model(DEM). Both were derived from national cartographic resources, which include recentoutput of large-scale mapping projects. Statistical data on demographic and economicindicators have also be collected.15
2.2.1 Digital elevation models
Quality of flood hazard analyses depends mainly on detailed information on the terrainin question. Here, a digital elevation model created through airborne laser scanningtechnology (lidar) was used. DEMs obtained using this method are commonly appliedto coastal flood risk analyses due to their accuracy (Webster, 2010). In recent years the20
national government launched a large measurement campaign specifically to providedata for flood hazard mapping. It was conceived in the coastal areas between 2010and 2013, but mainly in 2011. The density of scanning was usually 4 points per m2,except for urban agglomerations, where the density was 12 points per m2. The finaldataset in raster format has a spatial resolution of 1 m, which is fine enough to include25
flood defences and most of other small topographic features that can have a profound
2499

NHESSD3, 2493–2536, 2015
New estimates ofpotential impacts of
sea level rise inPoland
D. Paprotny andP. Terefenko
Title Page
Abstract Introduction
Conclusions References
Tables Figures
J I
J I
Back Close
Full Screen / Esc
Printer-friendly Version
Interactive Discussion
Discussion
Paper
|D
iscussionP
aper|
Discussion
Paper
|D
iscussionP
aper|
impact on flood hazard analyses. Nominal vertical accuracy of the dataset is 20 cm(CODGiK, 2014).
A very small area located in the western part of the coastal zone is not covered by thedetailed lidar DEM. The gap was filled with a different DEM, which was created on thebasis of aerial photographs. It has a spatial resolution of 40 m and a vertical accuracy5
of about 1.5 m. These are much worse values than for the lidar DEM, but it had to beused only for less than 0.1 % of the area potentially at risk, so it has a negligible impacton the results.
2.2.2 Topographic objects database
In order to calculate the value of vulnerable assets, detailed information on land use10
and buildings are necessary. The primary source of information used here is the topo-graphic objects database (pol. baza danych obiektów topograficznych), the digital suc-cessor of analogue topographic maps, created and maintained by Poland’s surveyor-general. It consists of almost 300 types of objects with a vectorised representation oftheir geometry and additional qualitative and quantitative descriptors. Accuracy of the15
database ought to be similar to a 1 : 10 000 map, which is enough to represent the nat-ural and socioeconomic environment down to a single parcel, road and building. Thecurrent structure of the database was implemented in 2011 (Law, 2011/279/1642) andits content was updated during 2012–2013. The database used here is, nominally atleast, accurate as of January–July 2013, depending on location.20
Data on buildings include their area, functional characteristic and, in most cases,the number of storeys. In case the latter is missing, the building was assumed to haveonly one storey. Roads are represented in the database as a linear object, but for eachsection their width is given, so that they could be transformed into a surface. Onlypaved roads were included in the calculation. Railway and tram lines were transformed25
into polygons according to the track’s gauge. Roads and tracks located on bridges orsimilar above-ground structures were excluded.
2500

NHESSD3, 2493–2536, 2015
New estimates ofpotential impacts of
sea level rise inPoland
D. Paprotny andP. Terefenko
Title Page
Abstract Introduction
Conclusions References
Tables Figures
J I
J I
Back Close
Full Screen / Esc
Printer-friendly Version
Interactive Discussion
Discussion
Paper
|D
iscussionP
aper|
Discussion
Paper
|D
iscussionP
aper|
2.3 Calculation of flood hazard
Flood hazard analysis forms a basis for flood risk calculations. It consists of the inun-dation extent and other hydrological parameters of the flooding, such as water depth.To calculate the floodzone, a “bathtub fill” approach was applied for this study (Batesand De Roo, 2000; Poulter and Halpin, 2008). It means that it is assumed that the sea5
at a certain scenario will cover all land laying below the assumed water level. For a sealevel rise scenario that is an accurate description, because an increased mean waterlevel would cover land permanently. However, for storm surges it is a straightforwardsimplification, as the temporal change in water levels is also an important factor deter-mining the inundation extent. Unfortunately, the data required to include time in such10
a calculation were not available to the authors. In effect, the storm surge scenariosconstitute a description of the worst-case event (Breilh et al., 2013).
After intersecting the planar water surface with the DEM some areas not connecteddirectly with the sea are also highlighted. Because the resolution of the DEM is fineenough to include flood defences, isolated locations laying below the water level at15
a certain scenario were considered protected by surrounding high terrain. These areaswere discarded to create the final flood zone using a four-side rule, which means thatno water flow was allowed in diagonal directions (Poulter and Halpin, 2008). Naturally,dikes and other structures could fail and flood the hinterland, but that aspect was notconsidered in this article. Also, the situation when water floods the land behind struc-20
tures through culverts was not analysed. Flood defences such as dikes, banks andother earthworks, as well as sluices and weirs are included.
Sea level rise and storm surges were analysed in intervals of 5 cm, providing sce-narios of 5, 10, 15 etc. cm up to 5 m a.m.s.l. In this way vulnerability at different ele-vations could be assessed in detail. The 5 m value was chosen as the rounded value25
of possible SLR from literature (2 m) together with a 1000 year coastal flood (about2.5 m). Mean sea level along the Polish coast varies slightly, with 1947–2006 averagein Gdańsk being 7 cm higher than in Świnoujście (Wiśniewski and Wolski, 2009). As
2501

NHESSD3, 2493–2536, 2015
New estimates ofpotential impacts of
sea level rise inPoland
D. Paprotny andP. Terefenko
Title Page
Abstract Introduction
Conclusions References
Tables Figures
J I
J I
Back Close
Full Screen / Esc
Printer-friendly Version
Interactive Discussion
Discussion
Paper
|D
iscussionP
aper|
Discussion
Paper
|D
iscussionP
aper|
a minor simplification, the 500 cm “baseline” level of all Polish tide gauges was usedhere, which corresponds to about +0.10 m in the European Vertical Reference SystemEVRS-2007 (Urbański 2012).
Results from the flood hazards calculations are juxtaposed here with future sea levelrise scenarios included in the latest IPCC report (Church et al., 2013) and storm surges5
of certain probabilities of occurrence. The latter were obtained by applying Gumbeldistribution to annual maximum water levels recorded at five tide gauges during 1947–2007 provided by Wiśniewski and Wolski (2009). Details on the methodology of proba-bility calculations for Polish stations can be found in Paprotny (2014).
2.4 Calculation of flood risk10
Having obtained the inundation extent, the amount of losses caused by water was anal-ysed. The investigation performed here covers three types of tangible assets whichhave a monetary value: land, immovable and movable fixed assets. Each type hasdifferent susceptibility to sea level rise or coastal floods, as presented in Table 1. Incase of rising average water levels, land and immovable fixed assets (i.e. buildings and15
structures) are covered permanently by water and therefore lost completely. Movablefixed assets, which include machine tools, household goods, vehicles or livestock, canbe evacuated from the endangered area given the gradual nature of SLR. Therefore,no losses in this category are assumed. In case of coastal floods, no losses are as-sumed for land, as water covers it only temporarily. Some productivity of land may be20
lost and consequently its market value could decrease, however this aspect was notanalysed here. Damage to crops is not analysed, as they are not considered fixed as-sets, similarly to stocks of produced goods. Losses of fixed assets are calculated usingdamage functions, which relate losses to water depths (Apel et al., 2009).
Value of aforementioned assets was calculated here using 2011 data, the latest year25
for which complete statistics required here are available. The primary source wereonline databases of the Central Statistical Office of Poland (CSO, 2015). Values ofdifferent types of land use are an estimate of their 2011 market price. Average sale
2502

NHESSD3, 2493–2536, 2015
New estimates ofpotential impacts of
sea level rise inPoland
D. Paprotny andP. Terefenko
Title Page
Abstract Introduction
Conclusions References
Tables Figures
J I
J I
Back Close
Full Screen / Esc
Printer-friendly Version
Interactive Discussion
Discussion
Paper
|D
iscussionP
aper|
Discussion
Paper
|D
iscussionP
aper|
price calculations made by CSO were used for arable land, meadows and pastures.Value of forests was taken from estimates of the State Forests, the manager of thevast majority of Polish woods (Ministry of Treasury, 2012). Their calculations includeboth the value of land parcels and the trees covering them. Value of areas coveredby buildings, transport infrastructure or non-built-up areas ready for construction was5
estimated using the relation between the sale price of those types of land use andthe sale price of arable land in Germany in 2011 (Statistisches Bundesamt, 2015). Forother types of land use, numbers were assigned based on governmental regulations onestimation of real estate value (Law, 2004/207/2109). As a result, woodlands or bushesare assumed to be worth equal to poor-quality arable land. Orchards were assigned the10
same value as arable land, while wastelands and other unutilized land were consideredas equal to poor-quality meadows. Loss of inland surface water was not taken intoconsideration. Summary of land values is presented in Table 2. Agricultural build-upareas do not form a separate category in the topographic database; it was assumedthat build-up areas adjacent to arable land and permanent crops fall into this category.15
Information on buildings was compiled from several sources in order to calculate theirvalue relative to their area (Table). Value of housing is the average construction cost ofnew houses as calculated by CSO. Stock of movable assets is difficult to estimate andno national statistics in this matter are available. However, the ratio between householddurable goods’ value and GDP is reported to differ only slightly between countries20
and throughout modern history. It was therefore assumed that the total value in thiscategory in Poland constitutes 35 % of GDP, which is the average ratio in four countries(Canada, Germany, UK and US) for which data are provided by Piketty and Zucman(2014). GDP and housing area statistics from CSO were used in order to obtain theamount of movable assets per m2 in 2011.25
Commercial buildings were divided into three branches (industry, services, agricul-ture) and for each type its value was calculated using the following formula:
V =F ×Ls
L×As(1)
2503

NHESSD3, 2493–2536, 2015
New estimates ofpotential impacts of
sea level rise inPoland
D. Paprotny andP. Terefenko
Title Page
Abstract Introduction
Conclusions References
Tables Figures
J I
J I
Back Close
Full Screen / Esc
Printer-friendly Version
Interactive Discussion
Discussion
Paper
|D
iscussionP
aper|
Discussion
Paper
|D
iscussionP
aper|
where V is the value of a building per area in PLN, F is the value of fixed assets inPoland, Ls is the corresponding land use area in the study area, L is the correspondingland use area in Poland and As is the total building area in the study area. Fixed as-sets estimates were obtained from Eurostat (2015). Land use data for Poland is fromCSO (2015), while for the study area the corresponding types of land use from the5
topographic database where used. Finally, building area was extracted from the topo-graphic database, taking into account the multiple storeys several buildings contain.
Damage functions, which relate water depth to the relative loss of assets, were ap-plied from Emschergenossenschaft/Hydrotec (2004), who created them using HOWASdatabase of flood losses (Merz et al., 2004). They were selected for this study, be-10
cause there are no corresponding function created from Polish empirical data. Addi-tionally, they are similar to damage curves created as a combination of various Euro-pean methodologies by Huizinga (2007) and suggested for use in countries without na-tional damage functions. The only exception is the damage function for transportation,which is a constant value rather than a damage function. As can be noticed in Table,15
the equations differ for immovable and movable housing assets, while for commercialactivity they are combined. Finally, the value of transport infrastructure was taken froma Polish governmental flood risk calculations methodology (Law, 2013/104). Total valueof losses for a building can be described as:
R = A× V × Y (D) (2)20
where R is the total loss for a building in PLN, A is the building area (including allstoreys), V is the total value of the building per area and Y (D) is the appropriate dam-age function for depth D (averaged within the building’s contour).
Additionally, the number of people affected by sea level rise and coastal floods wasestimated. Population data from the 2011 census (CSO, 2015) provide information25
down to settlement level. By combining these data with housing area from the topo-graphic objects database it was possible to further disaggregate the data and obtainthe average number of persons per housing area in settlements and towns. All persons
2504
NHESSD3, 2493–2536, 2015
New estimates ofpotential impacts of
sea level rise inPoland
D. Paprotny andP. Terefenko
Title Page
Abstract Introduction
Conclusions References
Tables Figures
J I
J I
Back Close
Full Screen / Esc
Printer-friendly Version
Interactive Discussion
Discussion
Paper
|D
iscussionP
aper|
Discussion
Paper
|D
iscussionP
aper|
living in a residential building even partially covered by water were assumed as beingaffected by the event. Similarly, the amount of tourism traffic potentially lost was esti-mated by disaggregating the number of tourists and nights spent in establishments (atbasic administrative unit-level) using the size of appropriate categories of buildings. Forthe purpose of this study, “tourists” refer only to persons staying overnight in collective5
accommodation, excluding persons in camping sites.
3 Results
In this section the consequences of coastal floods and sea level rise are presentedas derived from the data through the methodology outlined above. Therefore, the dataon coastal floods indicate the worst case scenario of waters reaching a given level in10
the entire study area. It should be noted that whenever statistics of inundated areaare mentioned in the next sections, they do not include land covered by water undernormal conditions. Also, all monetary values are in Polish Złoty (PLN) in 2011 prices(PLN 4.12=EUR 1). Finally, detailed results can be found in the Supplement.
3.1 General results15
Water inundates the study area at different pace depending on the analysed scenario.The flooded area encompasses 342 km2 at 0.5 m water level, 1662 km2 at 1.5 m upto a maximum of 3323 km2 at 5 m (Fig. 2). The area at risk grows most dynamicallybetween 0.3 and 1.6 m water level with an average of almost 13 km2 for every cmof water level rise. The highest value of 371 km2 is recorded between 1.2 and 1.3 m20
scenarios (Fig. 3). Besides that, two other peaks at intervals of 0.8–0.9 and 0.9–1.0 mare observed, covering 132 and 212 km2, respectively. In the 1.5 m scenario the floodedarea already reaches half the size of the 5 m hazard zone, which indicates a significantslowdown in the growth dynamic of the flood zone at higher water levels. Up until thevery last scenario it increases by 3–5 km2 cm−1 on average.25
2505

NHESSD3, 2493–2536, 2015
New estimates ofpotential impacts of
sea level rise inPoland
D. Paprotny andP. Terefenko
Title Page
Abstract Introduction
Conclusions References
Tables Figures
J I
J I
Back Close
Full Screen / Esc
Printer-friendly Version
Interactive Discussion
Discussion
Paper
|D
iscussionP
aper|
Discussion
Paper
|D
iscussionP
aper|
The number of affected buildings and population does not follow the aforementionedtendencies, especially in scenarios of low water level rise. Urban areas as well as otherdense inhabited areas are either protected or generally not located at high flood riskzones. This results in an insignificant number of endangered buildings and people upto the level of 0.8–1.0 m. Crossing this barrier, in the range from 1.0 to 2.5 m water5
level, the number of both population and buildings in the hazard zones soars (Fig. 3).For buildings, the rate of increase of water levels peaks in the 1.2–1.3 m interval andsignificantly slows thereafter. Increase in the number of persons affected reaches max-imum the 1.7–1.8 m interval and eases only above the 3 m water mark. In effect, in therange of a probable SLR or a coastal flood affecting areas deep inland (about 1.5 m)10
the density of construction is less than half of the regional average, and the populationdensity a less than a fifth. There are around 20 000 buildings and 42 000 persons withinthe upper range of IPCC sea level rise projections; the number for a coastal flood cor-responding to a 1000 year event in Szczecin (located deep inland) are approximately46 000 and 101 000, respectively.15
As can be seen in Figs. 4 and 5, the flood hazard in the Polish coastal zone doesnot concentrate near the shoreline, but primarily affects the alluvial plains located inVistula and Odra rivers’ mouths connected with two large lagoons. These estuarineregions encompass approximately 70–80 % of the total flooded area at all scenarios.The Vistula Delta alone in some simulations covers almost half of Poland’s area po-20
tentially at risk reaching 34 % at 0.3 m water level through 41 % at 1 m, 47 % at 2.5 mand 46 % at 5 m. Odra river mouth and the lowlands surrounding the Szczecin Lagoongradually decrease its share in areas at inundation risk, starting from 40 % at 0.3 mwater level, down to 31 % at 2.5 m and 30 % at 5 m. The valleys of Odra and Vistularivers located further upstream are barely affected directly, though a higher drainage25
base level can increase the risk of river floods. Finally, the area spread between thosetwo regions along 300 km of coastline contributes around 20 % to the hazard zone.Even then the flood zones cluster around numerous coastal lakes; other locations aregenerally well protected by dunes and cliffs. However, it should be remembered that
2506

NHESSD3, 2493–2536, 2015
New estimates ofpotential impacts of
sea level rise inPoland
D. Paprotny andP. Terefenko
Title Page
Abstract Introduction
Conclusions References
Tables Figures
J I
J I
Back Close
Full Screen / Esc
Printer-friendly Version
Interactive Discussion
Discussion
Paper
|D
iscussionP
aper|
Discussion
Paper
|D
iscussionP
aper|
those natural flood defences are endangered by erosion, in contrast to more stablelagoon and coastal lake surroundings. Some areas can also become surrounded bywater without being directly flooded; the Hel Spit could be severed from mainland ata water level of 2.4 m, for instance.
Population residing in rural municipalities or rural parts of mixed units are dispropor-5
tionately exposed to rising water levels. They contain 87 % of land area in the region,but only 18 % of its population. Interestingly, except for the least extreme scenarios(below 50 cm) the proportion of inundated rural to urban areas (7–8 : 1) is roughly thesame as the value for the whole region. But 51 % of population within the 1 m hazardzone live in rural areas, a value slowly declining down to 26 % at 5 m water level. Urban10
municipalities have a bigger total number of population endangered than rural munici-palities above 1.7 m water mark (for buildings, 2.5 m). Yet they are the safest place in allscenarios, followed by mixed areas. Population in main urban centres comes at risk inlarger numbers only above 2 m water level. Gdańsk, located in the Vistula estuary, com-prises more than a fifth of population at risk in scenarios above 2.5 m. Two other urban15
municipalities in the Tricity are to a vast extent less vulnerable, with almost no popu-lation in the flood zone below that value. Świnoujście comes second, with exposuresoaring above 1.5 m water mark, putting the city’s contribution to affected population at10 % of regional total.
3.2 Results by categories of assets20
The structure of land at risk is similar in almost all scenarios and reflects the gen-eral composition of land use both in the region and country. Figure 6 presents thebreakdown by five major groups. Barren land, the smallest group representing mainlybeaches and dunes, covers more than 5 % of the total flooded area only up to thewater level of 20 cm. It decreases down to 0.7 % at 5 m, above its 0.3 % contribution25
to the region, since almost two-thirds of barren land is within that zone. Grasslands,which are mostly swampy meadows and pastures, constitute more than 85 % of thetotal area at water levels below 20 cm. Its share significantly drop down afterwards and
2507

NHESSD3, 2493–2536, 2015
New estimates ofpotential impacts of
sea level rise inPoland
D. Paprotny andP. Terefenko
Title Page
Abstract Introduction
Conclusions References
Tables Figures
J I
J I
Back Close
Full Screen / Esc
Printer-friendly Version
Interactive Discussion
Discussion
Paper
|D
iscussionP
aper|
Discussion
Paper
|D
iscussionP
aper|
fluctuates, but remains the biggest land use group at risk until 1.25 m, when croplandscome forward. Share of grasslands gradually decreases to 36 % at 5 m water level,still above the 22 % average for the region. Croplands are relatively less at risk up to1.25 m, when its share reaches 43 % and remains virtually unchanged for other scenar-ios, slightly above its regional contribution to land use of 39 %. Permanent crops, which5
comprise a small part of croplands, are less vulnerable than arable land. More than10 % of the latter is already flooded by 1.25 m, while in case of orchards this thresholdis not reached until the level of 3.9 m. Natural vegetation represented by woodlandsand bushes contribute to about 11–16 % of land at risk, except for areas below the40 cm water mark. That is less than half of their share in the region (32 %). At the same10
time, a quarter of all area covered by bushes could be flooded at 1 m water level, butonly 3 % of forests. It should be noted that newly-planted forests and tree nurseriesare among the least vulnerable categories of all studied assets, as little area for newforests is available in the coastal zone.
The last group of land use, artificial surfaces (i.e. areas covered by buildings, in-15
frastructure, landfills and similar human-made structures), is very diversified. Its shareslowly increases from around 1 to 6 % by 5 m water level, roughly the same percent-age as its prevalence in the whole region. Areas used for storage and warehousingare most vulnerable, with 11 % already at risk at 1.5 m water level and 36 % at 2.5 m.Land underlying machinery and utilities is also disproportionately exposed. This can be20
explained by the existence of numerous facilities related with seafaring, such as ports,shipyards and naval bases. For the same reason industrial areas are more vulnerablethan services. Agricultural build-up areas are slightly more at risk than single-familyresidential zones located further away from croplands. Multi-family residential areasare among the least exposed, with only 1.2 % potentially at risk at 1.5 m water level25
(single-family – 5.8 %). Finally, landfill sites are the least exposed, which is particularlydesirable, since flooding of those facilities could lead to contamination of water. Only6 % of their area is within the 5 m hazard zone and 2 % below 1 m.
2508

NHESSD3, 2493–2536, 2015
New estimates ofpotential impacts of
sea level rise inPoland
D. Paprotny andP. Terefenko
Title Page
Abstract Introduction
Conclusions References
Tables Figures
J I
J I
Back Close
Full Screen / Esc
Printer-friendly Version
Interactive Discussion
Discussion
Paper
|D
iscussionP
aper|
Discussion
Paper
|D
iscussionP
aper|
The topographic objects database used for this analysis distinguishes 22 categoriesof buildings. In scenarios with lowest water levels only a few buildings are indicatedas being at risk, mainly from the services sector, such as warehouses. Below 70 cmwater level farmhouses are the main type of buildings in the hazard zone, followedby single-family houses. The latter dominate in number for all other scenarios, with5
a contribution oscillating just below 50 %. Additionally they are the biggest group atrisk by floor area for every scenario above the uncertainty range (20 cm). Multi-familyhouse grow in number quickly above 1.2 m, but it is not until 2.55 m that their floor areaexceeds that of farmhouses. This illustrates how areas outside urban centres, wheresingle-family houses and farmhouses dominate, are vastly more at risk than densely-10
populated urban areas. The latter were mainly built in less flood-prone areas and arebetter protected by dikes. The proportion of population living in exposed single-familyresidences is almost 90 % at 1 m water level and decreases at more extreme scenarios,before converging with houses containing two and more flats at 4.1 m water mark.The least vulnerable category of buildings in the 5 m hazard zone are those used for15
collective residence, such as social care centres, prisons or military barracks.Non-residential buildings in industry and services are even more diverse in vulnera-
bility. Figure 7 compares the exposure of selected groups of buildings. Health care isamong the least endangered, with barely 2 % located within the 2 m hazard zone. Thispercentage, however, increases vastly thereafter and buildings used for health services20
end up as one of the most vulnerable groups. Tourist accommodation other than hotelsis also safe at low water levels, but ultimately becomes the most exposed in all scenar-ios above 1.45 m. In case of hotels the percentage is lower, 48 % compared to 68 %for other accommodation establishments, though it still comes at second place in the5 m hazard zone. Museums and libraries come third, with the percentage potentially at25
risk increasing sharply between the 1.5 and 2.0 m water marks (from 5 to 20 %). Otherassets disproportionately vulnerable include warehouses and other storage facilities aswell as industrial buildings, which can be traced to the maritime sector of the economy.
2509

NHESSD3, 2493–2536, 2015
New estimates ofpotential impacts of
sea level rise inPoland
D. Paprotny andP. Terefenko
Title Page
Abstract Introduction
Conclusions References
Tables Figures
J I
J I
Back Close
Full Screen / Esc
Printer-friendly Version
Interactive Discussion
Discussion
Paper
|D
iscussionP
aper|
Discussion
Paper
|D
iscussionP
aper|
On the other end of the scale, schools and trade/services buildings are among the leastexposed in both number and floor area.
Transport infrastructure is generally more exposed than buildings. Paved roads arethe most vulnerable up to 2.3 m water level; above that value tracks come first, whileairstrips are of least concern in all scenarios. As could have been expected, the magni-5
tude of risk decreases with the increase of importance of a road. Motorways may onlybe flooded at water levels rising above 2.6 m; less than 3 % of their total surface areain the region can be affected by water as high as 5 m. Expressways are more likely tobe inundated (5 % at 2.5 m), but are still the safest behind motorways, followed by na-tional and regional roads (both 12 % of the region’s total at 2.5 m scenario). The value10
for roads maintained by counties is 15 %, by municipalities 16 %, by local communitiesand private owners 19 % and by companies 39 %. This ranking is mostly the same forall scenarios; the municipal and private roads are the biggest part of the network andtheir owners would have to deal with most of the infrastructure restoration costs. Mean-while, 18 % of railways are vulnerable at 2.5 m water level, albeit the figure is somewhat15
exaggerated due to the numerous sidings located in ports. More important arteries areless exposed – only 6 % of the region’s electrified mainlines are in the 2.5 m hazardzone. Tram lines exist only in three cities in the coastal zone and up until 2 m waterlevel are the least vulnerable transport infrastructure apart from motorways. Finally,airstrips are not at substantially at risk. No commercial airport is within the 5 m hazard20
zone and only some military installations (operational or defunct) could be inundated.
3.3 Economic breakdown of losses
As shown in the previous section, the total economic losses due to sea level rise in-crease rapidly with the water level, and even more so for coastal floods. At the lowerend of IPCC’s SLR projections (40 cm), potential losses are estimated to amount to25
PLN 1.4 bln, while on the higher end (130 cm) they soar to PLN 20.2 bln (Fig. 8a).Notwithstanding, the structure of assets at risk changes little with rising water levels.Figure 8c presents the breakdown by economic activity for SLR. Assets used for agri-
2510
NHESSD3, 2493–2536, 2015
New estimates ofpotential impacts of
sea level rise inPoland
D. Paprotny andP. Terefenko
Title Page
Abstract Introduction
Conclusions References
Tables Figures
J I
J I
Back Close
Full Screen / Esc
Printer-friendly Version
Interactive Discussion
Discussion
Paper
|D
iscussionP
aper|
Discussion
Paper
|D
iscussionP
aper|
culture and forestry dominate at water levels below 90 cm, as low-lying grasslands,arable land and forests near estuaries and coastal lakes are flooded first. At higherelevations housing dominates as the prime asset at risk, with the proportion reaching40 % at 90 cm and gradually rising to a maximum of 53 %. Industrial assets fluctuatearound 10 %, while the percentage associated with the services sector soars to slightly5
above 20 % at 1.8 m, and remains at that level for other scenarios. In agriculture landis the main source of losses; for other economic activity it is predominantly buildings,with those used for storage worth most up to 1.3 m water level, for manufacturing andutilities between 1.3 and 2.4 m and tourist accommodation above that value. In total,land and buildings are almost equal in value up to 85 cm, when the losses associated10
with the latter increase sharply. Buildings constitute more than 60 % of losses at waterlevels above 1.45 m and more than 70 % above 2.4 m, before peaking at 74 %. Thepercentage of potential losses connected with infrastructure slowly increases with thewater level, but generally stays around 10 %.
In case of coastal floods, the total amount of damages changes differently. Losses15
potentially caused by sea level rise soar between 1.25 and 2.1 m and slow down sub-stantially afterwards, while those resulting from coastal floods accelerate with the in-crease of water levels. This is because the risk from storm surges is calculated usingdamage curves; the thicker is the water layer covering the buildings, the higher is thevalue of losses. These are estimated at PLN 1.4 bln for a 1 m surge and PLN 16.6 bln20
for a 2.5 m surge, provided that it occurs in the entire coastal zone (Fig. 8b). The break-down of those losses by economic sectors is even more stable at various water levelsthan in case of SLR (Fig. 8d). Apart from water levels below the uncertainty range,where merely a few buildings or roads could be affected, housing dominates at around40 % of all losses. Industry comprises around 20 % of total, while the services sector25
hovers up a growing fraction from less than 10 % (below 1 m) to 23 % (5 m). Assets inthe agricultural sector are worth little and therefore responsible for only a small per-centage of losses (only 4 % at 1 m, 2 % at 3 m). Infrastructure contributes significantlyat low water levels (more than half of losses below 0.5 m), but less so for other sce-
2511

NHESSD3, 2493–2536, 2015
New estimates ofpotential impacts of
sea level rise inPoland
D. Paprotny andP. Terefenko
Title Page
Abstract Introduction
Conclusions References
Tables Figures
J I
J I
Back Close
Full Screen / Esc
Printer-friendly Version
Interactive Discussion
Discussion
Paper
|D
iscussionP
aper|
Discussion
Paper
|D
iscussionP
aper|
narios; the percentage value drops below 30 % at 1.25 m and below 20 % at 1.9 m,ultimately reaching 7 % at 5 m.
The overall impact of coastal floods and sea level rise on the national economywould be fairly limited. Fixed assets are the primary factor of production and a 1 mwater level would affect merely 0.08 % of immovable commercial fixed assets in the5
country, a value rising above 1 % only at 2.4 m and coming close to 2 % at 5 m. Evenunexceptional storm surges could potentially incapacitate more than 0.1 % of assetsonly by reaching more than 1.9 m along the entire coast. But the impact on the localeconomy would be nevertheless substantial, since the region contains less than 6 %of commercial assets in the country. 34 % of these are within the 5 m hazard zone for10
sea level rise and 14 % for coastal floods. The total value of all investigated assets atrisk due to SLR equals the combined GDP of nine NUTS3 regions involved at 5 m;it already exceeds 10 % at 1.25 m. For coastal floods, losses exceed 10 % of GDP ofthose regions above 2.5 m (around the size of a 1000 year event).
Tourism, the mainstay of the coastal regions’ economy, is unlikely to be much affected15
directly by sea level rise. Virtually no tourist traffic (measured both by the number ofnights spend or number of visitors) is endangered below 90 cm, near the upper rangeof SLR projections up to 2100. The numbers grow rapidly above 1.3 m, so that a 2 msurge could potentially disrupt the work of establishments used by 11 % of touristsvisiting the region. Places near the shoreline are the most attractive to tourists, so in20
total 62 % of nights spent during 2011 in the region was in buildings laying below the5 m water mark (15 % of national total).
3.4 Losses to cultural and natural heritage
Our calculations of economic damage excluded two types of buildings whose real valueis intangible. Buildings used for religious practices (mainly catholic churches) are the25
least vulnerable within the 5 m hazard zone of all 22 categories of buildings – slightlyless than 20 % are potentially at risk. They are also amongst the least endangered forother scenarios. This can be explained by the fact that most of the existing churches
2512

NHESSD3, 2493–2536, 2015
New estimates ofpotential impacts of
sea level rise inPoland
D. Paprotny andP. Terefenko
Title Page
Abstract Introduction
Conclusions References
Tables Figures
J I
J I
Back Close
Full Screen / Esc
Printer-friendly Version
Interactive Discussion
Discussion
Paper
|D
iscussionP
aper|
Discussion
Paper
|D
iscussionP
aper|
have been constructed before any flood defences appeared in the area. In effect, theyare located on slightly higher ground. They are also more present in the sparsely-populated areas further from the coast than other kinds of buildings, especially indus-trial, commercial or tourist accommodation.
Almost 4400 buildings in the region (1 % of total) are included in the national heritage5
sites’ list. Below 2.4 m water level the fraction under threat is narrowly smaller thanbuildings in overall, but for higher levels the opposite is true. In the 5 m hazard zone31 % of national heritage sites are endangered, compared to 26 % for all buildings. Itcan be explained that buildings used for services, especially governmental, are morelikely to be heritage sites. As noted previously, those buildings are disproportionally10
represented along the hazard zones. Museums and libraries are slightly less likely tobe in hazard below the 1.7 m water mark, but 47 % them are in the 5 m zone; onlytourist accommodation has a larger fraction in danger.
More hazard is related to natural heritage. National parks, landscape parks, naturalreserves and Natura, 2000 areas (usually overlapping with the former and each other)15
cover a substantial part of the region. At the same time, 45 % of their land area isbelow the 5 m water mark. 40 % of that is contained within the 1 m hazard zone; thecorresponding value for all land is 27 % and for population a mere 5 %. It is causedby the specifics of protected land, which consists predominantly of low-lying wetlands,grasslands and forests. In total 52 % of land in the 1 m zone is under some form of20
protection (chiefly by Natura, 2000 programme), including 77 % of grasslands and 90 %of forests. Below the 0.9 m water mark national parks have the highest exposure toSLR and coastal floods (mainly in Słowiński National Park); above that value naturalreserves are the most vulnerable. Landscape parks are of least concern, due to theirlimited presence in the close proximity of the coastline.25
2513

NHESSD3, 2493–2536, 2015
New estimates ofpotential impacts of
sea level rise inPoland
D. Paprotny andP. Terefenko
Title Page
Abstract Introduction
Conclusions References
Tables Figures
J I
J I
Back Close
Full Screen / Esc
Printer-friendly Version
Interactive Discussion
Discussion
Paper
|D
iscussionP
aper|
Discussion
Paper
|D
iscussionP
aper|
4 Discussion
The results described in the previous section differ substantially from other studies thatanalysed impacts of sea level rise on the Polish coast. The primary reason is method-ological: flood zones in Rotnicki and Borówka (1991) were delimitated without takinginto account numerous barriers between the sea and low-lying areas, which was not5
possible at the resolution of their source material. Rotnicki et al. (1995) provide resultsfor only one hazard zone of 2.5 m apart from identifying assets lying below sea level.According to the authors, the 2.5 m contour represents the water level of a 100 yearstorm surge (1.5 m) superimposed on top of a 1 m sea level rise. As presented inTable 4, the flooded area calculated by Rotnicki et al. is about 18 % larger than our10
results indicate. The difference increases when analysing the number of populationat risk; Rotnicki et al. put it at almost 300 000 persons, while in this study it is nearly50 % lower. Such a big difference can be explained by the fact densely populated areasare mostly well protected by flood defences, which were not taken into account in thatstudy.15
A complementary study called VA ’92 (Zeidler, 1997) provides data for three floodzones, namely 0.3, 1 and 2.5 m. As could be seen in Table 4, the inundated area is sixtimes larger at 0.3 m in VA ’92 compared to this study, but the difference decreases withhigher water levels, converging at 2.5 m. Number of population at risk is substantiallylower than in VA ’92, while the value of assets is even more so. Particularly coruscating20
is the difference in relative economic losses, estimated at 0.6 % of GDP, while VA ’92study gives an extremely high value of 35 %. Our calculations also indicate less dam-age to transport infrastructure, though the low resolution of source material used in VA’92 somewhat distorts the statistics in this matter.
A more recent study by Bosello et al. (2012) using DIVA global coastal damage25
model gave a four times higher estimate of flooded area than this paper for a compa-rable scenario (95 cm sea level rise), yet reckon it would be worth relatively little. Theyput the value of inundated land at 0.03 % GDP in contrast to our estimate of 0.15 %,
2514

NHESSD3, 2493–2536, 2015
New estimates ofpotential impacts of
sea level rise inPoland
D. Paprotny andP. Terefenko
Title Page
Abstract Introduction
Conclusions References
Tables Figures
J I
J I
Back Close
Full Screen / Esc
Printer-friendly Version
Interactive Discussion
Discussion
Paper
|D
iscussionP
aper|
Discussion
Paper
|D
iscussionP
aper|
though their figure refers to the projected economic situation in 2085 instead of thecurrent situation. That study also expects that rising waters will cause the GDP to dropby 0.046 %, which is in line with our estimate of a 0.041 % loss in commercial fixedassets.
As has been shown above, the use of more detailed topographic data significantly5
alters the statistics on the impacts of sea level rise and coastal flood. However, severallimitations to this study still exists:
– Even though the DEM used here has a high resolution, it still has some imperfec-tions which can cause inaccurate delimitations of flooded zones. A large low-lyingarea, which in reality is protected by higher terrain or flood defence structures10
can be marked as potentially flooded because of a minor error in the data. Somestructures such as sluices seem to have been edited out of the DEM during post-processing, though they are crucial for protection of certain areas.
– The geometrical representation of buildings has somewhat lower accuracy thanthe DEM, therefore they are occasionally incorrectly marked as flooded. It has15
some impact on the results for very small water levels.
– The “bathtub fill” method exaggerates the risk posed by storm surges, an eventwhich would have different water levels at various points at the coast or lagoons.Also any overtopping of flood defences would mostly cause inundation of a muchsmaller area than indicated here, since the water level remains elevated only for20
a short period of time.
– The damage curves are subject to large uncertainty, connected mainly to build-ings’ construction characteristics and type of preparations made before the flood.Additionally, the equations used here were developed in Germany, since there isno methodology based on Polish empirical data. They substantially vary between25
countries (Huizinga, 2007).
2515

NHESSD3, 2493–2536, 2015
New estimates ofpotential impacts of
sea level rise inPoland
D. Paprotny andP. Terefenko
Title Page
Abstract Introduction
Conclusions References
Tables Figures
J I
J I
Back Close
Full Screen / Esc
Printer-friendly Version
Interactive Discussion
Discussion
Paper
|D
iscussionP
aper|
Discussion
Paper
|D
iscussionP
aper|
– Many statistics on value of assets had to be estimated, also using data from othercountries, due to lack of necessary information from national sources. Populationdata are also only disaggregated estimates instead of actual house-level informa-tion.
– Dynamics of the coast could substantially change the level of risk. Erosion of5
dunes and cliffs can cause destruction of those barriers protecting the inland fromseawater.
– Rising groundwater levels due to sea level rise could result in inundation of low-lying areas otherwise fully protected from seawater.
– Glacial isostatic adjustment and ground subsidence can also locally have an im-10
pact flood risk in the long-term.
In order to further assess the impacts of quality of data on our results we have juxta-posed them with official flood hazard maps (KZGW, 2015). Those studies were pre-pared for selected parts of the coast, utilizing hydrodynamic modelling and locally-collected data. They mostly cover a single 500 year flood scenario, which translates15
into water levels of 1.7–3.0 m depending on location. Most of those maps present verysimilar flood zones, with the main exception being the Żuławy Wiślane area, which isprotected by a more elaborate flood defence system of pumps, sluices and weirs. Ourflood zones are much bigger because they do not fully apprehend those details, thoughit also shows that when the external line of defences is breached even at water levels20
of a few dozens of centimetres, there is nothing to stop the water from flooding a vastarea. That is the reason for a few significant spikes in the statistic of affected assets andpopulation at 0.9, 1.25 and 1.75 m water level. Table 5 presents estimates of populationat risk in the main coastal cities in Poland. Water levels in KZGW maps are variabledue to the use of hydrodynamic models, their 100 and 500 year flood scenarios are25
only approximately compared with our scenarios. The analysis reveals that the use ofa static method exaggerates the number of person exposed to floods, but still gives the
2516

NHESSD3, 2493–2536, 2015
New estimates ofpotential impacts of
sea level rise inPoland
D. Paprotny andP. Terefenko
Title Page
Abstract Introduction
Conclusions References
Tables Figures
J I
J I
Back Close
Full Screen / Esc
Printer-friendly Version
Interactive Discussion
Discussion
Paper
|D
iscussionP
aper|
Discussion
Paper
|D
iscussionP
aper|
correct magnitude of the event. Additionally, part of the difference could be the effect ofdifferent sources of demographic data used in both studies. KZGW used detailed datafrom the population register instead of disaggregated estimates that are used here.
Apart from the issues of delimitating flood zones and future changes of the physi-cal environment, the demographic and economic developments could also noticeably5
modify the magnitude of risk. A storm surge can occur at any time, but sea level riseis a phenomena which is unlikely to become substantial until well into the second halfof the century. As a result, the number of persons living in areas at risk will be differentwhen the sea actually rises to hazardous levels. This is due to demographic develop-ments, especially migrations. The population currently endangered by water level of10
1 m is 49 % urban; for 2.5 m, the value is 65 %., If we apply population growth ratesfrom CSO’s (2015) projections provided at county level with urban/rural breakdowns,by 2050 those values will drop to 39 and 57 %, respectively. This is due to urban sprawl,i.e. the relocation of population from cities to the surrounding rural municipalities. At thesame time very low birth rate will cause a general population decline in the region. The15
total number of endangered population will be 17 % lower by 2050 given a 0.5 m waterlevel, but at 1 m it be the same as in 2011. At 1.5 m it will be 5 % smaller, graduallymoving towards a drop of 10 % at 5 m water level. It is difficult to conclude whether thepopulation is likely to relocate towards more flood-prone areas. However, it should benoticed that 3 % of buildings in the 1 m risk zone were under construction when the20
topographic database was last updated, slightly more than the percentage for all studyarea.
Finally, since the economy will continue to grow in the future, the incomes and valueof assets will also increase. Assets may become cheaper or costlier relative to income,easing or severing the economic impacts of coastal floods and sea level rise. This25
change can be very swift; price of arable land, for instance, increased fivefold between2000 and 2013, while price of pastures and meadows quadrupled during the sameperiod. Newly-built houses were twice as expensive in 2013 as they were a decadeearlier. However, the stock of commercial fixed assets increased by 54 % in real prices
2517
NHESSD3, 2493–2536, 2015
New estimates ofpotential impacts of
sea level rise inPoland
D. Paprotny andP. Terefenko
Title Page
Abstract Introduction
Conclusions References
Tables Figures
J I
J I
Back Close
Full Screen / Esc
Printer-friendly Version
Interactive Discussion
Discussion
Paper
|D
iscussionP
aper|
Discussion
Paper
|D
iscussionP
aper|
between 2000 and 2013, which is actually smaller than GDP growth during the sameperiod (CSO, 2015).
5 Conclusions
In this paper we have undertaken a broad analysis of the sensitivity of the Polish coastalzone to sea level rise and coastal floods. Its aim was to increase the precision and level5
of detail of country-wide risk estimates, covering both population and economics, com-pared to currently available studies. This was made possible by recent developmentsin the national stock of spatial data. Two main conclusions could be drawn from theanalysis of results.
First of all, the use of detailed spatial data and the inclusion, however imperfect, of10
flood defences caused the aggregate statistics of pdamages to be significantly reviseddown compared to other studies. This applies most to economic value of assets at risk,less so for population figures and the least for land area. Sea level rise is unlikely toreach an intensity that would lead to serious direct effects on the coastal populationand economy. Spikes in flood damage at 0.9 and 1.25 m are a notion that the water15
levels should be preferably prevented (by means of “climate policy”) from reachingsuch heights. That would help avoid spending money for adaptation of flood defences.On the other hand, since coastal floods are expected to become more severe in thefuture, some improvements would still be necessary. A 1.5 m surge could affect in theworst case scenario 59 000 persons and PLN 4.6 bln of assets, but if we add even20
a modest 40 cm SLR the values almost double to 101 000 persons and PLN 8.7 bln.This is particularly important for some major coastal cities, especially Gdańsk, whichhas the highest number of potentially affected population and buildings by 2 m or largersurges.
Secondly, the exposure of different kinds of assets varies to a large extent, while25
the structural breakdown of potential losses is remarkably stable between scenarios.Urban zones are less vulnerable than rural areas due to better protection, thus agri-
2518

NHESSD3, 2493–2536, 2015
New estimates ofpotential impacts of
sea level rise inPoland
D. Paprotny andP. Terefenko
Title Page
Abstract Introduction
Conclusions References
Tables Figures
J I
J I
Back Close
Full Screen / Esc
Printer-friendly Version
Interactive Discussion
Discussion
Paper
|D
iscussionP
aper|
Discussion
Paper
|D
iscussionP
aper|
culture will be disproportionately affected within the probable range of sea level rise,mainly due to loss of low-lying arable land and pastures. Housing dominates in the totalvalue of losses by a wide margin in scenarios above 90 cm, though at the same timeit is proportionally less vulnerable than commercial assets or infrastructure. Industrialland and buildings are more at risk than the services sector, especially warehouses5
and similar structures, due to the maritime economy’s predominance in the region. Ex-posure of infrastructure is closely related with its importance, with crucial arteries leftlargely unscathed even at most extreme scenarios.
But again, one should bear in mind that several simplifications have been used in thisstudy and more research is required, especially on coastal flood scenarios, damage10
curves, future climate, population and economic projections; and, most importantly ofall, on coastal dynamics. Additionally, sea level rise and coastal floods may not leadto significant financial losses or cause displacement many persons, but can still causelong-lasting effects. Tourist accommodation or commerce may not be much in directdanger, but the beaches and natural reserves which draw the visitors are the first in15
line to come under water.
The Supplement related to this article is available online atdoi:10.5194/nhessd-3-2493-2015-supplement.
Acknowledgements. The authors would like to thank the Central Surveying and CartographicDocumentation Center (CODGiK) in Warsaw, Poland, for kindly providing the topographic ob-20
jects database and digital elevation models used in this study. Special thanks should be ex-tended to S. N. Jonkman for his comments on the draft of this paper.
2519

NHESSD3, 2493–2536, 2015
New estimates ofpotential impacts of
sea level rise inPoland
D. Paprotny andP. Terefenko
Title Page
Abstract Introduction
Conclusions References
Tables Figures
J I
J I
Back Close
Full Screen / Esc
Printer-friendly Version
Interactive Discussion
Discussion
Paper
|D
iscussionP
aper|
Discussion
Paper
|D
iscussionP
aper|
References
Apel, H., Aronica, G. T., Kreibich, H., and Thieken, A. H.: Flood risk analyses – how detailed dowe need to be?, Nat. Hazards, 49, 79–98, doi:10.1007/s11069-008-9277-8, 2009.
Bates, P. and De Roo, A. P.: A simple raster-based model for flood inundation simulation. J.Hydrol., 236, 54–77, doi:10.1016/S0022-1694(00)00278-X, 2000.5
Bednarczyk, S., Jarzębińska, T., Mackiewicz, S., and Wołoszyn, E.: Vademecum ochrony prze-ciwpowodziowej, Krajowy Zarząd Gospodarki Wodnej, Gdańsk, 326 pp., 2006.
Bosello, F., Nicholls, R. J., Richards, J., Roson, R., and Tol, R. S. J.: Economic impacts ofclimate change in Europe: sea-level rise, Climatic Change, 112, 63–81, doi:10.1007/s10584-011-0340-1, 201210
Breilh, J. F., Chaumillon, E., Bertin, X., and Gravelle, M.: Assessment of static flood modelingtechniques: application to contrasting marshes flooded during Xynthia (western France), Nat.Hazards Earth Syst. Sci., 13, 1595–1612, doi:10.5194/nhess-13-1595-2013, 2013.
Church, J. A. and White, N. J.: Sea-level rise from the late 19th to the early 21st century, Surv.Geophys., 32, 585–602, doi:10.1007/s10712-011-9119-1, 2011.15
Church, J. A., Clark, P. U., Cazenave, A., Gregory, J. M., Jevrejeva, S., Levermann, A., Merri-field, M. A., Milne, G. A., Nerem, R. S., Nunn, P. D., Payne, A. J., Pfeffer, W. T., Stammer, D.,and Unnikrishnan, A. S.: Sea level change, in: Climate Change 2013: The Physical ScienceBasis Contribution of Working Group I to the Fifth Assessment Report of the Intergovern-mental Panel on Climate Change, edited by: Stocker, T. F, Qin, D., Plattner, G.-K., Tignor, M.,20
Allen, S. K., Boschung, J., Nauels, A., Xia, Y., Bex, V., and Midgley, P. M., Cambridge Univer-sity Press, Cambridge and New York, 1137–1216, 2013.
CODGiK: Numeryczne Dane Wysokościowe, available at: http://www.codgik.gov.pl/index.php/zasob/numeryczne-dane-wysokosciowe.html, last access: 11 December 2014.
CSO: available at: http://stat.gov.pl/en/, last access: 2 February 2015.25
Ekman, M.: The changing level of the Baltic Sea during 300 years: a clue to understanding theEarth. Summer Institute for Historical Geophysics, Åland Islands, 168 pp., 2009.
Emschergenossenschaft/Hydrotec: Hochwasser-Aktionsplan Emscher – Methodik derSchadensermittlung, available at: http://www.eglv.de/fileadmin/EmscherGenossenschaft/2.3_Flussgebietsmanagement/Karten_Anlage/Methodik_der_Schadensermittlung/methodik_30
schadensermittlung.pdf (last access: 27 November 2014), 2004.
2520

NHESSD3, 2493–2536, 2015
New estimates ofpotential impacts of
sea level rise inPoland
D. Paprotny andP. Terefenko
Title Page
Abstract Introduction
Conclusions References
Tables Figures
J I
J I
Back Close
Full Screen / Esc
Printer-friendly Version
Interactive Discussion
Discussion
Paper
|D
iscussionP
aper|
Discussion
Paper
|D
iscussionP
aper|
EU: Directive 2007/60/EC of the European Parliament and of the Council of 23 October 2007on the assessment and management of flood risks, 27–34, OJ L 288 of 6 November 2007, .
Eurostat: available at: http://epp.eurostat.ec.europa.eu/portal/page/portal/statistics/themes,last access: 22 January 2015.
Hinkel, J., Linckea, D., Vafeidis, A. T., Perrettec, M., Nicholls, R. J., Tol, R. S. J., Marzeion, B.,5
Fettweis, X., Ionescu, C., and Levermann, A.: Coastal flood damage and adaptationcosts under 21st century sea-level rise, P. Natl. Acad. Sci. USA, 111, 3292–3297,doi:10.1073/pnas.1222469111, 2014.
Huizinga, H.: Flood damage functions for EU member states, JRC-Institute for Environmentand Sustainability/HKV Consultants, Lelystad, the Netherlands, 67 pp., 2007.10
Hunter, J.: Estimating sea-level extremes under conditions of uncertain sea-level rise, ClimaticChange, 99, 331–350, doi:10.1007/s10584-009-9671-6, 2010.
Kolander, R., Morche, D., and Bimböse, M.: Quantification of moraine cliff coasterosion on Wolin Island (Baltic Sea, northwest Poland), Baltica, 26, 37–44,doi:10.5200/baltica.2013.26.04, 2013.15
KZGW: Raport z wykonania wstępnej oceny ryzyka powodziowego, KZGW, Warszawa, 618 pp.,available at: http://www.kzgw.gov.pl/files/file/Materialy_i_Informacje/WORP/Raport.pdf (lastaccess: 18 January 2015), 2011.
KZGW: Informatyczny System Osłony Kraju, available at: http://mapy.isok.gov.pl/imap/, last ac-cess: 10 Febuary 2015.20
Łonyszyn, P. and Terefenko, O.: Creation of an alternative season based on sustainabletourism as an opportunity for Baltic Sea Region, J. Coast. Res., Special Issue, 70, 454–459,doi:10.2112/SI70-077.1, 2014.
McGranahan, G., Balk, D., and Anderson, B.: The rising tide: assessing the risks of climatechange and human settlements in low elevation coastal zones, Environ. Urban., 19, 17–37,25
doi:10.1177/0956247807076960, 2007.Merz, B., Kreibich, H., Thieken, A., and Schmidtke, R.: Estimation uncertainty of di-
rect monetary flood damage to buildings, Nat. Hazards Earth Syst. Sci., 4, 153–163,doi:10.5194/nhess-4-153-2004, 2004.
Ministry of Treasury: Sprawozdanie o stanie mienia Skarbu Państwa, Warsaw, 114 pp., avail-30
able at: http://bip.msp.gov.pl/download/1/5554/Sprawozdanie2011.pdf (last access: 5 De-cember 2014), 2012.
2521

NHESSD3, 2493–2536, 2015
New estimates ofpotential impacts of
sea level rise inPoland
D. Paprotny andP. Terefenko
Title Page
Abstract Introduction
Conclusions References
Tables Figures
J I
J I
Back Close
Full Screen / Esc
Printer-friendly Version
Interactive Discussion
Discussion
Paper
|D
iscussionP
aper|
Discussion
Paper
|D
iscussionP
aper|
Paprotny, D.: Trends in storm surge probability of occurrence along the Polish Baltic Sea coast,arXiv1410.2547, 2014.
Permanent Service for Mean Sea Level: http://www.psmsl.org/data/obtaining/map.html, last ac-cess: 8 January 2015.
Pfeffer, W. T., Harper, J. T., and O’Neel, S.: Kinematic constraints on glacier contributions to5
21st century sea level rise, Science, 321, 1340–1343, doi:10.1126/science.1159099, 2008.Piketty, T. and Zucman, G.: Capital is Back: Wealth-income ratios in rich countries, 1700–
2010, Q. J. Econ., 129, 1155–1210, doi:10.1093/qje/qju018, 2014.Pluijm, M., Toms, G., Zeidler, R. B., van Urk, A., and Misdorp, R.: Vulnerability Assessment to
Accelerated Sea Level Rise: Case Study Poland, Ministry of Transport, Public Works and10
Water Management, The Hague, 49 pp., 1992.Poulter, B. and Halpin, P. N.: Raster modelling of coastal flooding from sea-level rise, Int. J.
Geogr. Inf. Sci., 22, 167–182, doi:10.1080/13658810701371858, 2008.Pruszak, Z. and Zawadzka, E.: Vulnerability of Poland’s coast to sea-level rise, Coast. Eng. J.,
47, 131–155, doi:10.1142/S0578563405001197, 2005.15
Pruszak, Z. and Zawadzka, E.: Potential implications of sea-level rise for Poland, J. Coast. Res.,24, 410–422, doi:10.2112/07A-0014.1, 2008.
Rahmstorf, S.: Sea-level rise a semi-empirical approach to projecting future, Science, 315,368–370, doi:10.1126/science.1135456, 2007.
Richter, A., Groh, A., and Dietrich, R.: Geodetic observation of sea-level change and20
crustal deformation in the Baltic Sea region, Phys. Chem. Earth, 53–54, 43–53,doi:0.1016/j.pce.2011.04.011, 2012.
Rotnicki, K. and Borowka, R. K.: Impact of a future sea level rise in the Polish Baltic coastalzone, EPA International Sea Level Rise Studies Project Report, Division of Coastal andEnvironmental Studies, Rutgers University Institute of Coastal and Marine Sciences, New25
Brunswick, New Jersey, 27 pp., 1991.Rotnicki, K., Borówka, R. K., and Devine, N.: Accelerated sea level rise as a threat to the Polish
Coastal Zone – quantification of risk, J. Coast. Res., 22, 111–135, 1995.Schwarzer, K., Diesing, M., Larson, M., Niedermeyer, R. O., Schumacher, W., and Fur-
mańczyk, K.: Coastline evolution at different time scales – examples from the Pomeranian30
Bight, southern Baltic Sea, Mar. Geol., 194, 79–101, doi:10.1016/S0025-3227(02)00700-4,2003.
2522

NHESSD3, 2493–2536, 2015
New estimates ofpotential impacts of
sea level rise inPoland
D. Paprotny andP. Terefenko
Title Page
Abstract Introduction
Conclusions References
Tables Figures
J I
J I
Back Close
Full Screen / Esc
Printer-friendly Version
Interactive Discussion
Discussion
Paper
|D
iscussionP
aper|
Discussion
Paper
|D
iscussionP
aper|
Statistisches Bundesamt: Bau- und Immobilienpreise, https://www.destatis.de/DE/ZahlenFakten/GesamtwirtschaftUmwelt/Preise/BauImmobilienpreise/BauImmobilienpreise.html, last access: 21 January 2015.
Stramska, M. and Chudziak, N.: Recent multiyear trends in the Baltic Sea level, Oceanologia,55, 319–337, doi:10.5697/oc.55-2.319, 2013.5
Tomczak, A.: Geological Structure and Holocene Evolution of the Polish Coastal Zone, J. Coast.Res., 22, 16–31, 1995.
Urbański, J.: GIS w badaniach przyrodniczych, University of Gdańsk, Gdańsk, 266 pp., 2012.Webster, T. L.: Flood risk mapping using LiDAR for Annapolis Royal, Nova Scotia, Canada,
Remote Sens., 2, 2060–2082, doi:10.3390/rs2092060, 2010.10
Wiśniewski, B. and Kowalewska-Kalkowska, H.: Water level fluctuations in the Odra Rivermouth area in relation to passages of deep low-pressure systems, Oceanol. Hydrobiol. St.,36, 69–82, doi:10.2478/v10009-007-0009-2, 2007.
Wiśniewski, B. and Wolski, T.: Katalogi wezbrań i obniżeń sztormowych poziomów morza orazekstremalne poziomy wód na polskim wybrzeżu, Maritime University of Szczecin, Szczecin,15
158 pp., 2009.Wiśniewski, B., Wolski, T., and Musielak, S.: A long-term trend and temporal fluctuations of the
sea level at the Polish Baltic coast, Oceanol. Hydrobiol. St., 40, 96–107, doi:10.2478/s13545-011-0020-9, 2011.
Wolski, T., Wiśniewski, B., Giza, A., Kowalewska-Kalkowska, H., Boman, H., Grabbi-Kaiv, S.,20
Hammarklint, T., Holfort, J., and Lydeikaite, Ž.: Extreme sea levels at selected stations onthe Baltic Sea coast, Oceanologia, 56, 259–290, doi:10.5697/oc.56-2.259, 2014.
Wróblewski, A.: Analysis and forecast of long-term sea level changes along the Polish BalticSea coast, Part I, I. Annual mean sea levels – forecast to the year 2100, Ocealonogia, 36,107–120, 1994.25
Xu, S. and Huang, W.: Effects of sea level rise on frequency analysis of 1 % an-nual maximum water levels in the coast of Florida, Ocean Eng., 71, 96–102,doi:10.1016/j.oceaneng.2013.01.013, 2013.
Zeidler, R. B.: Climate change vulnerability and response strategies for the coastal zone ofPoland, Climatic Change, 36, 151–173, doi:10.1023/A:1005394909182, 1997.30
2523

NHESSD3, 2493–2536, 2015
New estimates ofpotential impacts of
sea level rise inPoland
D. Paprotny andP. Terefenko
Title Page
Abstract Introduction
Conclusions References
Tables Figures
J I
J I
Back Close
Full Screen / Esc
Printer-friendly Version
Interactive Discussion
Discussion
Paper
|D
iscussionP
aper|
Discussion
Paper
|D
iscussionP
aper|
Table 1. Vulnerability assumptions for sea level rise and storm floods.
Asset Losses caused by . . .sea level rise coastal flood
Land 100 % nilImmovable fixed assets 100 % relative to water depth and
type of assetMovable fixed assets nil relative to water depth and
type of asset
2524

NHESSD3, 2493–2536, 2015
New estimates ofpotential impacts of
sea level rise inPoland
D. Paprotny andP. Terefenko
Title Page
Abstract Introduction
Conclusions References
Tables Figures
J I
J I
Back Close
Full Screen / Esc
Printer-friendly Version
Interactive Discussion
Discussion
Paper
|D
iscussionP
aper|
Discussion
Paper
|D
iscussionP
aper|
Table 2. Estimated commercial value of land in 2011 ha−1 (PLN 1=EUR 0.24).
Land use Value [PLN ha−1]
Built-up: services 4 294 000Built-up: housing (dense urban) 2 802 000Built-up: housing (scattered urban) 1 896 000Transport areas, non-built-up areas 559 000Built-up: agricultural 453 000Built-up: industrial 444 000Forests 37 976Arable land, orchards 20 004Woodlands and bushes 16 401Meadows and pastures 14 259Wastelands and other lands 12 337
2525

NHESSD3, 2493–2536, 2015
New estimates ofpotential impacts of
sea level rise inPoland
D. Paprotny andP. Terefenko
Title Page
Abstract Introduction
Conclusions References
Tables Figures
J I
J I
Back Close
Full Screen / Esc
Printer-friendly Version
Interactive Discussion
Discussion
Paper
|D
iscussionP
aper|
Discussion
Paper
|D
iscussionP
aper|
Table 3. Value of fixed assets per area in 2011 and damage functions. Note: for housing, Y1 isdamage to immovable assets and Y2 is damage to movable assets.
Type ofbuilding orstructure
Value of fixed assets Damage function
Immovable[PLN m−2]
Movable[PLN m−2]
Y – damage [%], D – water depth [m]
Housing 3858 604 Y1 = D+18.77×√D
Y2 = 4.83×D+20.69×√D
Industry 2057 1712 Y = 27×√D
Services 2678 923 Market services: Y = 27×√D
Non-market services: Y = 30×√D
Agriculture 393 166 Y = 27×√D
Transportinfrastructure
436 – Y = 1003
2526

NHESSD3, 2493–2536, 2015
New estimates ofpotential impacts of
sea level rise inPoland
D. Paprotny andP. Terefenko
Title Page
Abstract Introduction
Conclusions References
Tables Figures
J I
J I
Back Close
Full Screen / Esc
Printer-friendly Version
Interactive Discussion
Discussion
Paper
|D
iscussionP
aper|
Discussion
Paper
|D
iscussionP
aper|
Table 4. Impacts of sea level rise in Poland: comparison of results from this analysis with VA’92 study as reported by Zeidler (1997) and a study by Rotnicki et al. (1995).
Category Water level (m) This study Zeidler (1997) Rotnickiet al. (1995)
Flooded area (km2) 0.30 155.2 845.1 –1.00 885.0 1727.7 –2.50 2278.4 2203.3 2696.7
Persons affected 0.30 1777 40 860 –1.00 19 966 146 040 –2.50 167 503 234 840 297 135
Value of assets at risk 0.30 1.1 47.8 –(bln PLN at 2011 prices) 1.00 9.6 223.2 –
2.50 80.9 366.7 –
Value of assets at risk 0.30 0.1 % 7.5 % –(% GDP) 1.00 0.6 % 35.0 % –
2.50 5.2 % 57.5 % –
Railway lines (without 0.30 3 35 –sidings) affected (km) 1.00 34 145 –
2.50 171 184 347
2527

NHESSD3, 2493–2536, 2015
New estimates ofpotential impacts of
sea level rise inPoland
D. Paprotny andP. Terefenko
Title Page
Abstract Introduction
Conclusions References
Tables Figures
J I
J I
Back Close
Full Screen / Esc
Printer-friendly Version
Interactive Discussion
Discussion
Paper
|D
iscussionP
aper|
Discussion
Paper
|D
iscussionP
aper|
Table 5. Impacts of coastal floods in selected major coastal cities. Water level in the table is anapproximation of KZGW’s 100 or 500 year flood scenarios.
City Populationin 2011 (’000 s)
Water level (m) Population at risk (’000 s)
This study KZGW maps
Szczecin 410.1 1.85 2.5 1.81.60 1.6 1.3
Police 34.0 1.75 0.2 0.1Świnoujście 41.5 2.60 15.4 14.1
2.30 11.2 9.6Kołobrzeg 47.1 2.00 0.7 0.3Ustka 16.4 2.60 1.2 0.8Gdynia 249.1 2.35 0.2 < 0.1Sopot 38.7 2.50 1.3 0.2Gdańsk 460.3 2.50 38.4 34.7
2.10 22.3 20.0Elbląg 124.7 1.40 2.0 0.7
2528

NHESSD3, 2493–2536, 2015
New estimates ofpotential impacts of
sea level rise inPoland
D. Paprotny andP. Terefenko
Title Page
Abstract Introduction
Conclusions References
Tables Figures
J I
J I
Back Close
Full Screen / Esc
Printer-friendly Version
Interactive Discussion
Discussion
Paper
|D
iscussionP
aper|
Discussion
Paper
|D
iscussionP
aper|
Figure 1. The study area (all municipalities with some land laying below 5 ma.s.l.) and thePolish coastal zone. The inner map presents elevation values.
2529
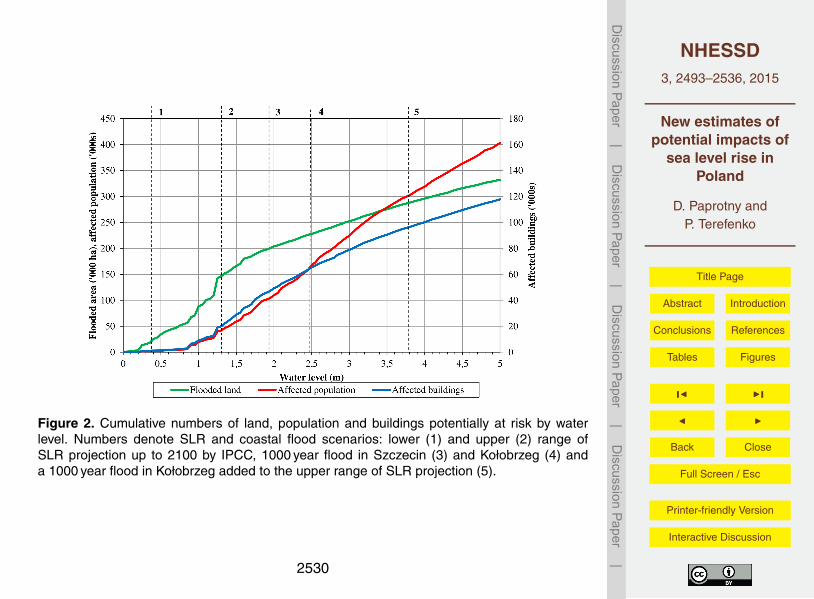
NHESSD3, 2493–2536, 2015
New estimates ofpotential impacts of
sea level rise inPoland
D. Paprotny andP. Terefenko
Title Page
Abstract Introduction
Conclusions References
Tables Figures
J I
J I
Back Close
Full Screen / Esc
Printer-friendly Version
Interactive Discussion
Discussion
Paper
|D
iscussionP
aper|
Discussion
Paper
|D
iscussionP
aper|
Figure 2. Cumulative numbers of land, population and buildings potentially at risk by waterlevel. Numbers denote SLR and coastal flood scenarios: lower (1) and upper (2) range ofSLR projection up to 2100 by IPCC, 1000 year flood in Szczecin (3) and Kołobrzeg (4) anda 1000 year flood in Kołobrzeg added to the upper range of SLR projection (5).
2530

NHESSD3, 2493–2536, 2015
New estimates ofpotential impacts of
sea level rise inPoland
D. Paprotny andP. Terefenko
Title Page
Abstract Introduction
Conclusions References
Tables Figures
J I
J I
Back Close
Full Screen / Esc
Printer-friendly Version
Interactive Discussion
Discussion
Paper
|D
iscussionP
aper|
Discussion
Paper
|D
iscussionP
aper|
Figure 3. Increments of land, population and buildings potentially at risk by 10 cm intervalsending with the water level given.
2531

NHESSD3, 2493–2536, 2015
New estimates ofpotential impacts of
sea level rise inPoland
D. Paprotny andP. Terefenko
Title Page
Abstract Introduction
Conclusions References
Tables Figures
J I
J I
Back Close
Full Screen / Esc
Printer-friendly Version
Interactive Discussion
Discussion
Paper
|D
iscussionP
aper|
Discussion
Paper
|D
iscussionP
aper|
Figure 4. Percentage of area potentially at risk by water level and town/municipality.
2532

NHESSD3, 2493–2536, 2015
New estimates ofpotential impacts of
sea level rise inPoland
D. Paprotny andP. Terefenko
Title Page
Abstract Introduction
Conclusions References
Tables Figures
J I
J I
Back Close
Full Screen / Esc
Printer-friendly Version
Interactive Discussion
Discussion
Paper
|D
iscussionP
aper|
Discussion
Paper
|D
iscussionP
aper|
Figure 5. Percentage of population potentially at risk by water level and town/municipality.
2533

NHESSD3, 2493–2536, 2015
New estimates ofpotential impacts of
sea level rise inPoland
D. Paprotny andP. Terefenko
Title Page
Abstract Introduction
Conclusions References
Tables Figures
J I
J I
Back Close
Full Screen / Esc
Printer-friendly Version
Interactive Discussion
Discussion
Paper
|D
iscussionP
aper|
Discussion
Paper
|D
iscussionP
aper|
Figure 6. Flooded area by major groups of land use classes.
2534
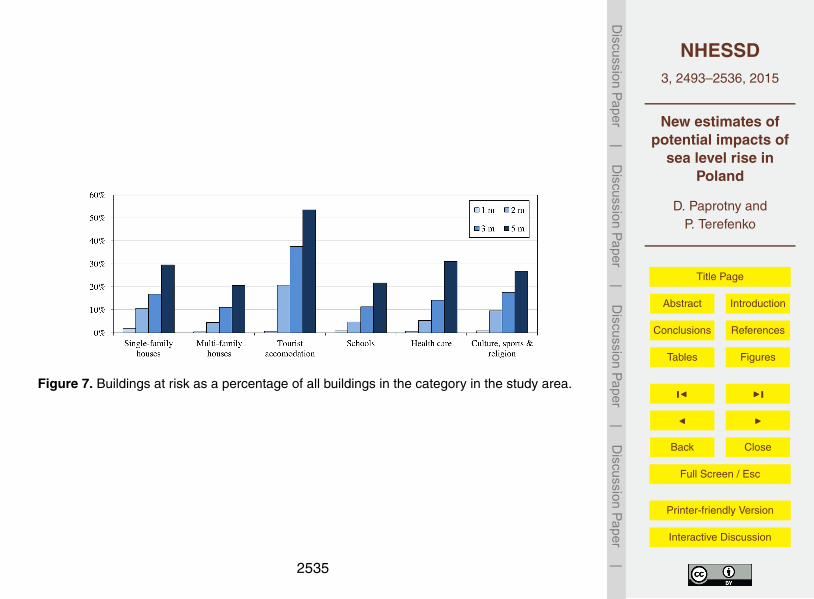
NHESSD3, 2493–2536, 2015
New estimates ofpotential impacts of
sea level rise inPoland
D. Paprotny andP. Terefenko
Title Page
Abstract Introduction
Conclusions References
Tables Figures
J I
J I
Back Close
Full Screen / Esc
Printer-friendly Version
Interactive Discussion
Discussion
Paper
|D
iscussionP
aper|
Discussion
Paper
|D
iscussionP
aper|
Figure 7. Buildings at risk as a percentage of all buildings in the category in the study area.
2535

NHESSD3, 2493–2536, 2015
New estimates ofpotential impacts of
sea level rise inPoland
D. Paprotny andP. Terefenko
Title Page
Abstract Introduction
Conclusions References
Tables Figures
J I
J I
Back Close
Full Screen / Esc
Printer-friendly Version
Interactive Discussion
Discussion
Paper
|D
iscussionP
aper|
Discussion
Paper
|D
iscussionP
aper|
Figure 8. Potential losses due to sea level rise: cumulative total values (a) and structural break-down by activity (c). Potential losses due to coastal floods: cumulative total values (b) andstructural breakdown by activity (d).
2536