new evaluation method of the ability of forming fracture ... · index terms—acoustic emission,...
TRANSCRIPT
Abstract—Property of generating fracture network is the
major factor that influences economical and effective
exploitation of tight sandstone reservoir. Besides horizontal
stress contrast, rock brittleness and natural fracture property
are significant factors that affect fracture network extension. By
using a new evaluation method of creating fracture network, the
complexity of fracture network for tight sandstone cores and
shale gas cores were compared after fracturing experiments.
This method uses Soundless Cracking Agent (SCA) which could
apply continuous expansion force to create fracture network in
cores. It also combines with acoustic emission instrument to
monitor the fracture propagation pattern. The experimental
result shows that one simple planar fracture pattern was likely
to be formed in tight sandstone cores, while one complex
fracture without dominant fracture was more likely to be
created in shale cores. Rock brittleness is not the significant
factor that influences fracture network creation for tight
sandstone reservoir. This method is a easy and reliable way to
evaluate ability of forming fracture network in tight sandstone
reservoir after hydraulic fracturing. It also shows the difference
of fracture network generation mechanism between shale gas
reservoir and tight sandstone reservoir.
Index Terms—Acoustic emission, brittleness, fracture
network evaluation, tight sand reservoir.
I. INTRODUCTION
At present, tight oil is another hot spot in exploration and
exploitation of unconventional reservoirs after shale gas. The
United States attaches great importance to the exploration and
development of tight oil reservoir, and try to copy the shale
gas development mode. The development of tight oil in China
starts late and the concept of tight oil has been widely
accepted and used in recent years. According to the latest
resource evaluation, reserve of tight oil resources is about12
billion tons in China.
“Volume fracturing” [1] is copied from shale gas
development pattern and is the primary exploitation
technology in tight oil reservoir to realize the commercial
development currently. The main mechanism is to open
natural fractures and expand them until shear sliding is
occurred in the process of hydraulic fracturing. So it becomes
important to understand the mechanism of fracture extension
in tight sandstone. A large number of researchers study the
interaction of hydro-fractures and natural fractures through
indoor fracturing simulation experiments to analyze the form
and complexity of the fracture network [2]-[10]. However, the
traditional indoor fracture network evaluation experiment
requires large size rock cube for the triaxial test system. Not
only the experiment is complex, but also the rock cube must
be big size (more than 30cm3) outcrop, which is cumbersome
and hard to get. This new experimental method just uses10cm
diameter core of target reservoir and takes no account of
horizontal stress contrast. Soundless cracking agent is used to
simulate hydraulic fracturing process. Acoustic emission
technology is also combined to monitor crack propagation
and evaluate the network forming ability.
II. PHYSICAL AND MECHANICAL CHARACTERISTICS OF ROCK
A. Brittleness Index
There are three primary methods to evaluate rock
brittleness index. First is mineralogical method [11]. The
formula is brittleness index (%) = quartz content/ (quartz +
carbonatite + clay mineral) content; Second method [12]
relates with rock Young’s modulus and Poison’s ratio (1).
When BRIT (brittleness) >40, rock is brittle. When BRIT>60,
rock is strong brittle; the third method [13] uses uniaxial
compressive strength and uniaxial extension strength (2) to
calculate rock brittleness index. Table I represents the level of
rock brittleness.
YM_BRIT=((YMS_C-1)/(8-1))×100
PR_BIRT=((PR_C-0.4)/(0.15-0.4)) ×100 (1)
BRIT=(YM_BRIT+PR_BRIT)/2
BI=σc/σt (2)
Table II shows the average content of quartz and feldspar in
tight sandstone cores are 49% and 18% more than shale cores
which are 40% and 5.6%. However, the clay mineral content
of shale is 41.3% which is much more than tight sandstone’s
16.5%. The content of quartz and clay mineral will affect
brittleness index.
TABLE I: HIERARCHICAL CLASSIFICATION OF ROCK BRITTLENESS
Level BI Characteristic
1 >25 High Brittle
2 15<BI<25 Brittle
3 10<BI<15 Mediocre Brittle
4 BI<10 Low Brittle
New Evaluation Method of the Ability of Forming
Fracture Network in Tight Sandstone Reservoir
Xin Lei, Shicheng Zhang, Tiankui Guo, and Bo Xiao
International Journal of Environmental Science and Development, Vol. 6, No. 9, September 2015
688DOI: 10.7763/IJESD.2015.V6.681
Manuscript received November 5, 2014; revised December 25, 2014.
Xin Lei, Shicheng Zhang, Bo Xiao are with the College of Petroleum
Engineering, China University of Petroleum, Beijing 102249, China (e-mail:
[email protected], [email protected], [email protected]).
Tiankui Guo is with the College of Petroleum Engineering, China
University of Petroleum, Huadong 266580, China (e-mail:
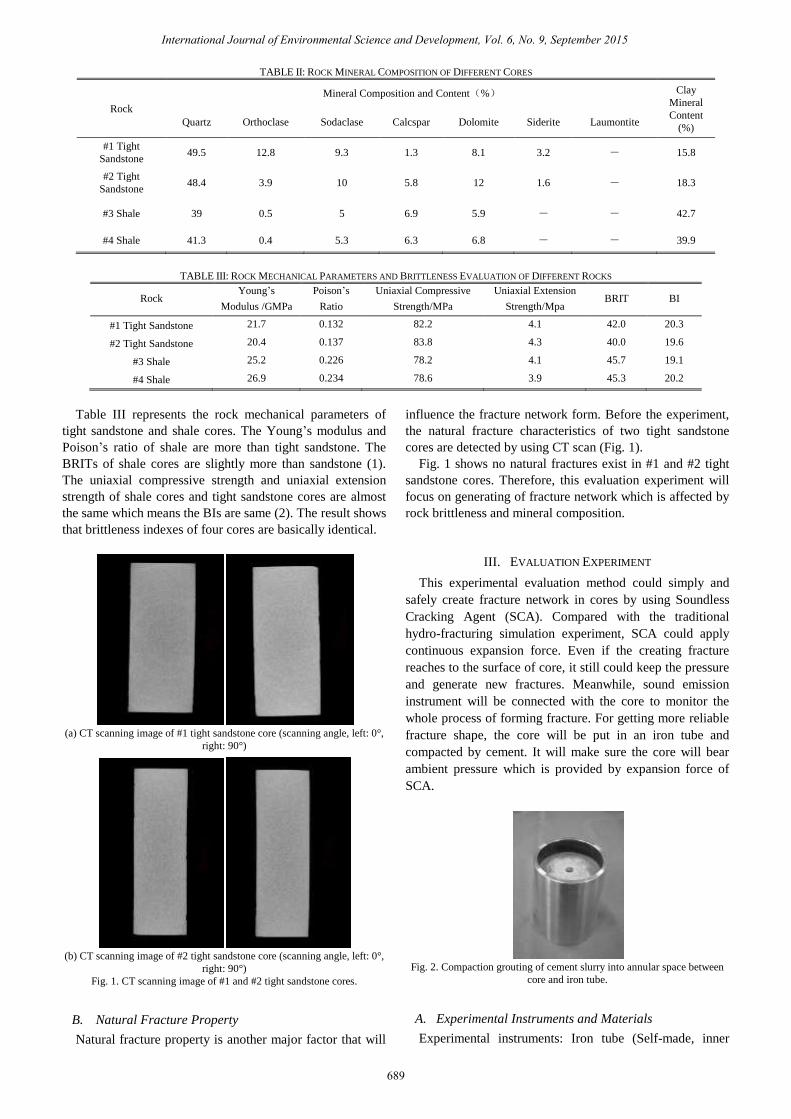
TABLE II: ROCK MINERAL COMPOSITION OF DIFFERENT CORES
Rock
Mineral Composition and Content(%) Clay
Mineral
Content
(%) Quartz Orthoclase Sodaclase Calcspar Dolomite Siderite Laumontite
#1 Tight
Sandstone 49.5 12.8 9.3 1.3 8.1 3.2 - 15.8
#2 Tight
Sandstone 48.4 3.9 10 5.8 12 1.6 - 18.3
#3 Shale 39 0.5 5 6.9 5.9 - - 42.7
#4 Shale 41.3 0.4 5.3 6.3 6.8 - - 39.9
TABLE III: ROCK MECHANICAL PARAMETERS AND BRITTLENESS EVALUATION OF DIFFERENT ROCKS
Rock Young’s
Modulus /GMPa
Poison’s
Ratio
Uniaxial Compressive
Strength/MPa
Uniaxial Extension
Strength/Mpa BRIT BI
#1 Tight Sandstone 21.7 0.132 82.2 4.1 42.0 20.3
#2 Tight Sandstone 20.4 0.137 83.8 4.3 40.0 19.6
#3 Shale 25.2 0.226 78.2 4.1 45.7 19.1
#4 Shale 26.9 0.234 78.6 3.9 45.3 20.2
Table III represents the rock mechanical parameters of
tight sandstone and shale cores. The Young’s modulus and
Poison’s ratio of shale are more than tight sandstone. The
BRITs of shale cores are slightly more than sandstone (1).
The uniaxial compressive strength and uniaxial extension
strength of shale cores and tight sandstone cores are almost
the same which means the BIs are same (2). The result shows
that brittleness indexes of four cores are basically identical.
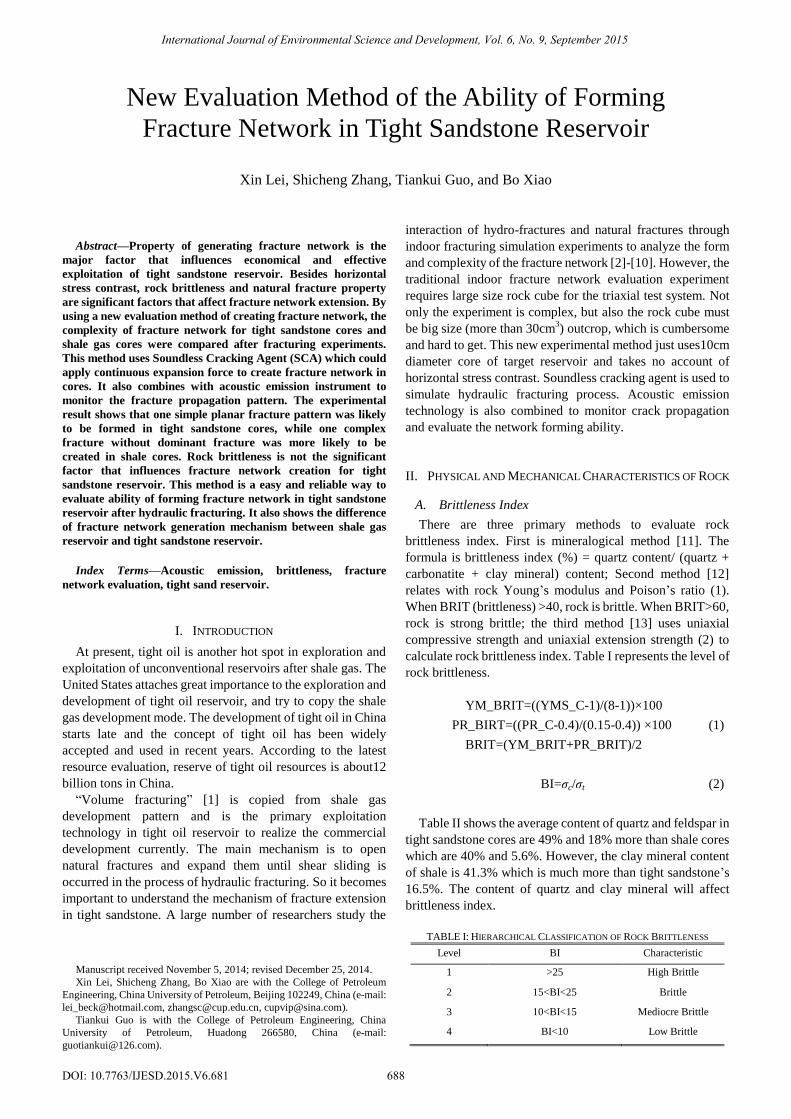
(a) CT scanning image of #1 tight sandstone core (scanning angle, left: 0°,
right: 90°)
(b) CT scanning image of #2 tight sandstone core (scanning angle, left: 0°,
right: 90°)
Fig. 1. CT scanning image of #1 and #2 tight sandstone cores.
B. Natural Fracture Property
Natural fracture property is another major factor that will
influence the fracture network form. Before the experiment,
the natural fracture characteristics of two tight sandstone
cores are detected by using CT scan (Fig. 1).
Fig. 1 shows no natural fractures exist in #1 and #2 tight
sandstone cores. Therefore, this evaluation experiment will
focus on generating of fracture network which is affected by
rock brittleness and mineral composition.
III. EVALUATION EXPERIMENT
This experimental evaluation method could simply and
safely create fracture network in cores by using Soundless
Cracking Agent (SCA). Compared with the traditional
hydro-fracturing simulation experiment, SCA could apply
continuous expansion force. Even if the creating fracture
reaches to the surface of core, it still could keep the pressure
and generate new fractures. Meanwhile, sound emission
instrument will be connected with the core to monitor the
whole process of forming fracture. For getting more reliable
fracture shape, the core will be put in an iron tube and
compacted by cement. It will make sure the core will bear
ambient pressure which is provided by expansion force of
SCA.
Fig. 2. Compaction grouting of cement slurry into annular space between
core and iron tube.
A. Experimental Instruments and Materials
Experimental instruments: Iron tube (Self-made, inner
International Journal of Environmental Science and Development, Vol. 6, No. 9, September 2015
689
International Journal of Environmental Science and Development, Vol. 6, No. 9, September 2015
690
diameter is 124.3mm, external diameter is 138.5mm, height is
200mm); PCI-II model acoustic emission system (made by
Physical Acoustics Corp).
Experimental materials: Soundless Cracking Agent (SCA),
cement, shale and tight sandstone cores (column diameter is
100mm, height is 100mm), butter.
B. Experimental Procedure
1) In order to take out the core easily after the experiment,
butter should be spread equably on surface of cores and
internal surface of iron tube;
2) Fill the annular space between core and iron tube with
cement slurry. Make sure proportion of water and cement
is the same in all experiments;
3) Wait until the cement solidifies, then drill a hole which
diameter is 15mm in the center of core (Fig. 2). The hole
should be drill through the core for observing the fracture
form conveniently;
4) Put 12 acoustic emission reception probes around the
iron tube in form of 3 lines and 6 columns. This
arrangement form is good for accurate positioning of
acoustic emission system (Fig. 3);
5) Pour water into SCA, stir equably and fill into the hole.
Run the acoustic emission system to monitor the process
of fracture crack;
6) After the experiment, analyze the result and take out the
core to observe the form of fracture.
Fig. 3. Acoustic emission system and arrangement of probes position.
C. Experimental Results and Analysis
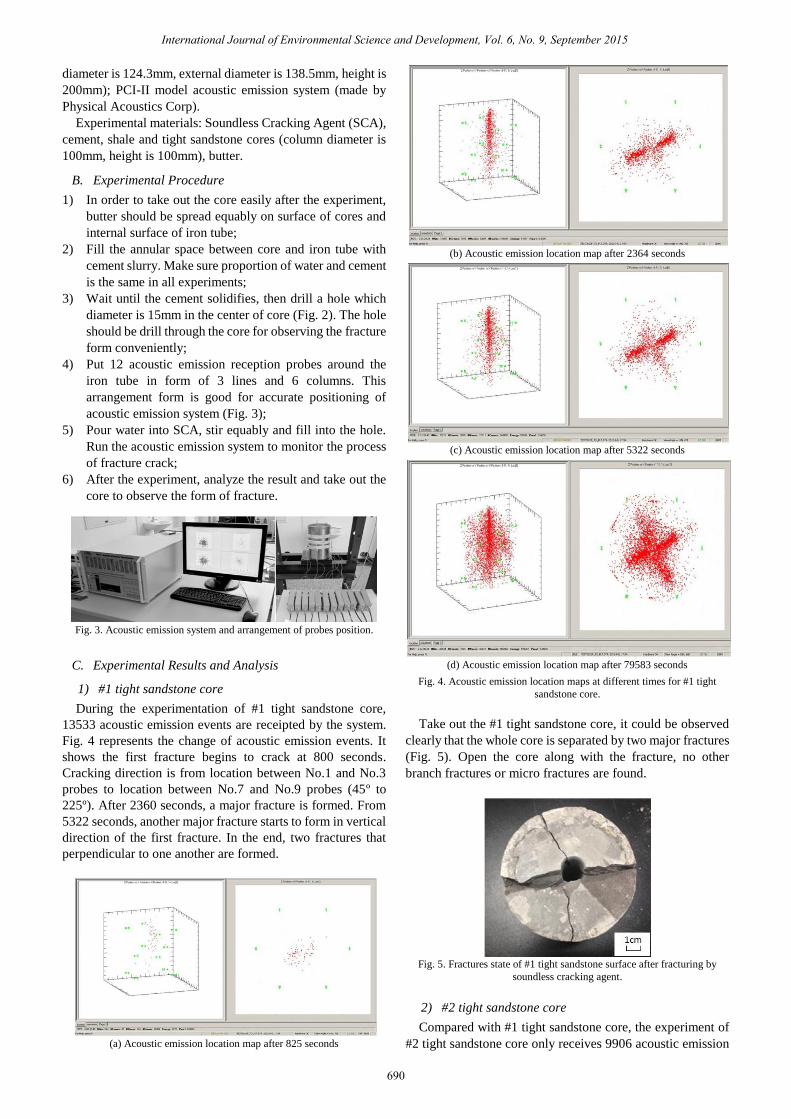
1) #1 tight sandstone core
During the experimentation of #1 tight sandstone core,
13533 acoustic emission events are receipted by the system.
Fig. 4 represents the change of acoustic emission events. It
shows the first fracture begins to crack at 800 seconds.
Cracking direction is from location between No.1 and No.3
probes to location between No.7 and No.9 probes (45º to
225º). After 2360 seconds, a major fracture is formed. From
5322 seconds, another major fracture starts to form in vertical
direction of the first fracture. In the end, two fractures that
perpendicular to one another are formed.
(a) Acoustic emission location map after 825 seconds
(b) Acoustic emission location map after 2364 seconds
(c) Acoustic emission location map after 5322 seconds
(d) Acoustic emission location map after 79583 seconds
Fig. 4. Acoustic emission location maps at different times for #1 tight
sandstone core.
Take out the #1 tight sandstone core, it could be observed
clearly that the whole core is separated by two major fractures
(Fig. 5). Open the core along with the fracture, no other
branch fractures or micro fractures are found.
Fig. 5. Fractures state of #1 tight sandstone surface after fracturing by
soundless cracking agent.
2) #2 tight sandstone core
Compared with #1 tight sandstone core, the experiment of
#2 tight sandstone core only receives 9906 acoustic emission
International Journal of Environmental Science and Development, Vol. 6, No. 9, September 2015
691
events. Fig. 6 shows this core forms two major factures as
same as #1 core. Direction of a fracture is from 30 degree to
210 degree. Another is from 150 degree to 330 degree. Fig. 7
represents the acoustic emission events location of fractures is
similar with actual fractures form.
Fig. 6. Final acoustic emission location map for #2 tight sandstone core.
Fig. 7. Fractures state of #2 tight sandstone surface after fracturing by
soundless cracking agent.
3) #3 and #4 shale cores
Fig. 8. Final acoustic emission location map for the #3 shale core.
Fig. 9. Final acoustic emission location map for the #4 shale core.
The acoustic emission event of #3 and #4 shale cores are
1090 and 3567. Fig. 8 and Fig. 9 final acoustic emission
location maps show that events present random distribution
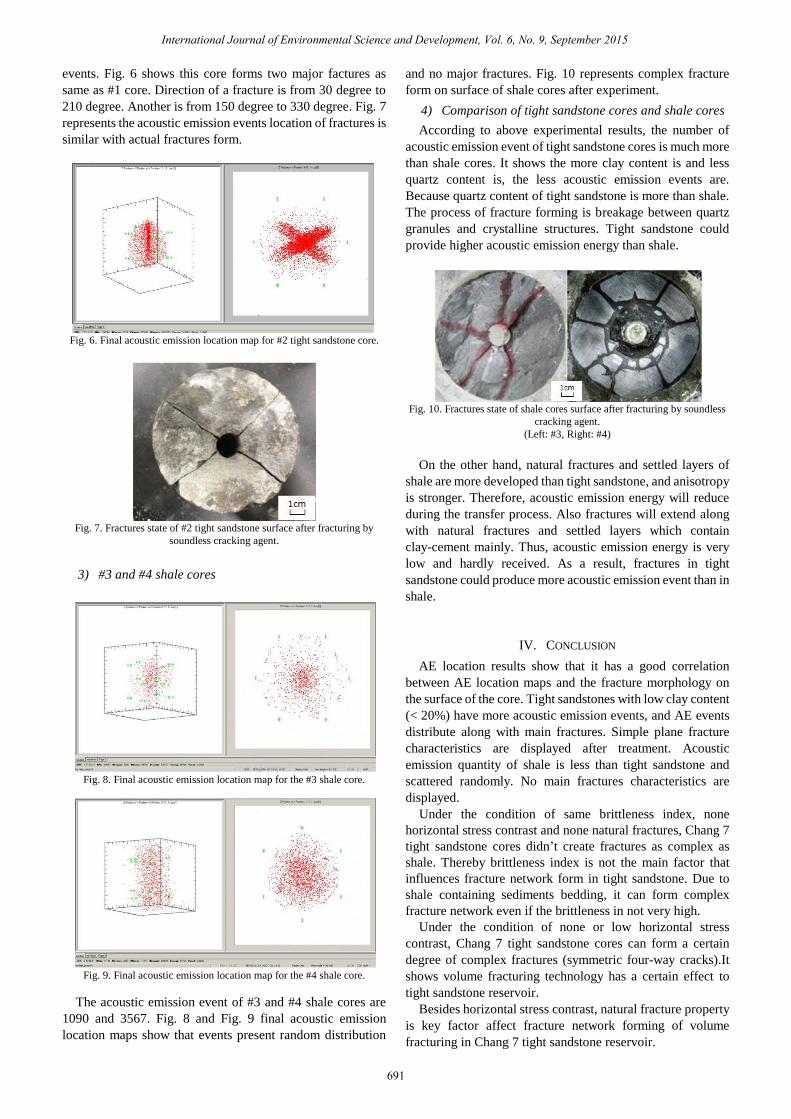
and no major fractures. Fig. 10 represents complex fracture
form on surface of shale cores after experiment.
4) Comparison of tight sandstone cores and shale cores
According to above experimental results, the number of
acoustic emission event of tight sandstone cores is much more
than shale cores. It shows the more clay content is and less
quartz content is, the less acoustic emission events are.
Because quartz content of tight sandstone is more than shale.
The process of fracture forming is breakage between quartz
granules and crystalline structures. Tight sandstone could
provide higher acoustic emission energy than shale.
Fig. 10. Fractures state of shale cores surface after fracturing by soundless
cracking agent.
(Left: #3, Right: #4)
On the other hand, natural fractures and settled layers of
shale are more developed than tight sandstone, and anisotropy
is stronger. Therefore, acoustic emission energy will reduce
during the transfer process. Also fractures will extend along
with natural fractures and settled layers which contain
clay-cement mainly. Thus, acoustic emission energy is very
low and hardly received. As a result, fractures in tight
sandstone could produce more acoustic emission event than in
shale.
IV. CONCLUSION
AE location results show that it has a good correlation
between AE location maps and the fracture morphology on
the surface of the core. Tight sandstones with low clay content
(< 20%) have more acoustic emission events, and AE events
distribute along with main fractures. Simple plane fracture
characteristics are displayed after treatment. Acoustic
emission quantity of shale is less than tight sandstone and
scattered randomly. No main fractures characteristics are
displayed.
Under the condition of same brittleness index, none
horizontal stress contrast and none natural fractures, Chang 7
tight sandstone cores didn’t create fractures as complex as
shale. Thereby brittleness index is not the main factor that
influences fracture network form in tight sandstone. Due to
shale containing sediments bedding, it can form complex
fracture network even if the brittleness in not very high.
Under the condition of none or low horizontal stress
contrast, Chang 7 tight sandstone cores can form a certain
degree of complex fractures (symmetric four-way cracks).It
shows volume fracturing technology has a certain effect to
tight sandstone reservoir.
Besides horizontal stress contrast, natural fracture property
is key factor affect fracture network forming of volume
fracturing in Chang 7 tight sandstone reservoir.
International Journal of Environmental Science and Development, Vol. 6, No. 9, September 2015
692
NOMENCLATURE
YMS_C = static Young's modulus, 104MPa
PR_C = static Poison’s ratio
σc = uniaxial compressive strength, MPa
σt = uniaxial extension strength, MPa
REFERENCES
[1] C. L. Cipolla, N. R. Warpinski, and M. J. Mayerhofer, “The
relationship between fracture complexity, reservoir properities, and
fracture-treatment design,” in Proc. SPE Annual Technical
Conference and Exhibition, Colorado, USA: Society of Petroleum
Engineers, 2008, pp. 21-24.
[2] N. R. Warpinski and L. W. Teufel, “Influence of geologic
discontinuities on hydraulic fracture propagation,” J Petrol Technol,
pp. 209-210, 1987.
[3] L. W. Teufel and J. C. Clark, “Hydraulic fracture propagation in
layered rocks: experimental studies of fracture containment,” Society
of Petroleum Engineers Journal, pp. 19-34, 1984.
[4] M. Thiercelin, C. Roegiers, and T. J. Boone, “An investigation of the
material parameters that govern the behavior of fracture approaching
rock interfaces,” Congress on Rock Mechanics, pp. 236-269, 1987.
[5] T. L. Blanton, “An experimental study of interaction between
hydraulically induced and pre-existing fracturing,” in Proc. SPE
10847, 1982.
[6] T. L. Blanton, “Propagation of hydraulically and dynamically induced
fractures in naturally fractured reservoirs,” presented at the
Unconveptional Gas Technology Symposium of the Society of
Petroleum Engineers, Louisville, KY, May 18-21, 1986.
[7] L. J. L. Beugelsdijk. “Experimental hydraulic fracture propagation in a
multi fractured medium,” in Proc. SPE 59419, 2000.
[8] C. J. de Pater and L. J. L. Beugelsdijk, “Experiments and numerical
simulation of hydraulic fracturing in naturally fractured rock,”
presented at 40th US Symposium on Rock Mechanics, Anchorage,
Alaska, June 25-29, 2005.
[9] L. Casas, J. L. Miskimins, and A. Black. “Laboratory hydraulic
fracturing test on a rock with artificial discontinuities,” presented at the
SPE Annual Technical Conference and Exhibition, San Antonio,
Texas, U.S.A., 24-27 September, 2006.
[10] R. Suarez and C. Bryon, “Hydraulic fracturing experiments help
understanding fracture branching on tight gas shales,”
ARMA/USRM06-1130, 2006.
[11] C. H. Sondergeld, K. E. Newsham, and J. T. Comisky, “Petro-physical
considerations in evaluating and producing shale gas resources,” in
Proc. SPE Hydraulic Fracturing Technology Conference, Texas, USA:
Society of Petroleum Engineers, 2010, pp. 29-31.
[12] R. Rickman, M. Mullen, and E. Petre, “A practical use of shale
petro-physics for stimulation design optimization: All shale plays are
not clones of the Barnettshale,” in Proc. SPE Annual Technical
Conference and Exhibition, Colorado, USA: Society of Petroleum
Engineers, 2008, pp. 21-24.
[13] R. M. Goktan and N. G. Yilmaz, “A new methodology for the analysis
of the relationship between rock brittleness index and drag pick
cutting,” The Journal of the South African Institute of Mining and
Metallurgy, pp. 727-733, 2005.
Xin Lei was born on July 8, 1984, in Gansu, China. He
is a PhD student at China University of Petroleum,
Beijing currently. He focuses on fracture propagation
mechanism and fracture-oriented technology of
hydraulic fracturing by radial horizontal wells, and
mechanism research on hydraulic fracturing by
stimulated reservoir volume for tight sandstone
reservoir.