new findings on actual and potential trade between romania and the
TRANSCRIPT
Romanian Journal of Economic Forecasting – 4/2010102
NEW FINDINGS ON ACTUAL AND POTENTIAL TRADE BETWEEN ROMANIAAND THE RUSSIAN FEDERATION: AGRAVITY APPROACH
Virgil D SC LESCU1
Elena NICOLAE2
Irina ION (ZGREAB N)3
Abstract
The paper attempts to verify the hypothesis that Romanian exports to the Russian Federation are below their potential.We first looked at statistical data regarding bilateral trade, custom duties and foreign direct investment; the resulting conclusions support our hypothesis.Further, we use a gravity equation, in order to forecast Romanian exports to a number of 43 countries, accounting for a sizeable share of total exports, covering a world-wide area using data series over a period of time between 1993 and 2008. Based on the gravity equation, we calculated export potential of Romania to the Russian Federation, being interested in the long run trade dynamics potential. We made the comparison between potential and real trade for the year 2008, being in fact interested in what export would have been in 2008 if during all the period studied (1993-2007) trade would have followed the gravity patterns.We conclude that if the Romanian exports to the Russian Federation would have perfectly fitted the general “gravity pattern”, the level of exports to the country would stand at 2,317 current billion dollars, which is 2.58 times higher than the registered level. From an economic point of view, these results can be interpreted, in the context of our broader analysis, as a good indicator that the opportunities in the Russian Federation market are still undervaluated by Romanian exporters and the rest of stakeholders in the exportation process.
Keywords: Romanian exports, potential exports, the Russian Federation, gravity model, trade development
JEL Classification: F10, F17, F11
1 National Bank of Romania, Bucharest, Romania, [email protected]. 2 Bucharest University of Economics Romania, [email protected]. 3 Bucharest University of Economics, Romania, [email protected].
8.
New Findings on Actual and Potential Trade
Romanian Journal of Economic Forecasting – 4/2010 103
Introduction
Starting in 1991, in the context of democratization of its politics and economics, the Russian Federation opened to liberalization and to market economy. Due to its huge surface and diversity of natural resources, the Russian Federation presents an important potential for development and prosperity. It may be a tremendous economic partner for many countries, especially for the European ones, including Romania, due to common history and geographical proximity.
In the case of Romania, one might say that its destiny was influenced by the vicinity to the Russian Federation, which gives the impression of suffering from a unilateral psychological dependence toward this country, in the struggle to define its own identity. Probably this is not surprising, because the Russian Federation earned throughout the history the status of “global power” to the extent that is capable to play a decisive role at several levels, the Russian Federation being regarded even as a hegemonic power before the destruction of the Union of Soviet Socialist Republics (USSR) (Bal, 2009).
From a historical point of view, Romanian – Russian relations developed generally under the aura of military, political, economic and ideological domination, especially after Basarabia was handed over to the Russian Federation, following the Treaty of Bucharest in 1812 and the military invasion in 1940.
In the ‘90s, the various attempts to consistently develop trade relations failed. This was caused by factors that this article is not intended to shed light upon, as they correspond mainly to excessive politisation of the economy, on one hand, and the reduction of political relations as proof of loyalty and adhesion to Western values, on the other hand. After the fall of the bipolar global order, Romania changed its strategic alliances by opting for the Euro-Atlantic side, but unfortunately it stopped or did not manage to establish a tactical compensation and safe partnership on its Eastern borders (Hâr an, 2007). This turned out to be an important mistake of economic strategy.
Currently, it is also worth to notice that generally the focus in politics was not on those positive and advantageous sides of the economic cooperation, but rather on the negative ones.
These developments lead to a Romanian attitude of contestation and distance toward Russian aggressiveness and expansionism. Nevertheless, it is the Russian attitude that is not to be ignored, and that is generally manifested by the specific unpleasant rhetoric of the dominator.
This type of development is standing under what is commonly denominating “the adversity principle”, defined as an organization principle of our societies that has been disseminated for the actual development and growth processes. “The adversity principle implies the fact that one party is always controlling the other one. In fact, the whole history could be explained as a phenomenology of the adversity principle (from the survival struggle to domination, from the life of tribes to the democracy of Pericles’ Athens, from the Roman Empire to the American hegemony, but also discrimination, religious and cold wars, terrorism, groups of organized crime, etc.). The order
Institute of Economic Forecasting
Romanian Journal of Economic Forecasting – 4/2010104
resulting from the adversity principle brought polarization (economic, ideological), closed political systems (states with geographical, economic, ideological and racial bounds) or cooperation jeopardized by national suzerainty (by divergent national interests of states)” (Dinu, 2006). The two countries were on positions of inequality from the point of view of economic and military resources; in this context one of the parties decided to use domination in its favor. The history is generous in providing examples of the Russian Federation’s attempts of occupying Romanian territories. The most recent ones belong to the period 1945 - 1964, in which Romania, considered a defeated country, was run over by the “liberalizing” soviet troops. After their withdrawal between 1958-1960, slight efforts of establishing Romania’s own point of view were undertaken, but the belonging of our country to the Russian Federation‘s sphere of influence was never seriously questioned.
One peculiar aspect of governing using the adversity principle in our bilateral relations is the persistence over time and consistency of adversity.
We believe that the high tide of such characteristic led to the minimization of the economic and trade relations with the Russian Federation despite the fact that the rush for capital and profits is considered essentially free from non-economic limitations. The fact that currently we experience the need to talk about the political determination necessary for the consolidation of trade, but also actual cultural communication and inter-exchange with our neighbors is probably a political response to this problem. The actual intellectual and political campaigns favoring strengthening of economic cooperation between Romanian and the Russian Federation are to our opinion a sign of sound approach to a “growing up”, as Romania is the most interested player in a positive development. Moreover, the historical economic linkages between our countries as well as a set of common cultural values are a strong argument for adopting a new approach to our relations with the Russian Federation.
In order to test our basic hypothesis, that trade with the Russian Federation is below potential, we proceed a) to an analysis of trade relations referring to volumes of trade, bilateral investments and trade barriers and b) to an econometric estimation of the trade potential, using the gravity model.
The gravity approach is a synthesized version of the new trade theory. It is based on the assumption that the amount of bilateral trade between two countries is determined by export-supply factors in one country and import-demand factors in another. It is inspired by the Newton’s proposed “Law of Universal Gravitation”, which held that the attractive force between two objects i and j is given by their masses, the distance between the two objects and a gravitational constant. Based on this, the gravity model describes trade flows (imports, exports or total trade) from a particular country i to another country j. The gravity model considers three fundamental determinants of trade: (1) export supply, captured by income and/or income per capita of the importing country; (2) import demand, captured by income and/or income per capita of the importing country; (3) transaction costs, captured by geographical distance and variables representing policy and other barriers to trade.
We use a gravity equation model that provides a cross-section approach to forecast Romanian exports to a number of 43 countries, accounting for a sizeable share of total exports, covering a world-wide area and using data series over a period of time

New Findings on Actual and Potential Trade
Romanian Journal of Economic Forecasting – 4/2010 105
between 1993 and 2008. We concentrate mostly on the forecasted dynamics of the trade and indeed we find out that if real exports would have followed the patterns specified by the model between 1993 and 2007, in 2008, exports to the Russian Federation stood at 2,317 current billion dollars, 258% higher than the registered real level.
Current bilateral trade between Romania and the Russian Federation
In 2008, the share of Romanian exports to the Russian Federation, expressed as a percentage of the total Romanian exports was only 1.9%, which makes the Russian Federation the thirteenth export destination. In other words, few Romanian products have reached the the Russian Federation consumers, as compared to those that reached other European markets. In the same year, the share of imports originating in the Russian Federation in the aggregate Romanian imports was 6.2%, as it can be observed in the graphic below:
Graphic 1
Bilateral Trade Flows between Romania and the Russian Federation, 1999 – 2008
- million Euros, Exports FOB, Imports CIF -
Source: Authors’ computation, based on National Institute of Statistics data.
As shown above, the deficit in bilateral trade with the Russian Federation is large, registering a significant gap especially since 2005 (from 1694 million to 2503 million). Much of this deficit is explained by massive imports of energy resources that amount to approximately 90% of the total value of products imported from the Russian Federation to Romania (at the end of last year, crude oil and oil products accounted for 48.1% of the Russian Federation total imports of energy and natural gas - 39.1%). The economic interpretation of this data is analogous to the one of Romanian exports in the Russian Federation: except for energy resources, few Russian products reached the Romanian market in 2008. It does not mean that importing natural resources is lacking significance; on the contrary, it underlines an important economic dependence of Romania on the Russian Federation markets.
Regarding the EU, the Russian Federation is one of its key trading partners. Trade between the two economies has seen high growth rates over the last years. The EU is

Institute of Economic Forecasting
Romanian Journal of Economic Forecasting – 4/2010106
the Russian Federation's main trading partner, accounting for 52.3 % of its overall trade turnover in 2008 and the most important investor in the Russian Federation. Ongoing WTO accession negotiations and those on a new agreement to replace the current Partnership and Co-operation Agreement and the implementation of the EU-Russian Federation Common Economic Space (CES) are important topics of EU-Russian Federation trade relations. EU good exports to the Russian Federation in 2008 amounted to €105 billion, meanwhile, EU goods imports from the Russian Federation reached €173.2 billion, the latter being mainly energy and mineral fuel products (68.2%), manufactured goods, chemicals and raw materials. EU exports to the Russian Federation are diversified, covering nearly all categories of machinery and transport equipment, manufactured goods, food and live animals. The Russian Federation imports European products, but does not capitalize its domestic production in the European market. In any case, important Russian exports to the European Union positioned the country as the 3
rd trade partner of the EU in 2007, according to
the Directorate General for Trade of the European Commission.
In respect to the Russian Federation’s major trading partners, Romania was not among the first twenty import partners in 2007 and was ranked 11
th as an export
destination for the Russian domestic production after Japan and India and before Bulgaria and Iran. The Russian Federation’s main imported products came from China, Ukraine, Japan, Belarus, Korea and the United States..
From this data we can see relatively low development of trade between Romania and its neighbor, except for those products that represent energy resources, which would support our primary hypothesis that trade with the Russian Federation on the export part is of low volume.
Consequently, two issues arise:
a) At microeconomic level: What are the real trade conditions and factors that affect exports to the Russian Federation? Which products could be exported and what are the markets that are not fully covered by the Russian Federation producers and might be of interest to Romanian producers? For an answer, we look in the following section at data on tariffs and foreign direct investment in the Russian Federation to have a better understanding of both what happens in the Russian Federation markets and trade barriers to Romanians exporters;
b) At macroeconomic level: What is the export potential to the Russian Federation and how important is the difference between it and real exports? In order to answer this question, we use the gravity model in section III of the paper.
The micro perspective of exports to the Russian Federation
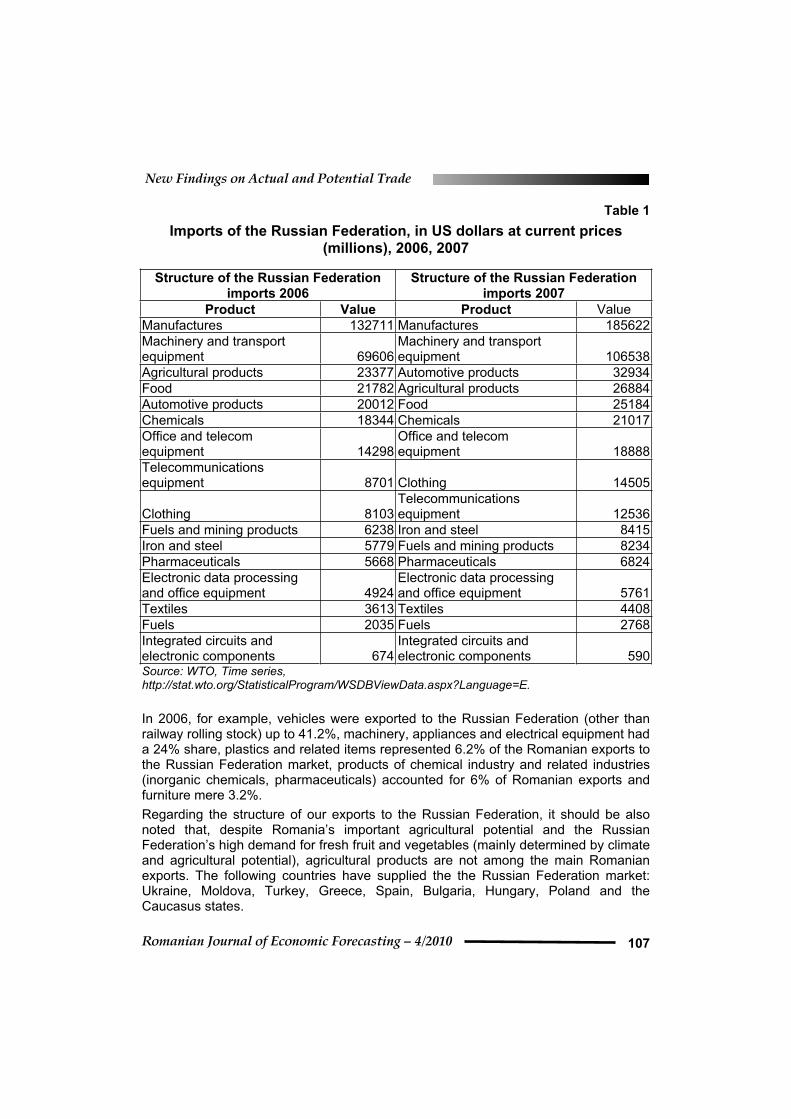
For a first glance into what is demanded by the Russian Federation market, but produced elsewhere, the structure of the Russian Federation imports in 2006 and 2007 is highlighted in the following table.
Fortunately, Romanian exports to the Russian Federation were oriented towards satisfying the domestic demand in the Russian Federation resulting from the structure of the Russian Federation imports.
New Findings on Actual and Potential Trade
Romanian Journal of Economic Forecasting – 4/2010 107
Table 1
Imports of the Russian Federation, in US dollars at current prices (millions), 2006, 2007
Source: WTO, Time series, http://stat.wto.org/StatisticalProgram/WSDBViewData.aspx?Language=E.
In 2006, for example, vehicles were exported to the Russian Federation (other than railway rolling stock) up to 41.2%, machinery, appliances and electrical equipment had a 24% share, plastics and related items represented 6.2% of the Romanian exports to the Russian Federation market, products of chemical industry and related industries (inorganic chemicals, pharmaceuticals) accounted for 6% of Romanian exports and furniture mere 3.2%.
Regarding the structure of our exports to the Russian Federation, it should be also noted that, despite Romania’s important agricultural potential and the Russian Federation’s high demand for fresh fruit and vegetables (mainly determined by climate and agricultural potential), agricultural products are not among the main Romanian exports. The following countries have supplied the the Russian Federation market: Ukraine, Moldova, Turkey, Greece, Spain, Bulgaria, Hungary, Poland and the Caucasus states.
Structure of the Russian Federation imports 2006
Structure of the Russian Federation imports 2007
Product Value Product ValueManufactures 132711 Manufactures 185622 Machinery and transport equipment 69606
Machinery and transport equipment 106538
Agricultural products 23377 Automotive products 32934 Food 21782 Agricultural products 26884 Automotive products 20012 Food 25184 Chemicals 18344 Chemicals 21017 Office and telecom equipment 14298
Office and telecom equipment 18888
Telecommunicationsequipment 8701 Clothing 14505
Clothing 8103Telecommunicationsequipment 12536
Fuels and mining products 6238 Iron and steel 8415 Iron and steel 5779 Fuels and mining products 8234 Pharmaceuticals 5668 Pharmaceuticals 6824 Electronic data processing and office equipment 4924
Electronic data processing and office equipment 5761
Textiles 3613 Textiles 4408 Fuels 2035 Fuels 2768 Integrated circuits and electronic components 674
Integrated circuits and electronic components 590

Institute of Economic Forecasting
Romanian Journal of Economic Forecasting – 4/2010108
Unfortunately, in quantitative terms, Romanian imports have covered only a small part of the Russian Federation’s demand for some important import items. This can be observed in the table below (table 2):
Table 2
Coverage of the Russian Federation Import Demand by Romanian Exports, 2006
Product description
Russian Federation’s imports from
Romania,value, 2006,
US$ thousand
Russian Federation’s
imports from world,value, 2006,
US$ thousand
Share of Romanian imports
in the Russian Federation’s imports from
world, %, 2006
Pharmaceutical products 8,434.13 6,579,933 0.1282 Meat and edible meat offal 32 4,498,063 0.0007 Articles of apparel and clothing accessories, knitted or crocheted and not knitted or crocheted 1,329.01 1,489,044 0.893 Other ready-made textile articles; sets; worn clothing and worn textile articles; rags 4,945 386,614 1.2791 Iron and steel 1,127 3,579,115 0.0315 Articles of iron or steel 13,514 3,747,650 0.3606 Vehicles other than railway or tramway rolling-stock, and parts and accessories thereof 154,323.04 18,669,742 0.8266 Source: Authors’ computation, based on data of the International Trade Centre.
Overall data indicates a low presence of Romanian goods on the Russian Federation market, despite the significant Russian Federation demand for world imports, and the geographical proximity between the two countries. We can see that Romanian exports of meat and edible meat offal covered the Russian Federation’s import demand to an extent of 0.0007%, meaning that Romanian import products have an insignificant share in the Russian Federation market. Romania covers approximately 1% of the Russian Federation’s demand for textiles, despite of the fact that textiles are among Romania’s top exporting products to the world.
From a microeconomic point of view, the low volume of exports to the Russian Federation is determined in our opinion by a series of key factors, summarized as follows:
a) Unwillingness of the Romanian entrepreneurs to initiate and develop trade relations with the Russian Federation, explained by cultural and ideological factors mentioned in the previous section;
b) Insufficient information and knowledge of the Russian Federation market; c) Insufficient involvement of the Romanian government in promoting business
opportunities in the Russian Federation;
New Findings on Actual and Potential Trade
Romanian Journal of Economic Forecasting – 4/2010 109
d) Low competitiveness of Romanian products. As opposed to the years dating back before 1989, when the COMECON (Council for Mutual Economic Assistance) meant that competitiveness was not necessarily the driving engine to commercial trade, our lack of competitiveness on the global market is a key element for exporting to the Russian Federation.
e) Trade barriers to the Russian Federation market. It is worth remembering that in the context of Romania’s integration into the European Union, the competences of Romania in trade policy are related exactly to the first four factors mentioned, which refer to two main directions: promotion of exports and macroeconomic policies for increasing competitiveness. In other words, priority must be given by the Romanian stakeholders, including the state, to boosting the level of trade with the Russian Federation, by policy instruments, such as fiscal, credit and monetary ones.
Regarding the last difficulty to export to the Russian Federation, a number of operational difficulties which hamper exports to the Russian Federation have been identified. We present a selection of those limitations to exports, as analyzed by the Romania-Russian Federation Chamber of Commerce:
Custom duties of up to 20%, depending on the products;
Unofficial fees and commissions, throughout the import operations;
Red tape issues and excessive delay in carrying out the formalities for import operations or sale on the domestic market;
Insufficient transparency for import procedures, especially regarding the documentation;
Difficulty in obtaining certain import licenses;
The frequent change of internal legislation;
Prohibitive technical standards;
Lack of coordination between the Russian Federation legislation and the WTO and the EU;
Considerable promotion costs;
Support from a local partner for the smooth running of exports.
The World Trade Forum has also reported problems in the developing of trade tran-sactions with the Russian Federation partners in the 2008/2009 Global Competiti-veness Report: "the Russian Federation is ranked 51st
, up seven places from last year. The Russian Federation's main strengths are its large market size and improving macroeconomic stability (partly thanks to windfall oil revenues). However, to further improve its competitiveness, the country must tackle a number of structural weaknes-ses. Of major concern is a perceived lack of government efficiency (116
th), the lack of
independence of the judiciary in meting out justice (109th), and more general concerns
about government favoritisms in its dealings with the private sector. Private institutions also get poor marks, with corporate ethics in the country placing the Russian Federation 112th overall on this indicator. In addition, goods and financial markets are inefficient by international standards (ranked 99
th and 112
th, respectively). All these
areas make it very difficult to do business in the country and should be addressed to place the country on a more sustainable development path going forward”.
Institute of Economic Forecasting
Romanian Journal of Economic Forecasting – 4/2010110
Structural deficiencies of the functioning of free markets is shown also by the particularly low score in the Russian Federation's Economic Freedom Index, calculated by the Heritage Foundation, the country ranking among the last (146
th of a
total of 179 countries). Regarding "business freedom", the report concerning the Russian Federation mentions that "obtaining a business license takes much more than the world average of 18 procedures and 225 days”. Regarding trade freedom, in relation to global trade, "the Russian Federation's weighted average tariff rate was 9.6 percent in 2005. Prohibitive tariffs, quotas, and services market access barriers, import and export restrictions, discriminatory import and export taxes, charges, and fees, non-transparent regulations and standards, discriminatory licensing, registration, and certification; complex and non-transparent customs valuation; customs fees, arbitrary and inefficient customs administration, subsidies, corruption, and weak enforcement of intellectual property rights add to the cost of trade." Foreign and domestic investment show a similar picture : the government tends to prefer joint ventures with foreign companies as a minority shareholder, investment is prohibited in many areas and government approval is required for all investments over 2 million dollars.
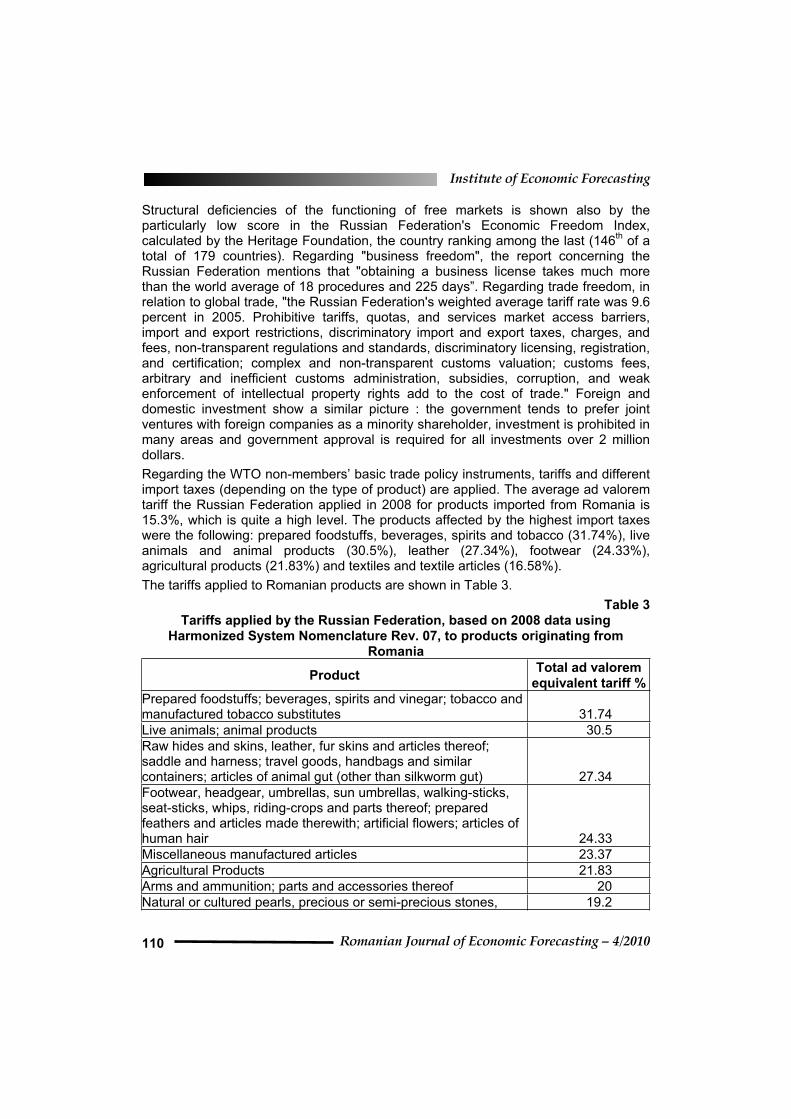
Regarding the WTO non-members’ basic trade policy instruments, tariffs and different import taxes (depending on the type of product) are applied. The average ad valorem tariff the Russian Federation applied in 2008 for products imported from Romania is 15.3%, which is quite a high level. The products affected by the highest import taxes were the following: prepared foodstuffs, beverages, spirits and tobacco (31.74%), live animals and animal products (30.5%), leather (27.34%), footwear (24.33%), agricultural products (21.83%) and textiles and textile articles (16.58%).
The tariffs applied to Romanian products are shown in Table 3.
Table 3Tariffs applied by the Russian Federation, based on 2008 data using
Harmonized System Nomenclature Rev. 07, to products originating from Romania
ProductTotal ad valorem
equivalent tariff % Prepared foodstuffs; beverages, spirits and vinegar; tobacco and manufactured tobacco substitutes 31.74 Live animals; animal products 30.5 Raw hides and skins, leather, fur skins and articles thereof; saddle and harness; travel goods, handbags and similar containers; articles of animal gut (other than silkworm gut) 27.34 Footwear, headgear, umbrellas, sun umbrellas, walking-sticks, seat-sticks, whips, riding-crops and parts thereof; prepared feathers and articles made therewith; artificial flowers; articles of human hair 24.33 Miscellaneous manufactured articles 23.37 Agricultural Products 21.83 Arms and ammunition; parts and accessories thereof 20 Natural or cultured pearls, precious or semi-precious stones, 19.2

New Findings on Actual and Potential Trade
Romanian Journal of Economic Forecasting – 4/2010 111
ProductTotal ad valorem
equivalent tariff % precious metals, metals clad with precious metal, and articles thereof; imitation jewellery; coin Textiles and textile articles 16.58 Articles of stone, plaster, cement, asbestos, mica or similar materials; ceramic products; glass and glassware 16.48 Wood and articles of wood; wood charcoal; cork and articles of cork; manufactures of straw, of esparto or of other plaiting materials; basket ware and wickerwork 15.53 Vehicles, aircraft, vessels and associated transport equipment 13.92 Animal or vegetable fats and oils and their cleavage products, prepared edible fats; animal or vegetable waxes 13.78 Vegetable products 13.62 Plastics and articles thereof; rubber and articles thereof 12.19 Pulp of wood or of other fibrous cellulose material; recovered (waste and scrap) paper or paperboard; paper and paperboard and articles thereof 10.82 Industrial Products 9.65 Base metals and articles of base metal 9.13 Products of the chemical or allied industries 7.85 Machinery and mechanical appliances; electrical equipment; parts thereof; sound recorders and reproducers, television image and sound recorders and reproducers, and parts and accessories of such articles 5.28 Optical, photographic, cinematographic, measuring, checking, precision, medical or surgical instruments and apparatus; clocks and watches; musical instruments; parts and accessories thereof 4.97 Mineral products 3.08 Works of art, collection pieces and antiques 0 Source: International Trade Centre database.
Together with trade, the flows of foreign direct investment are also of importance for the analysis of the development of the economic relations between Romania and the Russian Federation.
The former was actually the first in the top 10 recipients of FDI inflows, between 2006 and 2007, in South-East Europe and the CIS. In 2007, FDI inflows to the Russian Federation grew by 62%, reaching $52 billion, as an effect of development of the domestic consumer market and the liberalization of markets, particularly the electricity one. Consequently, foreign transnational companies increased their investments in energy and natural-resource-related projects. Examples in 2007 include the framework agreements of the oil and gas TNCs StatoilHydro (Norway) and Total (France) with state-controlled Gazprom on the development of the large Shtokman field - the world's largest untapped natural gas deposit. Even with the recent upsurge, the overall FDI potential of the Russian Federation remains higher than its performance.
Institute of Economic Forecasting
Romanian Journal of Economic Forecasting – 4/2010112
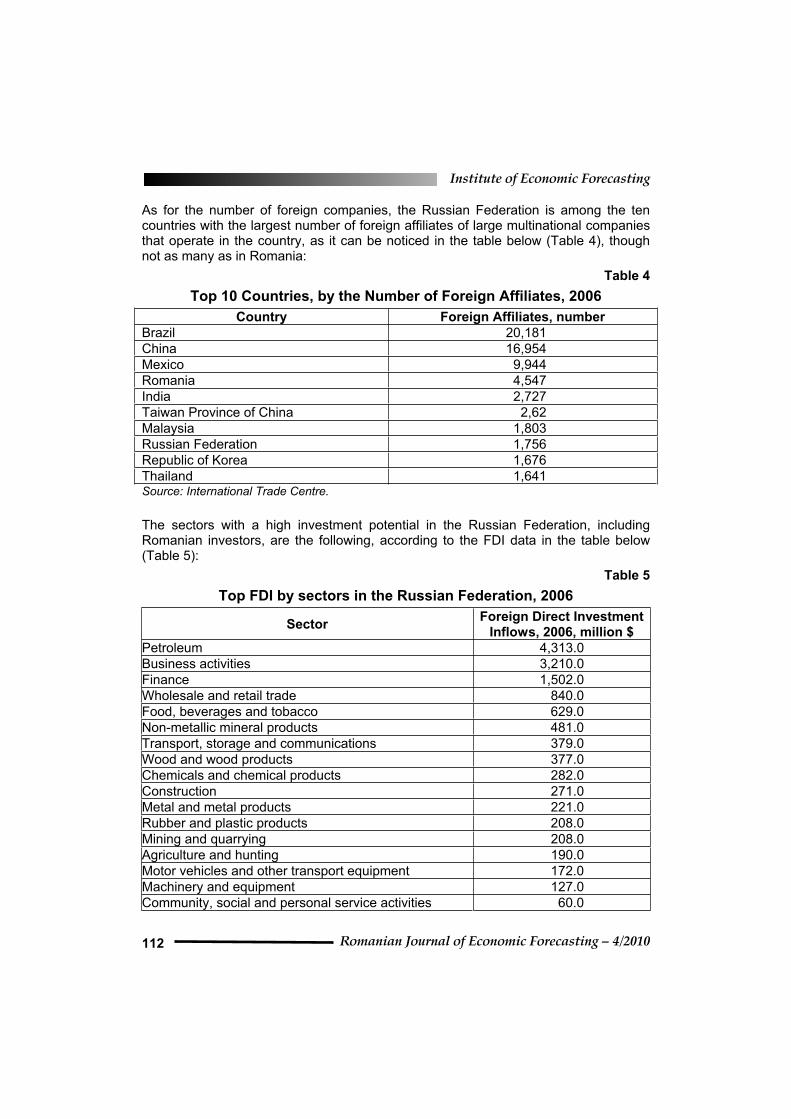
As for the number of foreign companies, the Russian Federation is among the ten countries with the largest number of foreign affiliates of large multinational companies that operate in the country, as it can be noticed in the table below (Table 4), though not as many as in Romania:
Table 4
Top 10 Countries, by the Number of Foreign Affiliates, 2006
Country Foreign Affiliates, number Brazil 20,181 China 16,954 Mexico 9,944 Romania 4,547 India 2,727 Taiwan Province of China 2,62 Malaysia 1,803 Russian Federation 1,756 Republic of Korea 1,676 Thailand 1,641 Source: International Trade Centre.
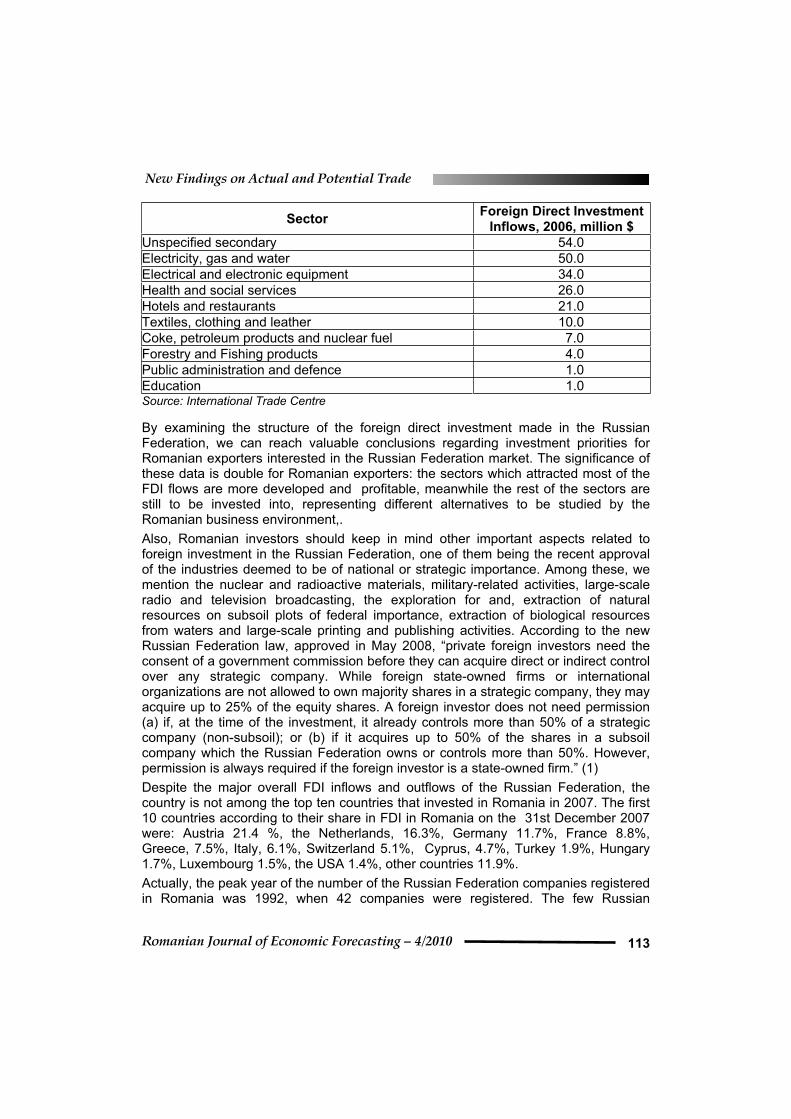
The sectors with a high investment potential in the Russian Federation, including Romanian investors, are the following, according to the FDI data in the table below (Table 5):
Table 5
Top FDI by sectors in the Russian Federation, 2006
SectorForeign Direct Investment
Inflows, 2006, million $ Petroleum 4,313.0 Business activities 3,210.0 Finance 1,502.0 Wholesale and retail trade 840.0 Food, beverages and tobacco 629.0 Non-metallic mineral products 481.0 Transport, storage and communications 379.0 Wood and wood products 377.0 Chemicals and chemical products 282.0 Construction 271.0 Metal and metal products 221.0 Rubber and plastic products 208.0 Mining and quarrying 208.0 Agriculture and hunting 190.0 Motor vehicles and other transport equipment 172.0 Machinery and equipment 127.0 Community, social and personal service activities 60.0
New Findings on Actual and Potential Trade
Romanian Journal of Economic Forecasting – 4/2010 113
SectorForeign Direct Investment
Inflows, 2006, million $ Unspecified secondary 54.0 Electricity, gas and water 50.0 Electrical and electronic equipment 34.0 Health and social services 26.0 Hotels and restaurants 21.0 Textiles, clothing and leather 10.0 Coke, petroleum products and nuclear fuel 7.0 Forestry and Fishing products 4.0 Public administration and defence 1.0 Education 1.0 Source: International Trade Centre
By examining the structure of the foreign direct investment made in the Russian Federation, we can reach valuable conclusions regarding investment priorities for Romanian exporters interested in the Russian Federation market. The significance of these data is double for Romanian exporters: the sectors which attracted most of the FDI flows are more developed and profitable, meanwhile the rest of the sectors are still to be invested into, representing different alternatives to be studied by the Romanian business environment,.
Also, Romanian investors should keep in mind other important aspects related to foreign investment in the Russian Federation, one of them being the recent approval of the industries deemed to be of national or strategic importance. Among these, we mention the nuclear and radioactive materials, military-related activities, large-scale radio and television broadcasting, the exploration for and, extraction of natural resources on subsoil plots of federal importance, extraction of biological resources from waters and large-scale printing and publishing activities. According to the new Russian Federation law, approved in May 2008, “private foreign investors need the consent of a government commission before they can acquire direct or indirect control over any strategic company. While foreign state-owned firms or international organizations are not allowed to own majority shares in a strategic company, they may acquire up to 25% of the equity shares. A foreign investor does not need permission (a) if, at the time of the investment, it already controls more than 50% of a strategic company (non-subsoil); or (b) if it acquires up to 50% of the shares in a subsoil company which the Russian Federation owns or controls more than 50%. However, permission is always required if the foreign investor is a state-owned firm.” (1)
Despite the major overall FDI inflows and outflows of the Russian Federation, the country is not among the top ten countries that invested in Romania in 2007. The first 10 countries according to their share in FDI in Romania on the 31st December 2007 were: Austria 21.4 %, the Netherlands, 16.3%, Germany 11.7%, France 8.8%, Greece, 7.5%, Italy, 6.1%, Switzerland 5.1%, Cyprus, 4.7%, Turkey 1.9%, Hungary 1.7%, Luxembourg 1.5%, the USA 1.4%, other countries 11.9%.
Actually, the peak year of the number of the Russian Federation companies registered in Romania was 1992, when 42 companies were registered. The few Russian

Institute of Economic Forecasting
Romanian Journal of Economic Forecasting – 4/2010114
investors in Romania have preferred placing their capital in two main industrial areas: metallurgy and oil industry. Some of the major Russian companies that have invested in Romania are: LukOil, Ruskii Aliuminii (Alor Oradea), OMZ (Upet, Targoviste), TMK-Sinatra Handel (ARTROM Slatina), Mecel (COS Targoviste Industry and Plain-Turzii), Temerso (Republic of SA Bucharest), Tehnosteel.
At this stage of the paper we focus on trade barriers to Romanian exporters and the specificity of markets in the Russian Federation. This is valuable information because it will explain, together with the findings of the gravity model used in the following section, the difference between potential and actual exports to the Russian Federation.
A macroeconomic perspective - Estimating export potential of Romania to the Russian Federation - The gravity model
So far, we obtained information that allowed us to believe that Romanian exports to the Russian Federation are bellow the expected level, underdeveloped. To confirm this hypothesis, the potential level of exports to the Russian Federation has to be estimated in order to compare it to the real one. For this purpose, we will use a gravity equation.
Indeed, many trade theories have tried to explain the determinants of international trade between countries, starting with the Ricardian model or the Hechsher-Ohlin model.
In classical trade models, countries differ either in their resources or in technology and specialize in the production of those goods that they produce relatively well; comparative advantages are the determinants of trade.
The growing importance of multinational companies as actors of global economy and the failure of classical theories to explain the emergence and development of intra-industry trade, among others, lead to the construction of the so called new trade theories, centered on horizontally differentiated goods, plant-level scale, economies of scale and consumer preference for variety, the quality of goods, technology, politics or product lifecycle as main drivers of international trade patterns.
A synthesized version of the “new trade theory” is the gravity model. The model is based on the assumption that the amount of bilateral trade between two countries is determined by export-supply factors in one country and import-demand factors in another. It is inspired by Newton’s proposed “Law of Universal Gravitation”, which held that the attractive force between two objects i and j is given by their masses, the distance between the two objects and a gravitational constant. Based on this, the gravity model describes trade flows (imports, exports or total trade) from a particular country i to another country j.The gravity model considers three determinants of trade:
(1) Export supply, captured by income and/or income per capita of the exporting country;
(2) Import demand, captured by income and/or income per capita of the importing country; (3) transaction costs, captured by geographical distance and variables

New Findings on Actual and Potential Trade
Romanian Journal of Economic Forecasting – 4/2010 115
representing policy and cultural barriers to trade. Distance impedes communication and leads to increased transaction costs. Distance also proxies for the possibility of personal contact between managers, customers, in the sense that business depends also on the ability to exchange information.
The basic gravity law for trade can be expressed by the following expression:
ij
jiij D
MMGF ,
where: Fij is the flow from origin i to destination j, being exports, imports or total trade, Mi and Mj are the economic sizes of the two locations – most commonly expressed by the gross domestic product (GDP) and/or the GDP per capita and Dij is the distance between the locations, measured as the distance “as crow flies“ between two capitals, in kilometers or miles.We consider that the differences between the two measurements are not of statistical significance.
One of the uses of the gravity model is to estimate trade potential, which is our objective. This way we come back to the intent of verifying the hypothesis of the first section of the paper – that exports to the Russian Federation might be below its potential.
In order to estimate this potential, we use a gravity equation model that provides a cross-section approach to forecast Romanian exports to a number of 43 countries, accounting for a sizeable share of total exports, covering a world-wide area using data series over a period of time between 1993 and 2008. The countries used in the model are Austria, Belgium, Brazil, Bulgaria, Canada, China, Croatia, Chez Republic, Denmark, Finland, France, Greece, Hungary, India, Ireland, Israel, Italy, Japan, Korea, Latvia, Lithuania, Former Yugoslav Republic of Macedonia, Mexico, Moldova, the Netherlands, New Zeeland, Norway, Poland, the Russian Federation, Saudi Arabia, the Slovak Republic, Slovenia, South Africa, Spain, Sweden, Switzerland, Syrian Arab Republic, Thailand, Turkey, Ukraine, United Arab Emirates (UAE), the UK, the US, Venezuela. The criteria for including these countries is that among them we find the main trade partners of Romania and have a worldwide geographical representation.
Exports data is based on the United Nations “Comtrade” statistics database, the macroeconomic data is based on IMF statistics, collected until April 2009. The series for GDP and Imports were recalculated using the deflator specific for the countries included in the study, in order to allow for inter-temporal comparisons.
Export potential is modeled as a function of exogenous factors identified by the analysis of data concerning a group of countries which exhibit “normal” trade relations with Romania (there are no commercial restrictions). The model is applied on available data regarding the Russian Federation, which is of interest in our case.
The static general basic gravity equation takes the following form:
Log Fij = log Mi + log Mj + log Dij + ij (1)

Institute of Economic Forecasting
Romanian Journal of Economic Forecasting – 4/2010116
Instead, in our model, we use the following panel regression model:
)t()PIB_porterlog(Im)t)(PIB_Romanian(
*)cetanDis(*)t)(Exports(*)t)(Exports(
j
jij
loglogloglog iij
10
3102101101 (2)
where: i – Romania and j – Romanian’s trading partners.In order to estimate the export potential of Romania to its trading partners we use the following regressors (in equation 2):
1. The lag of the dependent variable – exports of Romania to its trade partners throughout the 1993-2007 period (ijt) – in constant prices, US dollars; this is equivalent to modeling the exports of Romania to all trading partners included in the panel;
2. The aerial distance between capitals (ij), measured in aerial miles;
3. GDP of Romania (it) – in constant prices, US dollars;
4. GDP of the Importing countries (jt) – in constant prices, US dollars.
In order to allow for further comparison between real exports and potential (predicted) ones, the exports of 2008 were not included in the sample used to build the regression model.
Also, the model does not account for the recent global financial turmoil. It’s expected that the levels of export will shrink significantly in 2009, as financial difficulties lead to a major contraction of the aggregated demand for most of the importing countries. However, for 2008 predictions, it can be argued that exports lagged the current crisis.
Using statistical software (EViews), the following panel regression results are obtained:
Dependent Variable: LOG(?IMPORTSD)*
Method: Pooled Least Squares
Sample(adjusted): 1994 2007
Included observations: 14 after adjusting endpoints
Number of cross-sections used: 43
Total panel (balanced) observations: 602
Variable Coefficient Std. Error t-Statistic Prob.
LOG(?GDP) 0.192100 0.030222 6.356237 0.0000 LOG(?DISTANCE) -0.350711 0.052673 -6.658239 0.0000 LOG(?IMPORTSD(-1)) 0.796318 0.023365 34.08118 0.0000 LOG(ROGDP) 0.296201 0.105095 2.818419 0.0050
R-squared 0.860263 Mean dependent var 18.57829 Adjusted R-squared 0.859562 S.D. dependent var 2.064706 S.E. of regression 0.773749 Sum squared resid 358.0153 F-statistic 1227.159 Durbin-Watson stat 2.329827 Prob(F-statistic) 0.000000

New Findings on Actual and Potential Trade
Romanian Journal of Economic Forecasting – 4/2010 117
*The notation in EViews “LOG(?IMPORTSD)” comes from the fact that we have considered that the imports from Romania of the countries in the model are in fact Romania’s exports to those countries; this is why - although we only follow the estimation of exports in our study - in EViews the name of the variable contains the word “imports”.
All regression coefficients are significant, with a value of the determination coefficient that explains an important part of the variation of Romanian exports to Russia as well as other countries included in the panel.
Dummy variables accounting for EU membership as well as a neighboring country dummy were excluded from the model because of the T-tests carried out for the significance of regression coefficients.
As expected, distance has a negative impact on trade between countries. Despite enormous development of infrastructure and economic and cultural integration of markets, distance – which is a proxy for transaction costs – is still an important determinant in international trade, according to the model.
Next, we have estimated the value of the exports to the Russian Federation, as well as those to all the other countries included in the model, using our gravity equation.
The table below includes the predicted volumes of exports in the countries included in the sample, “real” trade between Romania and these countries in 2008 and also “registered effective exports”, as a percentage of real exports as compared to modeled potential ones.
We made the comparison between potential and real trade for the year 2008 to compare the dynamics of trade, in other words we are interested in what export would have been in 2008 if during the period studied (1993-2007), trade would have followed the gravity pattern.
We used in the estimation an adjusting factor; thus, taking into account that the total exports of Romania in 2008 were 49,538,877,501 $, the model covers roughly 88.56% of Romania’s total exports. As the number of countries included in the model increases, the aggregate export covered increases to 100%. The volume of estimated exports to the countries in the study will be adjusted proportionally depending on the ratio between real exports and total exports. Taking into account that the model for the 43 countries predicts an aggregated trade volume of 41,036,331,451 $, and real exports to these countries were estimated at 43,873,434,360 $, we are going to calculate the ratio between them as follows:
countriesforeigntoortsforecastedSumcountriesforeigntoortsrealSum
___exp_____exp__
=1.069136368
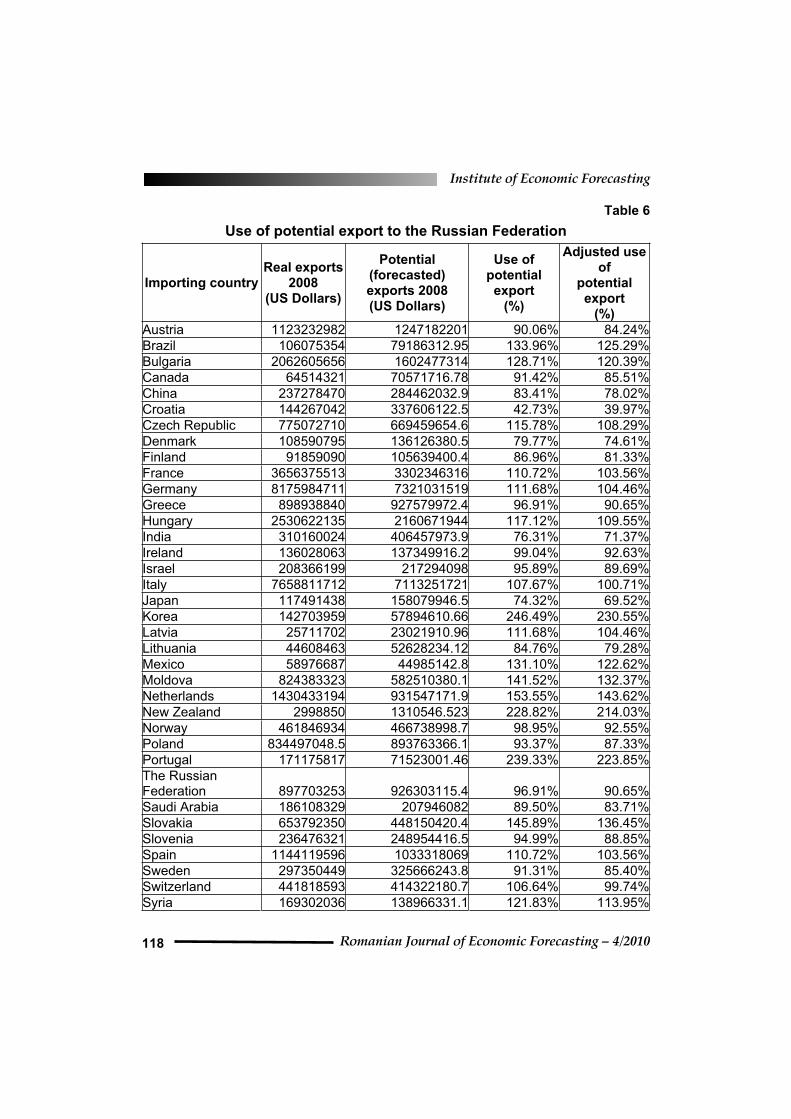
The adjusting factor will be applied proportionally to forecasted exports, the last column being the exploitation/use of export potential taking into account its value, as shown in Table 6:
Institute of Economic Forecasting
Romanian Journal of Economic Forecasting – 4/2010118
Table 6
Use of potential export to the Russian Federation
Importing country Real exports
2008(US Dollars)
Potential(forecasted)exports 2008 (US Dollars)
Use of potential
export(%)
Adjusted use of
potentialexport
(%) Austria 1123232982 1247182201 90.06% 84.24% Brazil 106075354 79186312.95 133.96% 125.29% Bulgaria 2062605656 1602477314 128.71% 120.39% Canada 64514321 70571716.78 91.42% 85.51% China 237278470 284462032.9 83.41% 78.02% Croatia 144267042 337606122.5 42.73% 39.97% Czech Republic 775072710 669459654.6 115.78% 108.29% Denmark 108590795 136126380.5 79.77% 74.61% Finland 91859090 105639400.4 86.96% 81.33% France 3656375513 3302346316 110.72% 103.56% Germany 8175984711 7321031519 111.68% 104.46% Greece 898938840 927579972.4 96.91% 90.65% Hungary 2530622135 2160671944 117.12% 109.55% India 310160024 406457973.9 76.31% 71.37% Ireland 136028063 137349916.2 99.04% 92.63% Israel 208366199 217294098 95.89% 89.69% Italy 7658811712 7113251721 107.67% 100.71% Japan 117491438 158079946.5 74.32% 69.52% Korea 142703959 57894610.66 246.49% 230.55% Latvia 25711702 23021910.96 111.68% 104.46% Lithuania 44608463 52628234.12 84.76% 79.28% Mexico 58976687 44985142.8 131.10% 122.62% Moldova 824383323 582510380.1 141.52% 132.37% Netherlands 1430433194 931547171.9 153.55% 143.62% New Zealand 2998850 1310546.523 228.82% 214.03% Norway 461846934 466738998.7 98.95% 92.55% Poland 834497048.5 893763366.1 93.37% 87.33% Portugal 171175817 71523001.46 239.33% 223.85% The Russian Federation 897703253 926303115.4 96.91% 90.65% Saudi Arabia 186108329 207946082 89.50% 83.71% Slovakia 653792350 448150420.4 145.89% 136.45% Slovenia 236476321 248954416.5 94.99% 88.85% Spain 1144119596 1033318069 110.72% 103.56% Sweden 297350449 325666243.8 91.31% 85.40% Switzerland 441818593 414322180.7 106.64% 99.74% Syria 169302036 138966331.1 121.83% 113.95%

New Findings on Actual and Potential Trade
Romanian Journal of Economic Forecasting – 4/2010 119
Importing country Real exports
2008(US Dollars)
Potential(forecasted)exports 2008 (US Dollars)
Use of potential
export(%)
Adjusted use of
potentialexport
(%) Thailand 14498792 12794975.38 113.32% 105.99% Turkey 3275963172 3918099541 83.61% 78.20% Ukraine 462272388 428090008 107.98% 101.00% UAE 1628176662 1689065104 96.40% 90.16% UK 1220160950 935225660.9 130.47% 122.03% US 838466975 884932680.4 94.75% 88.62% Venezuela 3613461 21798717.21 16.58% 15.50% Source: Authors’ computation.
How should we interpret these results?
Considering the exports general model based on the countries’ GDP, distances between Romania and the importing countries as well as last value of the exports towards these countries as proxies for the value of the current exports, the value of 90.65% shows that “on aggregate” Romania’s exports to the Russian Federation had a growth pace lower than that implied by the model. If the figure was exactly 100%, the expected value of imports toward the Russian Federation and real one were equal, or the pace of growth matched the general pattern of the model.
In order to estimate the long-term dynamics of the exports to the Russian Federation, we will use the gravity model to estimate the exports starting in 1993, and compare them with the real exports.
For the 1994 estimated export, we will use available data until 1994 (1993 for the Russian Federation’s lagged import). For the 1995 estimated export, we will use available data until 1995 (1994 for the Russian Federation’s lagged import), and so on. Following this rule, for 2007, we will use available data until 2007 (2006 for the Russian Federation’s lagged import).
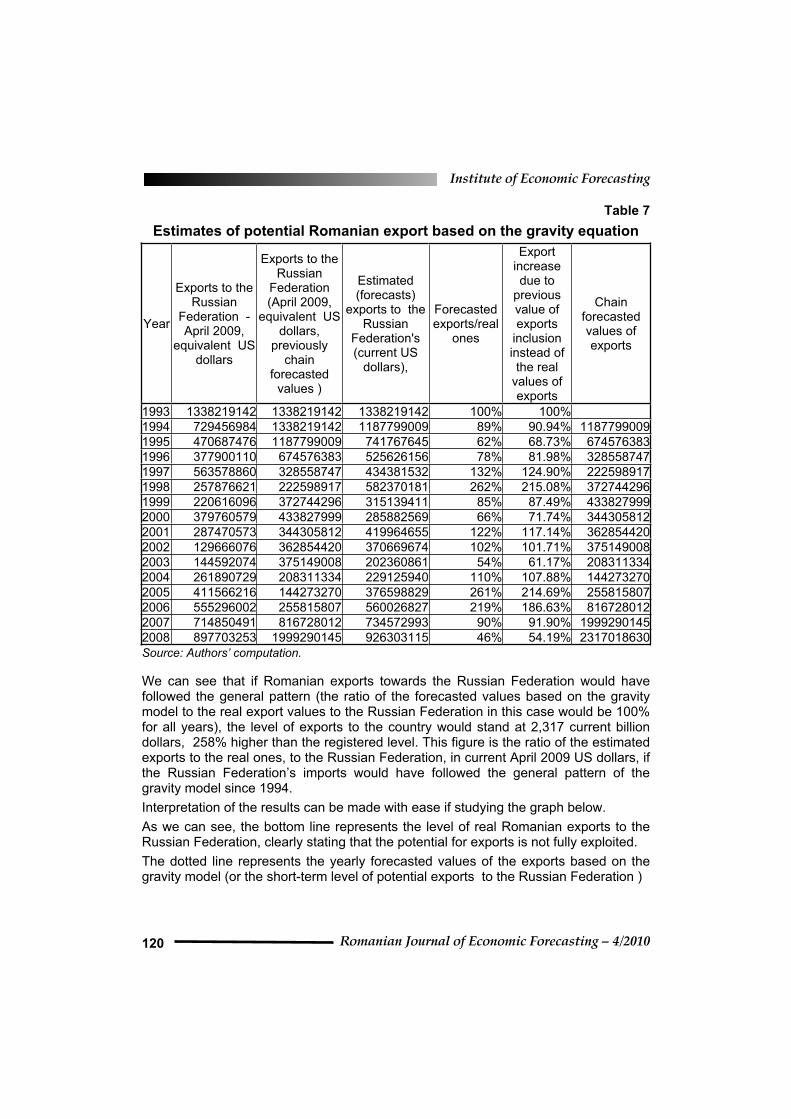
By comparing for each country the forecasts with the real volume of exports to the Russian Federation, we obtain the results shown below (Table 7).
By equivalent value we understand the exports in current monetary units depending on the GDP deflator of the Russian Federation. By previously chain forecasted values we understand the values estimated based on the model, values considered registered for the previous years. The estimations of the exports to the Russian Federation include the values estimated based on the model in any of the years taken into account, expressed in current prices. Estimated exports/real ones is self-explanatory. The second to last column represent the estimated value of exports if we were to include in the model the previously estimated value instead of the registered one (in this case it is assumed that given a fixed volume of exports of Romania in a given year, the proportion of exports to Russia in total exports is not a constraining factor for the level of exports in the years to come).
Institute of Economic Forecasting
Romanian Journal of Economic Forecasting – 4/2010120
Table 7
Estimates of potential Romanian export based on the gravity equation
Year
Exports to the Russian
Federation -April 2009,
equivalent US dollars
Exports to the Russian
Federation(April 2009,
equivalent US dollars,
previouslychain
forecastedvalues )
Estimated(forecasts)
exports to the Russian
Federation's(current US
dollars),
Forecastedexports/real
ones
Export increasedue to
previousvalue of exports
inclusioninstead of the real
values of exports
Chainforecastedvalues of exports
1993 1338219142 1338219142 1338219142 100% 100% 1994 729456984 1338219142 1187799009 89% 90.94% 11877990091995 470687476 1187799009 741767645 62% 68.73% 6745763831996 377900110 674576383 525626156 78% 81.98% 3285587471997 563578860 328558747 434381532 132% 124.90% 2225989171998 257876621 222598917 582370181 262% 215.08% 3727442961999 220616096 372744296 315139411 85% 87.49% 4338279992000 379760579 433827999 285882569 66% 71.74% 3443058122001 287470573 344305812 419964655 122% 117.14% 3628544202002 129666076 362854420 370669674 102% 101.71% 3751490082003 144592074 375149008 202360861 54% 61.17% 2083113342004 261890729 208311334 229125940 110% 107.88% 1442732702005 411566216 144273270 376598829 261% 214.69% 2558158072006 555296002 255815807 560026827 219% 186.63% 8167280122007 714850491 816728012 734572993 90% 91.90% 19992901452008 897703253 1999290145 926303115 46% 54.19% 2317018630Source: Authors’ computation.
We can see that if Romanian exports towards the Russian Federation would have followed the general pattern (the ratio of the forecasted values based on the gravity model to the real export values to the Russian Federation in this case would be 100% for all years), the level of exports to the country would stand at 2,317 current billion dollars, 258% higher than the registered level. This figure is the ratio of the estimated exports to the real ones, to the Russian Federation, in current April 2009 US dollars, if the Russian Federation’s imports would have followed the general pattern of the gravity model since 1994.
Interpretation of the results can be made with ease if studying the graph below.
As we can see, the bottom line represents the level of real Romanian exports to the Russian Federation, clearly stating that the potential for exports is not fully exploited.
The dotted line represents the yearly forecasted values of the exports based on the gravity model (or the short-term level of potential exports to the Russian Federation )

New Findings on Actual and Potential Trade
Romanian Journal of Economic Forecasting – 4/2010 121
Graphic 2
Forecast versus real exports
Source: Authors’ computation.
The continuous line describes the level of exports to the Russian Federation if in all years, starting in 1994, we would have registered the same dynamic of exports to the Russian Federation as the one estimated by the gravity model for all the other countries (or the cumulative level of potential exports to the Russian Federation). For example, for 2008, the value of exports is dependent on the potential value of the exports as estimated by the model for 2007, which is in turn dependent on the potential value (non-achieved one) for 2006, going back to the first estimation of the potential (estimated value), which is for 1994.
Some limitations of the model may account for even larger differences between real and estimated long-term dynamics of Romanian exports to the Russian Federation markets.
One is the fact that in the model we did not include the level of customs duties paid on Romanian exports when entering different countries. We did not include it because we could not obtain data for all 43 countries. Distance cannot act like a proxy for this omitted variable. For example, the level of tariffs – high as earlier stated – would have been explained probably an important share of the exports toward the Russian Federation.
Other important aspect is the fact that, when doing business in a foreign country, the overall business environment functioning is a determinant factor in the decision of acting on a market or another and in the smooth functioning of foreign operations. The World Bank studies business environments and elaborates an overall ranking of them, called the Doing Business Rank. In our gravity equation, we did not include a measure of the well-functioning of the domestic markets due to the fact that such a rank would have not fitted in the model because of comparability issues. In any case, it is worth mentioning that the Russian Federation’s rank is very low in the World Bank’s ranking. It is the 120
th out of 181 economies in 2009, which makes it similar to that of Nigeria
(118th), Bosnia and Herzegovina (119
th), Nepal (121
th), India (122
th) and Lesotho
(123th).

Institute of Economic Forecasting
Romanian Journal of Economic Forecasting – 4/2010122
Below are presented different components of the index and their individual ranking for the Russian Federation, in 2009 (Table 8):
Table 8
Doing Business ranking of the Russian Federation
Doing business rank Rank (out of 181) Starting a Business 65
Dealing with Construction Permits 180 Employing Workers 181 Registering Property 49
Getting Credit 109 Protecting Investors 88
Paying Taxes 134 Trading Across Borders 161
Enforcing Contracts 18 Closing a Business 89
Source: World Bank, http://www.doingbusiness.org/EconomyRankings/
According to these data, it is quite difficult to start a business in the Russian Federation, to deal with construction permits, to employ workers or to pay taxes – which have an unambiguously serious negative impact on Romanian exports on this market. In conclusion, such an explicative variable included in the model would have made it more close to reality, but due to the reasons mentioned, we did not included it in the gravity equation.
Conclusions
The paper attempted to test the hypothesis that Romanian exports to the Russian Federation could be bigger than they currently are. We first looked at statistical data regarding bilateral trade, customs duties and foreign direct investment. We concluded that in 2008, the share of Romanian exports to the Russian Federation, expressed as a percentage of the total Romanian exports was only 1.9%, which makes the Russian Federation the thirteenth Romanian export destination. In other words, few Romanian products have reached the Russian consumers. We argue that a series of limitations jeopardized exports to the Russian Federation. Among them, we have emphasized insufficient information and knowledge of the Russian Federation market, augmented by insufficient involvement by the Romanian political factor in promoting business opportunities in the Russian Federation. We have also discussed the competitiveness dimension. As opposed to the years dating back before 1989, when trade within COMECON meant that real competitiveness was not necessarily the driving engine of trade, lack of competitiveness of some of Romanian products on the global market became a real factor due to which we still export little in the Russian Federation. Trade barriers imposed by the Russian Federation to Romanian products were also analyzed and there seems to be a relatively high level of the average export tariff.
New Findings on Actual and Potential Trade
Romanian Journal of Economic Forecasting – 4/2010 123
Further, with a macroeconomic perspective in mind, we used a gravity equation in order to obtain a theoretical, potential level of Romanian exports to the Russian Federation. We provided a cross-section approach to forecast Romanian exports to a number of 43 countries, accounting for a sizeable share of total exports, covering a world-wide area using data series over a period of time between 1993 and 2008. As expected, distance has a negative impact on trade between countries. Despite enormous development of infrastructure and economic and cultural integration of markets and societies, distance – which is a proxy for transaction costs – is still a important determinant in international trade, according to the model.
Next, we have calculated export potential of Romania to the Russian Federation interested in the long-run trade dynamics potential. We conclude that if the Russian Federation would have perfectly fitted the general “gravity pattern”, the level of exports to the country would stand at 2,317 current billion dollars, which is 258% higher than the registered level.
Further investigation is required to deepen the analysis of trade with the Russian Federation, both from the quantitative and qualitative point of view. The inclusion of trade barriers and a proxy for doing business abroad in a more extended model would probably contribute to a more specific understanding of the bilateral trade.
This could be a first signal for stakeholders in this process that more efforts are to be made in order to better exploit a close and important market, like the Russian one.
The internationalization process of Romanian companies, together with development of exports, is a key to sustainable future economic development.
In this context, the opportunities in the Russian Federation market, first being its size, geographical proximity and a past shared destiny, should be correctly evaluated by Romanian decision makers, together with exporters. The results of the gravity model can be considered, in this context, a good indicator that these opportunities were underevaluated and exploited until now.
Endnotes:
(1) World Investment Report, 2008, UNCTAD, pg. 71, http://www.unctad.org/en/docs/wir2008p1_en.pdf(2) see Annexes on the site http://www.ip.ro/rjef.htm .
References
Brülhart, M., Kelly, M. (1999), “Ireland’s Trading Potential with Central and Eastern European Countries: A Gravity Study”, The Economic and Social Review, 30(2): 159-174.
Chan-Hyun, S. (2001), A Gravity Model Analysis of Korea's Trade Patterns and the Effects of a Regional Trading Arrangement, Working Paper Series Vol. 2001, 09 April 2001, The International Centre for the Study of East Asian Development, Kitakyushu, available at http://www.icsead.or.jp/7publication/workingpp/wp2001/2001-09.pdf,accessed in June 2010.

Institute of Economic Forecasting
Romanian Journal of Economic Forecasting – 4/2010124
Christie, E. Potential Trade in Southeast Europe: A Gravity Model Approach Introduction, The Vienna Institute For International Economic Studies, http://www.wiiw.ac.at/balkan/files/Christie.pdf, accessed in June 2009.
Dinu, M. (2006), “Modelul explicativ al globaliz rii”, Revista Economie teoretic iaplicat , 3 (498).
Dobrescu, E. (2003), “Câteva caracteristici ale economiei române ti în tranzi ie”, In Mure an M., Dou secole de tranzi ie româneasc , Bucharest : Editura Economic .
Gros, D., Gonciarz, A. (1996), “A note on the trade potential of Central and Eastern Europe”, European Journal of Political Economy, 12: 709-721.
Hlihor C. (2005), Geopolitica i geostrategia în analiza rela iilor interna ionalecontemporane, Editura Universit ii Na ionale de Ap rare “Carol I”, Bucharest,.
Kalbasi, H. The Gravity Model and Global Trade Flows, available at http://www.ecomod.net/conferences/ecomod2001/papers_web/KALBASI.pdf, accessed in September 2009.
Lebed A. (1998), “Global Viewpoint”, In Gardels N. Schimbarea ordinii mondiale,Oradea : Editura Antet.
De Vries M., Shekshnia S., Korotov K., Florent-Treacy E. (2004), The New Russian Business Leaders, Edward Elgar Publishing Limited.
Mujennicova N. (2005), Starea actual a rela iilor comerciale i de cooperare dintre Rusia i România: oportunit i la orizontul anului 2010, Ph.D. Thesis, The ASE Library, Bucharest.
Mure an M., Mure an D. (2003), Istoria economiei, Editura Economic , Bucharest.Negu S. (2005), Introducere în geopolitic , Editura Meteor Press, Bucharest. Rosefielde S. (2005), Russia in the 21st century; The prodigal superpower,
Cambridge University Press. Ungureanu T. (2008), Încotro duce istoria României?, Editura Humanitas, Bucharest. Pirani S. (2010), Change in Putin's Russia: Power, Money and People, Pluto Press.Ruiz, J., Vilarrubia, J. The wise use of dummies in gravity models: Export potentials
in the euromed region, Banco de Espana, available at http://ideas.repec.org/p/bde/wpaper/0720.html, accessed in August 2009.
http://www.economist.com/research/articlesBySubject/displaystory.cfm?subjectid=349002&story_id=12797734.
World Investment Report, (2008), UNCTAD, http://www.unctad.org/en/docs/wir2008p1_en.pdf.
www.intracen.org.