new firm creation in the united
DESCRIPTION
New Firm Creation in the United by Paul ReynoldsTRANSCRIPT

7/18/2019 New Firm Creation in the United
http://slidepdf.com/reader/full/new-firm-creation-in-the-united 1/168
the essence of knowledge
Foundations and Trends® inEntrepreneurship
3:1 (2007)
New Firm Creation
in the United States:A PSED I Overview
Paul D. Reynolds
now

7/18/2019 New Firm Creation in the United
http://slidepdf.com/reader/full/new-firm-creation-in-the-united 2/168
New Firm Creation in
the United States

7/18/2019 New Firm Creation in the United
http://slidepdf.com/reader/full/new-firm-creation-in-the-united 3/168

7/18/2019 New Firm Creation in the United
http://slidepdf.com/reader/full/new-firm-creation-in-the-united 4/168
New Firm Creation inthe United States
Paul D. Reynolds
Professor and Director, Entrepreneurship ResearchInstitute
Florida International University, Miami, FL 33199
Boston – Delft
7/18/2019 New Firm Creation in the United
http://slidepdf.com/reader/full/new-firm-creation-in-the-united 5/168
Foundations and Trends R inEntrepreneurship
Published, sold and distributed by:
now Publishers Inc.
PO Box 1024
Hanover, MA 02339
USA
Tel. +1-781-985-4510
www.nowpublishers.com
Outside North America:
now Publishers Inc.
PO Box 179
2600 AD Delft
The Netherlands
Tel. +31-6-51115274
Library of Congress Control Number: 2006939972
The preferred citation for this publication is P. D. Reynolds, New Firm Creation
in the United States, Foundation and Trends R in Entrepreneurship, vol 3, no 1,
pp 1–150, 2007
Printed on acid-free paper
ISBN: 1-60198-000-7c 2007 P. D. Reynolds
All rights reserved. No part of this publication may be reproduced, stored in a retrieval
system, or transmitted in any form or by any means, mechanical, photocopying, recordingor otherwise, without prior written permission of the publishers.
Photocopying. In the USA: This journal is registered at the Copyright Clearance Cen-ter, Inc., 222 Rosewood Drive, Danvers, MA 01923. Authorization to photocopy items forinternal or personal use, or the internal or personal use of specific clients, is granted bynow Publishers Inc for users registered with the Copyright Clearance Center (CCC). The‘services’ for users can be found on the internet at: www.copyright.com
For those organizations that have been granted a photocopy license, a separate systemof payment has been arranged. Authorization does not extend to other kinds of copy-ing, such as that for general distribution, for advertising or promotional purposes, forcreating new collective works, or for resale. In the rest of the world: Permission to pho-
tocopy must be obtained from the copyright owner. Please apply to now Publishers Inc.,PO Box 1024, Hanover, MA 02339, USA; Tel. +1 781 871 0245; www.nowpublishers.com;[email protected]
now Publishers Inc. has an exclusive license to publish this material worldwide. Permissionto use this content must be obtained from the copyright license holder. Please apply to nowPublishers, PO Box 179, 2600 AD Delft, The Netherlands, www.nowpublishers.com; e-mail:[email protected]
7/18/2019 New Firm Creation in the United
http://slidepdf.com/reader/full/new-firm-creation-in-the-united 6/168
Foundations and Trends R in
EntrepreneurshipVolume 3 Issue 1, 2007
Editorial Board
Editors-in-Chief:
Zoltan J. Acs
George Mason University
David B. Audretsch
Max Planck Institut
Indiana University
EditorsHoward Aldrich, University of North Carolina
Sharon Alvarez, Ohio State University
Mark Casson, University of Reading
Per Davidsson, Queensland University of Technology
William B. Gartner, Clemson University
Sharon Gifford, Rutgers University
Magnus Henrekson, The Research Institute of Industrial EconomicsMichael A. Hitt, Texas A&M University
Joshua Lerner, Harvard University
Simon Parker, University of Durham
Paul Reynolds, Florida International University
Kelly G. Shaver, College of William and Mary
David Storey, University of Warwick
Patricia Thornton, Duke University
Roy Thurik, Erasmus University
Gregory Udell, Indiana University
Sankaran Venkataraman, Batten Institute
Paul Westhead, Nottingham University Business School
Shaker Zahra, University of Minnesota

7/18/2019 New Firm Creation in the United
http://slidepdf.com/reader/full/new-firm-creation-in-the-united 7/168
Editorial Scope
Foundations and Trends R in Entrepreneurship will publish sur-
vey and tutorial articles in the following topics:
• Nascent and start-up
entrepreneurs
• Opportunity recognition
• New venture creation process• Business formation
• Firm ownership
• Market value and firm growth
• Franchising
• Managerial characteristics and
behavior of entrepreneurs
• Strategic alliances and networks
• Government programs and public
policy
• Gender and ethnicity
• New business financing:
• Business angels
• Bank financing, debt, and trade
credit
• Venture capital and private equitycapital
• Public equity and IPOs
• Family-owned firms
• Management structure, governance
and performance
• Corporate entrepreneurship
• High technology• Technology-based new firms
• High-tech clusters
• Small business and economic
growth
Information for LibrariansFoundations and Trends R in Entrepreneurship, 2007, Volume 3, 4 issues. ISSN
paper version 1551-3114. ISSN online version 1551-3122. Also available as a
combined paper and online subscription.

7/18/2019 New Firm Creation in the United
http://slidepdf.com/reader/full/new-firm-creation-in-the-united 8/168
Foundations and Trends R inEntrepreneurshipVol. 3, No 1 (2007) 1–150
c 2007 P. D. ReynoldsDOI: 10.1561/0300000010
New Firm Creation in the United States
A PSED I Overview
Paul D. Reynolds
Professor and Director, Entrepreneurship Research Institute, Florida International University, Miami, FL 33199, [email protected]
Abstract
The first US Panel Study of Entrepreneurial Dynamics [PSED I] is the
most comprehensive assessment of the firm creation process yet com-
pleted. Based on a representative sample of those actively involved in
business creation, analysis begins with the consideration of 75 factors
that may affect the decision of adults to get involved in the creation of
a new business, followed by a detailed exploration of over 130 factors
that may be associated with completing the start-up process with anew firm. The results indicate, first, that over ten million persons are
involved in the firm start-up phase as nascent entrepreneurs. Second,
the major factors associated with entry into the start-up process have
little impact on completion of the process with an operating business.
Third, activities pursued in the start-up process – not the characteris-
tics of the entrepreneur, the start-up, or the location – have a major
impacts on the transition from start-up to a successful new firm. Thereis little impact associated with being male; being White, Black or His-
panic; having more education; being wealthy; having experience with
other start-ups; having an “entrepreneurial personality”; or being in a

7/18/2019 New Firm Creation in the United
http://slidepdf.com/reader/full/new-firm-creation-in-the-united 9/168
supportive environment. This project demonstrates the value of track-
ing a representative sample of nascent entrepreneurs with a longitudinal
study. Implications for future research, entrepreneurs, and public policyare substantial.

7/18/2019 New Firm Creation in the United
http://slidepdf.com/reader/full/new-firm-creation-in-the-united 10/168
Contents
1. Introduction 1
1.1. How Do New Businesses Come About? 1
1.2. An Author’s Personal View 2
2. New Firm Creation: Importance and Need
for More Details 7
2.1. What Does the Start-Up Process Look Like? 9
3. Conceptualization of the Process 13
3.1. Socio-Cultural Characteristics 15
3.2. Stable Personal Traits and Orientations 17
3.3. Immediate Personal, Social Context 21
3.4. Work Related Experiences 23
3.5. Procedures, Strategies, and Resources Associated
with Firm Implementation 253.6. Ambient Social, Cultural Community Context 29
3.7. Industry and Competitive Context 31
3.8. Regional Characteristics and Change 32
3.9. Overview 32
ix

7/18/2019 New Firm Creation in the United
http://slidepdf.com/reader/full/new-firm-creation-in-the-united 11/168
4. Becoming a Nascent Entrepreneur: Conception to
the Start-Up Process 35
4.1. How Many People are Trying to Start New Firms? 35
4.2. What Kind of People are Trying to Start New Firms? 36
4.3. Life Context and Start-Ups 42
4.4. Comparison Group Data 48
4.5. Overview 53
5. Creating a New Business: Results from
the Start-Up 55
5.1. What Kinds of People Create and Types of Start-Ups
Become New Firms? 58
5.2. Start-Up Activity 68
5.3. Interactions: Who They are and What They are Doing? 76
5.4. Overview 84
6. Overview and Implications 87
6.1. Implications: Research 90
6.2. Implications: Entry Into the Start-Up Process 92
6.3. Implications: New Firm Creation 93
6.4. Implications: Public Policy 93
References 97
PSED I Scholarly Works 99
Acknowledgements 109
A. Methodlogical Appendices 111
Appendix.4Ax.1. Notes on Assessment of the Screening Data 111
Appendix.4Ax.2. Comparison of Nascent Entrepreneurs and
Typical Adults 112
Appendix.5Ax.1. Constructing Start-Up Time Lines Data Set 118

7/18/2019 New Firm Creation in the United
http://slidepdf.com/reader/full/new-firm-creation-in-the-united 12/168
Appendix.5Ax.2. Disposition of All Cases and 72 Month
Outcome Status 122
Appendix.5Ax.3. Detailed Comparison of Start-UpsOutcomes: New Firms and Others 134
Appendix.5Ax.4. Constructing Start-Up Activity Indices 153

7/18/2019 New Firm Creation in the United
http://slidepdf.com/reader/full/new-firm-creation-in-the-united 13/168

7/18/2019 New Firm Creation in the United
http://slidepdf.com/reader/full/new-firm-creation-in-the-united 14/168
1Introduction
1.1 How Do New Businesses Come About?
The most comprehensive and detailed assessment of this question is
the first US Panel Study of Entrepreneurial Dynamics [PSED I]. This
project started with the screening of 64,000 US adults followed by four
extensive two-phase interviews spread over a five year period. Analysis
began with the consideration of 75 factors that may affect the decision
of adults to get involved in the creation of a new business – to become
nascent entrepreneurs. General comparisons were made of those active
in start-ups with others interviewed in the screening and detailed com-
parisons were possible with a small comparison group. The assessment
continued with a detailed exploration of over 130 factors that may be
associated with completing the start-up process. This study focuses on
understanding how the 200 nascent entrepreneurs that reported a new
firm within seven years of entering the start-up process were different
from the 468 who quit or continued to work on the start-up.There are a number of significant findings from this research pro-
gram. First is the large number of individuals involved as nascent
1

7/18/2019 New Firm Creation in the United
http://slidepdf.com/reader/full/new-firm-creation-in-the-united 15/168
2 Introduction
entrepreneurs – 10 million in 1998–1999 when the PSED research
project began; as many as 16 million in 2005.
Second is the finding that the major factors associated with enteringthe start-up process and becoming a nascent entrepreneur, such as age,
gender, educational attainment, household income or net worth, and
residence in a community with recent population growth are unrelated
to completion of the start-up process with a successful new firm.
The third major finding is that the activities pursued in the start-up
process – not the characteristics of the entrepreneur, the start-up, or the
location – have an impact on the transition from start-up to a successfulnew firm. Actions associated with implementing a productive process,
developing a presence for the new firm, creating an organizational and
financial structure for the firm, during an intense investment of time
and money – facilitated by same industry work experience – seems to
be particularly important in the birth of a new firm.
Most important – and encouraging – anybody can do this. There
is no magic associated with being male; being White, Black or His-
panic; having more education; being wealthy; having experience with
other start-ups; having an “entrepreneurial personality”; or being in a
supportive environment. None of these individual attributes, percep-
tions or attitudes seem to make much difference once an individual
is involved in the start-up process. Any person with the knowledge,
skill, ideas, drive, and the ability to mobilize resources and organize a
business can create a new firm.
This project, though expensive, very labor intensive, and requiringconsiderable patience, has demonstrated the value of tracking a rep-
resentative sample of nascent entrepreneurs with a longitudinal study.
Implications for public policy are substantial. Efforts to increase the
firm birth rate to improve economic growth may not have the same
focus as those designed to help disadvantaged groups develop a role in
the economy through participation in entrepreneurship.
1.2 An Author’s Personal View
This brief text – brief in terms of the scope and importance of the topic –
has been written for two reasons. The first is to provide an overview of

7/18/2019 New Firm Creation in the United
http://slidepdf.com/reader/full/new-firm-creation-in-the-united 16/168
1.2. An Author’s Personal View 3
the nature of the business creation process as it existed in the United
States at the end of the 20th century. The second is to make clear
the nature and significance of the contribution of the EntrepreneurialResearch Consortium, the organization responsible for the implementa-
tion of the first Panel Study of Entrepreneurial Dynamics.
The Panel Study of Entrepreneurial Dynamics [PSED], as it is now
called, was the result of the collective efforts of the Entrepreneurial
Research Consortium, led by Nancy Carter, Bill Gartner and me, Paul
Reynolds. It eventually involved over 120 individuals and 34 mem-
ber units and raised $620,000 to implement this research program.These funds were supplemented by two NSF grants, one provided to
Nancy Carter (NSF Grant SBR-9809841) for an over-sample of women
nascent entrepreneurs and the other to Patricia Green (NSF grant SBR-
9905255) for an over-sample of minority nascent entrepreneurs. The
design was an initial screening to locate nascent entrepreneurs followed
by a detailed initial and three follow-up interviews. The project was
completed with substantial support from the Ewing Marion Kauffman
Foundation after data collection responsibilities were shifted from the
University of Wisconsin Survey Research Laboratory, following its clo-
sure, to the University of Michigan Institute for Social Research. The
final versions of all data sets and descriptions on the public domain
website [psed.isr.umich.edu] have been well developed and maintained
by Richard Curtin.1 A replication, PSED II, was initiated in 2005 with
primary support from the Ewing Marion Kauffman Foundation and
supplement funding from the US Small Business Administration.2
There are now dozens of peer reviewed journal articles, working
papers, dissertations, scholarly monographs and the like that describe
the rationale, research procedures, and analysis of data from PSED I.3
These documents make clear the relevance of the data to a wide range
of theories, hypotheses, and hunches regarding various aspects of the
1
A comprehensive overview of the project design is provided by Gartner et al. (2004).2 This is in the form of two grants, one to University of Michigan Institute for Social Research(Richard Curtin, Principal Investigator) to collect data and the other to Florida Interna-tional University (Paul Reynolds, Principal Investigator) to assist in the design of theproject and assessment of results, and to supervise an Advisory Committee.
3 A recent overview of scholarly work reflecting this research paradigm is provided byDavidsson (2006).

7/18/2019 New Firm Creation in the United
http://slidepdf.com/reader/full/new-firm-creation-in-the-united 17/168
4 Introduction
entrepreneurial or firm creation process. There has not, however, yet
been a summary of the major focus of the project, a description of what
happens when one or more individuals develop and implement a newfirm. That is the focus of this book.
It is of some interest why no overview has been completed. There
are two procedural reasons and one, which predominates, related to the
dysfunctional nature of the scholarly reward system that has developed
in the social science research community. The first procedural reason
is straightforward, reflecting the complexity of the full PSED I data
set. Collecting the data involved screening 64,000 US adults, detailedphone interviews and questionnaires collected four times following the
screening interview. The final data file has over 5,000 variables on 1,281
individuals. While many researchers are familiar with parts of the data
set, very few are comfortable with the entire mass of items, variables,
skip patterns and the like. My role, as the coordinating principal inves-
tigator throughout the entire project, has given me a unique perspec-
tive and understanding of all major – and many minor – aspects of the
project design. It seems useful to provide this description – and a review
of the solutions to the many technical issues – before this knowledge
is lost.
The second procedural reason is time; it took over six years from
the inception of the screening interview to the completion of the fourth
round of data collection and creation of the final data sets for analy-
sis. As the ERC was organized two years before the screening began,
the gap from initial commitment to the capacity for complete analysiswas almost a full decade. Many of the original ERC participants have
been pursing other research options since the program began and many
of the most recent analyses and publications have been completed by
scholars who had hardly entered higher education when the project was
initially proposed. There has been no effort to provide an overview of
the entire project; some of the technical problems that required solu-
tion, described in the appendices, indicate why this is a complicatedchallenge.
The third problem is perhaps the most significant. The current
scholarly reward system places an almost pathological emphasis on
peer reviewed journal publications, and these collective products place

7/18/2019 New Firm Creation in the United
http://slidepdf.com/reader/full/new-firm-creation-in-the-united 18/168
1.2. An Author’s Personal View 5
great emphasis on “theory testing.” In most cases, this is generally in
the form of testing isolated hypotheses, hunches, or informed guesses,
rather than theorems or propositions derived from an explicit, formal-ized theory.4 It encourages researchers to pretend they are contributing
to a research agenda that has emerged within the scholarly commu-
nity – reflected in extensive literature reviews – and explicate specific
research objectives that can be “tested” with data. This leads to, as in
the case of the PSED I data, to a number of unrelated analyses, each
dealing with one or more specific processes or hypotheses: Does eth-
nic status affect entry into the start-up process? Does household wealthaffect success at completing the process with a new firm? Does a strong
internal locus of control influence firm growth aspirations? The result
is a great deal of detail regarding a large number of pieces of the puzzle,
but no effort to describe the overall puzzle itself.
In the philosophy of science this is referred to as “normal science,”
the process of adding bricks to a wall that composes “scientific con-
sensus.” It tends to distract individuals from the larger, more critical,
issue of just what the wall is for and why it is being built in a particular
location. This is, of course, the underlying issue in the development of
new paradigms, as so eloquently explicated by Kuhn.5 PSED I, as the
test bed for the Global Entrepreneurship Monitor research program,6
has clearly lead to a new paradigm for the study and understanding
of firm creation and the entrepreneurial processes; it would not have
occurred were the principals solely focused on “normal science.”
This text is designed to provide an overview of the business cre-ation process. This summary has required the resolution of a number
of technical and substantive issues in order to provide a comprehen-
sive description of the process itself. The details are provided in the
footnotes, endnotes, and appendices. As all of the interview schedules,
research procedures and data are in the public domain and available
at no charge, other scholars who would like to suggest other solutions
4 An introduction to forms of theories and basic issues in the creation of scientific knowledgeis provided in Reynolds (1971b).
5 Kuhn (1962).6 The data collection procedures are summarized in Reynolds et al. (2005). Major findings in
the first five years are presented in annual reports, available at ‘www.gemconsortium.org’:Reynolds et al. (1999, 2000, 2001, 2002, 2004a).

7/18/2019 New Firm Creation in the United
http://slidepdf.com/reader/full/new-firm-creation-in-the-united 19/168
6 Introduction
to these issues are welcome to plunge into the pool, but it may take a
while to learn how to swim in this data set.
While the total number of individuals that have contributed to thecreation of the PSED I project and the final version of the data set is
close to two hundred, the author takes full responsibility for the presen-
tation that follows. There are, as in most significant human endeavors,
many mistakes and oversights, but the design developed collectively by
the ERC in implementing PSED I seems to have avoided any mistakes
that would undermine the value of the basic contribution – provision
of the first empirically based description of the creation of a repre-sentative sample of new firms. The results can be extrapolated to all
new firms begun in the United States in 1998–2000. The impact and
repercussions of this project have been enormous and, in most cases,
positive.

7/18/2019 New Firm Creation in the United
http://slidepdf.com/reader/full/new-firm-creation-in-the-united 20/168
2New Firm Creation: Importance and Need
for More Details
Every day another 5,000 new firms are created in the United States;another 2 million each year. About a third have employees-called
“employer firms” by the Small Business Administration. Most of these
new business activities are new sources of traditional goods and ser-
vices; very few provide unique or innovative goods and services. Some
are growth oriented; most are not. New firms are, by and large, con-
sidered a good thing, and, in most parts of the world, both people and
their leaders celebrate when more new firms emerge.While new firm creation has been underway for thousands of years,
very little is actually known about just how the basic elements are
assembled to create a new source of goods and services.
There are a lot of questions about new firm creation:
• Are only special people – with “entrepreneurial personali-
ties” – genetically equipped to start new firms? Do they dothis by themselves or is a collective effort – a start-up team –
required?• Do some situations, locations or communities provide a more
fertile context for new firms?
7

7/18/2019 New Firm Creation in the United
http://slidepdf.com/reader/full/new-firm-creation-in-the-united 21/168
8 New Firm Creation: Importance and Need for More Details
• Are some people in a social context – perhaps a family sit-
uation that emphasizes small businesses – that encourages
them to create new firms?• How critical is money in the firm creation process?• Is there some special sequence of activities that should be
followed to create a new business?• If the business idea is the critical feature of firm creation,
how does it come about – is it a spontaneous flash of insight
or is it the product of detailed data collection and careful
assessment?• How long does the process take, from conception to the birth
of a new firm?• What proportion of start-up efforts actually become new
firms?• What is the impact of government policy and procedures on
firm creation? Can and do government programs help?
These are just some of the many questions that receive attention from
practitioners, policy analysts, and scholars.
The lack of answers to these questions is not due to a shortage
of speculation – or theory – about why people start new firms; the
amount of writing is substantial – and grows every day. While scientific
understanding can be advanced when theories are developed and tested,
there are many phenomena where the absence of precise descriptions of
the phenomena itself can hamper the development of useful “theories”or “explanations.” It is hard to create a theory that makes precise
predictions when “what is to be explained” is vague or amorphous.
Regarding firm creation, there has been a lack of reliable informa-
tion on:
(1) Who becomes involved in the business creation process?
(2) What they do?(3) Which of them complete the process with a going concern?
Ideally this information would be available from a sample that rep-
resents the adult population and provides the potential for making

7/18/2019 New Firm Creation in the United
http://slidepdf.com/reader/full/new-firm-creation-in-the-united 22/168
2.1. What Does the Start-Up Process Look Like? 9
estimates about all nascent entrepreneurs and all new firms in the
United States.
A big step in filling this lacuna was the development and imple-mentation of the first US Panel Study of Entrepreneurial Dynamics
[PSED I]. This project was the first large scale attempt to develop a
representative sample of the US business creation process. Individuals
were identified in the start-up phase and tracked – with follow-up inter-
views – as they pursued business creation and their efforts resulted in
a new firm, disengagement from the start-up process, or a continued
effort to create a new firm. This report provides an overview of themajor results from this project; it focuses on providing a description of
how new firms are created.
2.1 What Does the Start-Up Process Look Like?
The simplest formulation presents firm creation as part of the business
life course, which can be considered to have a series of stages, presented
in Figure 2.1: conception, start-up process, new firm, established firm,
and termination. These stages are separated by various transitions,
some of which are less precise than others. For example, the shifting
from conception to active efforts to start a firm may be gradual, as may
be the transition from a new firm to an established firm. In such cases,
it may be difficult to identify with clarity those events or activities that
would reflect a precise “phase change.”
The most precise transition may be from the start-up process toa new firm, the “firm birth transition.” This shift, however, lacks any
Fig. 2.1 Business life course

7/18/2019 New Firm Creation in the United
http://slidepdf.com/reader/full/new-firm-creation-in-the-united 23/168
10 New Firm Creation: Importance and Need for More Details
single event that clearly defines the phase change. Many businesses
will keep and frame the first dollar of income, reflecting what might be
considered the “birth event.” There are, however, a variety of differentindicators that a start-up has become an operating new firm – the
first hire, the first month profits occurred, first tax filing, and the like.
Equally amorphous is the transition out of the start-up process by
those who are no longer interested in creating a new firm. Nascent
entrepreneurs may be slow to recognize that their start-up initiative has
dissolved. This is similar to the diffuse nature of a business termination;
it may take years for all traces of an established firm to disappear.A large number of research projects have attempted to determine
the unique features of growth businesses; some have compared oper-
ating businesses that differ in age – often using imprecise indicators
of a firm birth: “When was your business established?” Analysis pro-
ceeded by comparing firms of different ages – or size – and the absence
of data on those that have not survived – or not grown – complicated
inferences about causal processes. There were also a number of longitu-
dinal studies where the same firms provided data at different points in
time. Some of these projects tried to capture new firms and follow them
through the early stages of the business life course. The “birth event” in
such studies can be very imprecise, often reflected as the initial listing
in a business registry or a credit rating file. The value of information
about activities prior to the “birth event” is limited by the absence of
comparisons with active start-ups that failed to become operating new
firms.What was distinctive about the PSED I project was the effort to
capture the process from conception and to develop descriptions of
the activities during the start-up process. This allowed comparisons of
those who entered the process – nascent entrepreneurs – and launched
a new firm with those who quit midway through the start-up effort.
The US PSED I, and the comparable efforts in other countries, were
the first attempts to systematically capture the firm creation processfrom the very beginning.
The results are striking, for they reveal a substantially greater
scope of activity than expected; the diversity in the process is over-
whelming. About one-third of the nascent entrepreneurs succeeded in

7/18/2019 New Firm Creation in the United
http://slidepdf.com/reader/full/new-firm-creation-in-the-united 24/168
2.1. What Does the Start-Up Process Look Like? 11
implementing new firms and this assessment will summarize their dis-
tinctive features.
A conceptualization of the process, and a summary of many factorsand processes expected to have an impact on the firm creation transi-
tions is provided in Chapter 3. The firm creation process itself is divided
into two parts, entry into a start-up effort and completion of the start-
up effort with a new firm. Entry into the process, from conception to
being an active nascent entrepreneur, is the focus of Chapter 4. Com-
pletion of the process – with a new firm or disengagement – is reviewed
in Chapter 5. An overview of the major features and a commentary onthe implications is provided in Chapter 6. Following the references is
a list of published works based on PSED I. Methodological appendices
describe some of the more esoteric manipulations required to clarify the
patterns in the data. For those that wish to complete their own analysis
of the PSED I data set regarding these issues, a complete listing of all
cases in the nascent cohort, identified by ID number, and their status
at the end of six years is provided in the Appendix.

7/18/2019 New Firm Creation in the United
http://slidepdf.com/reader/full/new-firm-creation-in-the-united 25/168

7/18/2019 New Firm Creation in the United
http://slidepdf.com/reader/full/new-firm-creation-in-the-united 26/168
3Conceptualization of the Process
Creation of a new firm is a two-step process; entry into the start-upprocess is followed by the actual creation of a new business. Most of
the assessments, theories, conceptualizations, models, or perspectives
on new firm creation make no attempt to separate these two transitions.
As a result, there is considerable ambiguity about how different factors
may affect the actual creation of a new firm. Some may have more
influence on the decision to participate in the start-up process; others
may have more impact on the completion of the start-up process.It is useful to place the business life course, presented in Figure 2.1,
into a slightly broader context. Assuming that the key element in the
firm creation process is the individuals who enter into the start-up
process, the question becomes, where do they come from? Two possible
sources are shown in Figure 3.1.
One major source of start-up participants, individuals making the
first transition, are those who emerge from the adult population
and begin, on their own, to create a new firm – labeled as nascent
entrepreneurs. The other source is individuals working for existing firms
who are expected, as part of their regular jobs, to work on the creation
of a new business – labeled nascent intrapreneurs. As a substantial
13

7/18/2019 New Firm Creation in the United
http://slidepdf.com/reader/full/new-firm-creation-in-the-united 27/168
14 Conceptualization of the Process
Fig. 3.1 Business life course and context
proportion of start-ups are team efforts, a given initiative could involveboth nascent entrepreneurs and nascent intrapreneurs.
One unresolved issue is the criteria for determining if a start-up
has completed the transition to a new firm. Established firms can be
characterized by a number of properties. When there is evidence of an
intention to engage in business activity, the consolidation and coordi-
nation of productive resources, economic exchanges with others (sup-
pliers, customers, employees) and social recognition as a business entity
there is no question about its existence (Carter, Gartner, and Reynolds,
Chapter 28).1 On the other hand, it may take a while for the transi-
tion from start-up to new firm to be completed and there is substantial
merit to the use of a single criterion to provide a uniform “birth date.”
Reports that the start-up has become an operating business are one
possible indication of a firm birth and will be utilized in the assess-
ments that follow.
The entire process can be considered to take place within a givensocial, political, economic, or historical context. This may vary across
1 In this chapter the major sources, identified by author and chapter number, are fromGartner et al. (2004).
7/18/2019 New Firm Creation in the United
http://slidepdf.com/reader/full/new-firm-creation-in-the-united 28/168
3.1. Socio-Cultural Characteristics 15
communities or regions or cultural groups within a country or across
nations.
Major factors that might affect the two transitions can be consideredin broad categories.
• Socio-cultural characteristics.• Stable personal traits and orientations.• Immediate personal, social context.• Work career related experiences.
• Procedures, strategies, and resources associated with firmimplementation.
• Ambient social, cultural community context.• General and specific features of industry sector and compet-
itive situation.• Regional characteristics.
Many of the processes linking these factors to the emergence of a newfirm are summarized in the Handbook of Entrepreneurial Dynamics
(Gartner et al., 2004); this extensive overview is the primary basis for
the summary that follows. This work reflects the substantial contribu-
tions of the Entrepreneurial Research Consortium teams to the content
of the PSED I interview schedules.
3.1 Socio-Cultural CharacteristicsAge, gender, and ethnic identity are the most basic socio-cultural
characteristics. It is a major intellectual challenge to disentangle per-
sonal characteristics uniquely associated with these socially defined
attributes from other important capacities, traits, values, and expecta-
tions related to these features. For example, age can provide an indica-
tion of physical, intellectual, and emotional maturity as well as reflect
capacities associated with educational and work experiences. Gender,in a similar fashion, can reflect biological differences as well as dif-
ferences in life experiences and social expectations. Ethnic background
may reflect a diverse set of biological features, a different set of life expe-
riences that can create distinctive personal aspirations and obligations,

7/18/2019 New Firm Creation in the United
http://slidepdf.com/reader/full/new-firm-creation-in-the-united 29/168
16 Conceptualization of the Process
and responses to expectations from those outside the ethnic group that
can affect life course opportunities.
It is, therefore, complex to develop arguments, hypotheses or theo-ries related to these basic individual characteristics and their relation-
ship to participation in firm creation without incorporating secondary
attributes indirectly associated with age, gender, and ethnicity. Sec-
ondary features related to age, gender, and ethnicity for which other
direct measures may be superior indicators.
For example, young adults may have the interest and energy to enter
into the start-up process, but older adults may have the experience andmaturity to complete the process. There are clearly better measures of
experience, maturity, energy or interest than date of birth. It is reason-
able to speculate that younger adults have energy, optimism and, per-
haps, limited career options. Limited career options would suggest that
they have little to lose if the start-up is not successful; with fewer work
options they may be more likely to participate in a business start-up.
On the other hand, the absence of work experience, career stability, and
social maturity, all of which may increase with age, may reduce the suc-
cessful completion of a start-up with a new firm among younger adults.
These complex relationships are more common with arguments asso-
ciated with gender (Carter and Brush, Chapter 2). If women are more
risk averse, have less business experience – particularly as managers,
fewer role models for business creation, and more family responsibilities
as young and mid-career adults, they may be less likely to participate in
the start-up process. Further, it is suggested that the lack of well devel-oped networks in the business community and more difficult access to
financing may reduce the potential of women to finishing the start-up
process with a new firm.
Nothing is more complex than trying to separate ethnicity from
ancillary attributes (Green and Owen, Chapter 3). For example, it is
widely assumed that Blacks and American Indians may have completed
less schooling and have fewer years of work experience, as well as beingdependent on households and families with less income and wealth.
Most are assumed to be “native born,” i.e., they and their parents were
born in the United States. On the other hand, Hispanics and Asians
may be more likely to be immigrants. In that case, ethnic attributes

7/18/2019 New Firm Creation in the United
http://slidepdf.com/reader/full/new-firm-creation-in-the-united 30/168
3.2. Stable Personal Traits and Orientations 17
Table 3.1 Socio-cultural characteristics and firm creation transitions
Entry into the start-up process
Completion of the start-up pro-
cess with a new firmAge Highest when energy and
optimize peak and risk of loss isminimized
Increases with maturity andwork experience
Gender Conservative, few role models,mid life family obligations, andreduced work options
Lack of business networks, prob-lems in obtaining financing
Race and ethnicity Reduced work options, supportfrom ethnic group, high levels of motivation
Reduced experienced with USbusiness practices, lack of tradi-tional business networks, prob-lems in obtaining financing
may be co-mingled with attributes found among all recent immigrants –
whether from Asia, Latin America, or Europe.
In general, non-majority ethnic status is assumed to reduce options
in traditional work activity and to increase participation in start-up
processes. Those tendencies are enhanced among recent immigrants
and often encouraged by a distinctive ethnic group that has developedexpertise with business creation in a specialized sector (such as Korean
grocers in Los Angeles). At the same time, the lack of experience with
US business practices and reduced access to financing and traditional
business networks suggests that ethnic minorities may have trouble in
implementing new firms or, if established, the firms may be constrained
regarding growth.
Selected descriptions relating the socio-cultural characteristics to
the two stages of the start-up process are summarized in Table 3.1.
3.2 Stable Personal Traits and Orientations
It is widely assumed that those who implement and manage their own
businesses have unique or distinctive orientations, capacities, or per-
sonal traits, often summarized as an “entrepreneurial personality.” Such
an entrepreneurial personality may include unique sets of motivations,career objectives, entrepreneurial expectations and intensity, perceived
locus of control, a variety of social skills, economic sophistication, and,
perhaps, decision making styles and strategies for individual problem
solving. While these personal traits may change over the human life

7/18/2019 New Firm Creation in the United
http://slidepdf.com/reader/full/new-firm-creation-in-the-united 31/168
18 Conceptualization of the Process
course, they are generally assumed to be stable over the short or
medium term – years or decades.
Perhaps most basic is the notion that those with distinctivecareer orientations will gravitate to the firm creation process (Carter,
Gartner, and Shaver, Chapter 12). It is assumed that those with a
stronger interest in self-realization, financial success, social recognition,
meeting distinctive role expectations, implementing innovation, and
being independent and autonomous may be more likely to enter into
the start-up process. There is much less discussion of how a given set
of career goals may facilitate the actual creation of a new firm. It is rea-sonable to assume distinctive career objectives – if the new firm appears
to provide a way to achieve these outcomes – may enhance tenacity in
the start-up process or decrease the attractiveness of traditional work
options. This orientation, however, emphasizes the perceived attrac-
tiveness of an entrepreneurial career option compared with other labor
force activities. It does not consider the motives of those with no
other way of participating in the economy – necessity entrepreneurs
(Reynolds et al., 2002).
Two closely related attributes have been proposed as describing dis-
tinctive motives for entering the entrepreneurial process. Expectancy –
a belief concerning the likelihood that a particular act will be followed
by a particular outcome – can be measured in terms of entrepreneurial
career choices (Gatewood, Chapter 13). Measures of entrepreneurial
expectancy tend to emphasize the perceived consistency, or fit, between
the work role of an entrepreneur and the individual’s capacity to satisfytheir career goals. Hence, this feature is expected to have a major impact
on entry into the start-up process, whereas the impact on completing the
process with a new firm is primarily related to motivation. If a person
thinks that the work role of an entrepreneur will help them achieve per-
sonal goals they may be more tenacious about new firm creation.
Closely related to entrepreneurial expectancy – which empha-
sizes career direction toward entrepreneurship – is the concept of entrepreneurial intensity, defined as the level of commitment and
focus of an entrepreneur in leading a new start-up (Liao and Welsch,
Chapter 17). The focus of this measure is a determination of the
commitment and drive of the person to complete the start-up process
7/18/2019 New Firm Creation in the United
http://slidepdf.com/reader/full/new-firm-creation-in-the-united 32/168
3.2. Stable Personal Traits and Orientations 19
with a new firm. It would appear to be less related to predicting entry
into the start-up process itself.
Associated with the level of motivation would be confidence in thecapacity to create a new firm. If new firm creation is considered to
be an activity requiring a great deal of individual, autonomous effort,
then an “internal” locus of control – the extent to which people believe
they can influence the rewards they received from the external world –
may be stronger among those who enter the start-up process (Shaver,
Chapter 19). Its role in facilitating completion of a new firm is more
amorphous.Creating a new firm is very much a social activity, as success requires
a great deal of personal contact and the capacity to convince others to
contribute to an initiative with unproven potential. It is reasonable to
assume that those who are comfortable in social settings and have emo-
tional control and considerable self-confidence would be more effective
in completing the start-up process with a new firm (Baron, Chapter 21).
It is not clear, however, if this would have a major effect on entry into
the start-up process itself.
New firms are also basically new participants in an economic mar-
ket, and decisions must be made about the acquisition and allocation
of economic resources in changing situations. Those who have a bet-
ter grasp of the “economic value” of resources – their current market
value rather than their original cost – or the significance of sunk costs –
expenditures that cannot be recovered and are irrelevant to immedi-
ate decisions, should be more successful in implementing a new firm(Morgan, 2004, Chapter 20). It is not clear how this would be related
to entry into the start-up process.
Cognitive style refers to “consistent individual differences in pre-
ferred ways of organizing and processing information and experi-
ence” (Johnson, Danis, and Dollinger, 2004, Chapter 15). The Kir-
ton Adaptation–Innovation Inventory, one way to measure cognitive
style, assumes one’s style develops in childhood and remains the pre-ferred mode of problem solving throughout life, particularly in times of
stress. One application separates individuals as preferring – in response
to unsatisfactory outcomes – to focus on doing something different ver-
sus improving on the current strategy. If entrepreneurs are seen as
7/18/2019 New Firm Creation in the United
http://slidepdf.com/reader/full/new-firm-creation-in-the-united 33/168
20 Conceptualization of the Process
independent, then those preferring adaptive responses may be more
likely to enter the start-up process. Whether a new firm is established
may reflect whether the start-up is developing a new product or ser-vice – which may be facilitated by an adaptive style – or serving a well
established, traditional market – which may be facilitated by “doing
things better.” The impact of cognitive style, therefore, on new firm
success may be contingent on other aspects of the situation.
Based on a rational model, individual problem solving can be con-
sidered to have two steps – problem identification and problem solution.
As with other human activities, there may be substantial variation withhow individuals identify problems, the mechanisms they use to develop
solutions, and to what extent the individual experiences stress in the
process (Ford and Matthews, 2004, Chapter 18). It is appropriate to
assume that individuals who are more effective and comfortable with
identifying and solving problems may more successful at launching a
new firm from the start-up process. It is not clear if they are more likely
to enter the start-up process.
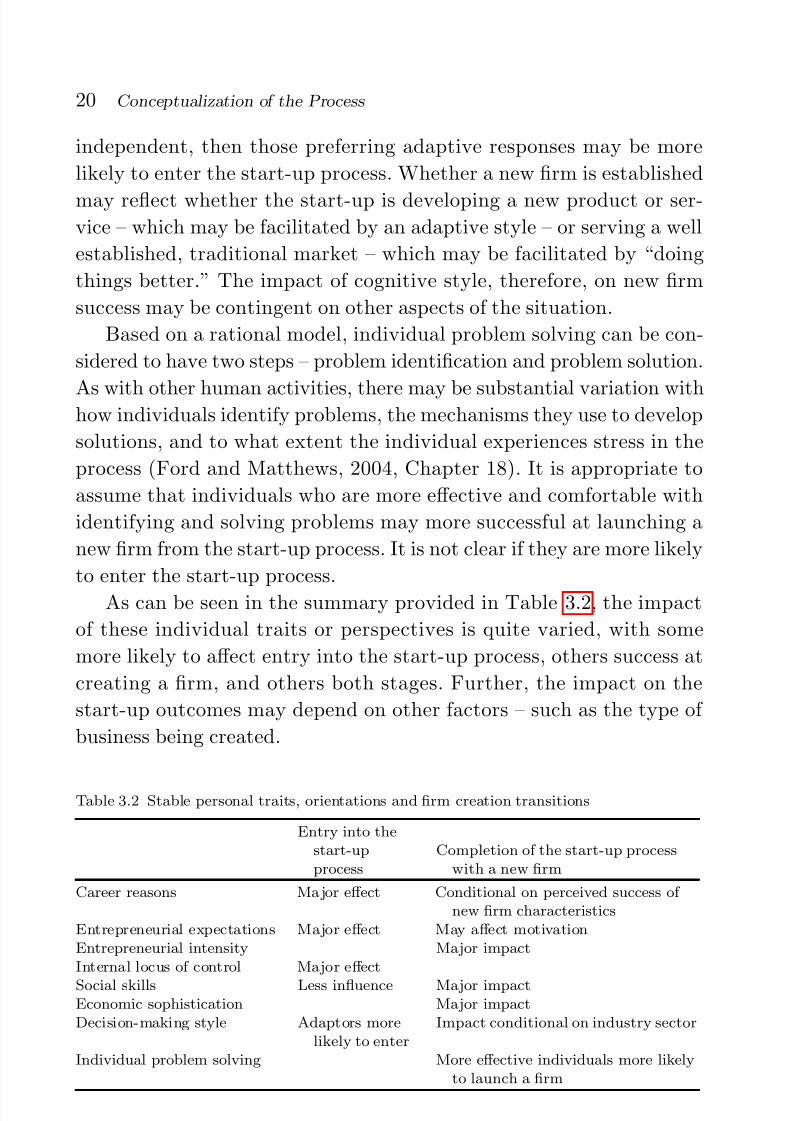
As can be seen in the summary provided in Table 3.2, the impact
of these individual traits or perspectives is quite varied, with some
more likely to affect entry into the start-up process, others success at
creating a firm, and others both stages. Further, the impact on the
start-up outcomes may depend on other factors – such as the type of
business being created.
Table 3.2 Stable personal traits, orientations and firm creation transitions
Entry into thestart-upprocess
Completion of the start-up processwith a new firm
Career reasons Ma jor effect Conditional on perceived success of new firm characteristics
Entrepreneurial expectations Major effect May affect motivationEntrepreneurial intensity Major impactInternal locus of control Major effect
Social skills Less influence Major impactEconomic sophistication Major impactDecision-making style Adaptors more
likely to enterImpact conditional on industry sector
Individual problem solving More effective individuals more likelyto launch a firm
7/18/2019 New Firm Creation in the United
http://slidepdf.com/reader/full/new-firm-creation-in-the-united 34/168
3.3. Immediate Personal, Social Context 21
3.3 Immediate Personal, Social Context
There are a number of features of an individual’s immediate personaland social context that might affect the firm creation transitions. These
may include their current household structure – the presence of wage-
earners, children or other dependents, access to economic resources con-
trolled within the household, family background and expectations, as
well as access to role models and potential social support. The immedi-
ate context can affect how individuals allocate their time and perceive
satisfaction.
Household structure covers many different aspects of one’s living
and family arrangements (Brush and Manalova, Chapter 4). Aside from
the individual’s marital status, the most basic may be household size.
Beyond that is the character of the dwelling population; number of
young children, adolescents, other dependants – such as the elderly,
and how many are making financial contributions to the upkeep of
the household. Unequivocal predictions of the effect of the household
structure on the firm creation transitions are difficult to develop, as theyseem to be related to other external factors. Married people may have
more access to networks and financial support to start a business, but
they may also have more family responsibilities. Larger household may
contain more wage earners and provide more economic resources; they
may also reflect more responsibilities and financial demands, reducing
the tendency to pursue a firm start-up. All these may vary by the gender
of the individual, as women may have more household responsibilitiesand less time to pursue a start-up; men feel more committed to support
a larger household and pursue start-ups to increase income.
No topic seems to get more attention regarding firm creation than
money; support at the beginning of the start-up process seems par-
ticularly important. There is a widespread assumption that access to
funds will facilitate new firm creation, and that both household income
and net worth are indicators of the availability of funds (Kim, Aldrich,
and Keister, Chapter 5). The nature and the strength of the impact
may vary for the two transitions. It is clear that most expect higher
household income and net worth to facilitate the firm birth transition –
the “liquidity effect,” but entry into the process is less obvious. On one
hand, households with more income and wealth can subsidize a member

7/18/2019 New Firm Creation in the United
http://slidepdf.com/reader/full/new-firm-creation-in-the-united 35/168
22 Conceptualization of the Process
as they are engaged in the start-up process, which can be a major fac-
tor in the decision to invest time and energy into an initiative with
an uncertain future. On the other hand, those in households with lessincome and wealth may be more motivated to purse a new firm as a
way of improving the household financial situation, particularly if they
feel responsible for the household economic well-being.
Aside from the impact of access to money, the tendency to create
a new firm may be affected by family influences; it is widely assumed
that the sons and daughters of the self-employed, small business per-
sons or entrepreneurs will themselves start new businesses (Matthewsand Human, Chapter 8). Such individuals may have the interest and
motivation to enter the start-up process – they are comfortable with
this career option – as well as the skills to be successful in implement-
ing a new firm – lessons learned at the dinner table. This perspective
can be expanded to include not just parents but other relatives, neigh-
bors, friends and other mechanisms of impact as well (Davidsson, 2004,
Chapter 16). These could include a positive impression gained from
observing others implement and manage their own businesses as well
as encouragement from personal social networks on entry into the start-
up process. This could encourage people to enter the start-up process
and motivate them to complete the process with a new firm.
Perhaps the most precise descriptions of how people are living
their daily lives come from time-use diaries, where people provide a
detailed account of activities engaged in during the day (Owen and
Greene, Chapter 9). These are typically sorted into “normal work days”and “typical days off” and activities may be timed down to 5 min
blocks, although 15 min segments provide reasonable levels of accu-
racy. As everyone is allocated the same amount of daily time – 24 h
or 1,440 min – there are no obvious predictions associated with this
descriptive data. It is reasonable to assume that those emphasizing
household and child care activities may be less likely to pursue start-
ups. Perhaps those spending more time on a start-up are more likelyto complete the process with a new firm.
Satisfaction with life and satisfaction with a current job are of con-
tinuing interest in advanced economies; they have a modest positive
correlation (Johnson, Arthaud-Day, Rode, and Near, Chapter 14). It
is reasonable to assume that those who find that their current job
7/18/2019 New Firm Creation in the United
http://slidepdf.com/reader/full/new-firm-creation-in-the-united 36/168
3.4. Work Related Experiences 23
Table 3.3 Immediate personal, social context and firm creation transitions
Entry into the start-up
process
Completion of the start-up process
with a new firmHousehold structure Mixed MixedHousehold income,
net worthConditional Major facilitation
Family background Parents own businessexperience a majorimpact
Knowledge gained from parents amajor advantage
Role models,perceived socialsupport
Social networks encourageentry into process
Positive influence on completingthe process
Time use Time on family socialobligations reduces entryinto start-up process
More time on start-up improvespotential for new firm
Life/job satisfaction Reduced job satisfactionmay increase start-upparticipation
No clear impact
satisfaction is low and unsatisfactory may be more likely to pursue
other options, such as create a new firm. As low job satisfaction maylead to a reduced satisfaction with life overall, a change in career direc-
tions may be initiated to increase satisfaction on both dimensions. It
is not clear if or how job and life satisfaction might affect a successful
completion of the start-up process.
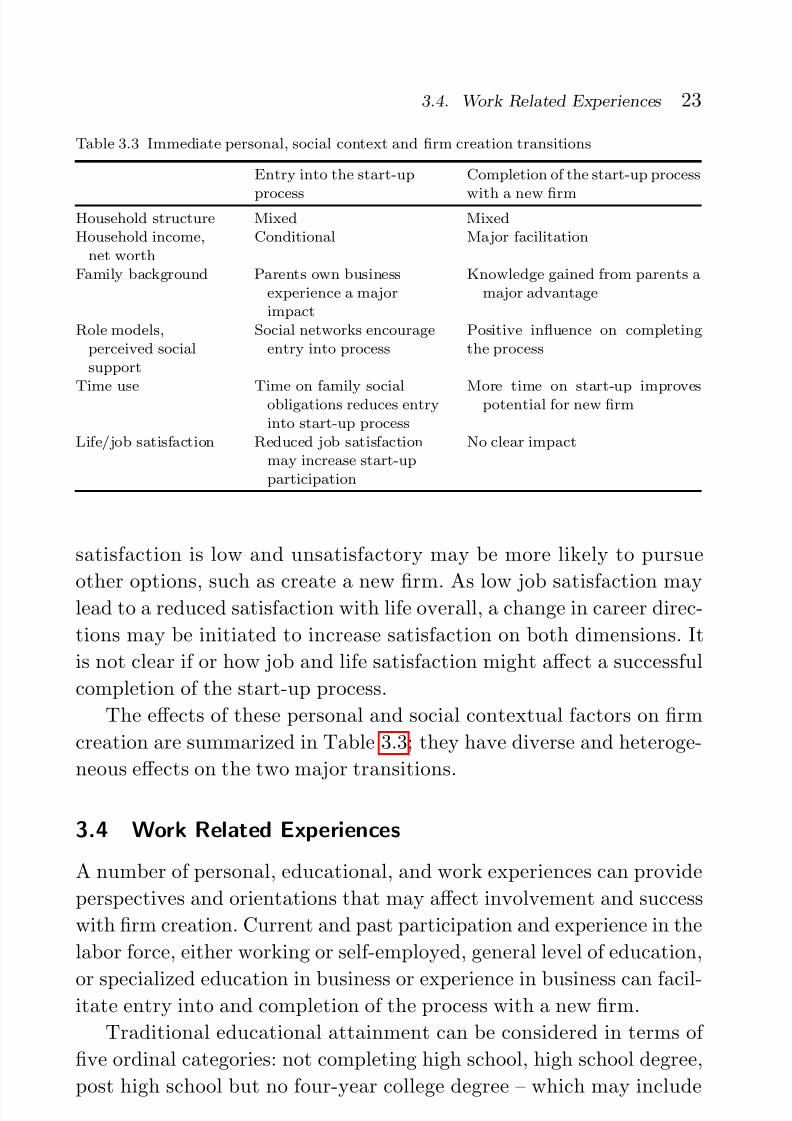
The effects of these personal and social contextual factors on firm
creation are summarized in Table 3.3; they have diverse and heteroge-
neous effects on the two major transitions.
3.4 Work Related Experiences
A number of personal, educational, and work experiences can provide
perspectives and orientations that may affect involvement and success
with firm creation. Current and past participation and experience in the
labor force, either working or self-employed, general level of education,
or specialized education in business or experience in business can facil-itate entry into and completion of the process with a new firm.
Traditional educational attainment can be considered in terms of
five ordinal categories: not completing high school, high school degree,
post high school but no four-year college degree – which may include

7/18/2019 New Firm Creation in the United
http://slidepdf.com/reader/full/new-firm-creation-in-the-united 37/168

7/18/2019 New Firm Creation in the United
http://slidepdf.com/reader/full/new-firm-creation-in-the-united 38/168
3.5. Procedures, Strategies, and Resources Associated with Firm Implementation 25
Table 3.4 Work career experiences and firm creation transitions
Entry into the start-up process
Completion of the start-up
process with a new firmEducationalattainment
General education may improve skilland confidence increasing participa-tion or increase work options andreduce participation
Education should improveskills and increase potentialfor firm creation
Diverse businessexperiences
More administrative and managementexperience may increase confidence
More administrative andmanagement experience mayincrease skills and success
Financialsophistication
May contribute to confidence to takeaction
Should increase success
Labor forceparticipation
Those employed may be in positionsto develop good business ideas andbusiness contacts, increasingparticipation.
Those unemployed may need workand be more likely to be involved
Business experience mayimprove potential for success
Workparticipationhistory
A history of work experience, self-employment and small business man-agement may increase involvement
More work, self-employmentand management experiencemay increase success
work or self-employment may further increase the tendency to become
engaged in a start-up. Previous work experience – either as an employee
or in self-employment – would be also expected to increase work-related
skills and confidence that would contribute to firm creation.
Table 3.4 provides an overview of selected work and career effects on
the process; the most critical impact would seem to be on the successful
completion of the process with a new firm, rather than a decision to
become involved with a start-up.
3.5 Procedures, Strategies, and Resources Associatedwith Firm Implementation
Once the start-up process is initiated, there is a wide range of activ-
ities or procedures that must be pursued to assemble the resources –financial and human – to develop procedures for providing goods or
a service. Many are interrelated or interdependent and may occur in
almost any sequence. Included are the development or discovery of
opportunities, a range of specific start-up activities, the development

7/18/2019 New Firm Creation in the United
http://slidepdf.com/reader/full/new-firm-creation-in-the-united 39/168
26 Conceptualization of the Process
of a team – present for about half of all start-ups, the use of social
networks as an informal source of guidance and support, the location
and use of formal programs to help new firms, development of fundingfor the new firm, identification and resolution of start-up problems, a
range of specific new firm characteristics (legal form, location, owner-
ship structure); expectations associated with the new firm as well as the
competitive strategy and utilization of new technology. The potential
impacts on the firm creation transitions are quite diverse.
Many suggest that opportunity recognition is a critical feature of
the entrepreneurial process, particularly when a unique or distinc-tive product or service is developed to serve new markets (Shane and
Venkataraman, 2000). Just exactly how the process actually works is
more complex, but opportunity recognition is a central feature of many
efforts to describe new firm creation (Hills and Singh, Chapter 24). As
a critical feature of the process, it is reasonable to assume that recogni-
tion of an opportunity perceived as “promising” is likely to encourage
individuals to enter into the start-up process. On the other hand, it
has been proposed that people often decide they want to create a busi-
ness, enter the process, and then – as a critical feature of the start-up
process – locate and define the business opportunity. It is reasonable
to assume that “better opportunities” will facilitate the attraction of
resources required to implement a new firm.
Start-up activities are those actions pursued to organize and imple-
ment a new firm (Gartner, Carter, and Reynolds, Chapter 26). There
are dozens of options, the exact mix depends on the nature of thefirm, market, and how the start-up evolves. They all have one feature
in common – occurrence after a decision has been made to enter the
business creation process. As a result, they have little impact on the
actual decision to enter the process itself. There is, however, consider-
able speculation – but little consensus – regarding the most appropriate
activities or the optimal sequence for facilitating the implementation
of a new firm. This will get considerable attention in Chapter 5.About half of all start-ups are team efforts; the development of
a start-up team can be a critical feature for the firm creation process
(Aldrich, Carter, and Ruef, Chapter 27). A team effort can provide both
a range of expertise – often critical for complex undertakings – and the

7/18/2019 New Firm Creation in the United
http://slidepdf.com/reader/full/new-firm-creation-in-the-united 40/168
3.5. Procedures, Strategies, and Resources Associated with Firm Implementation 27
presence of like-minded colleagues can reduce uncertainty and anxiety
associated with business creation. While the potential for a team effort
may encourage individuals to enter the start-up process, the majorfocus of research has been on how the structure and characteristics of
the team may facilitate a successful firm birth.
Closely related to working with a team is the help and assistance
that may be provided by others in one’s family, personal or work-
related networks; those persons who may provide guidance and support
that can facilitate completion of the firm creation process (Aldrich and
Carter, Chapter 29). These measures of a social network go somewhatbeyond asking if the nascent entrepreneur had received encouragement
and support sometime in the past – such as exposure to parents or
friends who managed small businesses – to development of detailed
measures about the current support and assistance. While expecta-
tions of a supportive social network may encourage a person to enter
the start-up process, most of the attention has been on the nature and
extent of a social network on facilitation of a new firm birth.
A complementary effort reflects attention to formal assistance, pro-
vided by programs sponsored by governments, educational institutions,
or other groups (Dennis and Reynolds, Chapter 30). It is generally
assumed, at least by politicians, that the existence of such programs
will encourage more people to enter the start-up process and, per-
haps, that the assistance provided will increase the chances of new firm
success.
Implementing a new firm requires financial support, and consider-able attention has been given to how new firms develop and utilize
financial sponsors (Stouder and Kirchhoff, Chapter 31). There is con-
siderable concern that anxiety about securing financial support may
discourage individuals from entering the start-up process. At the same
time the ability to assemble adequate resources is assumed to facilitate
the actual implementation of a new firm. Few topics associated with
new firm creation have received more attention than financial support.There are a number of features associated with any business that
may be related to the completion of the firm transition process, includ-
ing the type of economic activity (Standard Industrial Classification or
SIC code), the legal form, the nature of the ownership structure, as well
7/18/2019 New Firm Creation in the United
http://slidepdf.com/reader/full/new-firm-creation-in-the-united 41/168
28 Conceptualization of the Process
as the nature of the physical location (Reynolds, Chapter 23). There
are no, a priori , assumptions about the role of these features in enter-
ing the start-up process. In fact, there are few proposals regarding howthese basic characteristics might affect the creation of a new business.
In general, establishing these features – choosing a legal form, selecting
a site for the initial operation – are considered a necessary part of the
start-up but having no major impact on the entry into the process or
the final outcomes.
Those entering the start-up process may have diverse expectations
about the future development of the firm, once it is a going concern(Human and Matthews, Chapter 33). Some may prepare for a stable,
low risk operation that will be comfortable to manage and others may
plan and hope for a high growth trajectory that will have a major
impact on the market and, perhaps, generate significant wealth. Vari-
ations in expectations may affect the decision to participate in the
start-up process, but there may be a greater effect on the way in which
the start-up effort is pursued. For example, those planning for a high
growth, major impact new firm may devote more energy to developing
financial support and a complex ownership structure compared with
a person planning a new business that would be an extension of self-
employment or lifestyle firm. It is not clear which expectation is more
likely to lead to an operational new firm.
Closely related to growth expectations are the nature and scope
of problems encountered in the start-up phase (Brush and Manolova,
Chapter 25). The creation of a new firm always involves resolving prob-lems – or overcoming challenges – and these can involve both personal
challenges in learning how to be an effective entrepreneur-resource coor-
dinator as well as social challenges in establishing the new firm as a
credible business entity. It is clear that high growth aspirations will
increase the number and severity of these problems/challenges. Aware-
ness of the problems to be overcome may discourage entry into the
business creation process; the severity and number of such problemsmay reduce the capacity to launch a new firm.
One central issue associated with the launch of a new firm is the
strategy to be used to enter into and compete in the marketplace
(Stearns and Carter, Chapter 37). A great deal has been written about

7/18/2019 New Firm Creation in the United
http://slidepdf.com/reader/full/new-firm-creation-in-the-united 42/168
3.6. Ambient Social, Cultural Community Context 29
competitive strategies, usually associated with existing firms. Previ-
ous research on new firms has identified a range of emphases including
a focus on lower prices; better service; market responsiveness; tech-nological expertise; superior facilities and customer convenience; more
attractive, contemporary products; as well as new or advanced product
or process technology. The optimum mix of strategies may depend on
the specific business activity and the nature of the competition; there
are no unequivocal predictions about the effect on new firm creation.
Competitive strategies are not expected to have much impact on enter-
ing the start-up process.Closely related to competitive strategy is the emphasis on high tech-
nology as the primary focus of a new business (Allen and Stearns,
Chapter 38). Though rare, the capacity to use new and sophisticated
technology in innovative ways may encourage some to enter the start-
up process. The skill in commercializing the new technology may have
a substantial impact on the potential for implementing a new firm.
There are a range of expected impacts, mostly on completion of the
start-up process with a new firm, reflected in these different dimensions.
The effects are summarized in Table 3.5.
3.6 Ambient Social, Cultural Community Context
Both experience in and perceptions about the local community or
region can affect the firm creation transition. Many aspects of the expe-
riences in the region can be summarized by residential tenure – howlong the person has lived in the region. Judgments about the host com-
munity as a supportive context for entrepreneurship are summarized
with the conception of the “entrepreneurial climate.”
Discussion of residential tenure is complicated by an enduring focus
on international in-migration (Reynolds et al., 2004a, Chapter 6). It is
often assumed that new immigrants are often the most talented from
their home countries and wish to pursue new firm creation in theirnew homeland. Correlations between high rates of immigration and
new firm births often lead to the conclusion that the new immigrants
are creating new firms. While new immigrants may need work to sup-
port themselves and their families, it may be faster for them to create

7/18/2019 New Firm Creation in the United
http://slidepdf.com/reader/full/new-firm-creation-in-the-united 43/168
30 Conceptualization of the Process
Table 3.5 Resources, procedures, and strategies associated with firm implementation andfirm creation transitions.
Entry into the start-up process Completion of the start-upprocess with a new firm
Opportunityrecognition
Considered a precondition bymany
More promising opportunitiesshould increase probability of success
Start-up activities Appropriate mix of activitiesshould increase potential forfirm birth
Teams Creation of more complex andsophisticated firm may be facil-
itated by multi-skilled team
Social networks Informal help may providesupport to encourage enter intoprocess
Informal support may helpguide to firm birth
Knowledge and useof assistance
Knowing help is available mayencourage enter into start-up
Formal programs may provideexpertise and assistance thatwill promote firm birth
Funding the firstyear of business
Potential for funding mayencourage entry into start-up
Financial support may becritical
Nature of businessstart-up
Some legal and organizationalfeatures may be more helpfulthan others
Future expectationsfor the new firm
High aspirations mayencourage enter into process
Nature of expectations mayaffect how and when the firmis established
Start-up problems Prospect of multiple problemsmay discourage entry intoprocess
Problems may be unavoidable,but resolution necessary to cre-ate a new firm
Competitive strategy May be critical for successful
birth
Technologicalentrepreneurs
Entry may reflect desire topursue innovative technology
Skill at technology may affectpotential firm birth
income by taking a job. Some time is required for individuals to become
familiar with the local community and develop business networks that
can facilitate new firm creation; hence, immediate arrivals may not be
likely to immediately enter into the start-up process. Those with someexperience in the community may be more successful in completing the
start-up with a new firm.
An accepted view of the most appropriate work career path
may have developed in many communities, such as company towns

7/18/2019 New Firm Creation in the United
http://slidepdf.com/reader/full/new-firm-creation-in-the-united 44/168
3.7. Industry and Competitive Context 31
Table 3.6 Ambient social, cultural community context and firm creation transitions
Entry into the start-up process
Completion of the start-up
process with a new firmResidential tenure Immediate arrivals may be less likely
to enter processSome years required to develop
knowledge, contacts, and financialresources to enter start-up process
Longer residence facilitatesknowledge of local markets,competition, and businessnetworks
Perceptions of entrepreneurialclimate
Positive climate increasesparticipation
where everyone expects to work in an assembly plant, just like their
parents and grandparents. It is possible that communities vary in
terms of encouragement and support for entrepreneurial initiatives
(Carter et al., 2004, Chapter 35). The perception of the community
entrepreneurial climate can be considered to have three dimensions,
presence of community support, successful entrepreneurial models
among friends and family, and successful entrepreneurial models in the
community itself. All would be expected to increase participation in the
start-up process; the effect on successful completion with a new firm is
less certain.
A summary of the impact is provided in Table 3.6; major impact
would seem to be associated with entry into the process itself.
3.7 Industry and Competitive Context
New firms are implemented in specific communities in specific markets –
or industries, which can be considered the context for the new firm
birth (Matthews and Human, Chapter 36). These communities and
economic sectors may vary in terms of complexity and predictability,
which may have an impact on the strategy for implementing a new
firm or the success of the initiative. These variations may be relatedto perceptions of uncertainty regarding financial support, competitive
issues, or the capacity to develop effective operational procedures to
deliver the goods or services. Successful responses to these sources of
uncertainty can affect the success at creating a new venture (Table 3.7).

7/18/2019 New Firm Creation in the United
http://slidepdf.com/reader/full/new-firm-creation-in-the-united 45/168
32 Conceptualization of the Process
Table 3.7 Industry and competitive context and firm creation transitions
Entry into the
start-up process
Completion of the start-up process with a
new firmEconomic and communitycontext for entrepreneur-ship: perceived environ-mental uncertainty
Capacity for dealing with financial, com-petitive, and operational uncertainty canaffect potential for a successful firm birth
3.8 Regional Characteristics and Change
Several projects have considered the role of the economic context onnew firm births, focusing on US labor market areas as the unit of analy-
sis. In general, the findings are that greater population growth and more
indicators of urbanization appear to facilitate higher new firm birth
rates, measured as the number of new firms per 100 existing firms or
1,000 adults in the population (Reynolds et al., 1995, Armington and
Acs, 2002). These are reflected in tracking the nature of the county
in which a person may begin and complete the start-up process. Thegreater the population growth, the more there will be demand for goods
and services and the more opportunities for creating new firms to meet
this demand, often by those well established in the region. Established
residents are more likely to recognize a shortage of suppliers. There
is also evidence that more urbanized areas have both higher levels of
birth rates and more new firms; this seems to reflect a greater propor-
tion of young adults, those with higher levels of education, as well as
greater economic and cultural diversity and higher proportions of high
income households. The higher levels of new firm creation, however,
may increase the competitive pressures and reduce the potential for a
new firm launch (Table 3.8).
3.9 Overview
A very wide range of conceptual frameworks, theories, or hypothesesare related to speculation or predictions about the completion of the
firm creation process. The variety and scope is considerable but all
share several common features. First is a lack of precision about the
nature of the role in the new firm creation process, impact on entry

7/18/2019 New Firm Creation in the United
http://slidepdf.com/reader/full/new-firm-creation-in-the-united 46/168
3.9. Overview 33
Table 3.8 Regional characteristics and firm creation transitions
Entry into the start-up
process
Completion of the start-up process
with a new firmPopulation growth Reflects unmet demand and
perception of businessopportunities
Greater demand reduces price pres-sures and increased probability of afirm birth
Urbanization Greater cultural,technological, and productivediversity increases the rangeand uniqueness of demand,both scope and nicheopportunities, wide range of
other start-ups provide rolemodels for potentialentrepreneurs
Increase access to resources requiredas inputs – human, technical, finan-cial – facilitates organizing the newfirm productive processes; increasedcompetition may reduce successfulfirm creation.
into the start-up process or the completion of the process with a new
firm. This reflects, in part, the lack of attention to these details of the
process prior to the development of the first PSED project. Second,
each orientation or set of variables is considered in isolation, with little
attempt to specify their impact under different conditions or in relationto the impact of other processes or variables. Each is presented with
a tacit understanding that all other factors are held constant. Third,
there is little systematic discussion of the potential interaction between
different processes, such as how the presence of a start-up team may
ameliorate problems associated with obtaining enough funding for the
start-up.
As will be seen in the following chapters, the nature and directionof impact can vary substantially, as well as the relative importance
of different factors and their interaction. While the propositions and
proposals reflected in this brief review represent a useful first effort,
enhanced understanding of new firm creation requires a more complete
and nuanced multi-process assessment.

7/18/2019 New Firm Creation in the United
http://slidepdf.com/reader/full/new-firm-creation-in-the-united 47/168
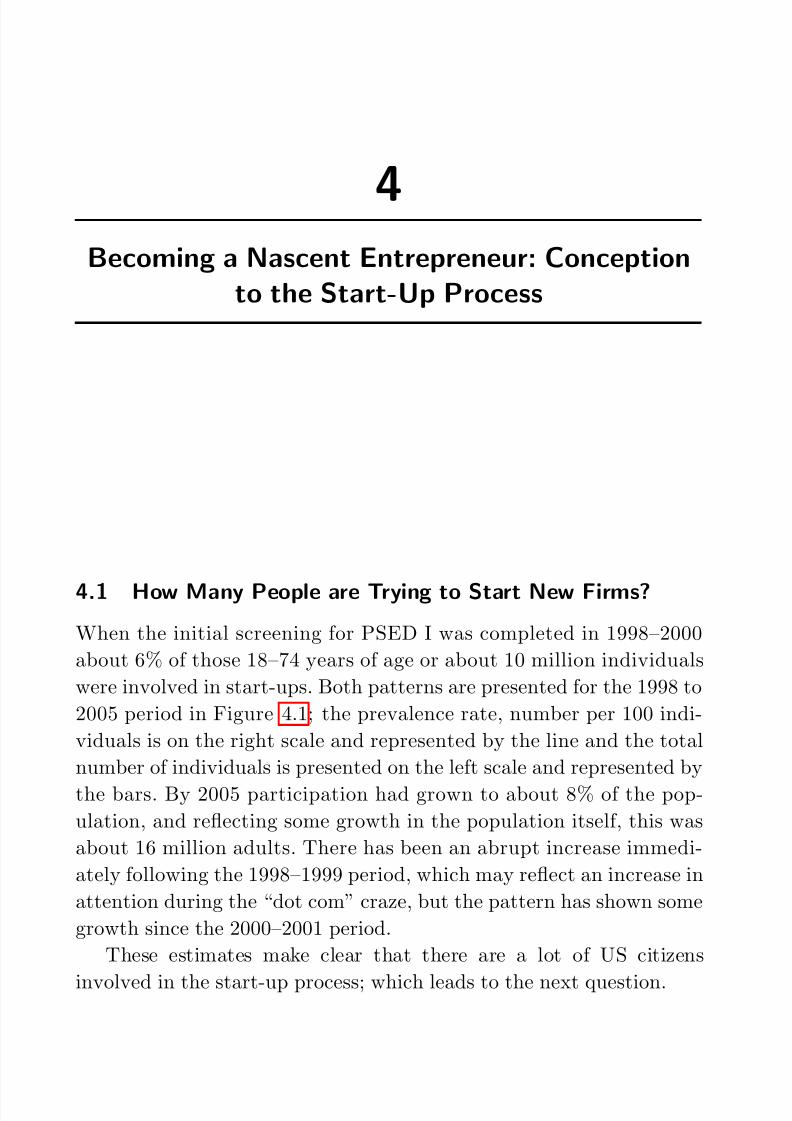
7/18/2019 New Firm Creation in the United
http://slidepdf.com/reader/full/new-firm-creation-in-the-united 48/168
4Becoming a Nascent Entrepreneur: Conception
to the Start-Up Process
4.1 How Many People are Trying to Start New Firms?
When the initial screening for PSED I was completed in 1998–2000
about 6% of those 18–74 years of age or about 10 million individuals
were involved in start-ups. Both patterns are presented for the 1998 to
2005 period in Figure 4.1; the prevalence rate, number per 100 indi-
viduals is on the right scale and represented by the line and the total
number of individuals is presented on the left scale and represented by
the bars. By 2005 participation had grown to about 8% of the pop-
ulation, and reflecting some growth in the population itself, this was
about 16 million adults. There has been an abrupt increase immedi-
ately following the 1998–1999 period, which may reflect an increase in
attention during the “dot com” craze, but the pattern has shown some
growth since the 2000–2001 period.
These estimates make clear that there are a lot of US citizens
involved in the start-up process; which leads to the next question.
35

7/18/2019 New Firm Creation in the United
http://slidepdf.com/reader/full/new-firm-creation-in-the-united 49/168
36 Becoming a Nascent Entrepreneur: Conception to the Start-Up Process
Fig. 4.1 US activity in business start-ups: 1998–20051
4.2 What Kind of People are Trying to Start New Firms?
No variables have more impact on participating in the start up process
than age and gender.2 The lines and diamonds in Figure 4.2 indicate
the participation rate, number per 100 as shown on the right scale, and
the estimated total numbers of individuals involved are represented by
1 Data for 2000 to 2003 is based on samples developed as part of the GEM research programwith samples of 5,018 for 2000 and 2001; 7,059 in 2002; 9,1997 in 2003; see references inChapter 1, footnote 6. Because of small sample sizes, data for 2000 and 2001 are combinedto reduce the sampling error. Data for 2004 is based on a special assessment with anational sample of 12,907 discussed in Reynolds (2007). Data for 2005 is based on theinitial screening for PSED II and sample of 26,759. Screening items used for all surveysare used to predict the level of “four-criteria” nascent entrepreneurs based on patterns
found in the post-1999 samples. These samples are used to estimate the proportion of PSED I screening respondents meeting four criteria as nascent entrepreneurs: (1) theyconsider themselves as working on a business start-up, (2) they report some activity inthe past 12 months, (3) they expect to own part of the business, and (4) the initiative isnot yet a going concern.
2 Variables chosen from the PSED I screening data set are listed in Appendix.4Ax.1. A morecomplete and detailed discussion of these issues is available in Reynolds et al. (2004b).
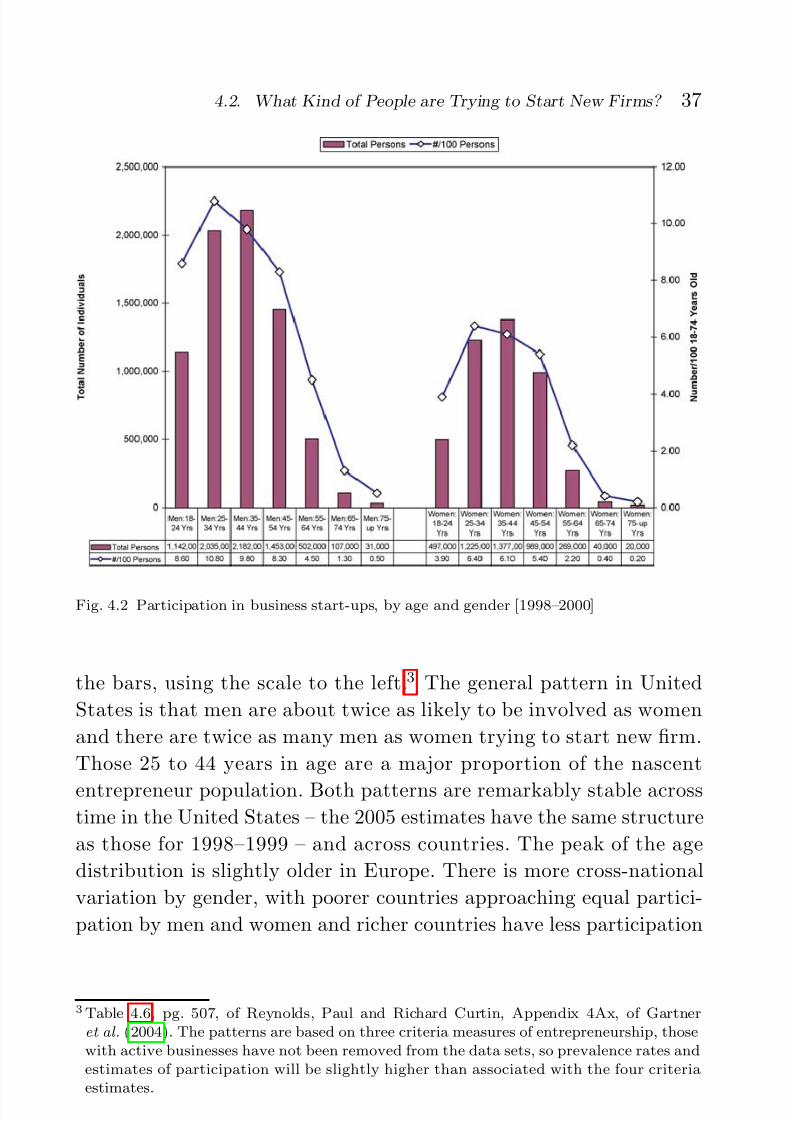
7/18/2019 New Firm Creation in the United
http://slidepdf.com/reader/full/new-firm-creation-in-the-united 50/168
4.2. What Kind of People are Trying to Start New Firms? 37
Fig. 4.2 Participation in business start-ups, by age and gender [1998–2000]
the bars, using the scale to the left.3 The general pattern in United
States is that men are about twice as likely to be involved as women
and there are twice as many men as women trying to start new firm.
Those 25 to 44 years in age are a major proportion of the nascent
entrepreneur population. Both patterns are remarkably stable acrosstime in the United States – the 2005 estimates have the same structure
as those for 1998–1999 – and across countries. The peak of the age
distribution is slightly older in Europe. There is more cross-national
variation by gender, with poorer countries approaching equal partici-
pation by men and women and richer countries have less participation
3 Table 4.6, pg. 507, of Reynolds, Paul and Richard Curtin, Appendix 4Ax, of Gartneret al. (2004). The patterns are based on three criteria measures of entrepreneurship, thosewith active businesses have not been removed from the data sets, so prevalence rates andestimates of participation will be slightly higher than associated with the four criteriaestimates.

7/18/2019 New Firm Creation in the United
http://slidepdf.com/reader/full/new-firm-creation-in-the-united 51/168
38 Becoming a Nascent Entrepreneur: Conception to the Start-Up Process
by women, particularly in Northern Europe.4 This reflects, in part, the
larger proportion of necessity entrepreneurs in poorer countries.
It is clear that there is no age or gender group where there is NOparticipation in business creation; although participation in start-ups
is relatively rare among those over 65 years of age, particularly for
women. On the other hand, business creation is clearly concentrated
among young and mid-career adults, those under 55 years of age. Those
nascent entrepreneurs 25–54 years old are 78% of all those involved in
business creation.
The impact of ethnic background on participation in business cre-ation is illustrated in Figure 4.3, for men, and Figure 4.4, for women.
The effect of ethnicity on participation is dramatic, with both Black and
Hispanic men more involved than White men. Because of small sample
sizes, differences among those over 64 years old are not statistically
Fig. 4.3 Participation in business start-ups: men by age and ethnicity [1998–2000]
4 Table 14, page 37, of Reynolds et al. (2004a).

7/18/2019 New Firm Creation in the United
http://slidepdf.com/reader/full/new-firm-creation-in-the-united 52/168
4.2. What Kind of People are Trying to Start New Firms? 39
Fig. 4.4 Participation in business start-ups: women by age and ethnicity [1998–2000]
significant. Black women are generally more involved than White
women, again the post 65 years old differences are not statistically
significant. Hispanic women, however, have an unusual pattern, those
18–24 are more active than White women, those 24–44 years of age are
about equal to White women, and those 45 and older are less activethan white women. It is not clear if this interaction effect between age
and participation among Hispanic women is a reflection of a major
cultural difference – older Hispanic women focusing on home and fam-
ily rather than work outside the home – or a cohort effect – Hispanic
women born before 1950 are less likely to pursue business start-ups as
a career option.
The effect of higher levels of participation by Blacks andHispanics on the numbers involved in entrepreneurship, as presented
in Figures 4.3 and 4.4, is less dramatic. As the majority of the
US population is white, they are the largest proportion – over
70% – of those in the start-up process. Black and Hispanic adults,

7/18/2019 New Firm Creation in the United
http://slidepdf.com/reader/full/new-firm-creation-in-the-united 53/168
40 Becoming a Nascent Entrepreneur: Conception to the Start-Up Process
Fig. 4.5 Participating in business start-ups, by gender, educational attainment, and ethnic-ity [18–54 Years old only, 1998–2000]
however, are clearly an important segment of the nascent entrepreneur
population.
The impact of educational attainment on participation in business
start-ups is dramatically affected by ethnic background, as shown in
Figure 4.5. As many older Blacks and Hispanics may not have beenable to pursue education, this presentation is restricted to those 18–54
years of age in 1998–2000, so most were born after 1945. Nonetheless,
there is a dramatic difference between Whites, Blacks, and Hispanics,
with an interaction associated with gender.
There is very little difference among White men with different lev-
els of education; those who did not complete high school participate at
the rate of 9 per 100, those with graduate experience at the rate of 11per 100. Among White women, there is generally a greater participa-
tion among those with more education, there is a slight jump among
those with graduate experience. Among Black and Hispanic men and
women there are much higher levels of participation in start-ups as

7/18/2019 New Firm Creation in the United
http://slidepdf.com/reader/full/new-firm-creation-in-the-united 54/168
4.2. What Kind of People are Trying to Start New Firms? 41
they complete more education. This is most dramatic among those with
graduate experience, where Blacks and Hispanics – men and women –
are twice as likely to be involved in a start-up as Whites with graduateexperience.
There has been much discussion about the impact of graduate expe-
rience on White women, and Black and Hispanic men and women
regarding start-up participation. The most common interpretation is
that this may reflect a restriction in career opportunities in existing
work organizations. This “glass ceiling effect” – or reduced opportu-
nities for promotion – may be a major motivation for creating a newbusiness.
Data from this large scale screening allows attention to a range of
other factors that may be considered associated with participation in
start-ups. These include findings that:5
• Minorities with higher household income seem to be more
likely to be involved in start-ups; the effect is more modest
among Whites.• Dwelling ownership seems to increase start-up activity only
for Black men.• Those with full-time or part-time jobs are much more likely
to be involved in start-ups than those not working – students,
housewives, retirees, the unemployed.• Marital status has little impact, but those married are gen-
erally more likely to be involved.• There is little impact of household size.• Those in households with young children are more likely to
be involved in start-ups.• Those living in more highly urbanized counties – with higher
per capita income, more young adults, more college gradu-
ates, and greater income disparity – are more likely to report
participation in a start-up; the overall effect is, however, notdramatic. The most urbanized counties are in the Northeast
and the South, least prevalent in the Midwest.
5 More details provided at Reynolds et al. (2004b).

7/18/2019 New Firm Creation in the United
http://slidepdf.com/reader/full/new-firm-creation-in-the-united 55/168
42 Becoming a Nascent Entrepreneur: Conception to the Start-Up Process
In general, then, a range of general socio-economic factors have been
explored using the full screening data set and the most significant indi-
vidual factors appear to be age, gender, ethnic background, and edu-cational attainment, with some distinctive and powerful interactions.
4.3 Life Context and Start-Ups
It is possible that a unique combination of factors can have a major
impact on whether or not a person becomes involved in a start-up. It is
clear that age, gender, and ethnic background are important, but whattypes of combinations have the greatest impact. These combinations
can be determined by organizing the data around a series of questions.
For example, What single factor would have the biggest impact on
predicting participation in a start-up?
In other words, if one could bet on who would be involved in a
business start-up and could get one piece of information before the
bet, what would be the best choice? The answer, it turns out, is the
age of the person. Knowing if they are more or less than 55 years of
age will be the biggest help in making the prediction.
What would be the second most useful item of information for pre-
dicting participation in a new firm start-up? Would it be gender, ethnic
background, amount of education, current participation in the labor
force? It turns out that this depends on the age of the individual. For
those under 55 years old, gender is the next most useful piece of infor-
mation to predict participation in start-ups, and men are more likelyto be involved than women. If they are over 55 years old, whether or
not they are engaged in full-time work is the most useful, as those still
engaged in full-time work are more likely to be involved in a start-up
initiative than those involved in part-time work or who are not in the
labor force because they are retired, homemakers, disabled, students,
and the like.
Such an analysis can be continued, with the number of groups mul-tiplying along with a greater level of detail about each of the subcate-
gories of persons. Two major results are provided by the analysis. First
is an estimate of the relative importance of the different factors included
in the analysis. Second is the identification of unique combinations of
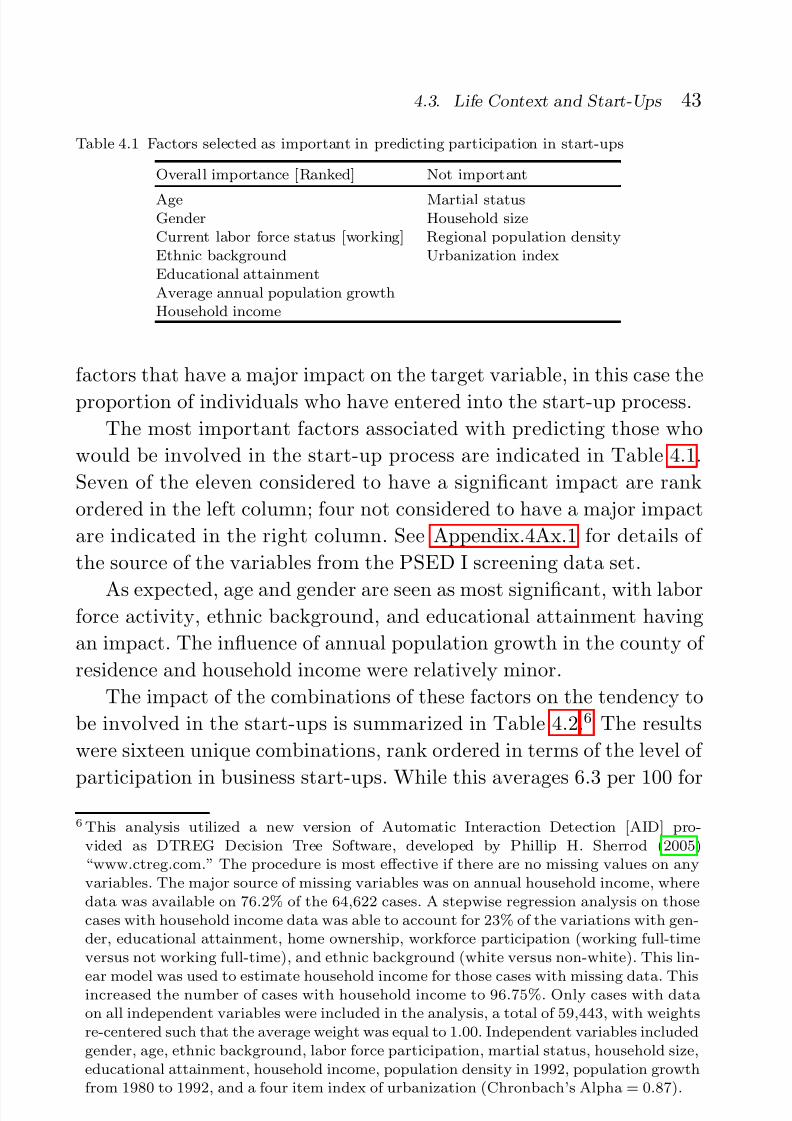
7/18/2019 New Firm Creation in the United
http://slidepdf.com/reader/full/new-firm-creation-in-the-united 56/168
4.3. Life Context and Start-Ups 43
Table 4.1 Factors selected as important in predicting participation in start-ups
Overall importance [Ranked] Not important
Age Martial statusGender Household sizeCurrent labor force status [working] Regional population densityEthnic background Urbanization indexEducational attainmentAverage annual population growthHousehold income
factors that have a major impact on the target variable, in this case the
proportion of individuals who have entered into the start-up process.
The most important factors associated with predicting those who
would be involved in the start-up process are indicated in Table 4.1.
Seven of the eleven considered to have a significant impact are rank
ordered in the left column; four not considered to have a major impact
are indicated in the right column. See Appendix.4Ax.1 for details of
the source of the variables from the PSED I screening data set.
As expected, age and gender are seen as most significant, with laborforce activity, ethnic background, and educational attainment having
an impact. The influence of annual population growth in the county of
residence and household income were relatively minor.
The impact of the combinations of these factors on the tendency to
be involved in the start-ups is summarized in Table 4.2.6 The results
were sixteen unique combinations, rank ordered in terms of the level of
participation in business start-ups. While this averages 6.3 per 100 for6 This analysis utilized a new version of Automatic Interaction Detection [AID] pro-
vided as DTREG Decision Tree Software, developed by Phillip H. Sherrod (2005)“www.ctreg.com.” The procedure is most effective if there are no missing values on anyvariables. The major source of missing variables was on annual household income, wheredata was available on 76.2% of the 64,622 cases. A stepwise regression analysis on thosecases with household income data was able to account for 23% of the variations with gen-der, educational attainment, home ownership, workforce participation (working full-timeversus not working full-time), and ethnic background (white versus non-white). This lin-
ear model was used to estimate household income for those cases with missing data. Thisincreased the number of cases with household income to 96.75%. Only cases with dataon all independent variables were included in the analysis, a total of 59,443, with weightsre-centered such that the average weight was equal to 1.00. Independent variables includedgender, age, ethnic background, labor force participation, martial status, household size,educational attainment, household income, population density in 1992, population growthfrom 1980 to 1992, and a four item index of urbanization (Chronbach’s Alpha = 0.87).

7/18/2019 New Firm Creation in the United
http://slidepdf.com/reader/full/new-firm-creation-in-the-united 57/168
44 Becoming a Nascent Entrepreneur: Conception to the Start-Up Process
T a b l e 4 . 2 P a r t i c i p a t i o n i n s t a r t - u p s : c h a r a c t e r i z a t i o n b y g r o u p f e a t u r e s
L a b e l
F i r s t l e v e l
S e c o n d l e v e l
T h i r d l e v e l
F o u r t h l e v e l
P r o p A c t i v e N
E s ( % )
A
1 8 – 5 4
y r s o l d
M e n
B l a c k
F u l l - t i m e , p a r t - t i m e w o r k
1 5 . 8
B
1 8 – 5 4
y r s o l d
W o m e n
B l a c k
B e y o n d H S d e g r e e
1 2 . 3
C
1 8 – 5 4
y r s o l d
M e n
W h i t e , H i s p a n i c , O t h e r
F u l l - t i m e , p a r t - t i m e w o r k
9 . 8
D
5 5 – 9 8
y r s o l d
F u l l - t i m e w o r k
B e y o n d H S D e g r e e
M e n
7 . 6
E
1 8 – 5 4
y r s o l d
M e n
B l a c k
N o t w o r k i n g
7 . 4
F
1 8 – 5 4
y r s o l d
W o m e n
W h i t e , H i s p a n i c , O t h e r
T o p 2 5 % i n p o p
g r o w t h
6 . 8
G
1 8 – 5 4
y r s o l d
M e n
W h i t e , H i s p a n i c , O t h e r
N o t w o r k i n g
5 . 7
H
1 8 – 5 4
y r s o l d
W o m e n
W h i t e , H i s p a n i c , O t h e r
B o t t o m 7 5 % i n p
o p g r o w t h
5 . 1
I
5 5 – 9 8
y r s o l d
F u l l - t i m e w o r k
U p t o H S d e g r e e
H H I n c a b o v e $ 5
0 k / y r
5 . 0
J
1 8 – 5 4
y r s o l d
W o m e n
B l a c k
U p t o H S d e g r e e
4 . 7
K
5 5 – 9 8
y r s o l d
F u l l - t i m e w o r k
B e y o n d H S d e g r e e
W o m e n
3 . 9
L
5 5 – 9 8
y r s o l d
P a r t - t i m e w o r k , n o t w o r k i n g
5 5 – 6 4 y r s o l d
B e y o n d H S d e g r e e
3 . 7
M
5 5 – 9 8
y r s o l d
F u l l - t i m e w o r k
U p t o H S d e g r e e
H H I n c b e l o w $ 5
0 k / y r
1 . 8
N
5 5 – 9 8
y r s o l d
P a r t - t i m e w o r k , n o t w o r k i n g
5 5 – 6 4 y r s o l d
U p t o H S d e g r e e
1 . 5
O
5 5 – 9 8
y r s o l d
P a r t - t i m e w o r k , n o t w o r k i n g
6 5 – 9 8 y r s o l d
M e n
0 . 9
P
5 5 – 9 8
y r s o l d
P a r t - t i m e w o r k , n o t w o r k i n g
6 5 – 9 8 y r s o l d
W o m e n
0 . 3
A v e r a g e v a l u e s / t o t a l s
6 . 3

7/18/2019 New Firm Creation in the United
http://slidepdf.com/reader/full/new-firm-creation-in-the-united 58/168
4.3. Life Context and Start-Ups 45
the entire sample, it is from 16 per 100 (15.8%) to virtually zero – 0.3%
or 3 per 1,000 – for these different groups. Table 4.3 presents selected
characteristics of the groups, such as their proportion of all nascententrepreneurs and the proportion of the total sample, which represents
the US adult population.
A second result of some importance is when different factors become
involved in the analysis. Age clearly has the most impact, but the
next two factors with significant impact are gender and whether or
not the person is engaged in full-time work. It is not until the third
round that ethnic background become important, and then only amongthose that are under 55 years of age. For those over 55 years, the most
important factors are either educational attainment or if they are over
65 years of age, withdrawal from the labor market, usually the retire-
ment transition.
By the fourth round of the assessment, a variety of factors become
involved for different subgroups, labor force activity, educational attain-
ment, household income, gender, and even population growth patterns
in the community – higher growth would provide for more business
opportunities.
It is useful to consider each of the groups separately. Consider, for
example, the most active group, A. These are Black men, 18–54 years
of age engaged in full or part-time work, where 15.8% – or one in six –
is involved in starting a new firm. This is closely followed by Black
women, group B. These women are 18–54 years old, have education
beyond high school, and 12.3% – or one in eight – report working on astart-up. While this is a high level of participation, these two groups,
A and B combined, are – as shown in Table 4.2 – 11% of those trying
to start new firms.
The largest single group of nascent entrepreneurs is in group C,
composed of White, Hispanic, and Other men, 18–54 years of age, and
engaged in full-time work. While 9.8% of this group – one in ten –
is active in a start-up, they consist of 46% of all those identified asnascent entrepreneurs.
This is somewhat higher than the next group, D, also men who are
over 55 years in age, engaged in full-time work, and have education
beyond high school. For this group, 7.6% are involved in start-ups, but
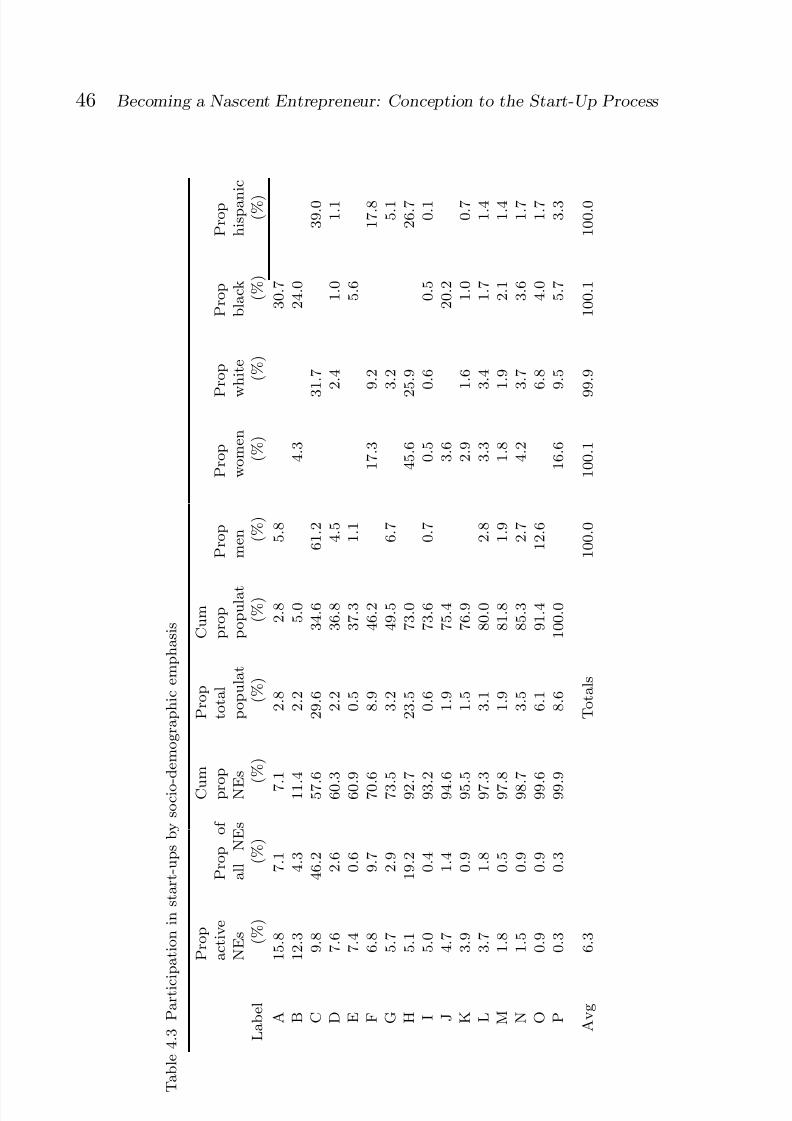
7/18/2019 New Firm Creation in the United
http://slidepdf.com/reader/full/new-firm-creation-in-the-united 59/168
46 Becoming a Nascent Entrepreneur: Conception to the Start-Up Process
T a b l e 4 . 3 P a r t i c i p a t i o n i n s t a r t - u p s b y s o c i o - d e m o g r a p h i c e m p h a s i s
L a b e l
P r o p
a c t i v e
N E s ( % )
P r o p o f
a l l N E s
( % )
C u
m
p r o p
N E
s ( % )
P r o p
t o t a l
p o p u l a t
( % )
C u m p r o p
p o p u l a t ( % )
P r o p
m e n ( % )
P r o p
w o m e n
( % )
P
r o p
w
h i t e ( % )
P r o p
b l a c k ( % )
P r o p
h i s p a n
i c
( % )
A
1 5 . 8
7 . 1
7 . 1
2 . 8
2 . 8
5 . 8
3 0 . 7
B
1 2 . 3
4 . 3
1 1 . 4
2 . 2
5 . 0
4 . 3
2 4 . 0
C
9 . 8
4 6 . 2
5 7 . 6
2 9 . 6
3 4 . 6
6 1 . 2
3 1 . 7
3 9 . 0
D
7 . 6
2 . 6
6 0 . 3
2 . 2
3 6 . 8
4 . 5
2 . 4
1 . 0
1 . 1
E
7 . 4
0 . 6
6 0 . 9
0 . 5
3 7 . 3
1 . 1
5 . 6
F
6 . 8
9 . 7
7 0 . 6
8 . 9
4 6 . 2
1 7 . 3
9 . 2
1 7 . 8
G
5 . 7
2 . 9
7 3 . 5
3 . 2
4 9 . 5
6 . 7
3 . 2
5 . 1
H
5 . 1
1 9 . 2
9 2 . 7
2 3 . 5
7 3 . 0
4 5 . 6
2 5 . 9
2 6 . 7
I
5 . 0
0 . 4
9 3 . 2
0 . 6
7 3 . 6
0 . 7
0 . 5
0 . 6
0 . 5
0 . 1
J
4 . 7
1 . 4
9 4 . 6
1 . 9
7 5 . 4
3 . 6
2 0 . 2
K
3 . 9
0 . 9
9 5 . 5
1 . 5
7 6 . 9
2 . 9
1 . 6
1 . 0
0 . 7
L
3 . 7
1 . 8
9 7 . 3
3 . 1
8 0 . 0
2 . 8
3 . 3
3 . 4
1 . 7
1 . 4
M
1 . 8
0 . 5
9 7 . 8
1 . 9
8 1 . 8
1 . 9
1 . 8
1 . 9
2 . 1
1 . 4
N
1 . 5
0 . 9
9 8 . 7
3 . 5
8 5 . 3
2 . 7
4 . 2
3 . 7
3 . 6
1 . 7
O
0 . 9
0 . 9
9 9 . 6
6 . 1
9 1 . 4
1 2 . 6
6 . 8
4 . 0
1 . 7
P
0 . 3
0 . 3
9 9 . 9
8 . 6
1 0 0 . 0
1 6 . 6
9 . 5
5 . 7
3 . 3
A v g
6 . 3
T o t a l s
1 0 0 . 0
1 0 0 . 1
9 9 . 9
1 0 0 . 1
1 0 0 . 0

7/18/2019 New Firm Creation in the United
http://slidepdf.com/reader/full/new-firm-creation-in-the-united 60/168
4.3. Life Context and Start-Ups 47
these late career individuals are only 2.6% of all those in the start-up
process.
Groups F and H are significant, for they are the non-Black women,18–54 years of age, who provide 38% of all nascent entrepreneurs. The
only difference is that women in Group F are in the top quartile (high-
est 25%) of the counties with the highest recent population growth,
and 6.8% are involved in start-ups; Group H women are in the other
three-quarters of the countries with lower population growth; 5.1% are
involved in start-ups.
The lowest participation, less than 2%, is found among groups M,N, O, and P. These groups are composed of those over 55 years of
age, some over 65 years of age, with little education or low household
income. These four groups are less than 2.5% of all those involved in
the start-up process, but are 20% of the US adult population.
This assessment clarifies a major issue associated with selecting
career options – that it is both an individual’s background and situa-
tion that have an impact on the decision to become involved in the cre-
ation of a new firm. Many of these individual characteristics, however,
can reflect a range of attributes. Consider age. Older adults are less
likely to become involved in a start-up, but they are also more likely to
have completed a satisfying career or accumulated personal wealth that
reduces the incentive to enter into a new venture; they are also more
likely to have reduced energy and more health concerns that reduce the
drive to implement a demanding new initiative. Women are less likely to
be involved in a start-up, but this may reflect less work experience andother life responsibilities – such as raising a family when they are 25–40
years old, the age at which business creation is the most prevalent.
The analysis makes clear the unique situation of Black men and
women, who seem to be predisposed toward involvement in start-ups,
regardless of other factors. This may reflect a general dissatisfaction
with career options available through typical work organizations.
While the capacity to analyze a representative sample of 60,000 todetermine which individuals are involved in the start-up process has
many advantages, the small number of variables – most of which are
traditional socio-demographic characteristics – is a major limitation.
The results are able to account for 2.3% of the variance, which suggests
7/18/2019 New Firm Creation in the United
http://slidepdf.com/reader/full/new-firm-creation-in-the-united 61/168
48 Becoming a Nascent Entrepreneur: Conception to the Start-Up Process
that a number of other factors may have a role in affecting the decision
to become involved in a business start-up. It is useful, therefore, to
have the capacity to compare nascent entrepreneurs and representativesample of those not involved in business creation using a wider range
of measures.
4.4 Comparison Group Data
There is a great deal of speculation regarding the unique features or sit-
uations of those who chose to work on business creation. As summarized
in Chapter 3, they cover a range of topics, such as the individual socio-
demographic background, current social and work life setting, personal
traits and orientations, as well as the business and economic context. To
explore the potential impact of such factors, the PSED I design involved
a selection of two types of individuals. First, those active in the creation
of a new firm – the nascent entrepreneurs discussed above. Second, a
sample of those not involved in new firm creation, a group considered to
represent typical US adults. For individuals in both groups specializedinformation was obtained related to a wide range of attributes.
This information is useful in determining the unique and distinc-
tive features of those involved in the firm creation process. The results
can be summarized as a series of comparisons, such as that related to
current social and work life context in Table 4.4.7
These comparisons are based on a simple comparison of distribu-
tions between these two types of individuals and with a relative smallsample size, so some differences found to be statistically significant in
the large screening sample of over 60,000 are not significant in this
assessment. A good example is household size and household income;
both had statistically significant impacts with the large sample but not
with this specialized comparison. This is an indicator of the modest
level of impact of these factors.
It should be noted that the comparison of household net worth
involved six categories, and the difference was due to the larger
proportion of those with negative or very low household net worth
7 For this and the remaining tables in Chapter 4, the details of the sources and results areprovided in Appendix.4Ax.2.

7/18/2019 New Firm Creation in the United
http://slidepdf.com/reader/full/new-firm-creation-in-the-united 62/168
4.4. Comparison Group Data 49
Table 4.4 Nascent entrepreneurs and current social, work life context
Statistically significant differences [0.05] Not statistically significant
Household net worth Household income
Married Household structure:
• Household size: all ages• Household size: adults only• Kids, dependents in household• Adults earning money
Time spend on work during last day off Time spend on work on last regular workday
More satisfied with most recent job More satisfied with life overall
Career mentors in social networks
• Smaller proportion reportany social network
• Smaller number of helpers
Less time living in the county Born outside the United States
Unless otherwise indicated, the statistical significance is at 0.05, using Chi Square ormean comparisons tests
(below $100,000) or a very high net worth (above $1,000,000) among
nascent entrepreneurs; a curvilinear relationship.Those active in start-ups were also more likely to report they worked
more hours on their last “day off” – but not on their last work day.
They also reported greater satisfaction with their most recent job but
were not more or less satisfied with life overall.
Perhaps surprising, when asked about those available to help them
with their careers – either in established roles or in starting a new firm,
those involved in a firm start-up were less likely to report there were
any mentors; those that did tended to report a small number.
The emphasis on immigration and entrepreneurship would suggest
that without immigration there would be little firm creation in the
United States. Yet there is no difference between nascent entrepreneurs
and the comparison group in the proportion born in the United States,
it is about 95% for both groups. While those starting a business report a
shorter residential tenure in the county compared with the comparison
group, 70% have lived in the county for more than five years and 53%for more than 10 years. Clearly, starting a business is not something
that people do as soon as they arrive in a new community.
The business background and contextual differences are presented
in Table 4.5. Judgments about community support were measured with

7/18/2019 New Firm Creation in the United
http://slidepdf.com/reader/full/new-firm-creation-in-the-united 63/168
50 Becoming a Nascent Entrepreneur: Conception to the Start-Up Process
Table 4.5 Nascent entrepreneurs and business background, experience
Statistically significant differences [0.05] Not statistically significant
Entrepreneurial climate:• Perceived less community
support
Entrepreneurial climate:• Family, friends as models• Role models in the community
Government, private helping programs:
• Knowledge of programs• Reports of contacts• Number of programs contacted
Family and friends encouraged a start-up Parents owned a business
Positive impression of business ownership
from family and friends
Worked for parents
Friends and neighbors owned businesses
More classes in general management More classes on human relations, financialmanagement
More classes in operational management
More years of general management workexperience
More years of operational managementwork experience
Prior 12 years before interview, years:• Full-time self-employment• Less time unemployed, not
seeking work• Less time unpaid volunteer
work• Less time homemaker• Less time retired• Fewer number of different
activities
Prior 12 years before interview, years:• Full-time employment• Part-time employment• Part-time self-employed• Full-time student• Part-time student• Unemployed, seeking work• Disabled, unable to work
Unless otherwise indicated, the statistical significance is at 0.05, using Chi Square ormean comparisons tests
reliable multi-item indices, and while there was no difference associated
with considering family and friends as role models or presence of role
models in the community, those starting businesses considered there
was less community support – helpful bankers or government agencies –
than those not creating new businesses. Perhaps their recent personalexperience in the start-up process affected these judgments.
Surprisingly, adults not involved in start-ups or new firms were just
as likely to know about public and private programs to help start-
ups and just as likely to have made contact; there was no significant
7/18/2019 New Firm Creation in the United
http://slidepdf.com/reader/full/new-firm-creation-in-the-united 64/168
4.4. Comparison Group Data 51
difference in the number of programs contacted. This probably reflects
a lack of information among the nascent entrepreneurs and previous
behavior of adults who were at one time interested in starting a busi-ness, but not pursing this at the time of the interview.
The effect of perceptions and experiences as they grew up seemed
to have a mixed effect. Those starting new businesses were no more
likely to report their parents owned and operated a business, to have
worked for their parents’ business(es) or to report their friends and
neighbors had businesses. On the other hand, nascent entrepreneurs
report more encouragement from friends and family and developed apositive impression of small business ownership from observing friends
and family with their own businesses.
There is substantial evidence that those starting businesses have
both more formal classes and more years of work experience in gen-
eral management and operational supervision. In providing an overview
of their labor force activity in the 12 years prior to the interview,
nascent entrepreneurs report more years of full-time self-employment,
less time unemployed and not seeking work, less time as unpaid volun-
teers, homemakers, or retired, and fewer number of different activities –
suggesting that they were in stable work roles in this period prior to
implementing a start-up.
Those starting new businesses are considered to have a wide range of
personal attributes, capacities, or orientations; comparisons on a wide
range of factors are provided in Table 4.6.
On a number of these factors nascent entrepreneurs may be unique.Their cognitive style is to improve on situations by doing things differ-
ently – rather than with more care. Nascent entrepreneurs rank higher
on two related measures, entrepreneurial intensity – a commitment and
focus toward entrepreneurial options – and entrepreneurial expecta-
tions – a belief that they have the capacity and drive to implement a
new firm. Career motivations show no differences related to an empha-
sis on self-realization, financial security, and independence, and less of a focus on achieving recognition, meeting role expectations, and an
interest in innovation.
Nascent entrepreneurs report greater personal confidence in social
settings, but no difference related to emotional control or shyness. They

7/18/2019 New Firm Creation in the United
http://slidepdf.com/reader/full/new-firm-creation-in-the-united 65/168
52 Becoming a Nascent Entrepreneur: Conception to the Start-Up Process
Table 4.6 Nascent entrepreneurs and traits, orientations, and attitudes
Statistically significant differences [0.05] Not statistically significant
Cognitive style• Prefers doing things differently
Greater entrepreneurial intensity
Higher entrepreneurial expectations
Career motivations, less focus on:
• Achieving recognition• Meeting role expectations• Innovation [0.07]
Career motivations, focus on:
• Self-realization• Financial security• Independence
Personal confidence in social settings Emotional control shyness
Prefers group, collective work activities Prefers high risk/high payoff firms
Prefers challenging, task focus problems Emphasis on high personal impact
In choosing an appropriate firm:
• Examines financial issues• Examines operational issues
Locus of control
Economic sophisticationFrequency of unpredictable situations atwork
Feeling overloaded at work
Strategies for difficult work problems:
• Problem identification versussolution development
Business problem solving
• Calculating versus intuitive
Unless otherwise indicated, the statistical significance is at 0.05, using Chi Square ormean comparisons tests
tend to prefer group, collective work activities and challenging, task
focused problems. There is no difference from other adults in terms
of a preference for high risk, high payoff firms or a strong personal
impact. In making a choice between two firms as a potential owner,
nascent entrepreneurs tend to focus more on financial and operational
issues than other adults.There is, however, a long list of traits on which there are no dif-
ferences between the nascent entrepreneurs and other adults, includ-
ing locus of control, economic sophistication, frequency of confronting
unpredictable situations at work, feeling overloaded at work, and

7/18/2019 New Firm Creation in the United
http://slidepdf.com/reader/full/new-firm-creation-in-the-united 66/168
4.5. Overview 53
strategies for difficult work problems or strategies for business prob-
lem solving.
Except that they are trying to create a new business, on manycharacteristics nascent entrepreneurs are a great deal like other US
adults.
4.5 Overview
There is no question that millions of US adults make the decision to
become involved in a business creation activity. Both the tendency to
become involved and the number of individuals seems to have increased
in the past eight years; there may be 16 million or more involved in the
start-up process in 2006.
Who makes the decision to become involved is another issue. It
is clear that a number of factors have a major impact on becoming
involved in a business start-up, including:
• Age• Gender• Current work activity• Ethnic background• Educational attainment
A range of other factors seem to have an influence, depending on the
unique situation, context, or alternatives of the individual.These moderating factors would include:
• Household income• Household net worth• Recent population growth in the local community• Extend and intensity of management and administrative
training and experience• Positive impressions and encouragement from family and
friends• Strong expectations and a commitment to entrepreneurial
career options

7/18/2019 New Firm Creation in the United
http://slidepdf.com/reader/full/new-firm-creation-in-the-united 67/168
54 Becoming a Nascent Entrepreneur: Conception to the Start-Up Process
There is, however, no clear or simple set of factors that are associated
with every decision to become involved in business creation.
Many are predisposed – by virtue of their unique background, lifestage, or current situation – to pursue a new start-up, but there are
unique features associated with every nascent entrepreneur that enters
the start-up process. What happens in the process and which actually
create new firms is the next part of the story.
7/18/2019 New Firm Creation in the United
http://slidepdf.com/reader/full/new-firm-creation-in-the-united 68/168
5Creating a New Business: Results from
the Start-Up
What happens as people start new businesses? What is the final out-come? How long does it take? What types of people complete the start-
up process to create a new firm? What do they do? Precise answers to
such questions require a careful selection of nascent entrepreneurs and
systematic follow-ups to determine their activities and the results of
their efforts. This was, of course, the major justification for the PSED I
project. The data from this representative sample of US start-ups can
be used to explore these issues.The outcomes – new firm, disengagement, or continuing with the
start-up– for nascent entrepreneurs entering the start-up process is pre-
sented in Figure 5.1.1
This exhibit presents the status of these start-up efforts over the first
ten years following conception. The initial bar indicates that 100% are
active in the start-up process and that after one month 1% have quit
and 2% report a going business. All 24 periods up to the end of year
six cover 3 month intervals, the last three periods 12 month intervals.
1 Development of the customized data set for the following analysis is described inAppendix.5Ax.1. The outcome status for every case in the data set is provided inAppendix.5Ax.2.
55

7/18/2019 New Firm Creation in the United
http://slidepdf.com/reader/full/new-firm-creation-in-the-united 69/168
56 Creating a New Business: Results from the Start-Up
Fig. 5.1 Start-up transitions, by time since conception
At the end of nine years and 12 months – or ten years – 37% report
they have left the process, 34% report a going business, 28% are still
active in the start up effort and 1% are not currently active in the start-
up process but will not admit that they have completely given up–the
undead, as it were.
2
As the actual data collection took place over afive year period, the status reported at the end of six years – or the
beginning of the seventh year – will be used for subsequent analysis.
The major finding, then, is that seven years after entering the firm
creation process, about one-third have quit, one-third report a going
business, and about one-third are still working on the start-up. Some
of the “still working on the start-up” group report that they have been
trying for 15 or more years. It would appear that for these nascent
entrepreneurs the start-up effort is an interesting hobby, not a serious
option for a work career.
2 There is little change in the pattern out to 20 years.
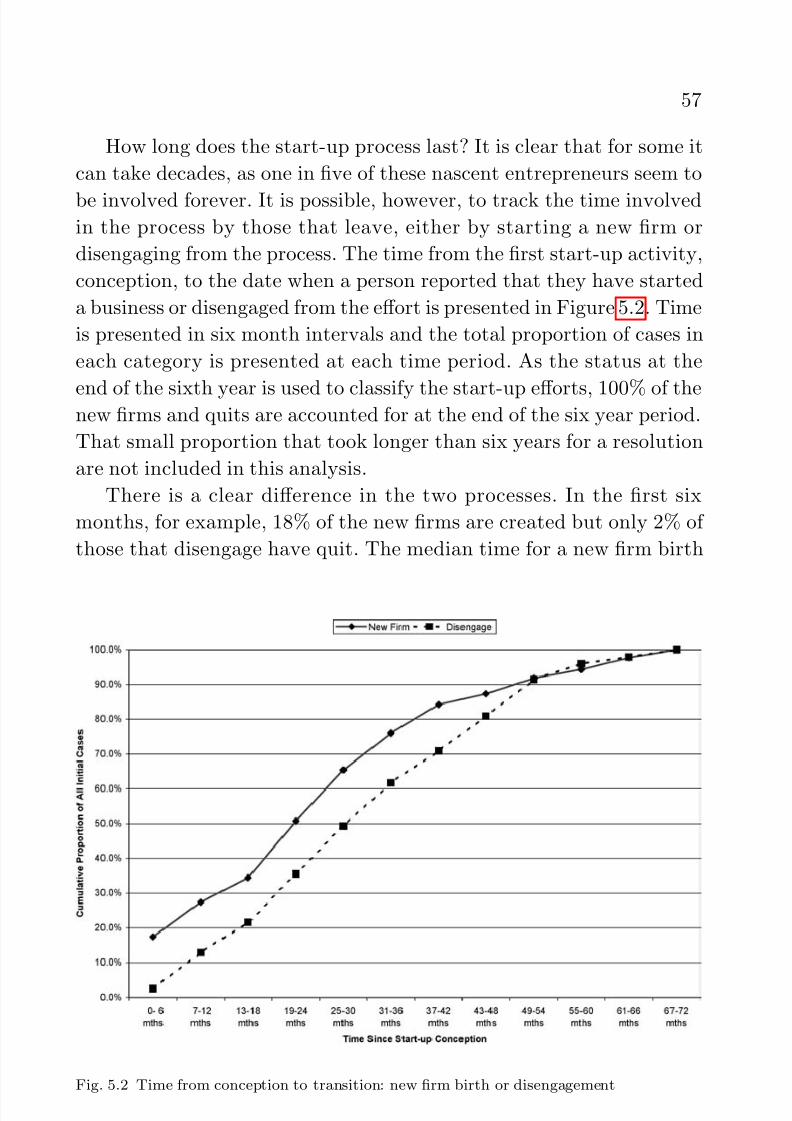
7/18/2019 New Firm Creation in the United
http://slidepdf.com/reader/full/new-firm-creation-in-the-united 70/168
57
How long does the start-up process last? It is clear that for some it
can take decades, as one in five of these nascent entrepreneurs seem to
be involved forever. It is possible, however, to track the time involvedin the process by those that leave, either by starting a new firm or
disengaging from the process. The time from the first start-up activity,
conception, to the date when a person reported that they have started
a business or disengaged from the effort is presented in Figure 5.2. Time
is presented in six month intervals and the total proportion of cases in
each category is presented at each time period. As the status at the
end of the sixth year is used to classify the start-up efforts, 100% of thenew firms and quits are accounted for at the end of the six year period.
That small proportion that took longer than six years for a resolution
are not included in this analysis.
There is a clear difference in the two processes. In the first six
months, for example, 18% of the new firms are created but only 2% of
those that disengage have quit. The median time for a new firm birth
Fig. 5.2 Time from conception to transition: new firm birth or disengagement

7/18/2019 New Firm Creation in the United
http://slidepdf.com/reader/full/new-firm-creation-in-the-united 71/168
58 Creating a New Business: Results from the Start-Up
is 19–24 months, but it is 25–30 months for disengagement – about six
months longer. By 36 months, 75% of the new firms are created, but it
takes 42 months for 75% of those who quit to disengage. By 48 monthsafter entry into the start-up the percentages are similar; 10% of the
start-ups and 10% of the disengagements take over four years.
That there are differences in the time to leave the process is not a
surprise, as it may take a while to determine that a given initiative is
not economically viable. It is useful, however, to have this more precise
information on the typical time required to exit the start-up process.
5.1 What Kinds of People Create and Types of Start-UpsBecome New Firms?
The critical issue, of course, is who finishes the process with a going
business. To explore this topic, those 200 that reported a going business
will be compared with the other 448; 222 that disengaged and 226 still
active in the start-up process after seven years. Information for the
comparison can be considered in seven categories:3
• Socio-demographic background• Current social, work life context• Personal traits, orientations, and attitudes• Business background, experience• Business, economic context• Business activity, investments• Ambient community
As before, those statistically significant factors can be compared with
those that indicate no statistically significant relationships. Details are
provided in the Appendix.5Ax.3.
The basic socio-demographic characteristics affecting entry into the
start-up process are presented in Table 5.1.
Remarkably, almost none have a statistically significant effect oncompletion of the process with a new firm. In fact, the two most
3 Data is taken either from the phone interview and mail questionnaires administered aspart of the PSED I initial interviews or, for ambient community measures, from federaldata on the counties in which the respondent was located.

7/18/2019 New Firm Creation in the United
http://slidepdf.com/reader/full/new-firm-creation-in-the-united 72/168
5.1. What Kinds of People Create and Types of Start-Ups Become New Firms? 59
Table 5.1 Firm creation and socio-demographic factors
Statistically significant
differences [0.05] Not statistically significantEthnicity Gender
Age at entry into the start-upAge, gender interaction (subgroups)Educational attainmentParents owned a businessWorked for parents businessFriends, neighbors owned businessEncouraged by friends, familyImpression of business ownership from friends, relatives
Years lived in countyYears lived in stateBorn outside the United States
Unless otherwise indicated, the statistical significance is at 0.05, using Chi Square ormean comparisons tests
powerful attributes related to participation in the start-up process –
age and gender – have NO statistical significance in reports by nascents
that a new firm is in place. In this case, age has been computed at the
time when entry into the start-up process – or conception – occurred.
This may be up to ten years before the initial interview.
Given the significance of age and gender on entry into the start-up
process, their joint impact is illustrated in Figure 5.3. Almost twice as
many young women, 18–24 years of age, report a successful firm birth
as their male age peers; more than twice as many older men, 55 years
and up, report a successful firm birth as their female age peers. Becauseof the small number of cases of very young or old nascent entrepreneurs,
these differences are not statistically significant. This is, of course, in
dramatic contrast to the impact of age and gender on entry into the
start-up process, as illustrated in Figure 4.2 in the previous chapter.
One background factor with a statistically significant association
with the outcome is ethnic identification. The results are dramatically
different from those related to entry into the start-up process, and thesedifferences are emphasized in Figure 5.4. While Blacks are almost twice
as likely (9.5/100 versus 5.7/100) to report participation in start-ups
than Whites, they are much less likely to report completion of the pro-
cess with a going business. Hispanics are more likely to report start-up
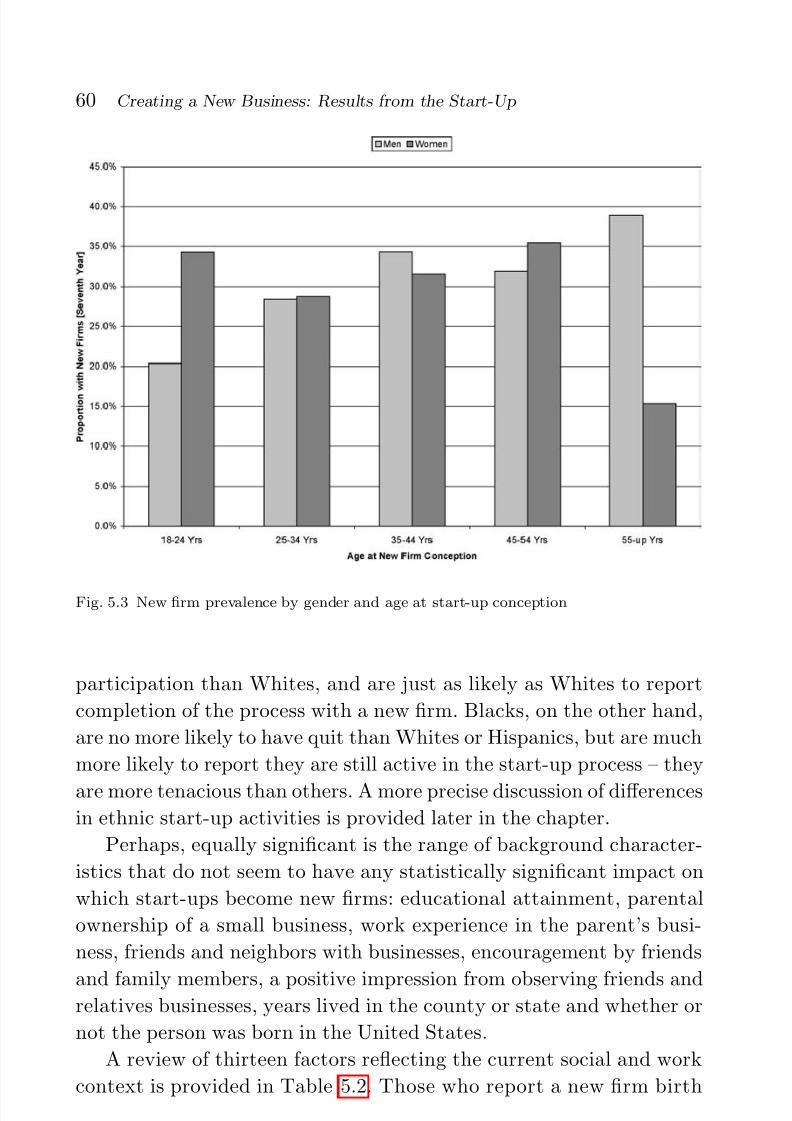
7/18/2019 New Firm Creation in the United
http://slidepdf.com/reader/full/new-firm-creation-in-the-united 73/168
60 Creating a New Business: Results from the Start-Up
Fig. 5.3 New firm prevalence by gender and age at start-up conception
participation than Whites, and are just as likely as Whites to report
completion of the process with a new firm. Blacks, on the other hand,
are no more likely to have quit than Whites or Hispanics, but are much
more likely to report they are still active in the start-up process – they
are more tenacious than others. A more precise discussion of differencesin ethnic start-up activities is provided later in the chapter.
Perhaps, equally significant is the range of background character-
istics that do not seem to have any statistically significant impact on
which start-ups become new firms: educational attainment, parental
ownership of a small business, work experience in the parent’s busi-
ness, friends and neighbors with businesses, encouragement by friends
and family members, a positive impression from observing friends andrelatives businesses, years lived in the county or state and whether or
not the person was born in the United States.
A review of thirteen factors reflecting the current social and work
context is provided in Table 5.2. Those who report a new firm birth

7/18/2019 New Firm Creation in the United
http://slidepdf.com/reader/full/new-firm-creation-in-the-united 74/168
5.1. What Kinds of People Create and Types of Start-Ups Become New Firms? 61
Fig. 5.4 Entry into start-ups and outcomes: by ethnic identity
are more satisfied with life overall and report LESS time devoted to
the start-up on their day off; none of the other factors are statisti-
cally significant. These factors include satisfaction with the most recent
job, household income, household net worth, martial status, household
structure, i.e., size of the household measured three ways, time at work
on the last workday or day off and time working on the start-up on thelast day off.
The relationship of personal traits, orientations, and attitudes to
reports of a new firm are summarized in Table 5.3. Six factors reflect
a statistically significant association with reporting a new firm birth;
internalized locus of control, more confidence in social settings, a cog-
nitive style that emphasizes doing things better rather than a new
approach, some level of economic sophistication about the current valueof assets, a preference to avoid working in collaboration with a group,
and expectations about firm survival for five years.
More than twenty-five other factors show no statistical signifi-
cance, including emotional control, shyness, business problem solving
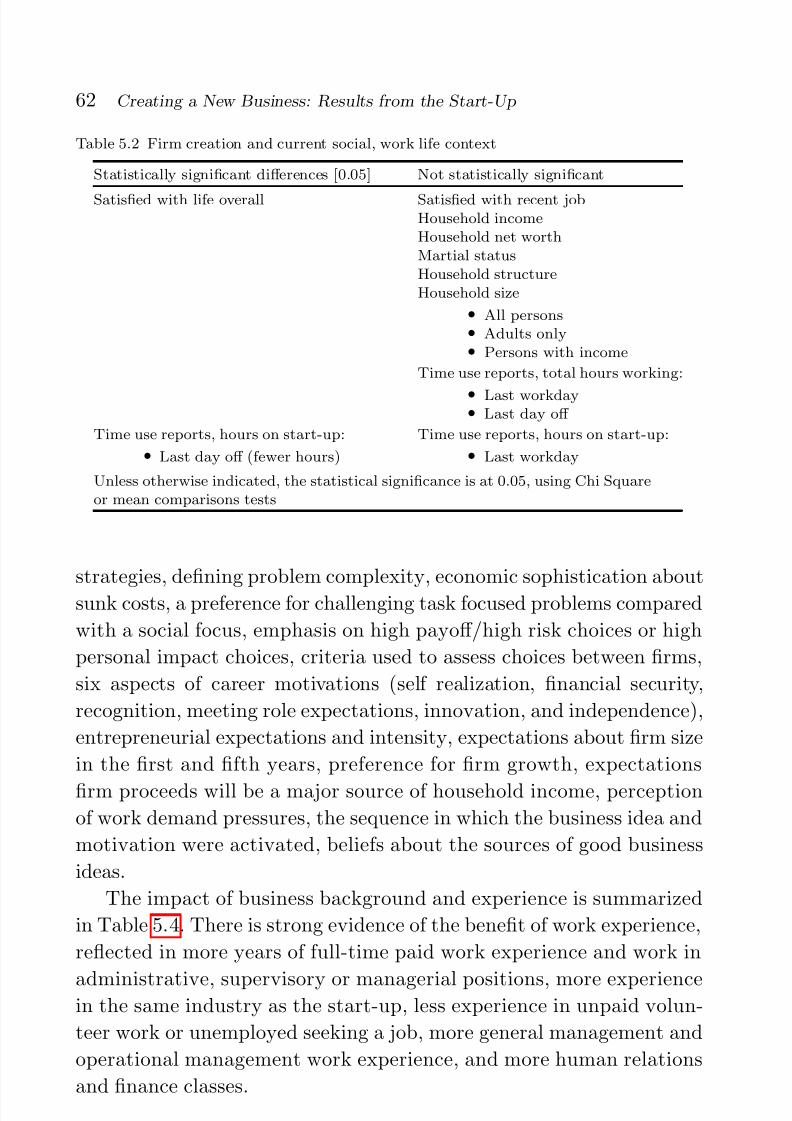
7/18/2019 New Firm Creation in the United
http://slidepdf.com/reader/full/new-firm-creation-in-the-united 75/168
62 Creating a New Business: Results from the Start-Up
Table 5.2 Firm creation and current social, work life context
Statistically significant differences [0.05] Not statistically significant
Satisfied with life overall Satisfied with recent jobHousehold incomeHousehold net worthMartial statusHousehold structureHousehold size
• All persons• Adults only• Persons with income
Time use reports, total hours working:
• Last workday• Last day off
Time use reports, hours on start-up:
• Last day off (fewer hours)
Time use reports, hours on start-up:
• Last workday
Unless otherwise indicated, the statistical significance is at 0.05, using Chi Squareor mean comparisons tests
strategies, defining problem complexity, economic sophistication about
sunk costs, a preference for challenging task focused problems compared
with a social focus, emphasis on high payoff/high risk choices or high
personal impact choices, criteria used to assess choices between firms,
six aspects of career motivations (self realization, financial security,
recognition, meeting role expectations, innovation, and independence),
entrepreneurial expectations and intensity, expectations about firm size
in the first and fifth years, preference for firm growth, expectations
firm proceeds will be a major source of household income, perceptionof work demand pressures, the sequence in which the business idea and
motivation were activated, beliefs about the sources of good business
ideas.
The impact of business background and experience is summarized
in Table 5.4. There is strong evidence of the benefit of work experience,
reflected in more years of full-time paid work experience and work in
administrative, supervisory or managerial positions, more experiencein the same industry as the start-up, less experience in unpaid volun-
teer work or unemployed seeking a job, more general management and
operational management work experience, and more human relations
and finance classes.

7/18/2019 New Firm Creation in the United
http://slidepdf.com/reader/full/new-firm-creation-in-the-united 76/168
5.1. What Kinds of People Create and Types of Start-Ups Become New Firms? 63
Table 5.3 Firm creation and personal traits, orientations, and attitudes
Statistically significant differences [0.05] Not statistically significant
Locus of controlConfidence in social settings Emotional control
ShynessCognitive style
• Doing better, not differentthings
Business problem solving
Defining problem complexityEconomic sophistication
• Focus on current value in deci-sions, not cost to acquire
Economic sophistication
• Ignore sunk costs in currentdecisions
Prefers individual work activities Prefers challenge/task focus versus socialfocus
Emphasis on high payoff/high risk choicesEmphasis on high personal impact choicesIn choosing between firms, emphasizes:
• Financial issues• Operational issues
Career motivations
• Six dimensions
Entrepreneurial expectations
Entrepreneurial IntensityExpect firm to be operating in five years Sales in first or fifth year of operation
Jobs in first or fifth year of operationPrefer firm to grow as much as possibleExpect firm to major source of HH incomeExpected equity ownership in five yearsPerception of work demands
• Three measures
Motivation/Business idea sequenceBelief in systematic search for good ideas
Belief good ideas just occurUnless otherwise indicated, the statistical significance is at 0.05, using Chi Square ormean comparisons tests
There is no evidence that the number of labor force events over
12 years in nine other areas, prior start-up experience, or general
and operational management classroom experience is associated with
reports of a new firm.Two aspects of the business and economic context, as reviewed
in Table 5.5 seem to have an association with completing the start-
up process; the presence of social challenges among start-up problems
and a perception that operational aspects are more challenging in the

7/18/2019 New Firm Creation in the United
http://slidepdf.com/reader/full/new-firm-creation-in-the-united 77/168
64 Creating a New Business: Results from the Start-Up
Table 5.4 Firm creation and business background, experience
Statistically significant differences [0.05] Not statistically significant
Years of full-time paid work experienceYears of administrative, supervisory, or managerial
experienceLabor force activity in prior 12 years, less activity
as one who is:
• Unemployed seeking work• Unpaid volunteer work
Labor force activity in prior 12 years
• Overall activity counts• Nine specific activities
Same industry experience Prior start-up experienceGeneral management work experience General management classesOperations management work experience Operational management classes
Human relations, finance classes [0.07]Unless otherwise indicated, the statistical significance is at 0.05, using Chi Square ormean comparisons tests
Table 5.5 Firm creation and perceived business, economic context
Statistically significant differences [0.05] Not statistically significant
Start-up problem index
Start-up problems: social challenges Start-up problems: personal challengesEntrepreneurial climate
• Three dimensions
Economic, community contextualuncertainty:
• Operational aspects morechallenging
Economic, community contextualuncertainty:
• Overall• Financial• Competition
Unless otherwise indicated, the statistical significance is at 0.05, using Chi Square ormean comparisons tests
immediate community. A number have no relationship, including a gen-
eral start-up problem index, start-up problems associated with personal
challenges, three aspects of the perceived entrepreneurial climate (pres-
ence of community support groups, friends and family role models, and
role models in the community) , and three aspects (financial, compet-
itive, and operational) of the economic, contextual uncertainty in theimmediate community.
A number of items related to the actual activities or immediate
context associated with the start-up, presented in Table 5.6, have a
statistically significant relationship with a new firm birth.

7/18/2019 New Firm Creation in the United
http://slidepdf.com/reader/full/new-firm-creation-in-the-united 78/168
5.1. What Kinds of People Create and Types of Start-Ups Become New Firms? 65
Table 5.6 Firm creation and business activity, context, start-up investments
Statistically significant differences [0.05] Not statistically significant
Total start up team hours, conception to firstinterview
Average hours per start-up team member,conception to first interview
Average total hours per month, conception tofirst interview
Average hours per month per team member,conception to first interview
Total funds invested at first interviewAverage funds per month per team member,
conception to first interviewAverage funds per member at first interviewAverage funds per month, conception to first
interviewLegal form
• Partnership less successful
Economic sector
• Five types
Proportion legal new firm ownership
• If over 50% institutionalownership
Type of location
Size of start-up team [0.09]
• Four person team less successfulAny contact with helping programs Number of programs known about
Number of programs contactedNature of helping programsHours spent receiving program assistanceValue of help provided (estimated)
Business plan sophistication Accounting sophisticationCompetitive strategy
• Hi tech
Competitive strategy
• New, quality products• Lower prices•
Superior location,convenience• Niche markets• Superior quality
Low tech emphasis [0.08] Social network
• Presence reported• Average number of persons
Unless otherwise indicated, the statistical significance is at 0.05, using Chi Square ormean comparisons tests

7/18/2019 New Firm Creation in the United
http://slidepdf.com/reader/full/new-firm-creation-in-the-united 79/168
66 Creating a New Business: Results from the Start-Up
Several measures associated with amount and intensity of activity
are related to reports of new firms.4 Measures related to the amount
of time or the amount of funds committed to the start-up are trackedfrom conception to the first detailed interview; this includes total hours
devoted to the start-up by all team members, average hours per team
member, average total hours per month, and average hours per month
per team member. Similar measures are developed regarding funding
provided by the team members, as reported in the first interview. These
include total funds provided by all team members, the average per team
member, the total per month prior to the first interview, and the totalper month per team member. Both the amount and intensity are related
to reports of new firm births.
Partnerships, as one type of legal form, seem to be less likely to
lead to a firm birth; if over 50% of the start-up is owned by an existing
business or institution a new firm is more likely. Four person start-up
teams seem to be less successful than others.5 Contact with helping
programs – no matter who is providing the help – seems to facilitate
new firm creation. More sophisticated business plans and a competitive
strategy based on high technology seem to be helpful, although another
measure seems to indicate low technology start-ups are more likely to
report a new firm.
A number of other factors have little relationship to a new firm
birth: the actual industry or market sector, type of location where
the firm is “housed,” a number of measures about the sponsorship and
intensity of help provided by a helping program, the level of accountingsophistication, five aspect of competitive strategy, and the presence and
size of helping social networks.
A number of factors related to the county in which the start-up
process was taking place were examined to determine the potential
4 Because of highly skewed distribution of hours and financial commitments, the patterns
were classified into four groups and a cross tabulation assessed; the results, as shown inAppendix.5Ax.3, are highly statistically significant. Comparison of average values, reflect-ing the impact of extreme cases, are less significant.
5 Ironically, substantial research with decision making in discussion groups indicates thatfour person groups have the most egalitarian influence structures, suggesting that theymay have more problems reaching consensus and arriving at a decision. This may haveprevented these groups from developing an effective procedure for making the decisionsrequired in moving forward with the start-up (Reynolds, 1971a).
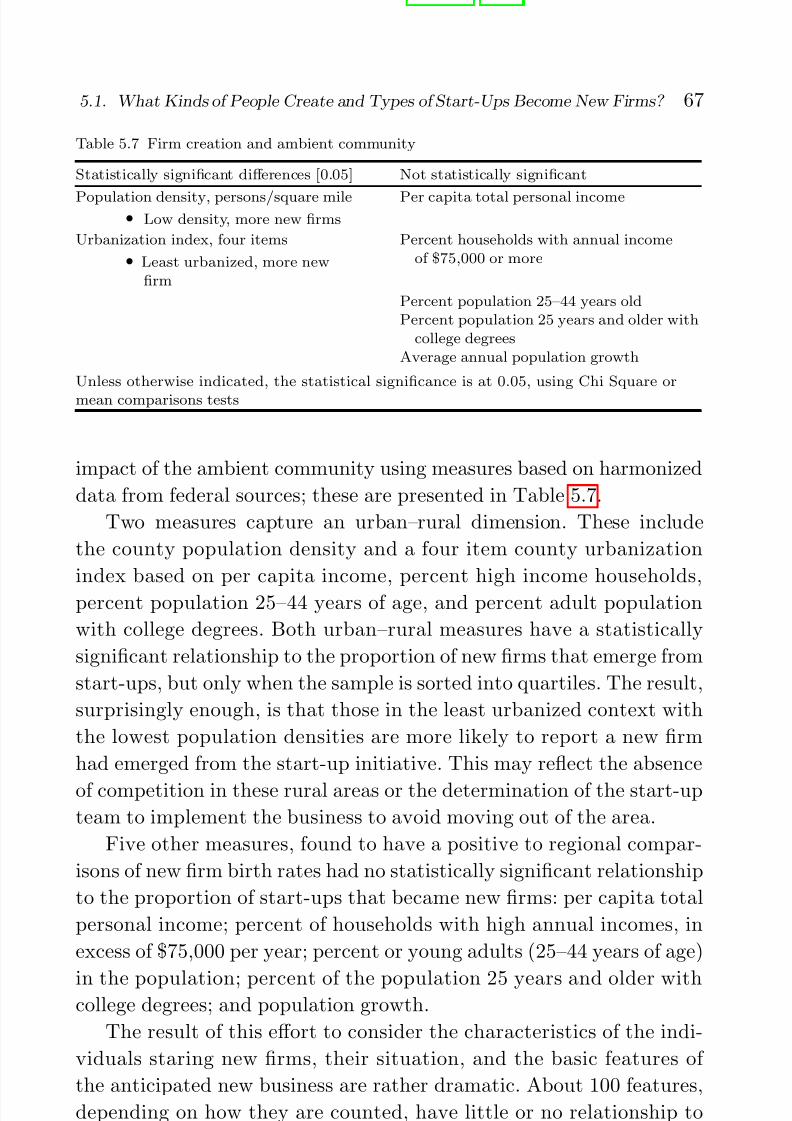
7/18/2019 New Firm Creation in the United
http://slidepdf.com/reader/full/new-firm-creation-in-the-united 80/168
5.1. What Kinds of People Create and Types of Start-Ups Become New Firms? 67
Table 5.7 Firm creation and ambient community
Statistically significant differences [0.05] Not statistically significant
Population density, persons/square mile• Low density, more new firms
Per capita total personal income
Urbanization index, four items
• Least urbanized, more newfirm
Percent households with annual incomeof $75,000 or more
Percent population 25–44 years oldPercent population 25 years and older with
college degreesAverage annual population growth
Unless otherwise indicated, the statistical significance is at 0.05, using Chi Square ormean comparisons tests
impact of the ambient community using measures based on harmonized
data from federal sources; these are presented in Table 5.7.
Two measures capture an urban–rural dimension. These include
the county population density and a four item county urbanization
index based on per capita income, percent high income households,
percent population 25–44 years of age, and percent adult population
with college degrees. Both urban–rural measures have a statistically
significant relationship to the proportion of new firms that emerge from
start-ups, but only when the sample is sorted into quartiles. The result,
surprisingly enough, is that those in the least urbanized context with
the lowest population densities are more likely to report a new firm
had emerged from the start-up initiative. This may reflect the absence
of competition in these rural areas or the determination of the start-upteam to implement the business to avoid moving out of the area.
Five other measures, found to have a positive to regional compar-
isons of new firm birth rates had no statistically significant relationship
to the proportion of start-ups that became new firms: per capita total
personal income; percent of households with high annual incomes, in
excess of $75,000 per year; percent or young adults (25–44 years of age)
in the population; percent of the population 25 years and older withcollege degrees; and population growth.
The result of this effort to consider the characteristics of the indi-
viduals staring new firms, their situation, and the basic features of
the anticipated new business are rather dramatic. About 100 features,
depending on how they are counted, have little or no relationship to

7/18/2019 New Firm Creation in the United
http://slidepdf.com/reader/full/new-firm-creation-in-the-united 81/168
68 Creating a New Business: Results from the Start-Up
the reports that a new firm was established. About 30 seem to have
some statistically significant relationship to the reports of an operating
business. But many of these thirty are reflecting the same features –intensity of involvement measured by time and money as well as past
work experience – as related to the implementation of a new firm.
The large mass of indicators reflecting perceptions, attitudes, socio-
demographic backgrounds, strategic focus and the like seem to have
very little impact on which nascent entrepreneurs are reporting that a
new firm has been created.
This suggests that more attention should be given to what thesestart-up teams are doing, rather than who they are – or think they are.
Fortunately, the PSED I data set provides a description of what has
been done to implement a new firm – and in some detail.
5.2 Start-Up Activity
What do nascent entrepreneurs do as they work to establish a new
business? While the basic task requires the assembly and coordina-
tion of human and financial resources to achieve business objectives,
a large number of discrete activities are involved. It is possible to
ask those active in the firm creation process which types of events
they have pursued; twenty-seven are used in this assessment, dozens
more could have been included. Table 5.8 provides the PSED I list
of activities, indicating those reported in each of the first six years of
the start-up effort. The entries represent the proportion of the start-up efforts that report the initiation of each activity. Some activities
are only done once – such as open a bank account or apply for an
Employer Identification Number [EIN]. Other activities may continue
for some time – such as revisions of a business plan, updates of finan-
cial projections, or hiring individuals as the business is established
and expands.
The start-up activities in Table 5.8 are rank ordered by the pro-portion of start-up efforts that reported initiating the activity by the
sixth year after they began the start-up process – seven years after
the start-up conception. Four are related to filing taxes or listing with
a credit rating bureau and are presented at the bottom, 22 reflect

7/18/2019 New Firm Creation in the United
http://slidepdf.com/reader/full/new-firm-creation-in-the-united 82/168
5.2. Start-Up Activity 69
T a b l e 5 . 8 B u s i n e s s c r e a t i o n a c t i v i t i e s
A c t i v i t y / E v e n t
F i r s t
m o n t h ( % )
F i r s t
y e a r ( % )
S e c o n d
y e a r ( % )
T h i r d
y e a r ( % )
F o u r t h
y e a r ( % )
F i f t h
y e a r ( % )
S i x t h
y e a
r
( %
)
T i m e t h i n k
i n g a b o u t t h e n e w b u s i n e s s
6 6 . 2
8 9 . 9
9 6 . 2
9 7 . 3
9 8 . 0
9 8 . 9
9 9 . 2
D e fi n e m a r k e t o p p o r t u n i t i e s
2 0 . 2
6 1 . 7
1 8 . 3
8 4 . 3
8 7 . 9
8 9 . 7
9 0 . 6
I n v e s t m e n t
o w n m o n e y
2 3 . 8
6 7 . 1
8 1 . 1
8 6 . 4
8 7 . 6
8 9 . 1
9 0 . 4
P u r c h a s e d r a w m a t e r i a l s , i n v e n t o r y , s u p
p l i e s , c o m p o n e n t s
1 3 . 5
5 2 . 1
6 9 . 5
7 7 . 7
8 0 . 1
8 1 . 3
8 1 . 7
D e v e l o p e d p r o d u c t o r s e r v i c e m o d e l o r
p r o t o t y p e
2 2 . 3
5 9 . 9
7 0 . 7
7 6 . 5
7 8 . 4
7 9 . 2
7 9 . 6
P r o m o t i o n
o f p r o d u c t o r s e r v i c e h a s s t a
r t e d
5 . 0
3 7 . 8
5 7 . 6
6 6 . 1
7 1 . 7
7 3 . 2
7 4 . 5
B e g a n t o s a v e m o n e y t o i n v e s t
2 2 . 8
4 9 . 5
6 1 . 0
6 4 . 1
6 7 . 2
6 8 . 9
6 9 . 8
P u r c h a s e d ,
l e a s e d p l a n t , e q u i p m e n t , p r o p e r t y
8 . 3
3 6 . 7
5 3 . 7
6 2 . 3
6 6 . 4
6 8 . 3
6 9 . 3
O r g a n i z e d a s t a r t - u p t e a m
1 1 . 2
4 3 . 6
5 6 . 8
6 2 . 4
6 5 . 8
6 7 . 3
6 8 . 1
R e c e i v e d a n y m o n e y , i n c o m e , o r f e e s
4 . 4
3 0 . 3
5 0 . 2
5 9 . 7
6 3 . 8
6 6 . 4
6 7 . 5
P r e p a r e d a
b u s i n e s s p l a n
1 5 . 5
4 5 . 0
5 6 . 4
6 0 . 4
6 2 . 6
6 4 . 8
6 6 . 2
D e v e l o p fi n
a n c i a l p r o j e c t i o n s
6 . 1
3 1 . 6
4 6 . 2
5 3 . 7
5 8 . 0
5 9 . 2
6 1 . 0
E s t a b l i s h e d
a n e x c l u s i v e b a n k a c c o u n t
3 . 3
2 9 . 4
4 3 . 1
5 1 . 2
5 5 . 0
5 6 . 8
5 8 . 4
E s t a b l i s h e d
s u p p l i e r c r e d i t
2 . 9
2 3 . 7
3 9 . 3
4 5 . 7
4 9 . 6
5 1 . 6
5 2 . 8
D e v o t e d f u l l - t i m e t o s t a r t - u p e ff o r t , 3 5 +
h r s / w e e k
3 . 9
1 9 . 4
3 3 . 4
4 0 . 1
4 4 . 1
4 6 . 6
4 7 . 8
A r r a n g e d c h i l d c a r e , h o u s e h o l d h e l p
2 . 2
1 9 . 6
2 9 . 8
3 4 . 6
3 7 . 4
3 8 . 9
3 9 . 7
A s k e d fi n a n
c i a l i n s t i t u t i o n s o r o t h e r p e o p l e f o r f u n d s
3 . 8
2 1 . 4
2 8 . 6
3 3 . 6
3 5 . 5
3 7 . 0
3 8 . 3
I n s t a l l e d d e d i c a t e d p h o n e l i n e
2 . 6
1 4 . 8
2 5 . 0
3 0 . 5
3 4 . 3
3 6 . 2
3 7 . 7
T a k e n a n y
c l a s s e s o r w o r k s h o p
1 1 . 7
2 4 . 2
3 0 . 9
3 3 . 3
3 4 . 5
3 5 . 5
3 6 . 2
I n i t i a l p o s i t i v e m o n t h l y c a s h fl o w
0 . 6
8 . 4
1 6 . 7
2 3 . 5
2 9 . 2
3 1 . 3
3 2 . 9
I n i t i a t e d a
p h o n e b o o k o r i n t e r n e t l i s t i n g
1 . 9
1 0 . 9
2 0 . 2
2 5 . 9
2 8 . 3
3 0 . 6
3 1 . 2
H i r e d a n e m
p l o y e e f o r p a y
1 . 3
8 . 1
1 7 . 9
2 3 . 7
2 7 . 2
2 9 . 1
3 0 . 3
P a t e n t , t r a d e m a r k , c o p y r i g h t a p p l i c a t i o
n s u b m i t t e d
1 . 4
1 0 . 1
1 7 . 1
2 0 . 5
2 3 . 0
2 4 . 5
2 4 . 9
F i l e d fi r s t f e d e r a l i n c o m e t a x r e t u r n
7 . 3
2 4 . 5
3 5 . 5
4 3 . 1
4 6 . 4
4 8 . 4
4 8 . 9
P a i d fi r s t f e d e r a l s o c i a l s e c u r i t y t a x p a y
m e n t
2 . 0
1 1 . 5
2 2 . 1
2 7 . 6
3 1 . 1
3 3 . 3
3 4 . 0
P a i d fi r s t s t a t e u n e m p l o y m e n t i n s u r a n c e t a x
1 . 3
6 . 7
1 4 . 3
1 8 . 1
2 0 . 7
2 1 . 3
2 2 . 1
K n o w fi r m
l i s t e d w i t h D u n a n d B r a d s t r e e t
0 . 1
1 . 9
3 . 9
6 . 0
6 . 9
8 . 3
8 . 6
7/18/2019 New Firm Creation in the United
http://slidepdf.com/reader/full/new-firm-creation-in-the-united 83/168
70 Creating a New Business: Results from the Start-Up
actions taken to implement the new business, and one, giving seri-
ous thought to the new start-up, is related to a personal focus on the
initiative.As the proportion initiating each activity in the first month and
in each successive year is indicated, the cumulative proportions will
either stabilize or increase over time. It should be no surprise that
giving thought to the new business is not only the most widely reported
activity, but two-thirds (66.2%) report serious thought about the start-
up by the end of the first month. On the other hand, one-third have
not reported serious thought by the end of the first month; it is notreported by over 95% of the nascent entrepreneurs – 19 in 20 – until
the third year.
Aside from serious thought, no other activity is reported by more
than one in four of the nascent entrepreneurs as having occurred in
the first month. More than one in five report they have defined market
opportunities, invested their own money in the start-up, developed a
product or service model, or begun to save money to invest. More
than one in ten report they have purchased raw materials, inventory or
supplies; started to organize a start-up team; developed a business plan
or taken a workshop or class on creating a business. Some activities are
reported by less than one in fifty in the first month, including hiring
any employee, initial positive monthly cash flow, or the first listing of
the firm’s phone or internet address.
It is awkward to try to summarize the processes that involve 23 dif-
ferent activities, setting aside the four that involve meeting tax require-ments or registration with a commercial credit rating service. A factor
analysis, summarized in Appendix.5Ax.3, indicated that these 23 activ-
ities could be re-organized into six domains:
(1) Business presence: The emphasis is on formal registration
of the firm, full-time attention by the nascent entrepreneurand the beginning of hiring employees. [five items]
(2) Production implementation: Attention to acquiring
inputs (supplies, inventory, components), use of major assets,
actual sale of the product or service. [six items]

7/18/2019 New Firm Creation in the United
http://slidepdf.com/reader/full/new-firm-creation-in-the-united 84/168
5.2. Start-Up Activity 71
(3) Organizational, financial structure: Mobilizing individ-
uals, preparing future plans, and acquisition of outside finan-
cial resources. [four items](4) Personal planning: The nascent entrepreneur’s efforts to
prepare for the business and their personal involvement.
[three items]
(5) Personal preparation: The nascent entrepreneur’s organi-
zation of their personal life to become involved, by taking
classes, saving money, or arranging for help with childcare or
housework. [three items](6) Focus on task or the product: Attention to developing
the product or service to be sold and acquiring formal prop-
erty rights to same. [two items]
For each domain and for each time period, an index was created by
computing the average number of activities that had been initiated by
the beginning of the time period. For each index, the range in values
could be from zero to 100%.
The relationships of this index to the three outcomes seven years
after conception are presented for six time periods in Table 5.9. The
earliest time period is based on reports of activities initiated in the
first month, followed by those initiated in the first six months, the first
year, and three following years. The statistical significance is presented
in brackets below the index values for each outcome.
Of the six indices, only one, personal preparation – saving money,arranging child care, taking classes or workshop – appears to have no
relationship to the outcome in the seventh year. All other indices have,
for some time periods, a statistically significant relationship to the
seven year outcome. This seems to occur earliest and be the strongest
for indicators of business presence – establishing a bank account, creat-
ing a phone book listing and a dedicated phone line, hiring employees
and full time devotion to the start-up; those reporting these activi-ties in the first month seem to be more likely to have a new firm six
years later. Active engagement in developing a productive mechanism
and creating an organizational and financial structure also seems to
have a strong association with the emergence of a new firm. Two other
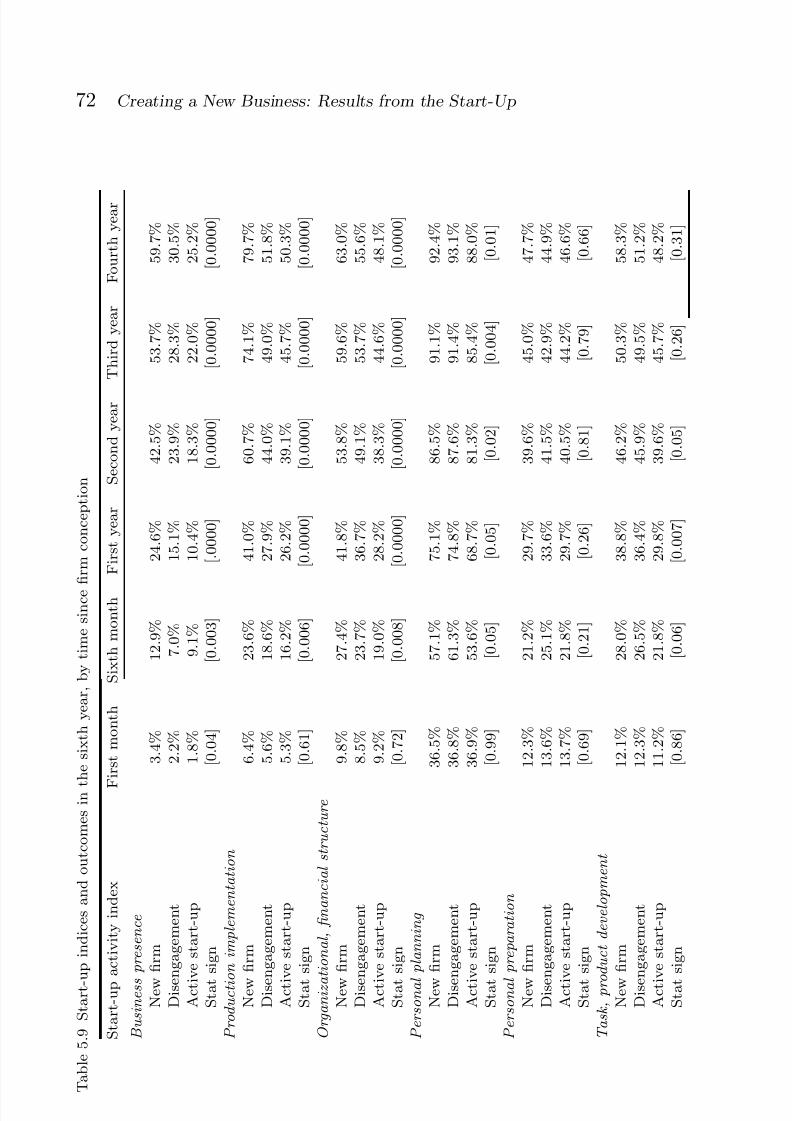
7/18/2019 New Firm Creation in the United
http://slidepdf.com/reader/full/new-firm-creation-in-the-united 85/168
72 Creating a New Business: Results from the Start-Up
T a b l e 5 . 9 S t a r t - u p i n d i c e s a n d o u t c o m e s i n t
h e s i x t h y e a r , b y t i m e s i n c e
fi r m c o n c e p t i o n
S t a r t - u p
a c t i v i t y i n d e x
F
i r s t m o n t h
S i x t h m o n t h
F i r s t y e a r
S e c o n d y e a r
T h i r d y e a r
F o u r t h y e a r
B u s i n e s s
p r e s e n c e
N e w
fi r m
3 . 4 %
1 2 . 9 %
2 4 . 6 %
4 2 . 5 %
5 3 . 7 %
5 9 . 7 %
D i s e n g a g e m e n t
2 . 2 %
7 . 0 %
1 5 . 1 %
2 3 . 9 %
2 8 . 3 %
3 0 . 5 %
A c t i v e s t a r t - u p
1 . 8 %
9 . 1 %
1 0 . 4 %
1 8 . 3 %
2 2 . 0 %
2 5 . 2 %
S t a t
s i g n
[ 0 . 0 4 ]
[ 0 . 0 0 3 ]
[ . 0 0 0 0 ]
[ 0 . 0 0 0 0 ]
[ 0 . 0 0 0 0 ]
[ 0 . 0 0 0 0 ]
P r o d u c t i o n i m p l e m e n t a t i o n
N e w
fi r m
6 . 4 %
2 3 . 6 %
4 1 . 0 %
6 0 . 7 %
7 4 . 1 %
7 9 . 7 %
D i s e n g a g e m e n t
5 . 6 %
1 8 . 6 %
2 7 . 9 %
4 4 . 0 %
4 9 . 0 %
5 1 . 8 %
A c t i v e s t a r t - u p
5 . 3 %
1 6 . 2 %
2 6 . 2 %
3 9 . 1 %
4 5 . 7 %
5 0 . 3 %
S t a t
s i g n
[ 0 . 6 1 ]
[ 0 . 0 0 6 ]
[ 0 . 0 0 0 0 ]
[ 0 . 0 0 0 0 ]
[ 0 . 0 0 0 0 ]
[ 0 . 0 0 0 0 ]
O r g a n i z a
t i o n a l , fi n a n c i a l s t r u c t u r e
N e w
fi r m
9 . 8 %
2 7 . 4 %
4 1 . 8 %
5 3 . 8 %
5 9 . 6 %
6 3 . 0 %
D i s e n g a g e m e n t
8 . 5 %
2 3 . 7 %
3 6 . 7 %
4 9 . 1 %
5 3 . 7 %
5 5 . 6 %
A c t i v e s t a r t - u p
9 . 2 %
1 9 . 0 %
2 8 . 2 %
3 8 . 3 %
4 4 . 6 %
4 8 . 1 %
S t a t
s i g n
[ 0 . 7 2 ]
[ 0 . 0 0 8 ]
[ 0 . 0 0 0 0 ]
[ 0 . 0 0 0 0 ]
[ 0 . 0 0 0 0 ]
[ 0 . 0 0 0 0 ]
P e r s o n a l
p l a n n i n g
N e w
fi r m
3 6 . 5 %
5 7 . 1 %
7 5 . 1 %
8 6 . 5 %
9 1 . 1 %
9 2 . 4 %
D i s e n g a g e m e n t
3 6 . 8 %
6 1 . 3 %
7 4 . 8 %
8 7 . 6 %
9 1 . 4 %
9 3 . 1 %
A c t i v e s t a r t - u p
3 6 . 9 %
5 3 . 6 %
6 8 . 7 %
8 1 . 3 %
8 5 . 4 %
8 8 . 0 %
S t a t
s i g n
[ 0 . 9 9 ]
[ 0 . 0 5 ]
[ 0 . 0 5 ]
[ 0 . 0 2 ]
[ 0 . 0 0 4 ]
[ 0 . 0 1 ]
P e r s o n a l
p r e p a r a t i o n
N e w
fi r m
1 2 . 3 %
2 1 . 2 %
2 9 . 7 %
3 9 . 6 %
4 5 . 0 %
4 7 . 7 %
D i s e n g a g e m e n t
1 3 . 6 %
2 5 . 1 %
3 3 . 6 %
4 1 . 5 %
4 2 . 9 %
4 4 . 9 %
A c t i v e s t a r t - u p
1 3 . 7 %
2 1 . 8 %
2 9 . 7 %
4 0 . 5 %
4 4 . 2 %
4 6 . 6 %
S t a t
s i g n
[ 0 . 6 9 ]
[ 0 . 2 1 ]
[ 0 . 2 6 ]
[ 0 . 8 1 ]
[ 0 . 7 9 ]
[ 0 . 6 6 ]
T a s k , p r o
d u c t d e v e l o p m e n t
N e w
fi r m
1 2 . 1 %
2 8 . 0 %
3 8 . 8 %
4 6 . 2 %
5 0 . 3 %
5 8 . 3 %
D i s e n g a g e m e n t
1 2 . 3 %
2 6 . 5 %
3 6 . 4 %
4 5 . 9 %
4 9 . 5 %
5 1 . 2 %
A c t i v e s t a r t - u p
1 1 . 2 %
2 1 . 8 %
2 9 . 8 %
3 9 . 6 %
4 5 . 7 %
4 8 . 2 %
S t a t
s i g n
[ 0 . 8 6 ]
[ 0 . 0 6 ]
[ 0 . 0 0 7 ]
[ 0 . 0 5 ]
[ 0 . 2 6 ]
[ 0 . 3 1 ]

7/18/2019 New Firm Creation in the United
http://slidepdf.com/reader/full/new-firm-creation-in-the-united 86/168
5.2. Start-Up Activity 73
indices – related to personal planning and task or product development,
also seem to have a significant relationship to the six year outcome,
although it is not as strong as the other three and, in the case of prod-uct development, the association with the outcome after the second
year is no longer statistically significant.
Based on the statistical significance of these domains of activities
with the start-up outcome, it would appear that an emphasis on estab-
lishing a public presence for the business and developing a mechanism
or process for delivering the goods or services, along with creating an
organizational and financial structure, are important in reaching a res-olution to the start-up initiative. Personal planning seems to help facil-
itate a resolution, as does a focus on the product or service itself in
the early period. There is little evidence that personal preparation is
different among those with different outcomes.
Is the level of intensity related to the time required to reach a resolu-
tion? Resolution can only be determined for those who report starting
a business or quitting the initiative during the study. The relationship
of the activity indices to the time between conception and the two
outcomes are presented in Table 5.10.
The results are quite striking, as it is clear that up through the
first year or two more activity in all domains seems to result in a
faster resolution – the new firms are implemented sooner or the nascent
entrepreneur is quicker to disengage from the start-up. Up through the
second year all correlations are negative (more activity reduces the
time lag) and most are highly statistically significant. This patterncontinues through the third and fourth year for the time lag to an
operating business, but is less significant in the later years for the dis-
engagement correlations. Only the level of personal planning has the
same pattern across all years in relation to disengagement; the more
personal planning the quicker the individuals are to disengage from a
start-up.
This may reflect a change in the nature of the individuals who are“slow to quit.” There may be a substantial proportion that put intense
effort into the start-up and disengage when it appears it may not work
out. Another group is less involved and takes much longer to make a
decision to quit, a decision made after they have spent a number of

7/18/2019 New Firm Creation in the United
http://slidepdf.com/reader/full/new-firm-creation-in-the-united 87/168
74 Creating a New Business: Results from the Start-Up
T a b l e 5 . 1 0 S t a r t - u p d o m a i n s a n d t i m e t o c o m
p l e t e t r a n s i t i o n s
F i r s t m o n t h
S i x t h m o n t h
F i r s t y e a r
S e c o n d y e a r
T h i r d y e a r
F o u r t h y e
a r
T i m e t o o p
e r a t i n g b u s i n e s s
B u s i n e
s s p r e s e n c e
− 0 . 1 6 ∗
− 0 . 2 9 ∗ ∗ ∗
− 0 . 3 7 ∗ ∗ ∗
− 0 . 4 0 ∗ ∗ ∗
− 0 . 3 9 ∗ ∗ ∗
− 0 . 3 6 ∗ ∗ ∗
P r o d u c t i o n i m p l e m e n t a t i o n
− 0 . 0 8
− 0 . 3 4 ∗ ∗ ∗
− 0 . 4 5 ∗ ∗ ∗
− 0 . 4 6 ∗ ∗ ∗
− 0 . 4 9 ∗ ∗ ∗
− 0 . 4 4 ∗ ∗ ∗
O r g a n i z a t i o n a l , fi n a n c i a l s t r u c t u r e
− 0 . 1 7 ∗ ∗
− 0 . 3 2 ∗ ∗ ∗
− 0 . 3 8 ∗ ∗ ∗
− 0 . 3 7 ∗ ∗ ∗
− 0 . 3 8 ∗ ∗ ∗
− 0 . 3 0 ∗ ∗ ∗
P e r s o n
a l p l a n n i n g
− 0 . 2 9 ∗ ∗ ∗
− 0 . 3 7 ∗ ∗ ∗
− 0 . 4 1 ∗ ∗ ∗
− 0 . 4 2 ∗ ∗ ∗
− 0 . 3 8 ∗ ∗ ∗
− 0 . 3 0 ∗ ∗ ∗
P e r s o n
a l p r e p a r a t i o n
− 0 . 0 7
− 0 . 1 5 ∗
− 0 . 1 3 ∗
− 0 . 1 5 ∗
− 0 . 1 1
− 0 . 0 7
T a s k , p r o d u c t d e v e l o p m e n t
0 . 0 2
− 0 . 1 8 ∗ ∗
− 0 . 2 5 ∗ ∗ ∗
− 0 . 2 1 ∗ ∗
− 0 . 1 4 ∗
− 0 . 0 7
T i m e t o d i s e n g a g e m e n t [ Q u i t ]
B u s i n e
s s p r e s e n c e
− 0 . 0 7
− 0 . 1 1
− 0 . 1 5 ∗ ∗
− 0 . 0 4
0 . 0 3
0 . 0 8
P r o d u c t i o n i m p l e m e n t a t i o n
− 0 . 0 0
− 0 . 2 2 ∗ ∗ ∗
− 0 . 2 4 ∗ ∗ ∗
− 0 . 1 2 ∗
0 . 0 2
0 . 1 1
O r g a n i z a t i o n a l , fi n a n c i a l s t r u c t u r e
− 0 . 0 4
− 0 . 2 3 ∗ ∗ ∗
− 0 . 2 7 ∗ ∗ ∗
− 0 . 1 7 ∗ ∗
− 0 . 1 1
− 0 . 0 4
P e r s o n
a l p l a n n i n g
− 0 . 2 7 ∗ ∗ ∗
− 0 . 4 4 ∗ ∗ ∗
− 0 . 4 7 ∗ ∗ ∗
− 0 . 3 9 ∗ ∗ ∗
− 0 . 2 9 ∗ ∗ ∗
− 0 . 2 1 ∗ ∗
P e r s o n
a l p r e p a r a t i o n
− 0 . 1 1
− 0 . 1 8 ∗ ∗
− 0 . 1 8 ∗ ∗
− 0 . 0 7
− 0 . 0 2
0 . 0 5
T a s k , p r o d u c t d e v e l o p m e n t
− 0 . 1 3 ∗
− 0 . 2 3 ∗ ∗ ∗
− 0 . 2 4 ∗ ∗ ∗
− 0 . 1 6 ∗ ∗ ∗
− 0 . 0 6
− 0 . 0 3
S t a t i s t i c a l s i g n i fi c a n c e :
∗
0 . 0 5 ;
∗ ∗
0 . 0 1 ;
∗ ∗ ∗
0 . 0 0 1 .
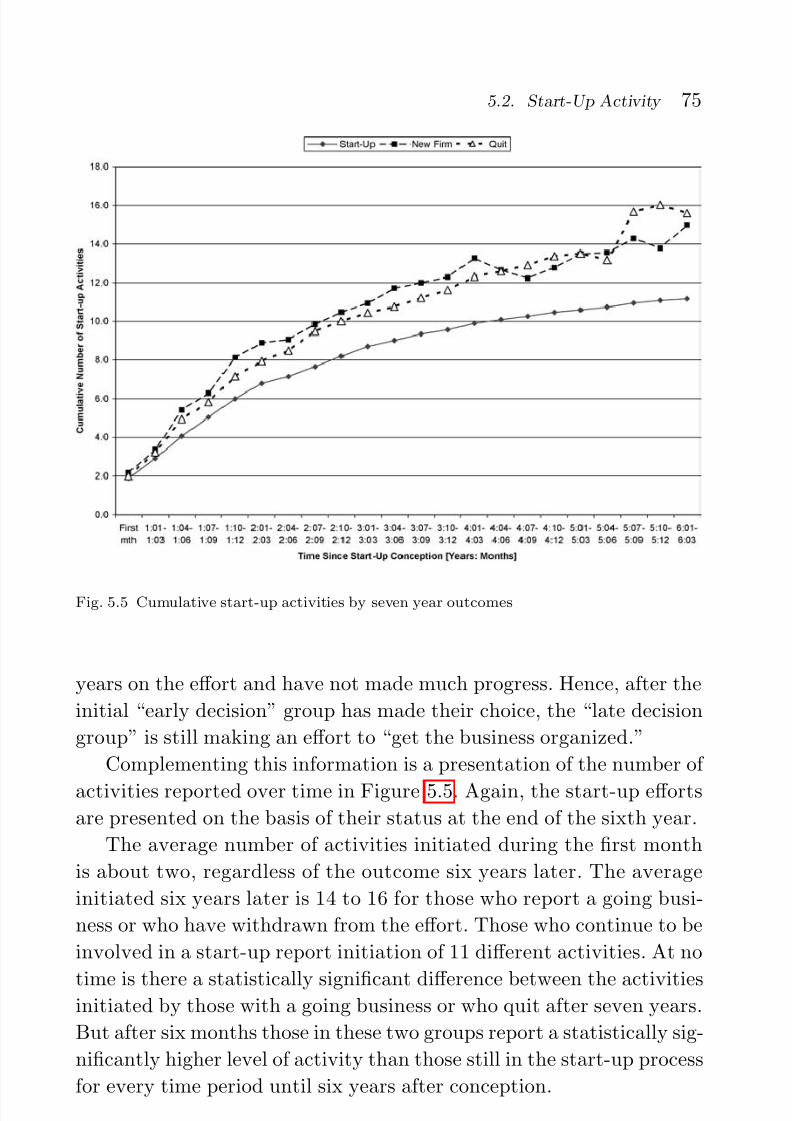
7/18/2019 New Firm Creation in the United
http://slidepdf.com/reader/full/new-firm-creation-in-the-united 88/168
5.2. Start-Up Activity 75
Fig. 5.5 Cumulative start-up activities by seven year outcomes
years on the effort and have not made much progress. Hence, after the
initial “early decision” group has made their choice, the “late decision
group” is still making an effort to “get the business organized.”
Complementing this information is a presentation of the number of
activities reported over time in Figure 5.5. Again, the start-up effortsare presented on the basis of their status at the end of the sixth year.
The average number of activities initiated during the first month
is about two, regardless of the outcome six years later. The average
initiated six years later is 14 to 16 for those who report a going busi-
ness or who have withdrawn from the effort. Those who continue to be
involved in a start-up report initiation of 11 different activities. At no
time is there a statistically significant difference between the activitiesinitiated by those with a going business or who quit after seven years.
But after six months those in these two groups report a statistically sig-
nificantly higher level of activity than those still in the start-up process
for every time period until six years after conception.

7/18/2019 New Firm Creation in the United
http://slidepdf.com/reader/full/new-firm-creation-in-the-united 89/168
76 Creating a New Business: Results from the Start-Up
In summary, then, the following patterns seem to be present:
•
Some domains of activities appear to be associated withhigher proportions of new firm births, such as establish-
ing a business presence, focusing on production of a good
or service, or attending to the organizational and financial
structure.• Other activities are less associated with reports of a new firm,
such as personal planning or task and product development.• The same domains associated with success at creating a new
firm are associated with a reduced time to either a new firm
or disengagement from the start-up process.• Those that reach a resolution of the start-up success seem to
implement more activities sooner in the process.
It is, of course, quite appropriate to try to determine the relative impor-
tance of the various factors known to have a significant effect on the
emergence of a new firm from the start-up process.
5.3 Interactions: Who They are and What They are Doing?
The preceding assessments have emphasized the relative impact of indi-
vidual variables, considered one at a time; attention was then paid
to groups of related start-up activities. This leads to two obvious
questions:
• What is the relative importance of different individual, team
factors or start-up activities?• Is it possible that the interaction between different individ-
ual, team factors and start-up activities can have a unique
impact on the outcome – implementing a new firm?
Both issues can be addressed with the same analysis utilized in
Chapter 4 to explore the different factors affecting participation in astart-up (Tables 4.2 and 4.3).
The same procedure is followed in this assessment. A set of factors
considered to be related to an outcome – in this case reports of a new
firm seven years after conception – is explored to identify the single
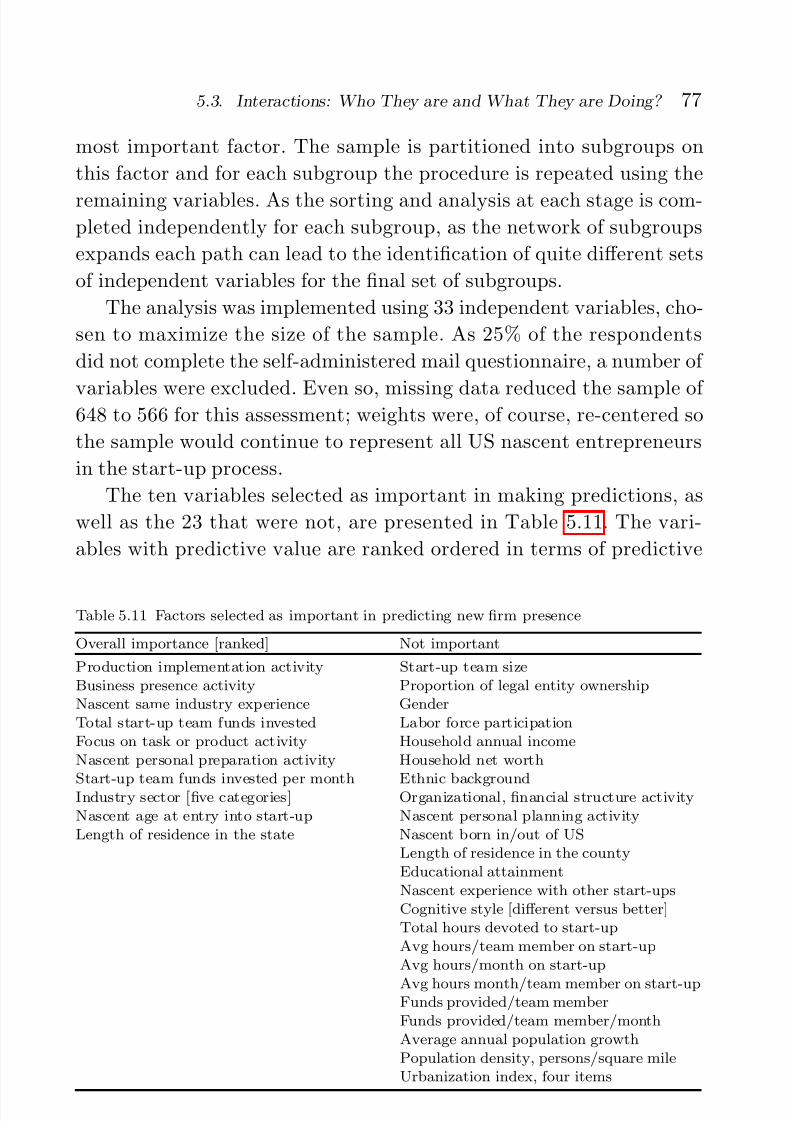
7/18/2019 New Firm Creation in the United
http://slidepdf.com/reader/full/new-firm-creation-in-the-united 90/168
5.3. Interactions: Who They are and What They are Doing? 77
most important factor. The sample is partitioned into subgroups on
this factor and for each subgroup the procedure is repeated using the
remaining variables. As the sorting and analysis at each stage is com-pleted independently for each subgroup, as the network of subgroups
expands each path can lead to the identification of quite different sets
of independent variables for the final set of subgroups.
The analysis was implemented using 33 independent variables, cho-
sen to maximize the size of the sample. As 25% of the respondents
did not complete the self-administered mail questionnaire, a number of
variables were excluded. Even so, missing data reduced the sample of 648 to 566 for this assessment; weights were, of course, re-centered so
the sample would continue to represent all US nascent entrepreneurs
in the start-up process.
The ten variables selected as important in making predictions, as
well as the 23 that were not, are presented in Table 5.11. The vari-
ables with predictive value are ranked ordered in terms of predictive
Table 5.11 Factors selected as important in predicting new firm presence
Overall importance [ranked] Not important
Production implementation activity Start-up team sizeBusiness presence activity Proportion of legal entity ownershipNascent same industry experience GenderTotal start-up team funds invested Labor force participationFocus on task or product activity Household annual incomeNascent personal preparation activity Household net worth
Start-up team funds invested per month Ethnic backgroundIndustry sector [five categories] Organizational, financial structure activityNascent age at entry into start-up Nascent personal planning activityLength of residence in the state Nascent born in/out of US
Length of residence in the countyEducational attainmentNascent experience with other start-upsCognitive style [different versus better]Total hours devoted to start-upAvg hours/team member on start-upAvg hours/month on start-up
Avg hours month/team member on start-upFunds provided/team memberFunds provided/team member/monthAverage annual population growthPopulation density, persons/square mileUrbanization index, four items
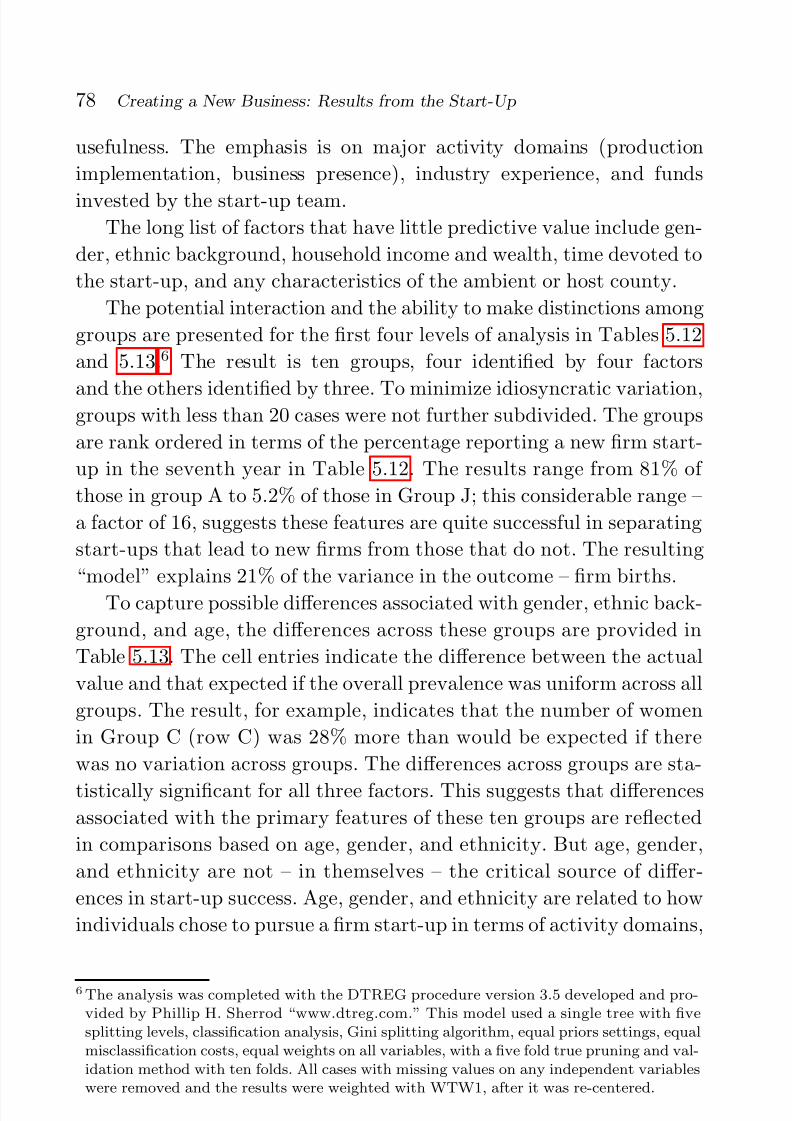
7/18/2019 New Firm Creation in the United
http://slidepdf.com/reader/full/new-firm-creation-in-the-united 91/168
78 Creating a New Business: Results from the Start-Up
usefulness. The emphasis is on major activity domains (production
implementation, business presence), industry experience, and funds
invested by the start-up team.The long list of factors that have little predictive value include gen-
der, ethnic background, household income and wealth, time devoted to
the start-up, and any characteristics of the ambient or host county.
The potential interaction and the ability to make distinctions among
groups are presented for the first four levels of analysis in Tables 5.12
and 5.13.6 The result is ten groups, four identified by four factors
and the others identified by three. To minimize idiosyncratic variation,groups with less than 20 cases were not further subdivided. The groups
are rank ordered in terms of the percentage reporting a new firm start-
up in the seventh year in Table 5.12. The results range from 81% of
those in group A to 5.2% of those in Group J; this considerable range –
a factor of 16, suggests these features are quite successful in separating
start-ups that lead to new firms from those that do not. The resulting
“model” explains 21% of the variance in the outcome – firm births.
To capture possible differences associated with gender, ethnic back-
ground, and age, the differences across these groups are provided in
Table 5.13. The cell entries indicate the difference between the actual
value and that expected if the overall prevalence was uniform across all
groups. The result, for example, indicates that the number of women
in Group C (row C) was 28% more than would be expected if there
was no variation across groups. The differences across groups are sta-
tistically significant for all three factors. This suggests that differencesassociated with the primary features of these ten groups are reflected
in comparisons based on age, gender, and ethnicity. But age, gender,
and ethnicity are not – in themselves – the critical source of differ-
ences in start-up success. Age, gender, and ethnicity are related to how
individuals chose to pursue a firm start-up in terms of activity domains,
6 The analysis was completed with the DTREG procedure version 3.5 developed and pro-vided by Phillip H. Sherrod “www.dtreg.com.” This model used a single tree with fivesplitting levels, classification analysis, Gini splitting algorithm, equal priors settings, equalmisclassification costs, equal weights on all variables, with a five fold true pruning and val-idation method with ten folds. All cases with missing values on any independent variableswere removed and the results were weighted with WTW1, after it was re-centered.

7/18/2019 New Firm Creation in the United
http://slidepdf.com/reader/full/new-firm-creation-in-the-united 92/168
5.3. Interactions: Who They are and What They are Doing? 79
T a b l e 5 . 1 2 S t a r t - u p s g r o u p e d b y s e c o n d y e a r
a c t i v i t y a n d s e v e n y e a r o u t c o m e s t a t u s
G r o u p
F i r s t l e
v e l
S e c o
n d l e v e l
T h i r d
l e v e l
F o
u r t h l e v e l
P r o p n e w fi
r m s ( % )
A
P r o d u c
t i o n i m p l e m e n t : h i g h
B u s i n e s s p r e s e n c e : h i g h
S t a t e
t e n u r e : 1 0 o r m o r e y r s
I n d u s t r y e x p e r :
6
o r m o r e y r s
8 1 . 3
B
P r o d u c
t i o n i m p l e m e n t : h i g h
B u s i n e s s p r e s e n c e : h i g h
S t a t e
t e n u r e : 1 0 o r m o r e y r s
I n d u s t r y e x p e r :
0
– 5 y r s
5 3 . 9
C
P r o d u c
t i o n i m p l e m e n t : h i g h
B u s i n e s s p r e s e n c e : h i g h
S t a t e
t e n u r e : 1 0 o r m o r e y r s
4 9 . 0
D
P r o d u c
t i o n i m p l e m e n t : h i g h
B u s i n e s s p r e s e n c e : l o w
I n d u s
t r y e x p e r : 6 + y e a r s
4 7 . 0
E
P r o d u c
t i o n i m p l e m e n t : l o w
I n v e
s t e d : $ 3 , 0 0 0 a n d u p
P e r s o
n a l p r e p a r a t i o n : l o w
3 5 . 6
F
P r o d u c
t i o n i m p l e m e n t : l o w
I n v e
s t e d : u n d e r $ 3 , 0 0 0
I n d u s
t r y e x p e r : 1 + Y r s
I n v e s t e d :
o
v e r $ 3 0 / m o n t h
2 3 . 5
G
P r o d u c
t i o n i m p l e m e n t : h i g h
B u s i n e s s p r e s e n c e : l o w
I n d u s
t r y e x p e r : 0 – 5 y e a r s
2 2 . 4
H
P r o d u c
t i o n i m p l e m e n t : l o w
I n v e
s t e d : $ 3 , 0 0 0 a n d u p
P e r s o
n a l p r e p a r a t i o n : h i g h
1 1 . 8
I
P r o d u c
t i o n i m p l e m e n t : l o w
I n v e
s t e d : u n d e r $ 3 , 0 0 0
I n d u s
t r y e x p e r : 1 + Y r s
I n v e s t e d :
u
n d e r
$
3 0 / m o n t h
9 . 9
J
P r o d u c
t i o n i m p l e m e n t : l o w
i n v e s t e d : u n d e r $ 3 , 0 0 0
I n d u s
t r y e x p e r : n o n e
5 . 2
A v e r a g e v a l u e s
3 0 . 8 %
7/18/2019 New Firm Creation in the United
http://slidepdf.com/reader/full/new-firm-creation-in-the-united 93/168
80 Creating a New Business: Results from the Start-Up
intensity of focus, and accumulation of the funds needed to implement
a new firm.
Second, the analysis leads to groups of start-up initiatives with dif-ferent characteristics and different outcomes, identified in Tables 5.12
and 5.13 by letters, from A to J. The groups can be described as follows:
Group A is characterized by a major emphasis on implement-
ing a production process – purchasing raw materials,
arranging for assets, supplier credit, initial receipt of
income – and establishing a business presence – bankaccounts, dedicated phone lines and listings, full time
effort of the respondent, and hiring of an employee.
These nascent entrepreneurs have lived in the state
for more than ten years and have six or more years of
industry experience. While they represent only 9% of
all start-ups, the fact that 81% are reporting an oper-
ating new business indicates they are 23% of all new
firms in this sample. Men, Whites, and those 35–54
years of age are slightly overrepresented in this group.
Group B is almost identical to Group A except they have less
than six years experience in the same industry as the
start-up. There is an overrepresentation of Whites,
women, and those under 34 or over 55 years of age.
They are 4% of the start-up efforts and as 54% report
a new firm, they are 6% of all start-ups.Group C reflects a strong emphasis on both the production
process and establishing a business presence and more
than ten years residence in the state. There is a slight
over-representation of Whites, men, and those over
54 years of age. This group is 6% of the start-ups
and because 49% report success, they are 10% of new
firms.Group D also reflects a strong emphasis on production imple-
mentation, but a low emphasis on business pres-
ence, and these nascents report six or more years
of same industry experience. The group has a slight
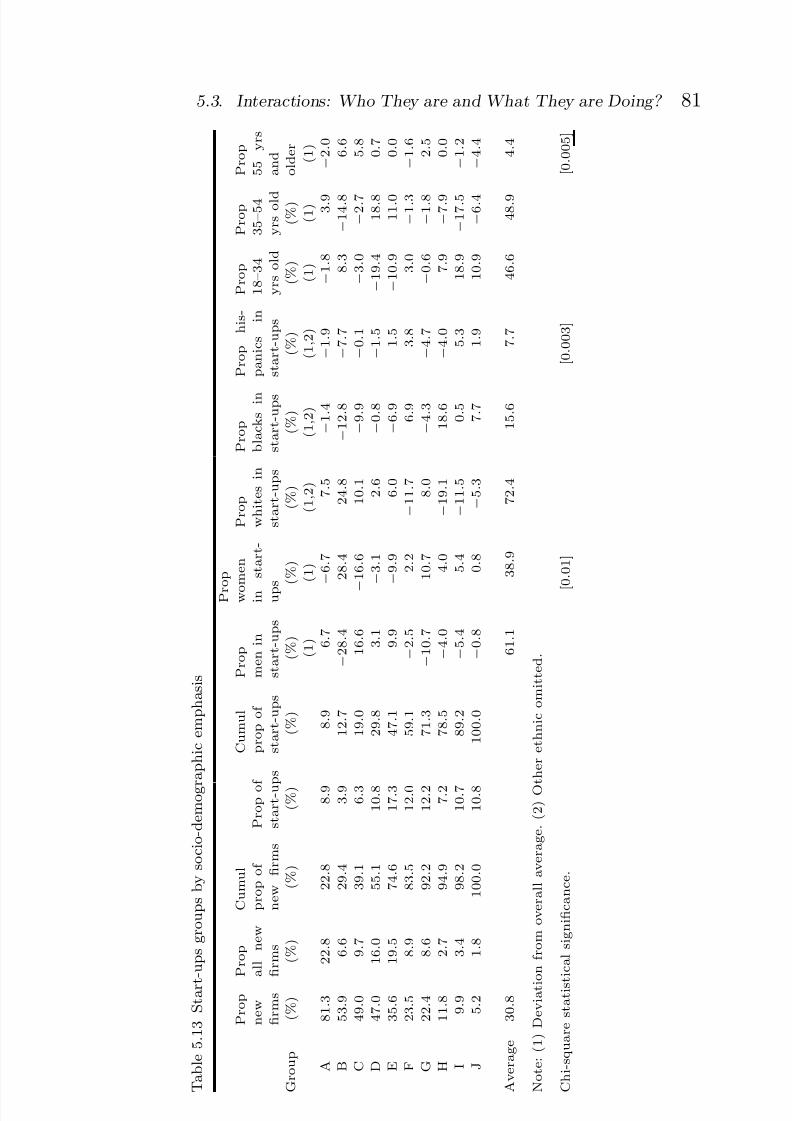
7/18/2019 New Firm Creation in the United
http://slidepdf.com/reader/full/new-firm-creation-in-the-united 94/168
5.3. Interactions: Who They are and What They are Doing? 81
T a b l e 5 . 1 3 S t a r t - u p s g r o u p s b y s o c i o - d e m o g r
a p h i c e m p h a s i s
G r o u p
P r o p
n e w
fi r m s
( % )
P r o p
a l l n e w
fi r m s
( % )
C u m u l
p r o p o f
n e w
fi r m s
( % )
P r o p o f
s t a r t - u p s
( % )
C u m u l
p r o p o f
s t a r t - u p s
( % )
P r o p
m e n i n
s t a r t - u p s
( % )
P r o p
w o
m e n
i n
s t a r t -
u p s (
% )
P r o p
w h i t e s i n
s t a r t - u p s
( % )
P r o p
b l a c k s i n
s t a r t - u p s
( % )
P r o p
h i s -
p a n i c s
i n
s t a r t - u p s
( % )
P r o p
1 8 –
3 4
y r s o l d
( % )
P r o p
3 5 –
5 4
y r s o l d
( % )
P r o p
5 5
y r s
a n d
o l d e r
( 1 )
( 1 )
( 1 , 2
)
( 1 , 2
)
( 1 , 2
)
( 1 )
( 1 )
( 1 )
A
8 1 . 3
2 2 . 8
2 2 . 8
8 . 9
8 . 9
6 . 7
− 6 .
7
7 . 5
− 1 .
4
− 1 .
9
− 1 .
8
3 . 9
− 2 .
0
B
5 3 . 9
6 . 6
2 9 . 4
3 . 9
1 2 . 7
− 2 8 .
4
2 8 . 4
2 4 . 8
− 1 2 .
8
− 7 .
7
8 . 3
− 1 4 . 8
6 . 6
C
4 9 . 0
9 . 7
3 9 . 1
6 . 3
1 9 . 0
1 6 . 6
−
1 6 .
6
1 0 . 1
− 9 .
9
− 0 .
1
− 3 .
0
− 2 . 7
5 . 8
D
4 7 . 0
1 6 . 0
5 5 . 1
1 0 . 8
2 9 . 8
3 . 1
− 3 .
1
2 . 6
− 0 .
8
− 1 .
5
− 1 9 .
4
1 8 . 8
0 . 7
E
3 5 . 6
1 9 . 5
7 4 . 6
1 7 . 3
4 7 . 1
9 . 9
− 9 .
9
6 . 0
− 6 .
9
1 . 5
− 1 0 .
9
1 1 . 0
0 . 0
F
2 3 . 5
8 . 9
8 3 . 5
1 2 . 0
5 9 . 1
− 2 .
5
2 . 2
− 1 1 .
7
6 . 9
3 . 8
3 . 0
− 1 . 3
− 1 .
6
G
2 2 . 4
8 . 6
9 2 . 2
1 2 . 2
7 1 . 3
− 1 0 .
7
1 0 . 7
8 . 0
− 4 .
3
− 4 .
7
− 0 .
6
− 1 . 8
2 . 5
H
1 1 . 8
2 . 7
9 4 . 9
7 . 2
7 8 . 5
− 4 .
0
4 . 0
− 1 9 .
1
1 8 . 6
− 4 .
0
7 . 9
− 7 . 9
0 . 0
I
9 . 9
3 . 4
9 8 . 2
1 0 . 7
8 9 . 2
− 5 .
4
5 . 4
− 1 1 .
5
0 . 5
5 . 3
1 8 . 9
− 1 7 . 5
− 1 .
2
J
5 . 2
1 . 8
1 0 0 . 0
1 0 . 8
1 0 0 . 0
− 0 .
8
0 . 8
− 5 .
3
7 . 7
1 . 9
1 0 . 9
− 6 . 4
− 4 .
4
A v e r a g e
3 0 . 8
6 1 . 1
3 8 . 9
7 2 . 4
1 5 . 6
7 . 7
4 6 . 6
4 8 . 9
4 . 4
N o t e :
( 1 ) D e v i a t i o n f r o m
o v e r a l l a v e r a g e .
( 2 ) O t h e r e t h n i c o m i t t e d .
C h i - s q u a r e s t a t i s t
i c a l s i g n i fi c a n c e .
[
0 . 0
1 ]
[ 0 . 0
0 3 ]
[ 0 . 0
0 5 ]

7/18/2019 New Firm Creation in the United
http://slidepdf.com/reader/full/new-firm-creation-in-the-united 95/168
82 Creating a New Business: Results from the Start-Up
overrepresentation of those 35–54 years of age. This
group includes 11% of the start-ups; a success rate of
47% leads to 16% of the new firms.Group E reflects a lack of emphasis on product implementa-
tion, a start-up team investment of $3,000 or more,
but a low level of personal preparation. There is a
slight overrepresentation of men, Whites, and those
35–54 years of age. As 36% of the group reports a
new firm, this 17% of the start-ups provides 20% of
the new firms.Group F reflects a low emphasis on product implementation,
a total investment of less than $3,000, one or more
years of industry experience, and a rate of invest-
ments in excess of $30 per month. There is a slight
over-representation of Blacks and Hispanics in this
group. This 12% of all start-ups, however, has a suc-
cess rate of 24% and accounts for 9% of all new firms.
Group G is composed of those with strong attention to the pro-
duction process but not much effort on the business
presence and less than five years of same industry
experience. Women are slightly over-represented as
are Whites. This group is about 12% of all start-ups
and 9% of new firms, reflecting a 22% success rate.
Group H is composed of those with little effort on production
implementation, a start-up team investment in excessof $3,000, and a high level of personal preparation.
There is a substantial overrepresentation of Blacks in
this group. While they are 7% of all start-ups, only
12% report an operational new firm; they provide 3%
of all new firms.
Group I reflects low attention to production implementation,
a total investment of less than $3,000, some sameindustry experience, but a rate of investment of
less than $30 per month. There is a slight over-
representation of women, Hispanics, and a major
overrepresentation of those under 35 years of age.

7/18/2019 New Firm Creation in the United
http://slidepdf.com/reader/full/new-firm-creation-in-the-united 96/168
5.3. Interactions: Who They are and What They are Doing? 83
This group is 11% of the start-ups but the 10% suc-
cess rate leads them to be 3% of all new firms.
Group J also reports little attention to production implemen-tation, investments of less than $3,000 and no same
industry experience. There is an overrepresentation of
Blacks as well as those under 35 years of age. While
they are 11% of start-ups they are only 2% of all new
firms, reflecting 5% of those that report a new firm is
in place.
In summary, then, it would appear that unique combinations of
start-up activities, personal experiences and contextual factors are asso-
ciated with different outcomes. There is little question that “doing
it” – taking action to implement a productive process and a business
presence – have a major impact, often associated with more same indus-
try experience.
Primary personal characteristics are associated with these other fea-
tures and may lead to differences in actions taken to implement new
firms. Of particular note is the greater representation of Whites among
those in the groups with higher rates of new firm creation, particularly
A, B, and C; these groups tend to be more successful in new firm cre-
ation. In contrast, Blacks tend to be overrepresented in groups F, H,
and J, those where new firms are less likely to be reported. Hispan-
ics, it is to be noted, seem to be rather evenly distributed among allthe groups, which may be why their outcome patterns, as shown in
Figure 5.4, are almost identical to Whites.
Younger adults, those 18–34 years of age, also seem to be overrep-
resented among groups with relatively low success rates, i.e., H, I, and
J. Older adults, those 55 years and above, seem to be overrepresented
in Groups B and C, which are relatively successful. Mid-career adults,
those 35–54 years of age, are clearly underrepresented in the less suc-cessful groups, F, G, H, I, and J.
Women, as a group, seem to be over-represented in Group B, which
has a high success rate, but also Groups G, H, and I, which have rather
low success rates. This results in an overall success rate that is the same
for men and women.

7/18/2019 New Firm Creation in the United
http://slidepdf.com/reader/full/new-firm-creation-in-the-united 97/168
84 Creating a New Business: Results from the Start-Up
One caution in terms of causal interpretations is important. It is
convenient to assume productive implementation and business presence
activities lead to a successful transition from start-up to new firm, butit could be that as the start-up team begins to focus on the 11 discrete
things associated with these two domains they are encouraged by others
in their commercial and personal networks. This encouragement could
provide an incentive to devote more time and resources to efforts to
create a viable new firm. These measures may reflect acceptance of the
new firm in the market place and positive reactions across a range of
dimensions that lead to a successful firm launch.One thing, however, is quite clear, compared with what is actually
done in the start-up process, socio-demographic and conceptual factors
do not have a major impact on which start-ups become firms.
5.4 Overview
Tracking the success of a representative sample of those involved in
business creation indicates that after seven years about one-third reporta new firm, one-third have disengaged, and about one-third are still
involved in attempting to create a new firm. Exploration of the impact
of over 130 factors, many reflecting reliable multi-item indices, and
23 organized into six activity domains, finds that many have very little
association with reports of new firm creation. Those that have the most
impact appear to be:
• Actions devoted to implementing a process for producing the
good or service• Actions devoted to developing a presence for the new business• Start-up team investment of funds into the process• Measures of business experience, particularly a background
in the same industry
In addition, it would appear that concentration of effort may lead to
a speedy resolution, leading nascent entrepreneurs to either implement
a new firm or disengage from the start-up process at an earlier point
in time.
7/18/2019 New Firm Creation in the United
http://slidepdf.com/reader/full/new-firm-creation-in-the-united 98/168
5.4. Overview 85
There are a number of other factors that may have some impact,
often in unexpected ways:
• Start-ups in more rural areas report more new firm are
created.• Those with an internal locus of control, those that prefer to
do things better and on their own, are more sophisticated
about economic decision making, and perhaps with more
social confidence may be more likely to report new firms.
But these influences are more subtle.
There is no question that many socio-demographic factors found to
have an important impact on determining who enters the start-up pro-
cess – age, gender, educational attainment, household income, house-
hold net worth, and the like – have little or no influence on completion
of the process with a new firm. The effects of ethnic background may
reflect the strategies adopted for creating a business, rather than any
other features associated with ethnic background, such as educationalattainment, work experience, or household income.

7/18/2019 New Firm Creation in the United
http://slidepdf.com/reader/full/new-firm-creation-in-the-united 99/168

7/18/2019 New Firm Creation in the United
http://slidepdf.com/reader/full/new-firm-creation-in-the-united 100/168
6Overview and Implications
How do new businesses come about? The most comprehensive anddetailed assessment of this issue is the first US Panel Study of
Entrepreneurial Dynamics. This project started with the screening of
64,000 US adults, and was followed by four extensive interviews spread
over a five year period. Analysis began with a consideration of 75 factors
that may affect the decision of an adult to get involved in the creation
of a new business – becoming a nascent entrepreneur. General compar-
isons were made of those active in start-ups with a sample of typicaladults identified in the screening surveys. Additional detailed compar-
isons between the nascent entrepreneurs and a small comparison group
were also explored. The assessment continued with an exploration of
over 130 factors that may be associated with completing the start-up
process with an operating new firm. This effort focused on understand-
ing how the 200 nascent entrepreneurs that reported a new firm within
seven years of entering the start-up process were different from that
468 that had quit or continued to work on the start-up.
There are a number of significant findings. First, perhaps, is the
large number of individuals involved as nascent entrepreneurs – per-
haps, 10 million in 1998–1999 when the PSED research project was
87
7/18/2019 New Firm Creation in the United
http://slidepdf.com/reader/full/new-firm-creation-in-the-united 101/168
88 Overview and Implications
implemented, perhaps as many as 16 million in 2005. Even the finding
that one-third of this number may be casual hobbyists – not pursu-
ing a new firm as a serious career option – does not detract from themagnitude of social effort devoted to the entrepreneurial process. This
is more US adults than have children or get married in a given year.
Clearly participation in business start-ups is a major feature of life in
the contemporary United States.
Second is the finding that the factors associated with entry into the
start-up process are not associated with completion of the process with
a new firm.1
The most important factors affecting both processes aresummarized in Table 6.1, reflecting the analyses reviewed in Chapters 4
and 5.
The major factors associated with entry into the start-up process
and becoming a nascent entrepreneur, such as age, gender, educational
attainment, household income or net worth, and residing in a commu-
nity with recent population growth, is unrelated to completion of the
start-up with a new firm. In fact, the host community characteristic
that seems to increase the presence of start-ups – recent population
growth – is inversely related to the level of urbanization; the transi-
tion from start-up to new firm seems to occur more frequently in more
rural areas. This may reflect a lack of competition for the new firm or
a scarcity of career options for the nascent entrepreneur, which may
enhance commitment to make the start-up succeed.
Two factors seem to be common at both stages of the process. Entry
into a start-up and completion with a firm both seem to be facilitatedby more work experience or more business classroom experience. Class-
room experience is, however, a secondary factor associated with entry
into the start-up process and has a small tertiary impact on completion
the process with a new firm. Measures of same industry business experi-
ence seem to have a major impact on the transition to an operating new
firm. The second primary factor is ethnic identity, which has a major
impact on which participation in a start-up; Blacks and Hispanics aremore involved in start-ups than whites. Blacks are, however, slightly
1 This same pattern has been found in a similar sample of Swedish nascent entrepreneurs(Davidsson and Honig, 2003).

7/18/2019 New Firm Creation in the United
http://slidepdf.com/reader/full/new-firm-creation-in-the-united 102/168
89
Table 6.1 Factors associated with entry into start-ups and new firm creation
Factors affecting entry into a start-up Factors affecting new firm creation
Primary factors:• Age• Gender• Current work activity• Ethnic background• Educational attainment
Primary factors:• Start-up activity to produce a
good or service• Start-up activity to develop a pres-
ence for the new firm• Measures of business experience,
particularly in the same industry• Start-up activity to create a finan-
cial and organizational structure• Start-up team financial
commitments• Concentration of resources (time,
money) and speedy completion of start-up activities
Secondary factors:
• Household income• Household net worth• Recent community
population growth• Extent, intensity of manage-
ment training and adminis-trative experience
• Positive impressions, encour-agement from friends andfamily
• Strong commitment andexpectations from anentrepreneurial career option
Secondary factors:
• Presence in a less urbanized,more rural area
• Personal traits
– Locus of control
–
Try to do better, notdifferently
– Economic sophistication
– Social confidence
• Ethnic background
less likely to report a firm birth than Whites or Hispanics, but thisseems to reflect an ineffective strategy adopted for start-ups by young
Blacks.
A third major finding is that the activity pursued in the start-up
process – not the characteristics of the entrepreneur or the start-up
or the setting – has a major impact on the successful transition to a
new firm. Actions associated with the productive process, developing a
presence for the new firm or developing an organizational and financialstructure, seem to be particularly important. This is, of course, closely
related to the intensity of effort devoted to the initiative by the start-up
team as well as the funds they assemble to facilitate implementation.
Intensity not only is more likely to lead to a new firm, but it is likely to

7/18/2019 New Firm Creation in the United
http://slidepdf.com/reader/full/new-firm-creation-in-the-united 103/168
90 Overview and Implications
accelerate implementation and, in addition, facilitate an earlier decision
by those that elect to abandon the process.
When a representative sample of adults are asked if they are cur-rently involved in creating a new firm, it is now clear that one-third are
treating this as a casual hobby; they may be those who are not invest-
ing substantial time and money in the effort and, in turn, a resolution
to their initiative is delayed – sometimes for decades.
6.1 Implications: Research
This project demonstrates, in a most powerful form, the benefits of a
detailed, multifaceted longitudinal study with a representative sample.
Without the effort to develop representative samples, the results could
be dismissed as an artifact of the individuals selected for the study.
Without identifying individuals at the initial stages of the process and
tracking outcomes over time, it would be possible to dismiss the poten-
tial for causal interpretations. Without the expansion of data collection
to cover dozens of facets proposed as significant in affecting participa-
tion in the start-up process and completion with a new firm, it would
be possible to consider the options for explanations as “incomplete.”
The use of a unique multivariate analysis has facilitated identifying
groups of people with great variation in the potential for entering the
start-up process. Almost 16 per 100 among the most active group,
18–54 year old Black men engaged in full or part-time work, report
participation in new firm creation, compared to 3 per 1,000 among theleast active group, women over 65 years old who are not working or
working part-time; this is a 58-fold difference in participation rates.
Predicting who will be active in the start-up process has two com-
ponents: who will and who will not become involved. It is clear that
predicting who will not be involved is very successful, since 997 per
1,000 in the least active group will not report participation in a start-
up. However, the majority, five in six, in the most active group are alsonot active nascent entrepreneurs. To increase the predictive success,
consideration of a wider range of personal and situational variables –
many identified in the nascent entrepreneur versus comparison group
assessment in Chapter 4, might yield some improvements. On the other

7/18/2019 New Firm Creation in the United
http://slidepdf.com/reader/full/new-firm-creation-in-the-united 104/168
6.1. Implications: Research 91
hand, such an effort would be expensive, as it would entail identify-
ing a representative sample of candidates – perhaps limited to those
18–54 years of age – with a strong potential for entering the start-upprocess and gathering a great deal of information on all respondents
in order to compare actual nascent entrepreneurs with all potential
nascent entrepreneurs. This could be quite expensive and it might be
more cost-effective to add the “nascent entrepreneur interview mod-
ule” to a comprehensive ongoing labor force survey like the monthly
US Current Population Survey.
When the technique for identifying the unique interactions amongcritical variables was applied to exploring transitions from start-up to
new firm, it was found that the most successful were those engaged in
production implementation and developing a business presence, having
over ten years residence in the state, and having six or more years of
same industry experience; 81 per 100 of this group reported a new firm
had been created. The least successful group were those not empha-
sizing production implementation, who had invested less than $3,000
in the start-up, and had no same industry experience; 5 per 100 of
this group reported a new firm was created. This is a 16-fold differ-
ence between the most extreme groups. The most successful groups
were more likely to involve mid-career White men; the least successful
groups were younger Blacks. This suggests that the modest associa-
tion between ethnic background and reporting a new firm in place may
reflect how the start-up effort is approached and implemented, rather
than the ethnicity of the nascent entrepreneur.These findings are a substantial contribution to understanding the
business creation process. It is, however, specific to the sample based
on a cohort of nascent entrepreneurs that emerged in one time period,
1998–2000. Given the dramatic rise in activity between 1998 and 2005,
different transition rates and factors may be present in a later cohort –
but it will take a five year follow-up to explore this issue. Results would
not be available until 2010. The importance of one factor – same indus-try experience – and the possibility that this has declined among the
post 2000 nascent entrepreneurs suggests that the transition rates to
new firms may decline for the most recent cohorts. This possibility
is consistent with the counts of new employer firm registrations in
7/18/2019 New Firm Creation in the United
http://slidepdf.com/reader/full/new-firm-creation-in-the-united 105/168
92 Overview and Implications
the federal data, which have been relatively constant over the past
decade.
Perhaps most significant is the clear indication that the most crit-ical factors affecting new firm creation are those associated with the
creation process itself – not individual traits, orientations, attitudes,
perceptions of the context (such as the entrepreneurial climate) or the
nature of the economic or social context. This is, perhaps, because of
the critical impact of the specific situation – the exact nature of the
business activity and the precise nature of the competition at hand. As
start-up teams get serious about implementation and devote time andenergy to adjusting strategy and focus to maximize attractiveness to
a specific group of customers – or potential customers – it would seem
that the ability to cope with the immediate situation are critical for a
successful new firm launch. Whether or not one is male or female; has
a high school degree or an MBA; is White, Black or Hispanic; has a
substantial household net worth; or is sophisticated about accounting
practices may not, in comparison, have much impact.
The assessment in Chapter 5 may not identify all the most promising
factors to incorporate in the next study, but it does identify a large
number that may be of limited value in predicting which start-ups will
become operational new firms.
6.2 Implications: Entry Into the Start-Up Process
This assessment is of some value for those who may be planning toenter the start-up process by indicating what lies ahead if they expect
to eventually launch a new firm. In particular, nascent entrepreneurs
should be apprised of the importance of business experience and the
capacity for a period of intense personal and financial commitments. On
a positive note, they can be informed that how they conduct the start-
up process is far more important than any personal attributes – age,
gender, ethnicity, educational attainment, household income or wealth,and the like. It would appear that creating a new business is truly an
egalitarian opportunity – everyone has a good chance to succeed or
fail, regardless of their station in life or social attributes. What will be
critical is how the start-up team pursues the development of a new firm.

7/18/2019 New Firm Creation in the United
http://slidepdf.com/reader/full/new-firm-creation-in-the-united 106/168
6.3. Implications: New Firm Creation 93
6.3 Implications: New Firm Creation
The major factors are two: knowledge about business and the industryand intensity of commitment. It may not matter how the knowledge
is obtained – formal coursework, apprenticeship in other firms, general
business experience – but it is clear that knowing the world of business
and the specific industry in which the firm is to be located is a major
asset in implementing a new business. Experience with other start-ups,
regardless of its intuitive appeal, does not appear to be a major asset.
Intensity of effort is also a clear indicator. Both the level of personal
commitment and the amount of funds assembled from the start-up team
appear to be associated with successful implementation of a new firm.
There is also guidance regarding the focus of these efforts. Primary
attention should be given to the mechanisms for creation of the good or
service to be sold, closely followed by efforts to create a publicly visible
business entity, one with a phone listing, a phone line, an employee,
etc. In short, a focus on putting the business in place seems to be most
effective in having a business in place.Most important – and encouraging – anybody can do this. There
is no magic associated with being White, Black or Hispanic, having
more education, being a man, experience with an earlier start-up, or
having an “entrepreneurial personality” – none of these traits seem to
make any difference. Anybody with the knowledge, skill, ideas, drive,
and resources that emphasize business creation may establish a new
business.
6.4 Implications: Public Policy
Implications depend, of course, on the policy objectives. Policy efforts
tend to emphasize new firm creation – the entrepreneurial process –
often reflects two different objectives. One is to promote overall eco-
nomic growth and adaptation, usually at the national level, but oftenfor specific regions. The other is to facilitate the work careers or eco-
nomic advancement of certain groups – women, minorities, immigrants,
etc. Implications are slightly different for these two objectives for the
two major transitions in the business creation process – entry into the
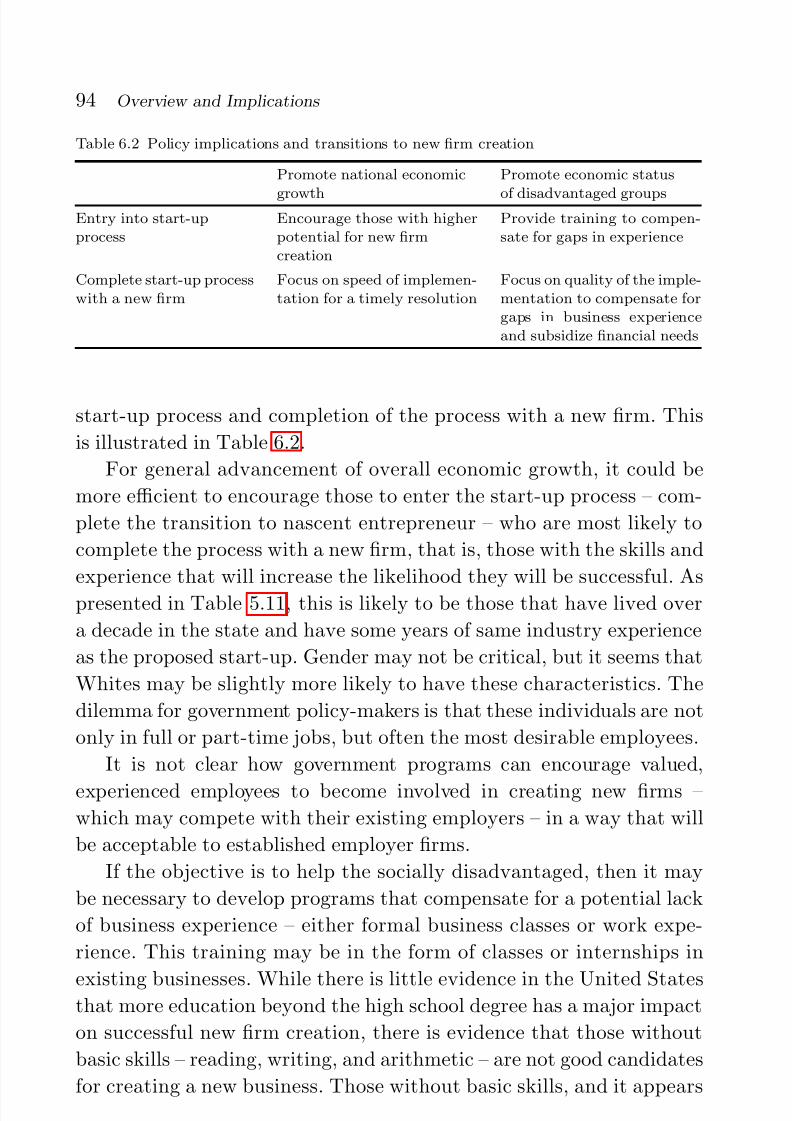
7/18/2019 New Firm Creation in the United
http://slidepdf.com/reader/full/new-firm-creation-in-the-united 107/168
94 Overview and Implications
Table 6.2 Policy implications and transitions to new firm creation
Promote national economic
growth
Promote economic status
of disadvantaged groupsEntry into start-upprocess
Encourage those with higherpotential for new firmcreation
Provide training to compen-sate for gaps in experience
Complete start-up processwith a new firm
Focus on speed of implemen-tation for a timely resolution
Focus on quality of the imple-mentation to compensate forgaps in business experienceand subsidize financial needs
start-up process and completion of the process with a new firm. This
is illustrated in Table 6.2.
For general advancement of overall economic growth, it could be
more efficient to encourage those to enter the start-up process – com-
plete the transition to nascent entrepreneur – who are most likely to
complete the process with a new firm, that is, those with the skills and
experience that will increase the likelihood they will be successful. As
presented in Table 5.11, this is likely to be those that have lived over
a decade in the state and have some years of same industry experience
as the proposed start-up. Gender may not be critical, but it seems that
Whites may be slightly more likely to have these characteristics. The
dilemma for government policy-makers is that these individuals are not
only in full or part-time jobs, but often the most desirable employees.
It is not clear how government programs can encourage valued,
experienced employees to become involved in creating new firms –which may compete with their existing employers – in a way that will
be acceptable to established employer firms.
If the objective is to help the socially disadvantaged, then it may
be necessary to develop programs that compensate for a potential lack
of business experience – either formal business classes or work expe-
rience. This training may be in the form of classes or internships in
existing businesses. While there is little evidence in the United Statesthat more education beyond the high school degree has a major impact
on successful new firm creation, there is evidence that those without
basic skills – reading, writing, and arithmetic – are not good candidates
for creating a new business. Those without basic skills, and it appears

7/18/2019 New Firm Creation in the United
http://slidepdf.com/reader/full/new-firm-creation-in-the-united 108/168
6.4. Implications: Public Policy 95
that over one-quarter of US junior high graduates do not finish high
school (Greene and Winters, 2005), may benefit from remedial work in
reading, writing, and arithmetic.Once the business creation process has begun, the emphasis might
be slightly different. Those programs designed to enhance economic
growth will have encouraged the most skilled and energetic employees
to pursue new firm creation. The major cost may be the time fore-
gone from other career options. To minimize this cost, these start-
up teams should emphasize moving quickly to develop and implement
a productive mechanism and create a presence for the business. Atimely resolution of the central question, “Is this new business idea
viable?” will reduce the aggregate human and financial investment.
This “testing cost” will be minimized if the time to resolution – new
firm or disengagement – is reduced. Strong evidence suggests that
the greater the intensity and breadth of activities implemented, the
sooner the issue is resolved. The experienced and well-connected per-
sons in these programs might benefit from assistance in the search
for start-up funding, but they may not require substantial financial
subsidies.
A slightly different focus might be more suited to assistance for
the disadvantaged groups. As they may not have the business back-
ground or skills, more attention might be paid to the development of
the implementation strategy – reflected in creation of a detailed busi-
ness plan – and provision of an experienced mentor who might guide
them through the start-up process. As this group may include thosewith limited work experience and modest financial resources, it may be
appropriate to provide some financial subsidy, perhaps in conjunction
with funds provided by established commercial sources.
It is, of course, an open question whether government policies and
programs are needed to encourage experienced workers and adminis-
trators to pursue new business creation in the United States. Large
numbers of Americans, 16 million or more, are currently pursing theseoptions without much direct encouragement or significant assistance
from any federal, state, or local government initiatives. A more appro-
priate emphasis might be to ensure that government policies and
7/18/2019 New Firm Creation in the United
http://slidepdf.com/reader/full/new-firm-creation-in-the-united 109/168
96 Overview and Implications
procedures do not hinder the speedy resolution of the central ques-
tion – “Is this business viable?”
Other countries, where the rate of new firm creation is quite low,are another matter. Many advanced countries in Europe – as well as
Japan – have a very low rate of participation in business creation. They
may benefit by implementing policies to promote entrepreneurship and,
in turn, national economic growth and adaptation.
Assistance for disadvantaged groups, however, may be a challenge in
all countries. In most countries, there are distinctive groups or regions
where economic growth or well-being is sub-optimal. The basic strate-gies for assisting these groups – training to compensate for a lack of
business experience, assistance in developing a appropriate business
plan, and help in securing the resources for implementation – is likely
to be the same in all countries. Major variations may be related to the
need to acquaint the potential entrepreneurs with the social and cul-
tural norms of the potential customers; an issue to be addressed with
new immigrants.
7/18/2019 New Firm Creation in the United
http://slidepdf.com/reader/full/new-firm-creation-in-the-united 110/168
References
Armington, C. and Z. Acs (2002), ‘The determinants of region variation
in new firm formation’. Regional Studies 36(1), 33–45.
Davidsson, P. (2006), ‘Nascent Entrepreneurship’. In Foundations and
Trends in Entrepreneurship Series . Vol. 2. Hanover, MA: now Pub-
lishers, Inc, p. 1.
Davidsson, P. and B. Honig (2003), ‘The role of social and human
capital among nascent entrepreneurs’. Journal of Business Venturing
18(3), 301–331.
Delmar, F. and S. Shane (2003), ‘Does business planning facilitate thedevelopment of new ventures?’. Strategic Management Journal 24,
1165–1185.
Gartner, W. B., K. B. Shaver, N. M. Carter, and P. D. Reynolds (eds.)
(2004), Handbook of Entrepreneurial Dynamics: The Process of Busi-
ness Creation . Thousand Oaks, CA: Sage.
Greene, J. P. and M. A. Winters (2005), Public High School and
College-Readiness Rates: 1991–2002 , Education Working Paper No.8. New York, NY: Manhattan Institute for Policy Research.
Kuhn, T. S. (1962), The Structure of Scientific Revolutions . Chicago,
Ill: University of Chicago Press.
Reynolds, P., N. Bosma, E. Autio, S. Hunt, N. D. Bono, I. Servais,
P. Lopez-Garcia, and N. Chin (2005), ‘Global entrepreneurship97

7/18/2019 New Firm Creation in the United
http://slidepdf.com/reader/full/new-firm-creation-in-the-united 111/168
98 References
monitor: Data collection design and implementation: 1998–2003’.
Small Business Economics 24, 205–231.
Reynolds, P. D. (1971a), ‘Comment on “The distribution of partic-ipation in group discussions” as related to group size’. American
Sociological Review 36(4), 704–706.
Reynolds, P. D. (1971b), A Primer in Theory Construction . New York:
MacMillan. reissued by Allyn and Bacon in 2006.
Reynolds, P. D. (2007), Entrepreneurship in the United States: The
Future is Now . New York: Springer.
Reynolds, P. D., W. D. Bygrave, E. Autio, L. Cox, and M. Hay (2002),Global Entrepreneurship Monitor: 2002 Executive Report . Kansas
City, MO: Kauffman Center for Entrepreneurial Leadership.
Reynolds, P. D., W. D. Bygrave, E. Autio, and Others (2004a), Global
Entrepreneurship Monitor: 2003 Summary Report . Babson Park,
MA: Babson College.
Reynolds, P. D., S. M. Camp, W. D. Bygrave, E. Autio, and M. Hay
(2001), Global Entrepreneurship Monitor: 2001 Executive Report .
Kansas City, MO: Kauffman Center for Entrepreneurial Leadership.
Reynolds, P. D., N. M. Carter, W. B. Gartner, and P. G. Greene
(2004b), ‘The prevalence of nascent entrepreneurs in the United
States: Evidence from the panel study of entrepreneurial dynamics’.
Small Business Economics 23(4), 263–284.
Reynolds, P. D., M. Hay, W. D. Bygrave, S. M. Camp, and E. Autio
(2000), Global Entrepreneurship Monitor: 2000 Executive Report .
Kansas City, MO: Kauffman Center for Entrepreneurial Leadership.Reynolds, P. D., M. Hay, and M. Camp (1999), Global Entrepreneurship
Monitor: 1999 Executive Report . Kansas City, MO: Kauffman Center
for Entrepreneurial Leadership.
Reynolds, P. D., B. Miller, and W. Maki (1995), ‘Explaining regional
variation in business births and deaths: U.S. 1976–1988’. Small Busi-
ness Economics 7, 389–407.
Shane, S. and S. Venkataraman (2000), ‘The promise of entrepreneur-ship as a field of research’. Academy of Management Review 25,
217–226.
Sherrod, P. H. (2005). DTREG: Classification and Regression Trees for
Data Mining and Modeling . www.dtreg.com.

7/18/2019 New Firm Creation in the United
http://slidepdf.com/reader/full/new-firm-creation-in-the-united 112/168
PSED I Scholarly Works
Publications and Papers based the Panel Study of Entrepreneurial Dynamics Research Protocol, including thePSED I (U.S.) Data Set
Initiated by Per Davidsson (July 2005)
Update by Paul Reynolds (August 2005)
NOTE: Papers reflecting the Global Entrepreneurship Monitor research
program are excluded.
Books [Edited and monographs]
Gartner, W. B., K. G. Shaver, N. M. Carter, and P. D. Reynolds (2004),
Handbook of Entrepreneurial Dynamics: The Process of Business
Creation . Thousand Oaks, CA: Sage.
[NOTE: The 38 individual chapters and 3 appendices from thiswork are not listed.]
Reynolds, P. D. and S. B. White (1997), The Entrepreneurial Process:
Economic Growth, Men, Women, and Minorities. Westport, CT:
Quorum Books.
99

7/18/2019 New Firm Creation in the United
http://slidepdf.com/reader/full/new-firm-creation-in-the-united 113/168
100 PSED I Scholarly Works
Dissertations
Meeks, M. D. (2004), Antecedents to the Entrepreneurial Decision: An
Empirical Analysis of Three Predictive Models . Doctoral disserta-
tion. Boulder, CO: University of Colorado at Boulder.
Samuelsson, M. (2004), Creating New Ventures: A Longitudinal Inves-
tigation of the Nascent Venturing Process . Doctoral dissertation.
Jonkoping, Sweden: Jonkoping International Business School.
Stouder, M. D. (2002), The Capital Structure Decisions of Nascent
Entrepreneurs . Doctoral dissertation. Newark, NJ: Rutgers TheState University of New Jersey-Newark.
Peer Review Journal Articles
Acs, Z. J. and A. Varga (2005), ‘Entrepreneurship, agglomeration and
technological change’. Small Business Economics 24, 323–334.
Alsos, G. A. and L. Kolvereid (1998), ‘The business gestation process
of novice, serial and parallel business founders’. Entrepreneurship
Theory and Practice 22(4), 101–114.
Brush, C. G., L. F. Edelman, and T. Manolova (Forthcoming), ‘Proper-
ties of emerging organizations: An empirical test. Journal of Busi-
ness Venturing .
Brush, D. G., L. F. Edelman, and T. Manolova (Forthcoming), ‘The
effects of initial location, choice on resource assembly on likeli-hood of first sale in nascent firms’ Journal of Small Business
Management .
Carter, N. M., W. B. Gartner, and P. D. Reynolds (1996), ‘Explor-
ing start-up event sequences’. Journal of Business Venturing 11,
151–166.
Carter, N. M., W. B. Gartner, K. G. Shaver, and E. J. Gatewood (2003).
‘The career reasons of nascent entrepreneurs’. Journal of Business Venturing 18, 13–29.
Chandler, G. N., B. Honig, and J. Wiklund (2005), ‘Antecedents, mod-
erators and performance consequences of membership change in
new venture teams’. Journal of Business Venturing 20, 705–725.

7/18/2019 New Firm Creation in the United
http://slidepdf.com/reader/full/new-firm-creation-in-the-united 114/168
Publications and Papers based on the Panel Study 101
Davidsson, P., P. D. Reynolds (2005), ‘Entrepreneurship research inno-
vator, coordinator and disseminator’. Small Business Economics 24
351–358.Davidsson, P. and M. Henreksson (2002), ‘Institutional determinants of
the prevalence of start-ups and high-growth firms: Evidence from
Sweden’. Small Business Economics 19(2), 81–104.
Davidsson, P. and B. Honig (2003), ‘The role of social and human cap-
ital among nascent entrepreneurs’. Journal of Business Venturing
18(3), 301–331.
Delmar, F. and P. Davidsson (2000), ‘Where do they come from? Preva-lence and characteristics of nascent entrepreneurs’. Entrepreneur-
ship and Regional Development 12, 1–23.
Delmar, F. and S. Shane (2004), ‘Legitimating first: Organizing activi-
ties and the survival of new ventures’. Journal of Business Ventur-
ing 19, 385–410.
Eckhardt, J., S. Shane, and F. Delmar (In press), ‘Multi-stage selec-
tion and the financing of new ventures’ Management Science ,
forthcoming.
Edelman, L. F., C. G. Brush, and T. Manolova (Forthcoming),
‘Entrepreneurship education: Correspondence between practices
of nascent entrepreneurs and textbook prescriptions for success’.
Academy of Management Learning and Education .
Honig, B. (2001), ‘Learning strategies and resources for nascent
entrepreneurs and intrapreneurs’. Entrepreneurship Theory and
Practice 24(Fall), 21–35.Honig, B., P. Davidsson, and T. Karlsson (2005), ‘Learning strategies of
nascent entrepreneurs’. Journal of Competence-Based Management
1(3), 67–88.
Honig, B. and T. Karlsson (2004), ‘Institutional forces and the written
business plan’. Journal of Management 30(1), 29–48.
Liao, J. and H. Welsch (2003b), ‘Social capital and entrepreneurial
growth aspiration: A comparison of technology- and non-technology-based nascent entrepreneurs’. Journal of High Technol-
ogy Management Research 14, 149–170.
Newbert, S. L. (2005), ‘New firm formation: A dynamic capability per-
spective’. Journal of Small Business Management 43(1), 55–77.

7/18/2019 New Firm Creation in the United
http://slidepdf.com/reader/full/new-firm-creation-in-the-united 115/168
102 PSED I Scholarly Works
Reynolds, P. D. (1997), ‘Who starts new firms? Preliminary
explorations of firms-in-gestation’. Small Business Economics 9,
449–462.Reynolds, P. D., N. M. Carter, W. B. Gartner and P. G. Greene (2004),
‘The prevalence of nascent entrepreneurs in the United States: Evi-
dence from the panel study of entrepreneurial dynamics’. Small
Business Economics 23(4), 263–284.
Reynolds, P. D. and B. Miller (1992), ‘New firm gestation: Conception,
birth and implications for research’. Journal of Business Venturing
7, 405–417.Ruef, M., H. E. Aldrich, and N. M. Carter (2003), ‘The structure of
organizational founding teams: Homophily, strong ties, and iso-
lation among U.S. entrepreneurs’. American Sociological Review
68(2), 195–222.
Shane, S. and F. Delmar (2004), ‘Planning for the market: Busi-
ness planning before marketing and the continuation of organizing
efforts’. Journal of Business Venturing 19, 767–785.
Shaver, K. G., W. B. Gartner, E. Crosby, K. Bakalarova, and E. J.
Gatewood (2001), ‘Attributions about entrepreneurship: A frame-
work and process for analyzing reasons for starting a business’.
Entrepreneurship: Theory and Practice 26(2), 5–33.
Singh, R. P. and L. M. Lucas (2005), ‘Not just domestic engineers: An
exploratory study of homemaker entrepreneurs’. Entrepreneurship:
Theory and Practice 29(1), 79–91.
Peer Review Conference Presentations, Proceedings
Aldrich, H. E., N. M. Carter, M. Ruef, and P. H. Kim (2003), ‘Ham-
pered by homophily? The effects of team composition on the suc-
cess of nascent entrepreneurs’ organizing efforts (Summary)’. In
Frontiers of Entrepreneurship Research 2003 , W. D. Bygrave et al.
(eds.). Wellesley, MA: Babson College.Alsos, G. A. and E. C. Ljunggren (1998), ‘Does the business start-
up process differ by gender? A longitudinal study of nascent
entrepreneurs’. In Frontiers of Entrepreneurship Research 1998 ,
P. D. Reynolds et al. (eds.). Wellesley, MA: Babson College.

7/18/2019 New Firm Creation in the United
http://slidepdf.com/reader/full/new-firm-creation-in-the-united 116/168
Publications and Papers based on the Panel Study 103
Baltrusaityte, J., Z. J. Acs, and G. E. Hills (2005), Opportunity Recogni-
tion Processes and New Venture Failure: Examination of the PSED
Data. Paper presented at the Babson College/Kauffman Founda-tion Entrepreneurship Research Conference, Wellesley, MA.
Brush, C. G., L. F. Edelman, and T. Manolova (2004), ‘Properties of
emerging organizations: An empirical test’, At Academy of Manage-
ment Research Conference , New Orleans, LA, Academy Highlighted
Show Program Session.
Brush, C. G., L. F. Edelman, and T. Manolova (2003), ‘Home or
away: The impact of initial location decisions on resource assemblyin nascent firms’. Academy of Management Research Conference ,
Seattle, WA.
Brush. D. G., T. Manolova and L. F. Edelman (2003), ‘Home
or away: Initial location decisions and the construction of new
ventures’ resource base’. Babson College-Kauffman Foundation
Entrepreneurship Research Conference , Wellesley, MA.
Cassar, G. (2004), Entrepreneur Motivation, Growth Preferences and
Intended Venture Growth (Summary). Paper presented at the
Babson College/Kauffman Foundation Entrepreneurship Research
Conference, Strathclyde, Scotland.
Crosa, B., H. A. Aldrich, and L. A. Keister (2002), ‘Is there a
wealth effect? Financial and human capital determinants of business
start-ups’. In Frontiers of Entrepreneurship Research 2002 , W. D.
Bygrave et al. (eds.). Wellesley, MA: Babson College.
Delmar, F. and P. Davidsson (1999), ‘Firm size expectations of nascententrepreneurs’. In Frontiers of Entrepreneurship Research 1999 ,
P. D. Reynolds, W. D. Bygrave, S. Manigart, C. Mason, G. D.
Meyer, H. J. Sapienza, and K. G. Shaver (eds.). Vol. 19, pp. 90–
104. Wellesley, MA: Babson College.
Delmar, F. and J. Gunnarsson (2000), ‘How do self-employed parents of
nascent entrepreneurs contribute?’ In Frontiers of Entrepreneurship
Research 2000 , P. D. Reynolds et al. (eds.). Wellesley, MA: BabsonCollege.
Delmar, F. and S. Shane (2002), ‘What founders do: A longitudinal
study of the start-up process’. In Frontiers of Entrepreneurship

7/18/2019 New Firm Creation in the United
http://slidepdf.com/reader/full/new-firm-creation-in-the-united 117/168
104 PSED I Scholarly Works
Research 2002 , W. D. Bygrave et al. (eds.). pp. 632–645.
Wellesley, MA.
Delmar, F. and S. Shane (2003b), ‘Does the order of organizingactivities matter for new venture performance?’ In Frontiers of
Entrepreneurship 2003 , P. D. Reynolds et al. (eds.). Wellesley, MA:
Babson College.
Diochon, M., M. Menzies, and Y. Gasse (2003), Insights Into the
Dynamics of Canadian Nascent Entrepreneurs’ Start-Up Efforts
and the Role Individual Factors Play in the Process . Paper pre-
sented at the 20th Annual CCSBE Conference, Victoria.Edelman, L. F., C. G. Brush, and T. Manolova (2006), ‘One size
doesn’t fit all growth expectancies of U.S. women and men nascent
entrepreneurs’. Academy of Management Research Conference ,
Atlanta, Georgia.
Edelman, L.F., C. G. Brush, and T. Manolova (2005), ‘Entrepreneurial
education: Do they practice what we teach?’ Academy of Manage-
ment Research Conference , Honolulu, Hawaii.
Gartner, W. B., K. G. Shaver, and E. J. Gatewood (2000), ‘Doing it for
yourself: Career attributions of nascent entrepreneurs’. In Frontiers
of Entrepreneurship Research 2000 , P. D. Reynolds et al. (eds.).
Wellesley, MA: Babson College.
Hills, G. E., G. T. Lumpkin, and J. Baltrusaityte (2004), Opportunity
Recognition: Examining Search Formality, Search Processes and
the Impact on Firm Founding (Summary). Paper presented at the
Babson College/Kauffman Foundation Entrepreneurship ResearchConference, Strathclyde, Scotland.
Kim, P. H., H. A. Aldrich, and L. A. Keister (2003), If I Were
Rich? The Impact of Financial and Human Capital on Becoming a
Nascent Entrepreneur . Paper presented at the Annual Meeting of
the American Sociological Association, Atlanta.
Kim, P. H. and H. E. Aldrich (2004), Teams That Work Together,
Stay Together: Resiliency of Entrepreneurial Teams (Summary).Paper presented at the Babson College/Kauffman Foundation
Entrepreneurship Research Conference, Strathclyde, Scotland.
Liao, J. and H. Welsch (2002), ‘The temporal patterns of ven-
ture creation process: An exploratory study’. In Frontiers of
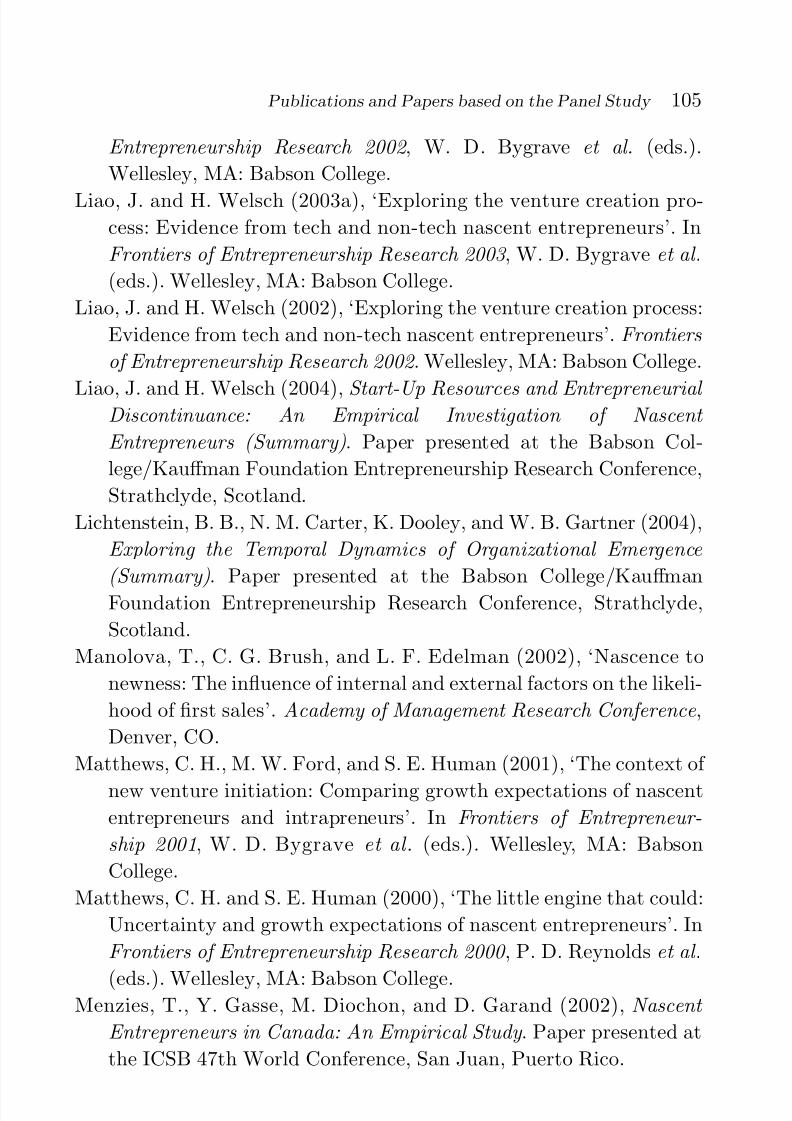
7/18/2019 New Firm Creation in the United
http://slidepdf.com/reader/full/new-firm-creation-in-the-united 118/168
Publications and Papers based on the Panel Study 105
Entrepreneurship Research 2002 , W. D. Bygrave et al. (eds.).
Wellesley, MA: Babson College.
Liao, J. and H. Welsch (2003a), ‘Exploring the venture creation pro-cess: Evidence from tech and non-tech nascent entrepreneurs’. In
Frontiers of Entrepreneurship Research 2003 , W. D. Bygrave et al.
(eds.). Wellesley, MA: Babson College.
Liao, J. and H. Welsch (2002), ‘Exploring the venture creation process:
Evidence from tech and non-tech nascent entrepreneurs’. Frontiers
of Entrepreneurship Research 2002 . Wellesley, MA: Babson College.
Liao, J. and H. Welsch (2004), Start-Up Resources and Entrepreneurial Discontinuance: An Empirical Investigation of Nascent
Entrepreneurs (Summary). Paper presented at the Babson Col-
lege/Kauffman Foundation Entrepreneurship Research Conference,
Strathclyde, Scotland.
Lichtenstein, B. B., N. M. Carter, K. Dooley, and W. B. Gartner (2004),
Exploring the Temporal Dynamics of Organizational Emergence
(Summary). Paper presented at the Babson College/Kauffman
Foundation Entrepreneurship Research Conference, Strathclyde,
Scotland.
Manolova, T., C. G. Brush, and L. F. Edelman (2002), ‘Nascence to
newness: The influence of internal and external factors on the likeli-
hood of first sales’. Academy of Management Research Conference ,
Denver, CO.
Matthews, C. H., M. W. Ford, and S. E. Human (2001), ‘The context of
new venture initiation: Comparing growth expectations of nascententrepreneurs and intrapreneurs’. In Frontiers of Entrepreneur-
ship 2001, W. D. Bygrave et al. (eds.). Wellesley, MA: Babson
College.
Matthews, C. H. and S. E. Human (2000), ‘The little engine that could:
Uncertainty and growth expectations of nascent entrepreneurs’. In
Frontiers of Entrepreneurship Research 2000 , P. D. Reynolds et al.
(eds.). Wellesley, MA: Babson College.Menzies, T., Y. Gasse, M. Diochon, and D. Garand (2002), Nascent
Entrepreneurs in Canada: An Empirical Study . Paper presented at
the ICSB 47th World Conference, San Juan, Puerto Rico.
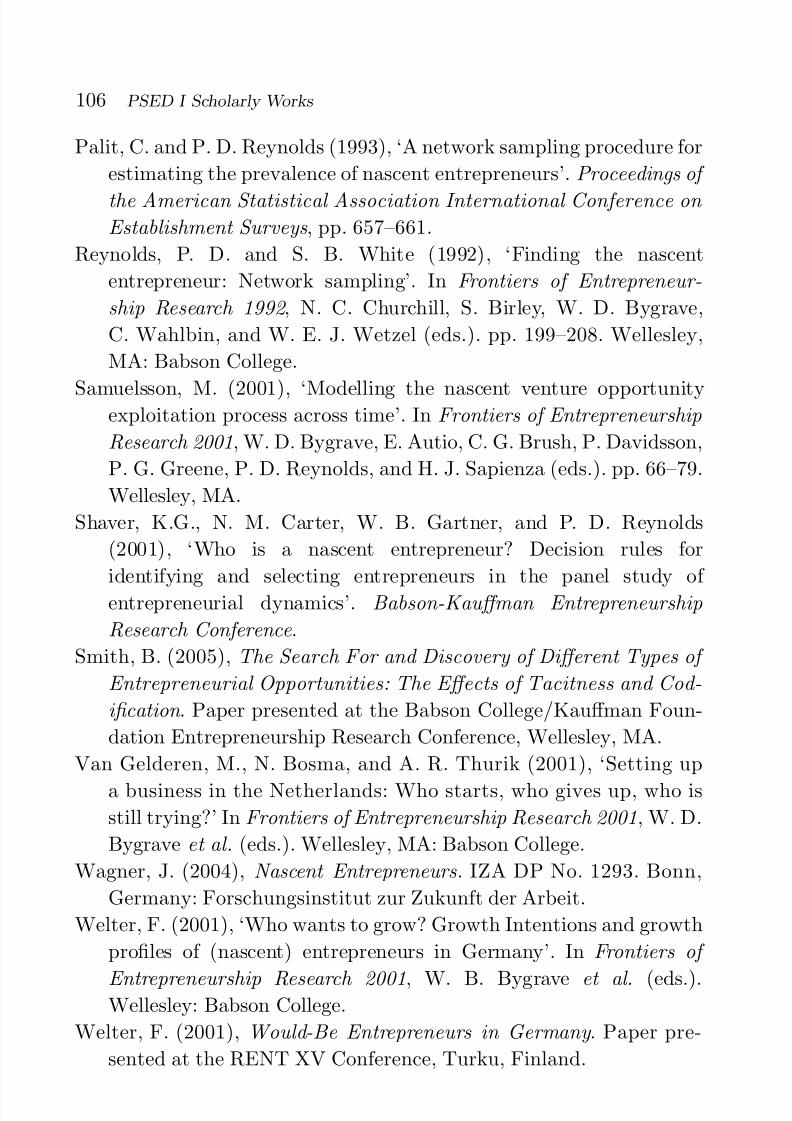
7/18/2019 New Firm Creation in the United
http://slidepdf.com/reader/full/new-firm-creation-in-the-united 119/168
106 PSED I Scholarly Works
Palit, C. and P. D. Reynolds (1993), ‘A network sampling procedure for
estimating the prevalence of nascent entrepreneurs’. Proceedings of
the American Statistical Association International Conference on Establishment Surveys , pp. 657–661.
Reynolds, P. D. and S. B. White (1992), ‘Finding the nascent
entrepreneur: Network sampling’. In Frontiers of Entrepreneur-
ship Research 1992 , N. C. Churchill, S. Birley, W. D. Bygrave,
C. Wahlbin, and W. E. J. Wetzel (eds.). pp. 199–208. Wellesley,
MA: Babson College.
Samuelsson, M. (2001), ‘Modelling the nascent venture opportunityexploitation process across time’. In Frontiers of Entrepreneurship
Research 2001, W. D. Bygrave, E. Autio, C. G. Brush, P. Davidsson,
P. G. Greene, P. D. Reynolds, and H. J. Sapienza (eds.). pp. 66–79.
Wellesley, MA.
Shaver, K.G., N. M. Carter, W. B. Gartner, and P. D. Reynolds
(2001), ‘Who is a nascent entrepreneur? Decision rules for
identifying and selecting entrepreneurs in the panel study of
entrepreneurial dynamics’. Babson-Kauffman Entrepreneurship
Research Conference .
Smith, B. (2005), The Search For and Discovery of Different Types of
Entrepreneurial Opportunities: The Effects of Tacitness and Cod-
ification . Paper presented at the Babson College/Kauffman Foun-
dation Entrepreneurship Research Conference, Wellesley, MA.
Van Gelderen, M., N. Bosma, and A. R. Thurik (2001), ‘Setting up
a business in the Netherlands: Who starts, who gives up, who isstill trying?’ In Frontiers of Entrepreneurship Research 2001, W. D.
Bygrave et al. (eds.). Wellesley, MA: Babson College.
Wagner, J. (2004), Nascent Entrepreneurs . IZA DP No. 1293. Bonn,
Germany: Forschungsinstitut zur Zukunft der Arbeit.
Welter, F. (2001), ‘Who wants to grow? Growth Intentions and growth
profiles of (nascent) entrepreneurs in Germany’. In Frontiers of
Entrepreneurship Research 2001, W. B. Bygrave et al. (eds.).Wellesley: Babson College.
Welter, F. (2001), Would-Be Entrepreneurs in Germany . Paper pre-
sented at the RENT XV Conference, Turku, Finland.

7/18/2019 New Firm Creation in the United
http://slidepdf.com/reader/full/new-firm-creation-in-the-united 120/168
Publications and Papers based on the Panel Study 107
Book Chapters
Davidsson, P. (2005), ‘Method issues in the study of venture start-upprocesses’. In Entrepreneurship Research in Europe: Outcomes and
Perspectives , A. Fayolle, P. Kyro, and J. Ulijn (eds.). pp. 35–54.
Cheltenham, UK: Edward Edgar.
Gartner, W. B. and N. M. Carter (2003), ‘Entrepreneurial behav-
ior and firm organising processes’. In Handbook of Entrepreneur-
ship Research , Z. J. Acs and D. B. Audretsch (eds.). pp. 195–221.
Dordrecht, NL: Kluwer.Greene, P. G., N. M. Carter, and P. D. Reynolds (2003), ‘Minority
entrepreneurship: Trends and explanation’. In New Movements in
Entrepreneurship, C. Steyaert and D. Hjorth (eds.). pp. 239–257.
Cheltenham, UK: Elgar.
Reynolds, P. D. (2000), ‘National panel study of US business start-ups.
Background and methodology’. In Advances in Entrepreneurship,
Firm Emergence and Growth , J. A. Katz (ed.), Vol. 4, pp. 153–227.
Stamford, CT: JAI Press.
Research Reports
de Rearte, A. G., E. Lanari, and P. A. A. J. Atucha (1998), El pro-
ceso de creaction de empresas; Abordaje methodologico y primeros
resultados de un studio regional. Argentina: Universidad Nacional
de Mar del Plata.Honig, B. and T. Karlsson (2001), Business Planning and the
Nascent Entrepreneur: An Empirical Study of Normative Behav-
ior . Jonkoping: Jonkoping International Business School.
Reynolds, P. D. and S. B. White (1993), Wisconsin’s Entrepreneurial
Climate Study. Milwaukee, WI: Marquette University Center for
the Study of Entrepreneurship.
Van Gelderen, M., A. R. Thurik, and N. Bosma (2003), ‘Success and
risk factors in the pre-startup phase’. SCALES paper N200314.
Zoetermeer, NL: EIM.

7/18/2019 New Firm Creation in the United
http://slidepdf.com/reader/full/new-firm-creation-in-the-united 121/168

7/18/2019 New Firm Creation in the United
http://slidepdf.com/reader/full/new-firm-creation-in-the-united 122/168
Acknowledgments
The first Panel Study of Entrepreneurial Dynamics was organized andimplemented by the Entrepreneurial Research Consortium [ERC], a
voluntary association of 34 member units with over 120 members; the
ERC was able to support the implementation of the project as well
as the first follow-up. The Ewing Marion Kauffman Foundation pro-
vided support for the second and third follow-up interviews and the
cost of shifting the operational base of the program from the Univer-
sity of Wisconsin to the University of Michigan Institute for SocialResearch. Additional support was provided by the National Science
Foundation for two enhancements, an over sample of women [Dr. Nancy
Carter, Principal Investigator, Grant SBR-9809841] and an over sample
of minorities [Dr. Patricia Green, Principal Investigator, Grant SBR-
9905255]. Substantial support was provided to the author during the
completion of the research by Marquette University, Babson College,
and Florida International University.
109

7/18/2019 New Firm Creation in the United
http://slidepdf.com/reader/full/new-firm-creation-in-the-united 123/168

7/18/2019 New Firm Creation in the United
http://slidepdf.com/reader/full/new-firm-creation-in-the-united 124/168
AMethodlogical Appendices
Appendix.4Ax.1 Notes on Assessment of the ScreeningData
The following lists the actual variables used in the analysis presented
in Figures 4.2, 4.3, 4.4, 4.5, and Tables 4.1 and 4.2. All are from the
Table 4Ax.1.1 Variables used from PSED I screening data file
Variable labelScreening interviewdataset variable labels
Active in start-up process [0 = not active, 1 = active] SUOWNACTGender USGENDERAge categories USAGE7CEthnic background USRACE4Educational attainment USEDUC5Household income USHHINC6Labor force participation USLABFR3Martial status USMARR
Household size USHHSZE3Annual rate of population growth: 1980–1992 [four categories] US8092A4Population density [persons per square mile in 1992, four
categories]USPDN924
Urbanization index, composed of average value of four items[Chronbach’s alpha = 0.87], continuous index then placed in
four ordinal quartiles
PCINC93, HH75K89,PC254490, PCOLL90
111
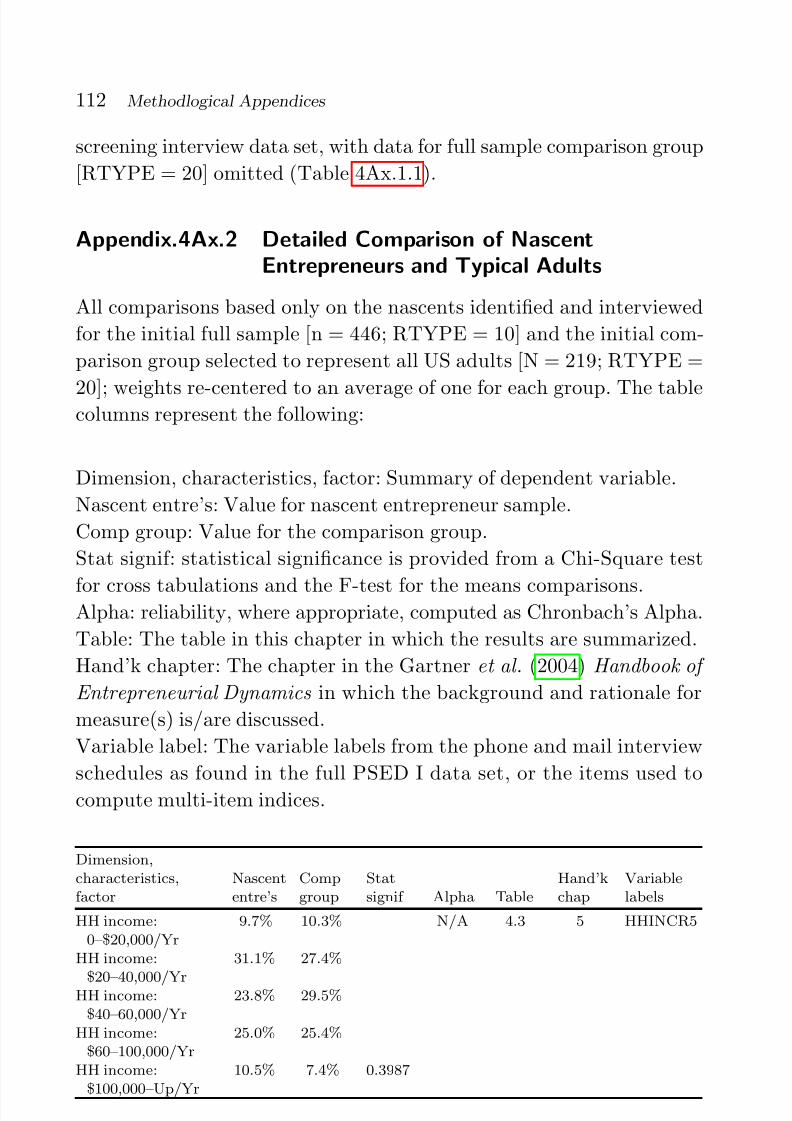
7/18/2019 New Firm Creation in the United
http://slidepdf.com/reader/full/new-firm-creation-in-the-united 125/168
112 Methodlogical Appendices
screening interview data set, with data for full sample comparison group
[RTYPE = 20] omitted (Table 4Ax.1.1).
Appendix.4Ax.2 Detailed Comparison of NascentEntrepreneurs and Typical Adults
All comparisons based only on the nascents identified and interviewed
for the initial full sample [n = 446; RTYPE = 10] and the initial com-
parison group selected to represent all US adults [N = 219; RTYPE =
20]; weights re-centered to an average of one for each group. The tablecolumns represent the following:
Dimension, characteristics, factor: Summary of dependent variable.
Nascent entre’s: Value for nascent entrepreneur sample.
Comp group: Value for the comparison group.
Stat signif: statistical significance is provided from a Chi-Square test
for cross tabulations and the F-test for the means comparisons.Alpha: reliability, where appropriate, computed as Chronbach’s Alpha.
Table: The table in this chapter in which the results are summarized.
Hand’k chapter: The chapter in the Gartner et al. (2004) Handbook of
Entrepreneurial Dynamics in which the background and rationale for
measure(s) is/are discussed.
Variable label: The variable labels from the phone and mail interview
schedules as found in the full PSED I data set, or the items used to
compute multi-item indices.
Dimension,characteristics,factor
Nascententre’s
Compgroup
Statsignif Alpha Table
Hand’kchap
Variablelabels
HH income:0–$20,000/Yr
9.7% 10.3% N/A 4.3 5 HHINCR5
HH income:
$20–40,000/Yr
31.1% 27.4%
HH income:$40–60,000/Yr
23.8% 29.5%
HH income:$60–100,000/Yr
25.0% 25.4%
HH income:$100,000–Up/Yr
10.5% 7.4% 0.3987
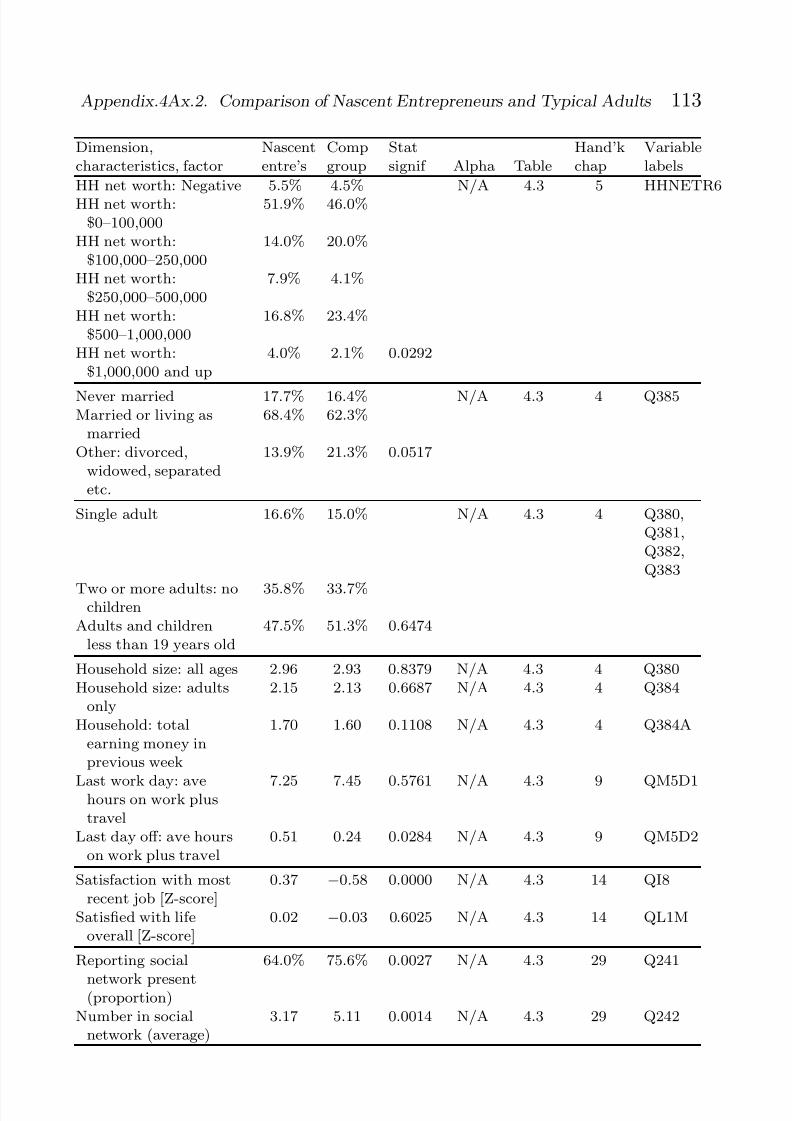
7/18/2019 New Firm Creation in the United
http://slidepdf.com/reader/full/new-firm-creation-in-the-united 126/168
Appendix.4Ax.2. Comparison of Nascent Entrepreneurs and Typical Adults 113
Dimension,characteristics, factor
Nascententre’s
Compgroup
Statsignif Alpha Table
Hand’kchap
Variablelabels
HH net worth: Negative 5.5% 4.5% N/A 4.3 5 HHNETR6HH net worth:
$0–100,00051.9% 46.0%
HH net worth:$100,000–250,000
14.0% 20.0%
HH net worth:$250,000–500,000
7.9% 4.1%
HH net worth:$500–1,000,000
16.8% 23.4%
HH net worth:$1,000,000 and up
4.0% 2.1% 0.0292
Never married 17.7% 16.4% N/A 4.3 4 Q385Married or living as
married68.4% 62.3%
Other: divorced,widowed, separatedetc.
13.9% 21.3% 0.0517
Single adult 16.6% 15.0% N/A 4.3 4 Q380,Q381,Q382,Q383
Two or more adults: nochildren
35.8% 33.7%
Adults and childrenless than 19 years old
47.5% 51.3% 0.6474
Household size: all ages 2.96 2.93 0.8379 N/A 4.3 4 Q380Household size: adults
only2.15 2.13 0.6687 N/A 4.3 4 Q384
Household: totalearning money inprevious week
1.70 1.60 0.1108 N/A 4.3 4 Q384A
Last work day: avehours on work plustravel
7.25 7.45 0.5761 N/A 4.3 9 QM5D1
Last day off: ave hourson work plus travel
0.51 0.24 0.0284 N/A 4.3 9 QM5D2
Satisfaction with mostrecent job [Z-score]
0.37 −0.58 0.0000 N/A 4.3 14 QI8
Satisfied with lifeoverall [Z-score]
0.02 −0.03 0.6025 N/A 4.3 14 QL1M
Reporting social
network present(proportion)
64.0% 75.6% 0.0027 N/A 4.3 29 Q241
Number in socialnetwork (average)
3.17 5.11 0.0014 N/A 4.3 29 Q242
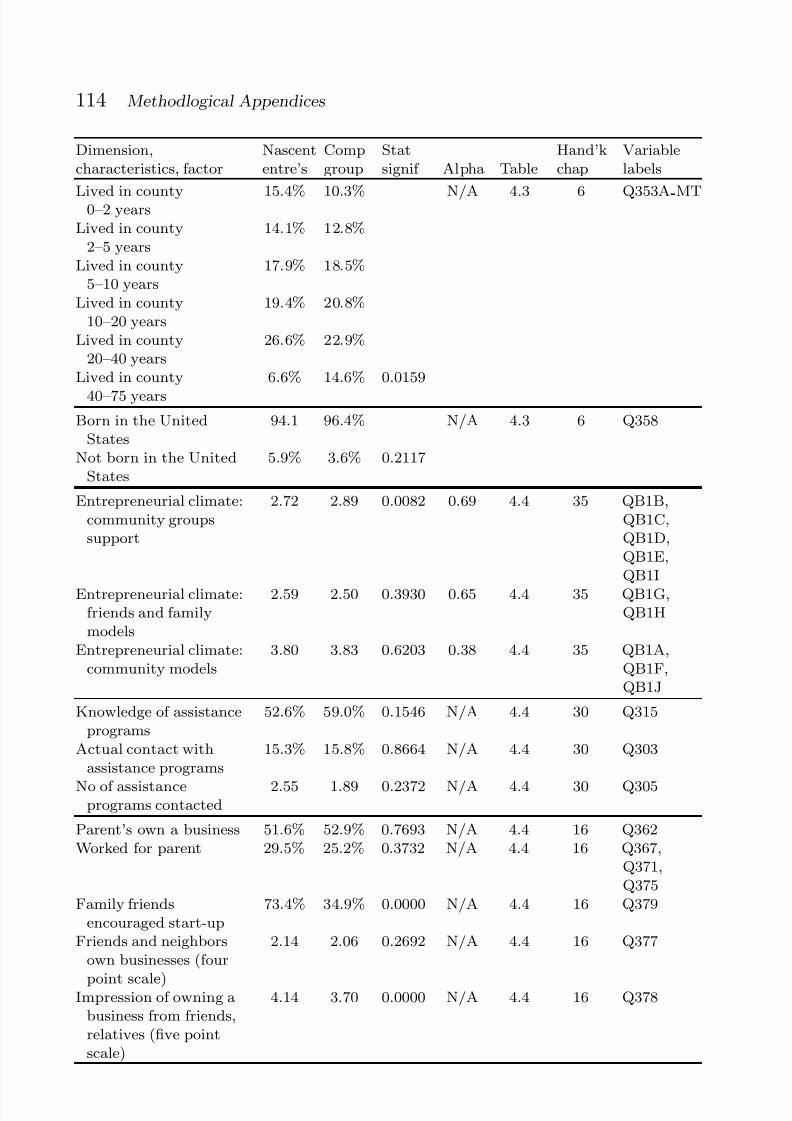
7/18/2019 New Firm Creation in the United
http://slidepdf.com/reader/full/new-firm-creation-in-the-united 127/168
114 Methodlogical Appendices
Dimension,characteristics, factor
Nascententre’s
Compgroup
Statsignif Alpha Table
Hand’kchap
Variablelabels
Lived in county0–2 years 15.4% 10.3% N/A 4.3 6 Q353A MT
Lived in county2–5 years
14.1% 12.8%
Lived in county5–10 years
17.9% 18.5%
Lived in county10–20 years
19.4% 20.8%
Lived in county20–40 years
26.6% 22.9%
Lived in county
40–75 years
6.6% 14.6% 0.0159
Born in the UnitedStates
94.1 96.4% N/A 4.3 6 Q358
Not born in the UnitedStates
5.9% 3.6% 0.2117
Entrepreneurial climate:community groupssupport
2.72 2.89 0.0082 0.69 4.4 35 QB1B,QB1C,QB1D,QB1E,QB1I
Entrepreneurial climate:friends and familymodels
2.59 2.50 0.3930 0.65 4.4 35 QB1G,QB1H
Entrepreneurial climate:community models
3.80 3.83 0.6203 0.38 4.4 35 QB1A,QB1F,QB1J
Knowledge of assistanceprograms
52.6% 59.0% 0.1546 N/A 4.4 30 Q315
Actual contact withassistance programs
15.3% 15.8% 0.8664 N/A 4.4 30 Q303
No of assistanceprograms contacted
2.55 1.89 0.2372 N/A 4.4 30 Q305
Parent’s own a business 51.6% 52.9% 0.7693 N/A 4.4 16 Q362Worked for parent 29.5% 25.2% 0.3732 N/A 4.4 16 Q367,
Q371,Q375
Family friendsencouraged start-up
73.4% 34.9% 0.0000 N/A 4.4 16 Q379
Friends and neighborsown businesses (four
point scale)
2.14 2.06 0.2692 N/A 4.4 16 Q377
Impression of owning abusiness from friends,relatives (five pointscale)
4.14 3.70 0.0000 N/A 4.4 16 Q378

7/18/2019 New Firm Creation in the United
http://slidepdf.com/reader/full/new-firm-creation-in-the-united 128/168
Appendix.4Ax.2. Comparison of Nascent Entrepreneurs and Typical Adults 115
Dimension,characteristics, factor
Nascententre’s
Compgroup
Statsignif Alpha Table
Hand’kchap
Variablelabels
General managementclasses, average taken 1.76 1.44 0.0617 0.64 4.4 7 QF1A1,QF1B1,QF1H1,QF1I1
Human, financialmanagement classes,average taken
0.82 0.73 0.5312 0.61 4.4 7 QF1D1,QF1F1
Operationsmanagement classes,average taken
0.75 0.35 0.0013 0.27 4.4 7 QF1C1,QF1E1,QF1G1
General managementwork experiences,average years
4.25 3.22 0.0351 0.84 4.4 7 QF1A2,QF1B2,QF1D2,QF1F2,QF1H2,QF1I2
Operationsmanagement workexperiences, averageyears
3.25 2.22 0.0104 0.65 4.4 7 QF1C2,QF1E2,QF1G2
Total activity count:
over 12 prior years
18.50 20.14 0.0205 N/A 4.4 10 QO1A87-
QO1D91No yrs in which
full-time employment7.39 7.80 0.3169 N/A 4.4 10 QO1A87-
QO1D91No yrs in which
part-timeemployment
2.08 1.69 0.1443 N/A 4.4 10 QO1A87-QO1D91
No yrs in whichfull-timeself-employment
1.58 0.65 0.0004 N/A 4.4 10 QO1A87-QO1D91
No yrs in which
part-timeself-employment
1.57 1.21 0.1777 N/A 4.4 10 QO1A87-
QO1D91
No yrs in whichfull-time student
1.51 1.62 0.7121 N/A 4.4 10 QO1A87-QO1D91
No yrs in whichpart-time student
0.85 1.02 0.3189 N/A 4.4 10 QO1A87-QO1D91
No yrs in whichunemployed seekingwork
0.25 0.26 0.9047 N/A 4.4 10 QO1A87-QO1D91
No yrs in whichunemployed not
seeking work
0.22 0.55 0.0125 N/A 4.4 10 QO1A87-QO1D91
No yrs in which doingunpaid volunteerwork
0.90 1.86 0.0008 N/A 4.4 10 QO1A87-QO1D91
No yrs in which ahomemaker
1.60 2.58 0.0118 N/A 4.4 10 QO1A87-QO1D91

7/18/2019 New Firm Creation in the United
http://slidepdf.com/reader/full/new-firm-creation-in-the-united 129/168
116 Methodlogical Appendices
Dimension,characteristics, factor
Nascententre’s
Compgroup
Statsignif Alpha Table
Hand’kchap
Variablelabels
No yrs in which disableand unable to work 0.30 0.22 0.5497 N/A 4.4 10 QO1A87-QO1D91No yrs in which retired 0.25 0.69 0.0133 N/A 4.4 10 QO1A87-
QO1D91
Cognitive style:different
30.7% 16.2% N/A 4.5 15 Q327
Cognitive style: better 69.3% 83.8% 0.0026
Entrepreneurialintensity
3.34 2.73 0.0000 0.72 4.5 17 QL1D,QL1E,QL1F,
QL1GEntrepreneurial
expectations4.22 3.57 0.0000 0.83 4.5 13 QK1A,
QK1B,QK1C,QK1D,QK1E,QK1F
Self realization 3.94 3.95 0.9166 0.78 4.5 12 QG1R,QG1O,QG1P,
QG1HFinancial security 3.61 3.50 0.2189 0.78 4.5 12 QG1K,
QG1G,QG1J,QG1N
Recognition 2.58 3.29 0.0000 0.76 4.5 12 QG1L,QG1E,QG1A
Role expectations 1.83 2.69 0.0000 0.60 4.5 12 QG1D,QG1L
Innovation 2.65 2.83 0.0842 0.71 4.5 12 QG1C,QG1M,QG1Q
Independence 4.13 4.12 0.8942 0.66 4.5 12 QG1B,QG1F
Confidence in socialsettings (three items)
3.87 3.74 0.0303 0.48 4.5 21 QL1T,QL1X,QL1Y
Emotional control (twoitems)
3.01 2.93 0.3188 0.57 4.5 21 QL1S,QL1V
Shyness (two items) 2.85 2.87 0.8110 0.04 4.5 21 QL1U,
QL1W

7/18/2019 New Firm Creation in the United
http://slidepdf.com/reader/full/new-firm-creation-in-the-united 130/168
Appendix.4Ax.2. Comparison of Nascent Entrepreneurs and Typical Adults 117
Dimension,characteristics, factor
Nascententre’s
Compgroup
Statsignif Alpha Table
Hand’kchap
Variablelabels
Emphasis on highpayoff/high risk
2.51 2.53 0.6484 0.52 4.5 None QH1,QH2
Emphasis on highpersonal impact
1.72 1.70 0.5902 0.44 4.5 None QH5,QH6
Preferscollective/groupefforts
1.42 1.56 0.0003 0.19 4.5 None QH4,QH8
Prefers challenge/taskfocus
1.48 1.41 0.0017 0.17 4.5 None QH3,QH7,QH9
Financial issues in firm
choice
2.35 2.45 0.0679 0.60 4.5 None QH10B,
QH10COperational issues in
firm choice2.44 2.56 0.0005 0.58 4.5 None QH10A,
QH10D,QH10E,QH10F,QH10G
Locus of control 4.00 4.01 0.8925 0.47 4.5 19 QL1H,QL1I,QL1J
Ignore sunk costs in
decision making
3.07 2.98 0.3771 N/A 4.5 20 QL1K
Focus on current valuewhen selling asset,not cost
3.48 3.43 0.6344 N/A 4.5 20 QL1L
Frequency of new,unpredictablesituations at work
2.31 2.44 0.1647 N/A 4.5 18 QJ2A
Feel overloaded,pushed to limits atwork
3.10 2.96 0.1452 N/A 4.5 18 QJ2B
Delay decisions ondifficult problems togather moreinformation
3.62 3.68 0.4019 N/A 4.5 18 QL1R
Problem complexity:identifying problemsfor priority
37.9% 33.1% N/A 4.5 18 QI9
Problem complexity:developing solutions
62.1% 66.9% 0.4640
Business problem
solving: calculatingand analytical
21.3% 19.3% N/A 4.5 18 QJ1
Business problemsolving: intuitive
16.7% 13.9%
Business problemsolving: varies bysituation
61.9% 66.8% 0.5375
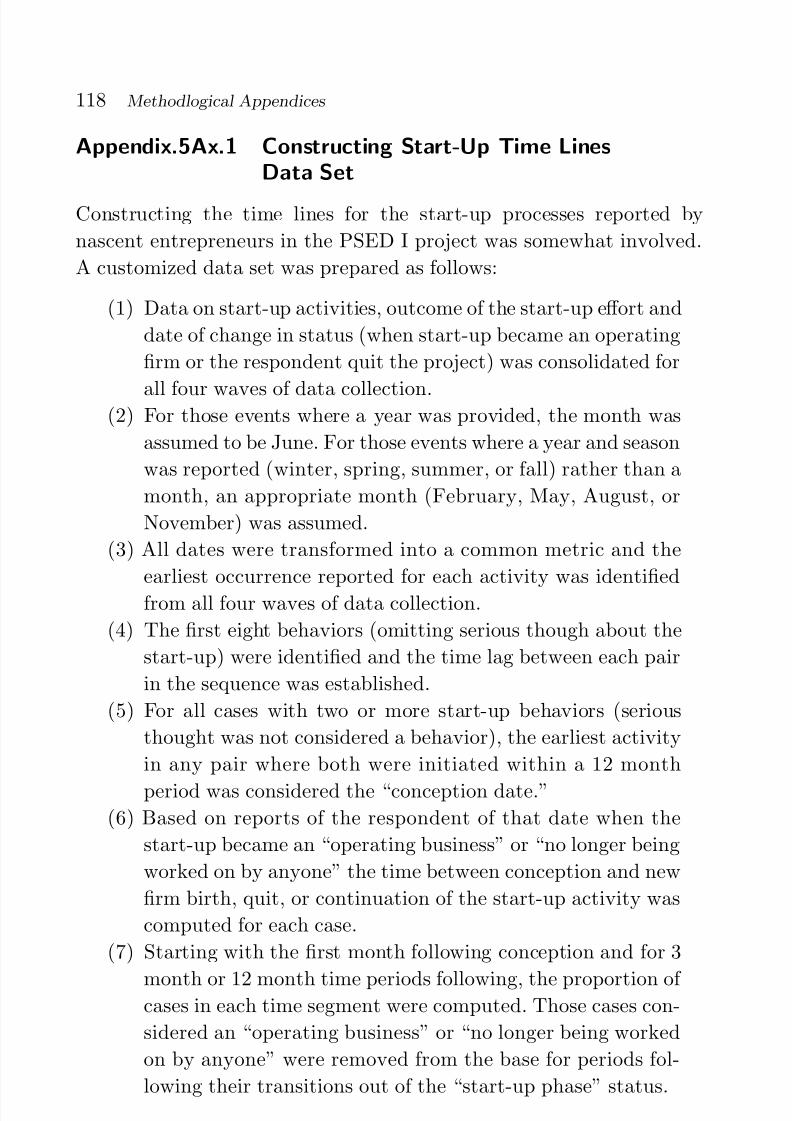
7/18/2019 New Firm Creation in the United
http://slidepdf.com/reader/full/new-firm-creation-in-the-united 131/168
118 Methodlogical Appendices
Appendix.5Ax.1 Constructing Start-Up Time LinesData Set
Constructing the time lines for the start-up processes reported by
nascent entrepreneurs in the PSED I project was somewhat involved.
A customized data set was prepared as follows:
(1) Data on start-up activities, outcome of the start-up effort and
date of change in status (when start-up became an operating
firm or the respondent quit the project) was consolidated for
all four waves of data collection.(2) For those events where a year was provided, the month was
assumed to be June. For those events where a year and season
was reported (winter, spring, summer, or fall) rather than a
month, an appropriate month (February, May, August, or
November) was assumed.
(3) All dates were transformed into a common metric and the
earliest occurrence reported for each activity was identified
from all four waves of data collection.
(4) The first eight behaviors (omitting serious though about the
start-up) were identified and the time lag between each pair
in the sequence was established.
(5) For all cases with two or more start-up behaviors (serious
thought was not considered a behavior), the earliest activity
in any pair where both were initiated within a 12 month
period was considered the “conception date.”(6) Based on reports of the respondent of that date when the
start-up became an “operating business” or “no longer being
worked on by anyone” the time between conception and new
firm birth, quit, or continuation of the start-up activity was
computed for each case.
(7) Starting with the first month following conception and for 3
month or 12 month time periods following, the proportion of cases in each time segment were computed. Those cases con-
sidered an “operating business” or “no longer being worked
on by anyone” were removed from the base for periods fol-
lowing their transitions out of the “start-up phase” status.

7/18/2019 New Firm Creation in the United
http://slidepdf.com/reader/full/new-firm-creation-in-the-united 132/168
Appendix.5Ax.1. Constructing Start-Up Time Lines Data Set 119
Table 5Ax.1.1 PSED I sample attrition
Criteria for inclusion Cases
All cases in original data file 830Retain cases that did not report going business prior to initial interview [See
Table C.3, page 499, in Reynolds and Curtin, Appendix C, Gartner et al., 2004].824
Retain cases with at least one follow-up interview 690Retain cases with three or more start-up acts 682Retain cases with two start-up acts within a 12 month period 669Retain cases that do not report positive monthly cash flow two years prior to any
other start-up event668
Retain cases where initial act was reported less than ten years before the initialinterview
648
To confine the assessment to only those cases that met the initial
criteria, the sample was systematically reduced, the case reduction cri-
teria is presented in the following Table 5Ax.1.1.
The distribution of selected variables before and after the attrition
criteria developed above is presented in the following Table 5Ax.1.2.
The distributions for most variables are quite similar and none of
the differences are statistically significant. The biggest differences are
with ethnic status, with a lower proportion of minorities in the consoli-
dated sample; this probably reflects the additional difficulty of locating
minorities for follow-up interviews. Based on this assessment, it would
appear that this customized data set was representative of the initial
sample that met the criteria for nascent entrepreneurs in the initial
interview. For analysis the wave one weights were utilized, adjusted so
the average weight equaled one.Most of the “conception dates” occurred prior to the initial detailed
interview. Even though those that appeared to begin the process more
than 10 years (120 months) prior to the first interview were deleted,
there was still a considerable variation in the “conception to first inter-
view” gap. The mean of this time lag was 26 months, the median
20 months, and the range from minus 45 months (occurring four years
after the first interview) to 120 months. For seven it was actually nega-tive, as their conception date occurred after the first detailed interview.
This operational feature of the procedure may affect two aspects of
the analysis: (1) the likelihood that a start-up would be reported as
an operating new firm and (2) the relationship between the various
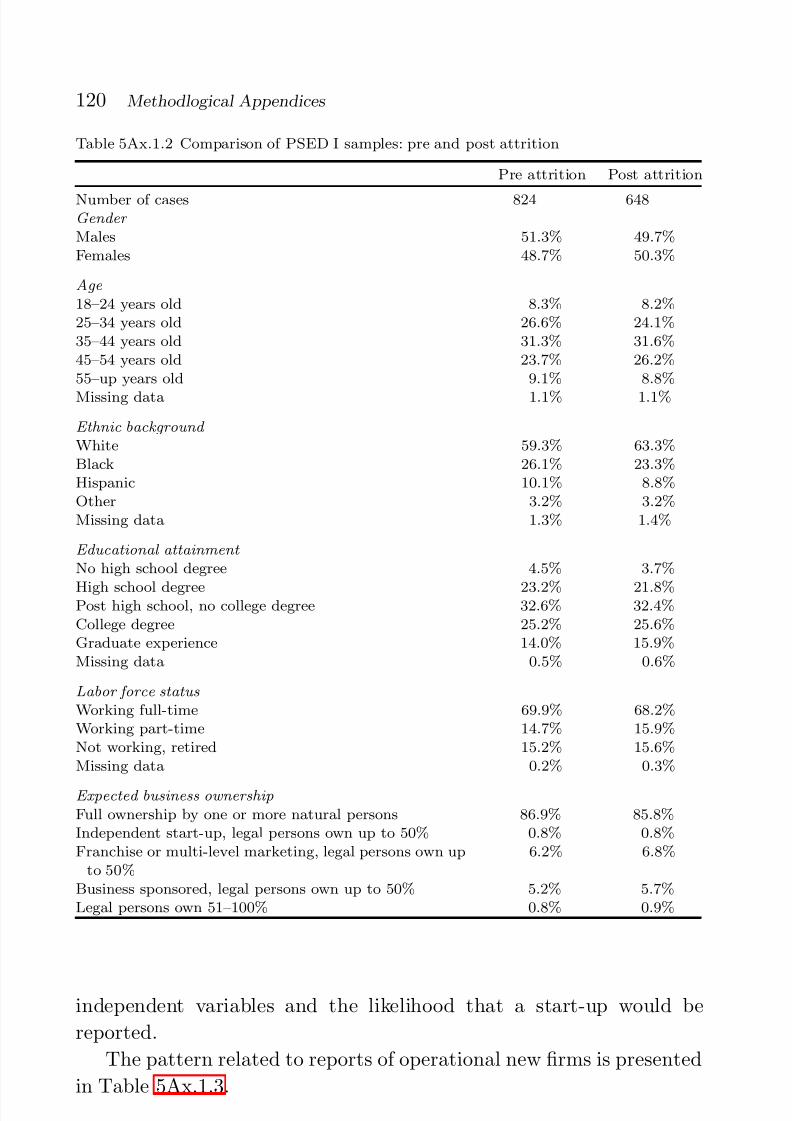
7/18/2019 New Firm Creation in the United
http://slidepdf.com/reader/full/new-firm-creation-in-the-united 133/168
120 Methodlogical Appendices
Table 5Ax.1.2 Comparison of PSED I samples: pre and post attrition
Pre attrition Post attrition
Number of cases 824 648Gender
Males 51.3% 49.7%Females 48.7% 50.3%
Age
18–24 years old 8.3% 8.2%25–34 years old 26.6% 24.1%35–44 years old 31.3% 31.6%45–54 years old 23.7% 26.2%55–up years old 9.1% 8.8%
Missing data 1.1% 1.1%
Ethnic background
White 59.3% 63.3%Black 26.1% 23.3%Hispanic 10.1% 8.8%Other 3.2% 3.2%Missing data 1.3% 1.4%
Educational attainment
No high school degree 4.5% 3.7%
High school degree 23.2% 21.8%Post high school, no college degree 32.6% 32.4%College degree 25.2% 25.6%Graduate experience 14.0% 15.9%Missing data 0.5% 0.6%
Labor force status
Working full-time 69.9% 68.2%Working part-time 14.7% 15.9%Not working, retired 15.2% 15.6%Missing data 0.2% 0.3%
Expected business ownership
Full ownership by one or more natural persons 86.9% 85.8%Independent start-up, legal persons own up to 50% 0.8% 0.8%Franchise or multi-level marketing, legal persons own up
to 50%6.2% 6.8%
Business sponsored, legal persons own up to 50% 5.2% 5.7%Legal persons own 51–100% 0.8% 0.9%
independent variables and the likelihood that a start-up would be
reported.
The pattern related to reports of operational new firms is presented
in Table 5Ax.1.3.

7/18/2019 New Firm Creation in the United
http://slidepdf.com/reader/full/new-firm-creation-in-the-united 134/168
Appendix.5Ax.1. Constructing Start-Up Time Lines Data Set 121
Table 5Ax.1.3 Conception to first interview time lag and start-up outcomes
Conception to first
interview time lag
Percentage of cases
(n = 648) (%)
Average lag
(months)
Percentage reporting a new firm
in a follow-up interview (%)Up to 12 months 30.8 6.8 28.012 to 36 months 47.7 22.2 34.436 to 120 months 21.6 61.1 30.7
This pattern is slightly curvilinear, with more new firms reported by
those initiating conception 12 to 36 months prior to the first interview;the differences in the proportions reporting a new firm, however, are
far from statistically significant.
The second issue was explored by considering the potential impact
of the conception-interview time lag on the relationship between 89
independent variables and the measure of outcome, reports of an oper-
ating new business. It was found that for 60 variables (67%) the lack of
statistical significance was present for the overall relationship as well as
for each of the three conception-interview time lag subgroups. For one
variable (1%) the positive relationship was found for both the overall
sample and for each time lag subgroup. For 19 variables (21%) the over-
all relationship was statistically significant, but it was not significant
for one or two of the time lag groups. This appeared, in most cases, to
reflect differences in sample size. For nine variables (10%) the overall
relationship was not statistically significant but it was significant for
one of the time-lag sub-groups. There was no apparent pattern in thesedifferences, suggesting that no major biases were introduced into the
analysis by the use of all cases where the start-up was initiated up to
120 months prior to the first interview.
This suggests that the strategy adopted in other similar analyses, to
restrict analysis to those cases initiated no more than nine months prior
to the first detailed interview may have lead to an unnecessary reduc-
tion in the sample (Delmar and Shane, 2003). Based on the analysisdeveloped to explore the impact of the conception-interview time lag,
it would seem that incorporating start-ups initiated up to 60 months
(five years) prior to the initial detailed interview should not provide
any serious bias in the subsequent analysis.
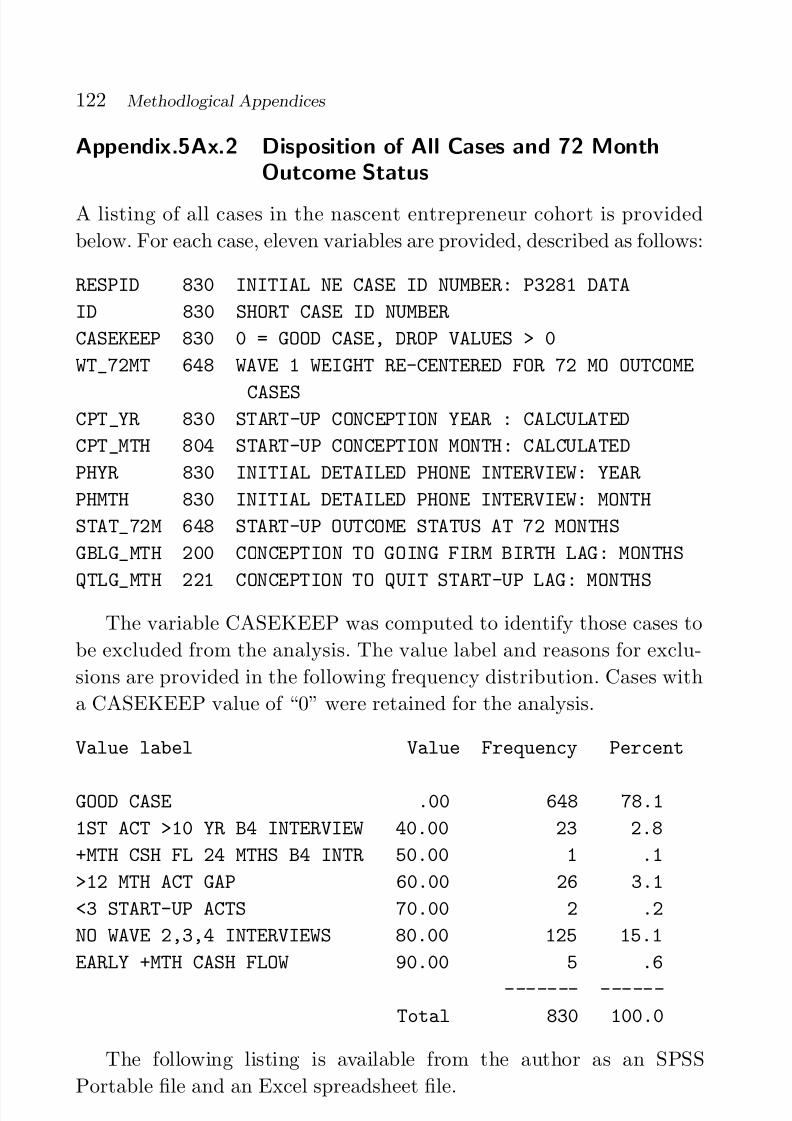
7/18/2019 New Firm Creation in the United
http://slidepdf.com/reader/full/new-firm-creation-in-the-united 135/168
122 Methodlogical Appendices
Appendix.5Ax.2 Disposition of All Cases and 72 MonthOutcome Status
A listing of all cases in the nascent entrepreneur cohort is provided
below. For each case, eleven variables are provided, described as follows:
RESPID 830 INITIAL NE CASE ID NUMBER: P3281 DATA
ID 830 SHORT CASE ID NUMBER
CASEKEEP 830 0 = GOOD CASE, DROP VALUES > 0
WT_72MT 648 WAVE 1 WEIGHT RE-CENTERED FOR 72 MO OUTCOME
CASESCPT_YR 830 START-UP CONCEPTION YEAR : CALCULATED
CPT_MTH 804 START-UP CONCEPTION MONTH: CALCULATED
PHYR 830 INITIAL DETAILED PHONE INTERVIEW: YEAR
PHMTH 830 INITIAL DETAILED PHONE INTERVIEW: MONTH
STAT_72M 648 START-UP OUTCOME STATUS AT 72 MONTHS
GBLG_MTH 200 CONCEPTION TO GOING FIRM BIRTH LAG: MONTHS
QTLG_MTH 221 CONCEPTION TO QUIT START-UP LAG: MONTHS
The variable CASEKEEP was computed to identify those cases to
be excluded from the analysis. The value label and reasons for exclu-
sions are provided in the following frequency distribution. Cases with
a CASEKEEP value of “0” were retained for the analysis.
Value label Value Frequency Percent
GOOD CASE .00 648 78.1
1ST ACT >10 YR B4 INTERVIEW 40.00 23 2.8
+MTH CSH FL 24 MTHS B4 INTR 50.00 1 .1
>12 MTH ACT GAP 60.00 26 3.1
<3 START-UP ACTS 70.00 2 .2
NO WAVE 2,3,4 INTERVIEWS 80.00 125 15.1
EARLY +MTH CASH FLOW 90.00 5 .6
------- ------
Total 830 100.0
The following listing is available from the author as an SPSS
Portable file and an Excel spreadsheet file.
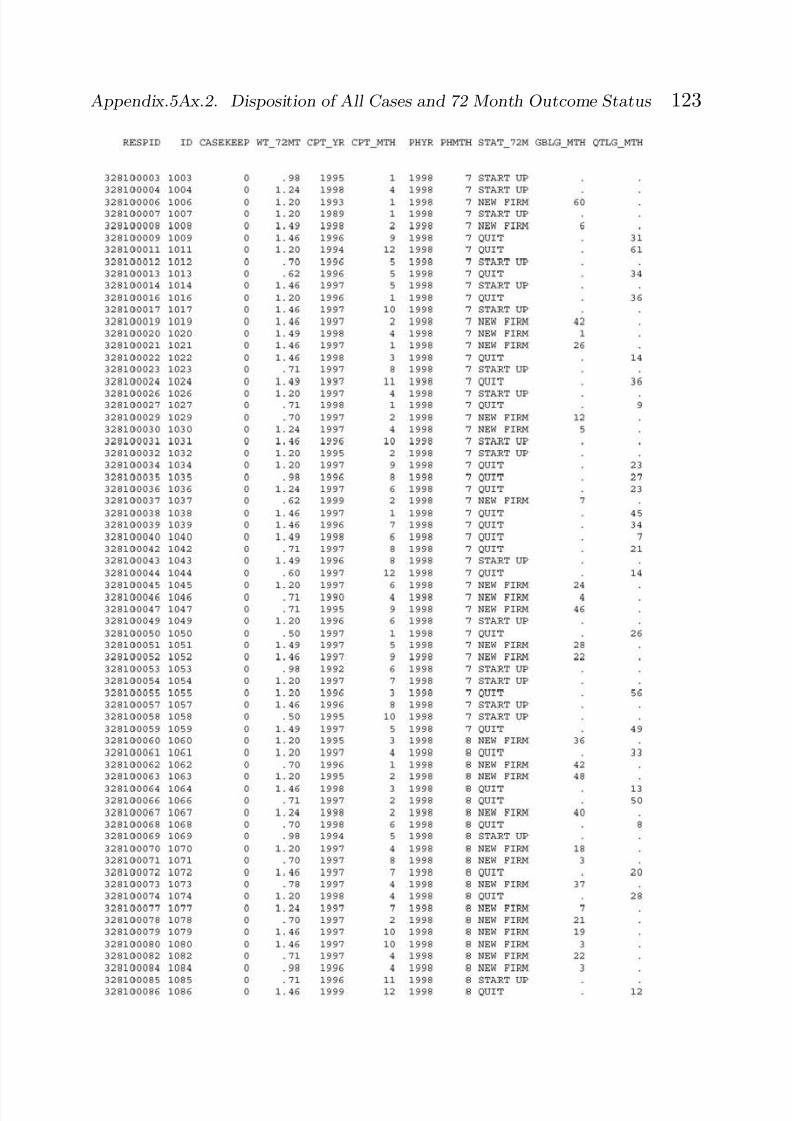
7/18/2019 New Firm Creation in the United
http://slidepdf.com/reader/full/new-firm-creation-in-the-united 136/168
Appendix.5Ax.2. Disposition of All Cases and 72 Month Outcome Status 123
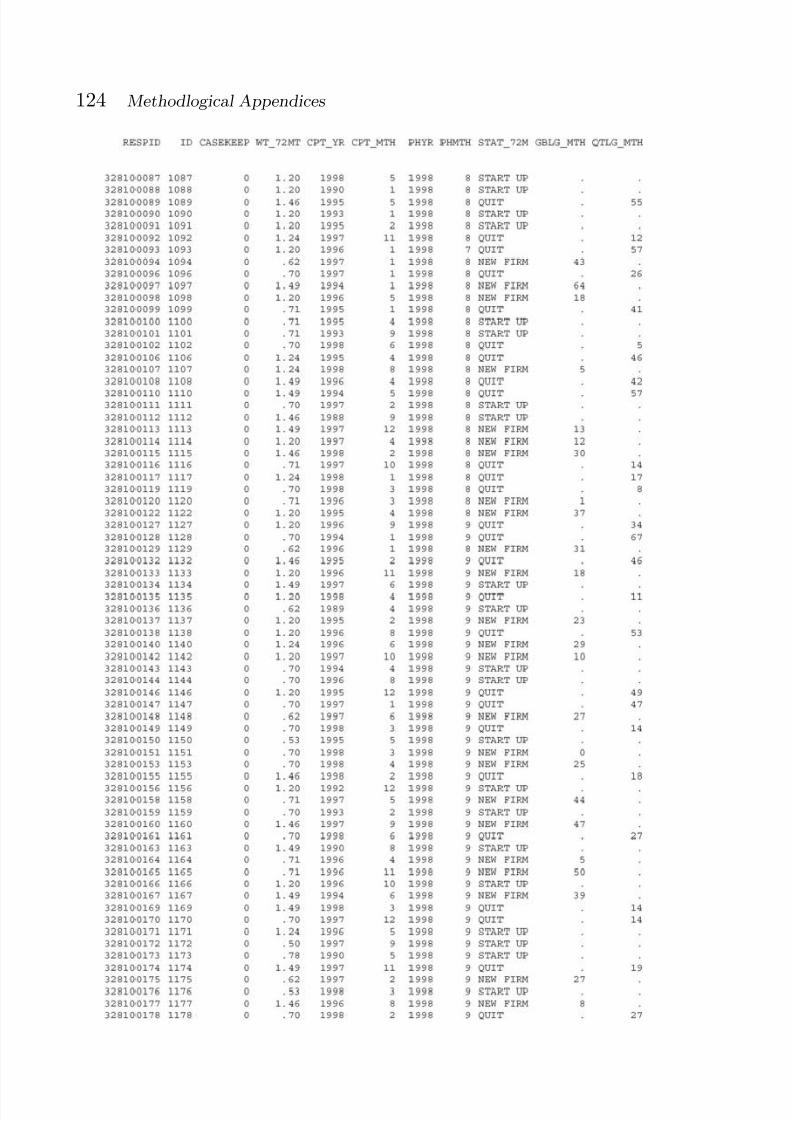
7/18/2019 New Firm Creation in the United
http://slidepdf.com/reader/full/new-firm-creation-in-the-united 137/168
124 Methodlogical Appendices

7/18/2019 New Firm Creation in the United
http://slidepdf.com/reader/full/new-firm-creation-in-the-united 138/168
Appendix.5Ax.2. Disposition of All Cases and 72 Month Outcome Status 125

7/18/2019 New Firm Creation in the United
http://slidepdf.com/reader/full/new-firm-creation-in-the-united 139/168
126 Methodlogical Appendices

7/18/2019 New Firm Creation in the United
http://slidepdf.com/reader/full/new-firm-creation-in-the-united 140/168
Appendix.5Ax.2. Disposition of All Cases and 72 Month Outcome Status 127

7/18/2019 New Firm Creation in the United
http://slidepdf.com/reader/full/new-firm-creation-in-the-united 141/168
128 Methodlogical Appendices

7/18/2019 New Firm Creation in the United
http://slidepdf.com/reader/full/new-firm-creation-in-the-united 142/168
Appendix.5Ax.2. Disposition of All Cases and 72 Month Outcome Status 129

7/18/2019 New Firm Creation in the United
http://slidepdf.com/reader/full/new-firm-creation-in-the-united 143/168
130 Methodlogical Appendices

7/18/2019 New Firm Creation in the United
http://slidepdf.com/reader/full/new-firm-creation-in-the-united 144/168
Appendix.5Ax.2. Disposition of All Cases and 72 Month Outcome Status 131

7/18/2019 New Firm Creation in the United
http://slidepdf.com/reader/full/new-firm-creation-in-the-united 145/168
132 Methodlogical Appendices

7/18/2019 New Firm Creation in the United
http://slidepdf.com/reader/full/new-firm-creation-in-the-united 146/168
Appendix.5Ax.2. Disposition of All Cases and 72 Month Outcome Status 133

7/18/2019 New Firm Creation in the United
http://slidepdf.com/reader/full/new-firm-creation-in-the-united 147/168
134 Methodlogical Appendices
Appendix.5Ax.3 Detailed Comparison of Start-UpsOutcomes: New Firms and Others
All comparisons based only on the 648 nascents identified as qualified,
reviewed in Appendix.5Ax.1, n = 648, as of their personal reports at the
end of six years after entry into the start-up process. Some assessmentsare based on self-administered questionnaire data and the same size
may be reduced by up to 30%. They can be identified by those variable
labels that have a letter following the initial “Q.” Details of creation
of multi-item indices or complex transforms are not provided, but vary

7/18/2019 New Firm Creation in the United
http://slidepdf.com/reader/full/new-firm-creation-in-the-united 148/168
Appendix.5Ax.3. Detailed Comparison of Start-Ups Outcomes: New Firms and Others 135
depending on the nature of the feature being described. The column
headings can be described as follows:
Dimension, characteristics, factor: summary of dependent variable.
New firm: Those nascents reporting a new firm at any time before the
end of six years.
Active SU, quit: those nascents reporting they have disengaged from
the effort at any time the end of six years or, by default, are considered
to be still active in the start-up effort.
Stat signif: Statistical significance is provided from a Chi-Square testfor cross tabulations and the F-test for the means comparisons.
Alpha: Reliability, where appropriate, computed as Chronbach’s Alpha.
Table: The table in this chapter in which the results are summarized.
Hand’k chapter: The chapter in the Gartner et al. (2004) Handbook
of Entrepreneurial Dynamics in which the background and rationale
for measure(s) is/are discussed. Some features are not covered in this
handbook.
Variable label: The variable labels from the phone interviews and mail
questionnaires or as transformed and provided in the full PSED I data
set; in some cases items used to compute multi-item indices or trans-
forms are listed.
Dimension,
characteristics,factor Newfirm ActiveSU, quit Statsign Alpha Table Hand’kchap Variablelabels
All 31.6% 68.4%
Men 31.4% 68.6% N/A 5.1 2 NCGENDERWomen 32.0% 68.0% 0.8824
18–24 yrs atconception/interview
25.9% 74.1% N/A 5.1 None AGE CPT5
25–34 yrs atconception/
interview
29.7% 70.3%
35–44 yrs atconception/interview
34.2% 65.8%
45–54 yrs atconception/interview
34.4% 65.6%
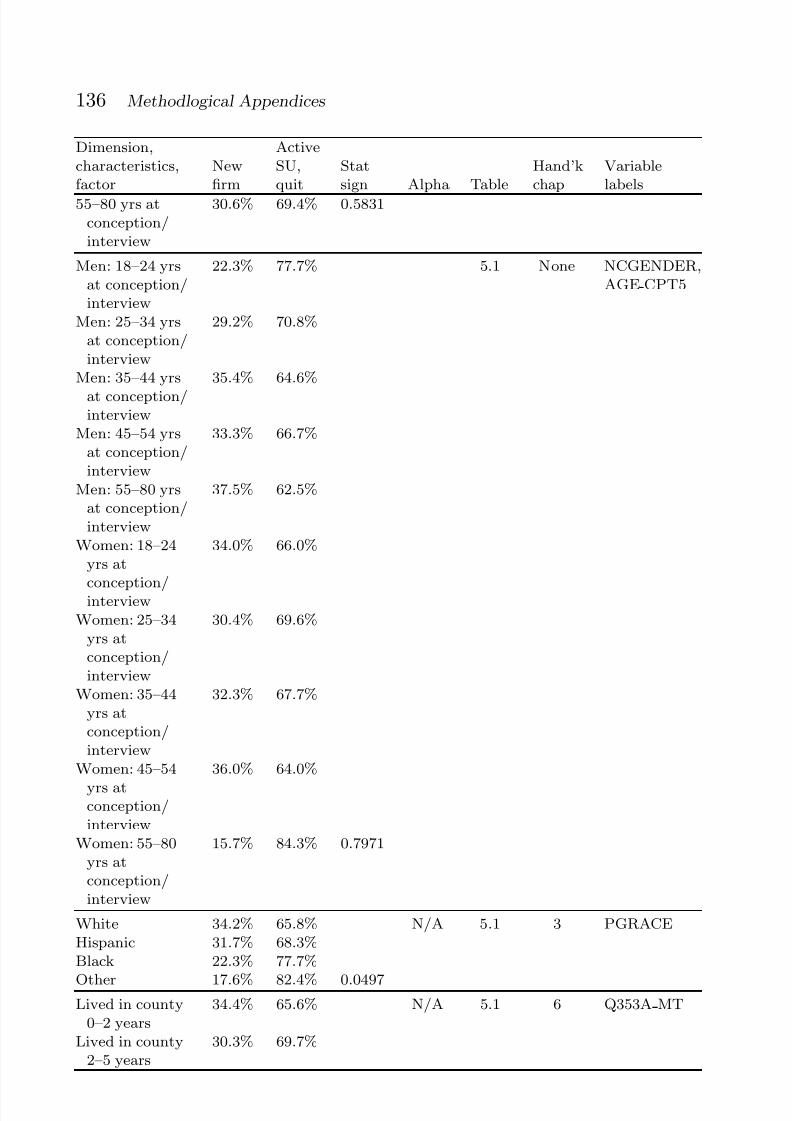
7/18/2019 New Firm Creation in the United
http://slidepdf.com/reader/full/new-firm-creation-in-the-united 149/168
136 Methodlogical Appendices
Dimension,characteristics,factor
Newfirm
ActiveSU,quit
Statsign Alpha Table
Hand’kchap
Variablelabels
55–80 yrs atconception/interview
30.6% 69.4% 0.5831
Men: 18–24 yrsat conception/interview
22.3% 77.7% 5.1 None NCGENDER,AGE CPT5
Men: 25–34 yrsat conception/interview
29.2% 70.8%
Men: 35–44 yrs
at conception/interview
35.4% 64.6%
Men: 45–54 yrsat conception/interview
33.3% 66.7%
Men: 55–80 yrsat conception/interview
37.5% 62.5%
Women: 18–24yrs at
conception/interview
34.0% 66.0%
Women: 25–34yrs atconception/interview
30.4% 69.6%
Women: 35–44yrs atconception/interview
32.3% 67.7%
Women: 45–54
yrs atconception/interview
36.0% 64.0%
Women: 55–80yrs atconception/interview
15.7% 84.3% 0.7971
White 34.2% 65.8% N/A 5.1 3 PGRACEHispanic 31.7% 68.3%Black 22.3% 77.7%
Other 17.6% 82.4% 0.0497Lived in county
0–2 years34.4% 65.6% N/A 5.1 6 Q353A MT
Lived in county2–5 years
30.3% 69.7%
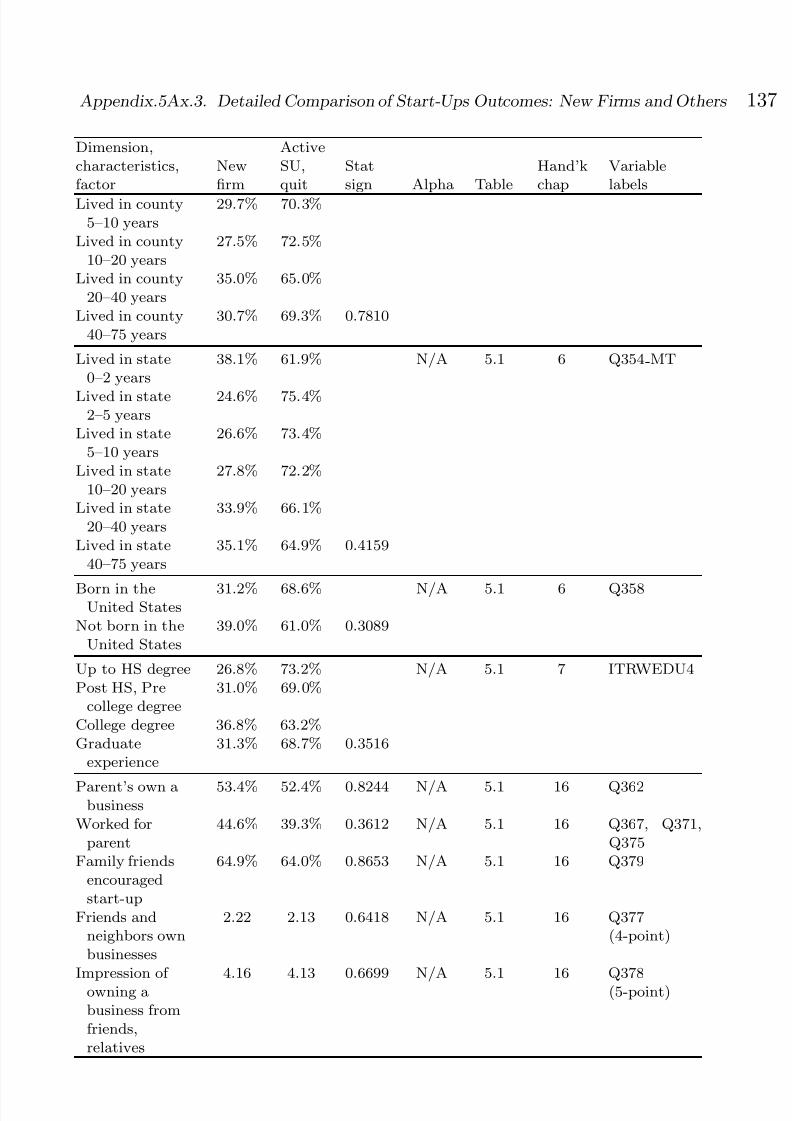
7/18/2019 New Firm Creation in the United
http://slidepdf.com/reader/full/new-firm-creation-in-the-united 150/168
Appendix.5Ax.3. Detailed Comparison of Start-Ups Outcomes: New Firms and Others 137
Dimension,characteristics,factor
Newfirm
ActiveSU,quit
Statsign Alpha Table
Hand’kchap
Variablelabels
Lived in county5–10 years
29.7% 70.3%
Lived in county10–20 years
27.5% 72.5%
Lived in county20–40 years
35.0% 65.0%
Lived in county40–75 years
30.7% 69.3% 0.7810
Lived in state0–2 years
38.1% 61.9% N/A 5.1 6 Q354 MT
Lived in state2–5 years
24.6% 75.4%
Lived in state5–10 years
26.6% 73.4%
Lived in state10–20 years
27.8% 72.2%
Lived in state20–40 years
33.9% 66.1%
Lived in state40–75 years
35.1% 64.9% 0.4159
Born in theUnited States
31.2% 68.6% N/A 5.1 6 Q358
Not born in theUnited States
39.0% 61.0% 0.3089
Up to HS degree 26.8% 73.2% N/A 5.1 7 ITRWEDU4Post HS, Pre
college degree31.0% 69.0%
College degree 36.8% 63.2%Graduate
experience31.3% 68.7% 0.3516
Parent’s own abusiness
53.4% 52.4% 0.8244 N/A 5.1 16 Q362
Worked forparent
44.6% 39.3% 0.3612 N/A 5.1 16 Q367, Q371,Q375
Family friendsencouragedstart-up
64.9% 64.0% 0.8653 N/A 5.1 16 Q379
Friends andneighbors ownbusinesses
2.22 2.13 0.6418 N/A 5.1 16 Q377(4-point)
Impression of owning abusiness fromfriends,relatives
4.16 4.13 0.6699 N/A 5.1 16 Q378(5-point)
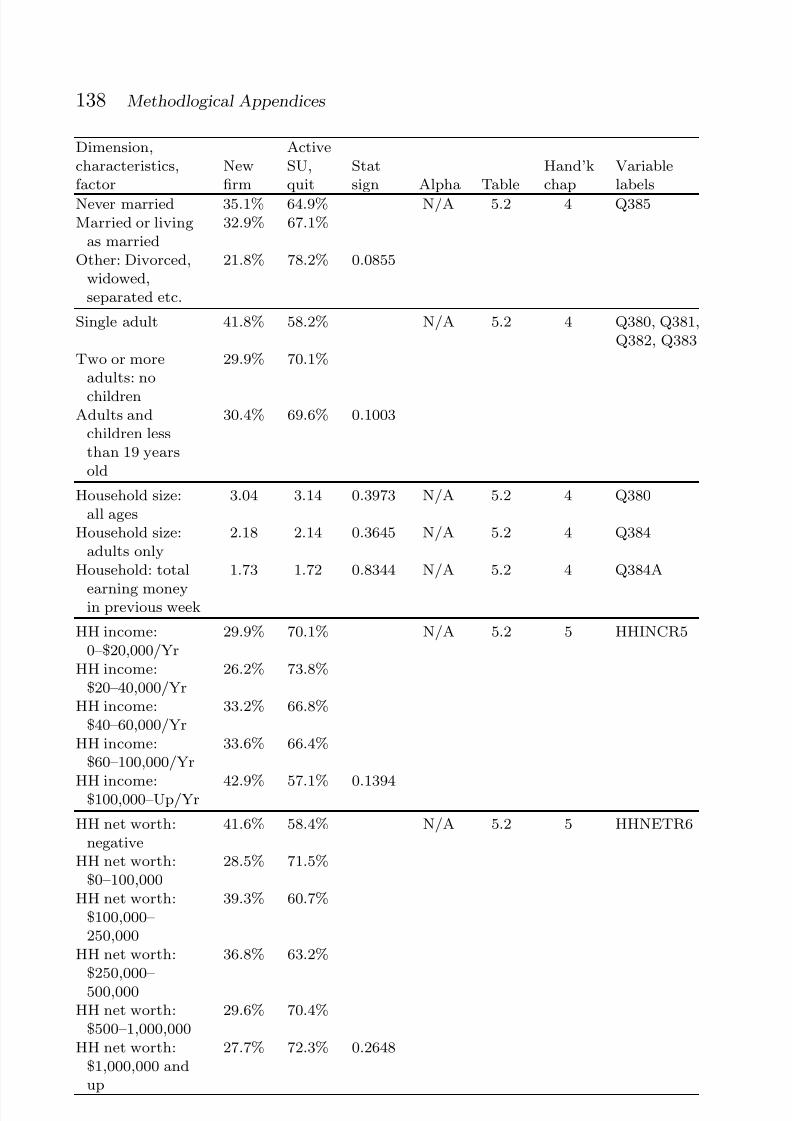
7/18/2019 New Firm Creation in the United
http://slidepdf.com/reader/full/new-firm-creation-in-the-united 151/168
138 Methodlogical Appendices
Dimension,characteristics,factor
Newfirm
ActiveSU,quit
Statsign Alpha Table
Hand’kchap
Variablelabels
Never married 35.1% 64.9% N/A 5.2 4 Q385Married or living
as married32.9% 67.1%
Other: Divorced,widowed,separated etc.
21.8% 78.2% 0.0855
Single adult 41.8% 58.2% N/A 5.2 4 Q380, Q381,Q382, Q383
Two or moreadults: no
children
29.9% 70.1%
Adults andchildren lessthan 19 yearsold
30.4% 69.6% 0.1003
Household size:all ages
3.04 3.14 0.3973 N/A 5.2 4 Q380
Household size:adults only
2.18 2.14 0.3645 N/A 5.2 4 Q384
Household: total
earning moneyin previous week
1.73 1.72 0.8344 N/A 5.2 4 Q384A
HH income:0–$20,000/Yr
29.9% 70.1% N/A 5.2 5 HHINCR5
HH income:$20–40,000/Yr
26.2% 73.8%
HH income:$40–60,000/Yr
33.2% 66.8%
HH income:$60–100,000/Yr
33.6% 66.4%
HH income:$100,000–Up/Yr 42.9% 57.1% 0.1394
HH net worth:negative
41.6% 58.4% N/A 5.2 5 HHNETR6
HH net worth:$0–100,000
28.5% 71.5%
HH net worth:$100,000–250,000
39.3% 60.7%
HH net worth:$250,000–500,000
36.8% 63.2%
HH net worth:$500–1,000,000
29.6% 70.4%
HH net worth:$1,000,000 andup
27.7% 72.3% 0.2648

7/18/2019 New Firm Creation in the United
http://slidepdf.com/reader/full/new-firm-creation-in-the-united 152/168
Appendix.5Ax.3. Detailed Comparison of Start-Ups Outcomes: New Firms and Others 139
Dimension,characteristics,factor
Newfirm
ActiveSU,quit
Statsign Alpha Table
Hand’kchap
Variablelabels
Last work day:ave hours onwork plus travel
6.58 7.07 0.2205 N/A 5.2 9 QM5D1
Last work day:ave hours onstart-up firm
2.15 2.12 0.9103 N/A 5.2 9 QM5E1
Last day off: avehours on workplus travel
0.62 0.64 0.9287 N/A 5.2 9 QM5D2
Last day off: ave
hours onstart-up firm
1.53 2.25 0.0061 N/A 5.2 9 QM5E2
Satisfaction withmost recent job[Z-score]
0.34 0.37 0.7983 N/A 5.2 14 QI8
Satisfied with lifeoverall [Z-score]
0.18 −0.09 0.0061 N/A 5.2 14 QL1M
Self realization 3.86 3.95 0.2884 0.78 5.3 12 QG1R,QG10,QG1P,
QG1HFinancial security 3.54 3.59 0.6225 0.78 5.3 12 QG1K,
QG1G,QG1J,QG1N
Recognition 2.57 2.53 0.7497 0.76 5.3 12 QG1L,QG1E,QG1A
Role expectations 1.92 1.85 0.4791 0.60 5.3 12 QG1D,QG1L
Innovation 2.61 2.63 0.8583 0.71 5.3 12 QG1C,QG1M,QG1Q
Independence 4.14 4.14 0.9449 0.66 5.3 12 QG1B,AG1F
Entrepreneurialexpectations
4.32 4.18 0.0112 0.83 5.3 13 QK1A,QK1B,QK1C,QK1D,QK1E,QK1F
Problemcomplexity:identifyingproblems forpriority
34.5% 65.5% N/A 5.3 18 QI9

7/18/2019 New Firm Creation in the United
http://slidepdf.com/reader/full/new-firm-creation-in-the-united 153/168
140 Methodlogical Appendices
Dimension,characteristics,factor
Newfirm
ActiveSU,quit
Statsign Alpha Table
Hand’kchap
Variablelabels
Problemcomplexity:developingsolutions
32.9% 67.1% 0.7247
Business problemsolving:calculating andanalytical
33.2% 66.8% N/A 5.3 18 QJ1
Business problemsolving:
intuitive
36.0% 64.0%
Business problemsolving: variesby situation
32.5% 67.5% 0.8400
Cognitive style:different ormixed
25.6% 74.4% N/A 5.3 15 Q327
Cognitive style:better
35.1% 64.9% 0.0471
Entrepreneurial
intensity
3.41 3.28 0.0403 0.72 5.3 17 QL1D,
QL1E,QL1F,QL1G
Prefer to grow aslarge as possible
18.3% 22.4% N/A 5.3 33 Q322
Prefer to stay amanageable size
81.7% 77.6% 0.2349
Projected Jobs infirst full year of operation
4.5 27.6 0.4126 N/A 5.3 33 Q318, Q319
Projected Jobs infifth full year of operation
29.1 30.6 0.9394 N/A 5.3 33 Q320, Q321
Projected Sales infirst full year of operation($1,000)
194.2 692.8 0.0975 N/A 5.3 33 Q317
Projected Sales infifth full year of operation
($1,000)
1,542.7 2,386.1 0.3077 N/A 5.3 33 Q317A
Percent equityownership infive years
68.3% 67.6% 0.7912 N/A 5.3 33 Q323
Proportion expectfirm to primaryHH income
66.7% 64.4% 0.4036 N/A 5.3 33 Q324
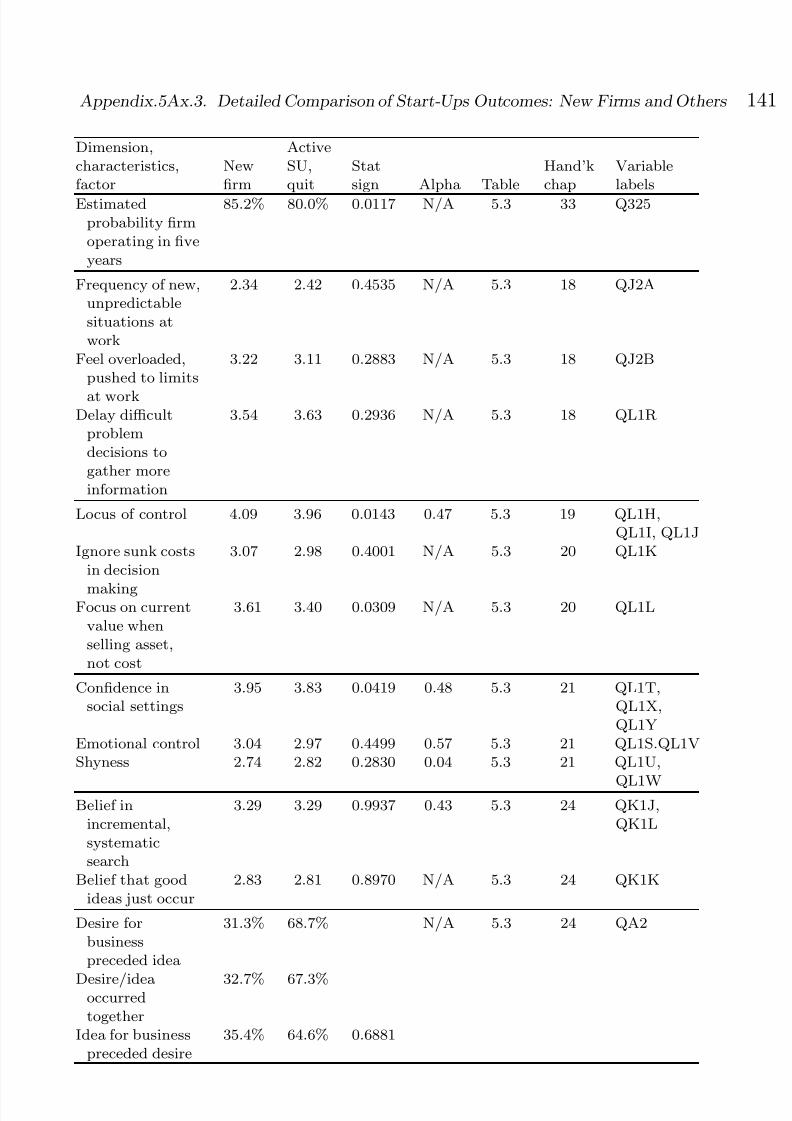
7/18/2019 New Firm Creation in the United
http://slidepdf.com/reader/full/new-firm-creation-in-the-united 154/168
Appendix.5Ax.3. Detailed Comparison of Start-Ups Outcomes: New Firms and Others 141
Dimension,characteristics,factor
Newfirm
ActiveSU,quit
Statsign Alpha Table
Hand’kchap
Variablelabels
Estimatedprobability firmoperating in fiveyears
85.2% 80.0% 0.0117 N/A 5.3 33 Q325
Frequency of new,unpredictablesituations atwork
2.34 2.42 0.4535 N/A 5.3 18 QJ2A
Feel overloaded,pushed to limits
at work
3.22 3.11 0.2883 N/A 5.3 18 QJ2B
Delay difficultproblemdecisions togather moreinformation
3.54 3.63 0.2936 N/A 5.3 18 QL1R
Locus of control 4.09 3.96 0.0143 0.47 5.3 19 QL1H,QL1I, QL1J
Ignore sunk costsin decision
making
3.07 2.98 0.4001 N/A 5.3 20 QL1K
Focus on currentvalue whenselling asset,not cost
3.61 3.40 0.0309 N/A 5.3 20 QL1L
Confidence insocial settings
3.95 3.83 0.0419 0.48 5.3 21 QL1T,QL1X,QL1Y
Emotional control 3.04 2.97 0.4499 0.57 5.3 21 QL1S.QL1VShyness 2.74 2.82 0.2830 0.04 5.3 21 QL1U,
QL1WBelief in
incremental,systematicsearch
3.29 3.29 0.9937 0.43 5.3 24 QK1J,QK1L
Belief that goodideas just occur
2.83 2.81 0.8970 N/A 5.3 24 QK1K
Desire forbusinesspreceded idea
31.3% 68.7% N/A 5.3 24 QA2
Desire/ideaoccurredtogether
32.7% 67.3%
Idea for businesspreceded desire
35.4% 64.6% 0.6881
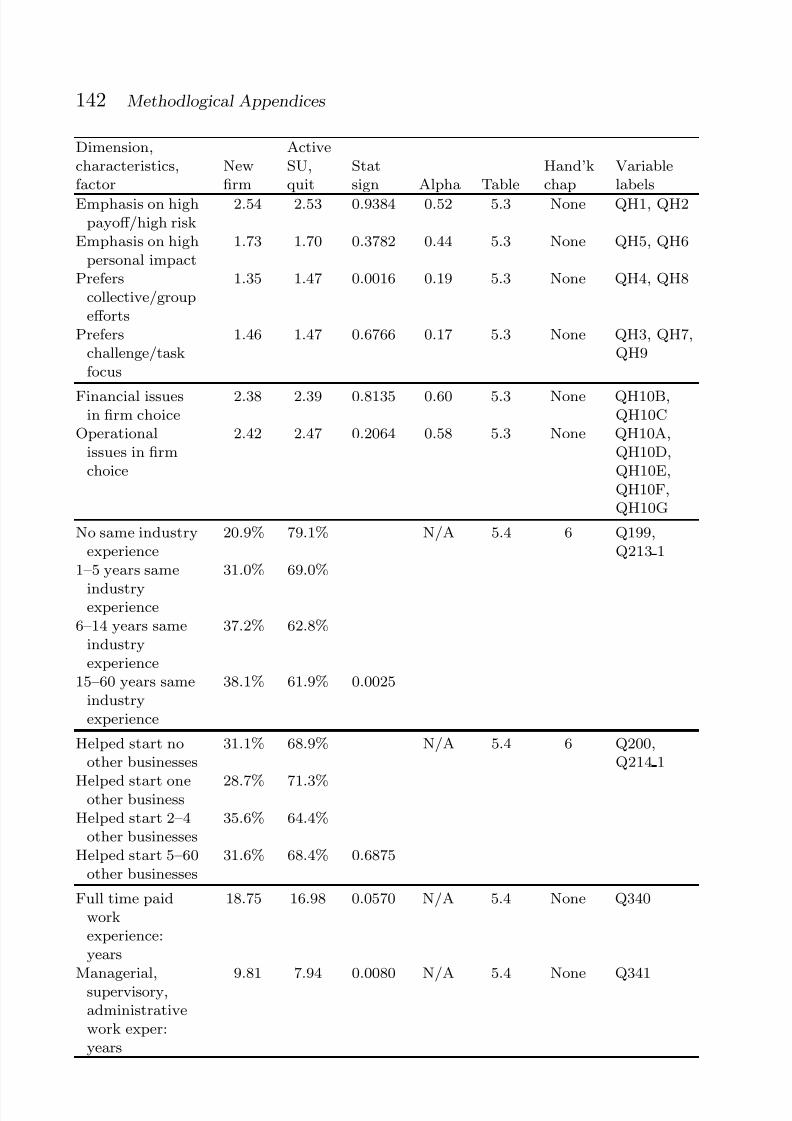
7/18/2019 New Firm Creation in the United
http://slidepdf.com/reader/full/new-firm-creation-in-the-united 155/168
142 Methodlogical Appendices
Dimension,characteristics,factor
Newfirm
ActiveSU,quit
Statsign Alpha Table
Hand’kchap
Variablelabels
Emphasis on highpayoff/high risk
2.54 2.53 0.9384 0.52 5.3 None QH1, QH2
Emphasis on highpersonal impact
1.73 1.70 0.3782 0.44 5.3 None QH5, QH6
Preferscollective/groupefforts
1.35 1.47 0.0016 0.19 5.3 None QH4, QH8
Preferschallenge/taskfocus
1.46 1.47 0.6766 0.17 5.3 None QH3, QH7,QH9
Financial issuesin firm choice
2.38 2.39 0.8135 0.60 5.3 None QH10B,QH10C
Operationalissues in firmchoice
2.42 2.47 0.2064 0.58 5.3 None QH10A,QH10D,QH10E,QH10F,QH10G
No same industryexperience
20.9% 79.1% N/A 5.4 6 Q199,Q213 1
1–5 years same
industryexperience
31.0% 69.0%
6–14 years sameindustryexperience
37.2% 62.8%
15–60 years sameindustryexperience
38.1% 61.9% 0.0025
Helped start noother businesses
31.1% 68.9% N/A 5.4 6 Q200,Q214 1
Helped start oneother business 28.7% 71.3%
Helped start 2–4other businesses
35.6% 64.4%
Helped start 5–60other businesses
31.6% 68.4% 0.6875
Full time paidworkexperience:years
18.75 16.98 0.0570 N/A 5.4 None Q340
Managerial,supervisory,administrativework exper:years
9.81 7.94 0.0080 N/A 5.4 None Q341

7/18/2019 New Firm Creation in the United
http://slidepdf.com/reader/full/new-firm-creation-in-the-united 156/168
Appendix.5Ax.3. Detailed Comparison of Start-Ups Outcomes: New Firms and Others 143
Dimension,characteristics,factor
Newfirm
ActiveSU,quit
Statsign Alpha Table
Hand’kchap
Variablelabels
Generalmanagementclasses, averagetaken
1.90 1.78 0.5148 0.64 5.4 7 QF1A1,QF1B1,QF1H1,QF1I1
Human, financialmanagementclasses, averagetaken
0.99 0.72 0.0704 0.61 5.4 7 QF1D1,QF1F1
Operationsmanagement
classes, averagetaken
0.75 0.60 0.2586 0.27 5.4 7 QF1C1,QF1E1,
AF1G1
Generalmanagementworkexperiences, avgyears
4.54 3.56 0.0328 0.84 5.4 7 QF1A2,QF1B2,QF1D2,QF1F2,QF1H2,QF1I2
Operationsmanagement
workexperiences, avgyears
3.58 2.57 0.0159 0.65 5.4 7 QF1C2,QF1E2,
AF1G2
Total activitycount: over 12prior years
18.34 18.99 0.3847 N/A 5.4 10 QO1A87-QO1D91
Yrs in whichfull-timeemployment
4.21 4.30 0.1750 N/A 5.4 10 QO1A87-QO1D91
Yrs in whichpart-timeemployment
1.98 2.17 0.4961 N/A 5.4 10 QO1A87-QO1D91
Yrs in whichfull-timeself-employment
1.72 1.27 0.1007 N/A 5.4 10 QO1A87-QO1D91
Yrs in whichpart-timeself-employment
1.74 1.62 0.6854 N/A 5.4 10 QO1A87-QO1D91
Yrs in whichfull-timestudent
1.46 1.91 0.1332 N/A 5.4 10 QO1A87-QO1D91
Yrs in whichpart-timestudent
0.83 0.90 0.7162 N/A 5.4 10 QO1A87-QO1D91
Yrs in whichunemployedseeking work
0.16 0.34 0.0524 N/A 5.4 10 QO1A87-QO1D91

7/18/2019 New Firm Creation in the United
http://slidepdf.com/reader/full/new-firm-creation-in-the-united 157/168
144 Methodlogical Appendices
Dimension,characteristics,factor
Newfirm
ActiveSU,quit
Statsign Alpha Table
Hand’kchap
Variablelabels
Yrs in whichunemployed notseeking work
0.15 0.27 0.2165 N/A 5.4 10 QO1A87-QO1D91
Yrs in whichdoing unpaidvolunteer work
0.60 1.15 0.0367 N/A 5.4 10 QO1A87-QO1D91
Yrs in which ahomemaker
1.78 1.91 0.7238 N/A 5.4 10 QO1A87-QO1D91
Yrs in whichdisable and
unable to work
0.13 0.32 0.2924 N/A 5.4 10 QO1A87-QO1D91
Yrs in whichretired
0.22 0.23 0.9844 N/A 5.4 10 QO1A87-QO1D91
Start-up problemindex (fiveitems)
3.17 3.22 0.5316 0.51 5.5 QC1A,QC1B,QC1C,QC1D,QC1E
Start-upproblems: social
challenges
2.87 3.10 0.0342 0.54 5.5 25 QC1A,QC1B
Start-upproblems:personalchallenges
3.36 3.29 0.3848 0.41 5.5 25 QC1C,QC1D,QC1E
Entrepreneurialclimate:communitysupport groups
2.68 2.70 0.7464 0.69 5.5 35 QB1B,QB1C,QB1D,QB1E, QB1I
Entrepreneurial
climate: friendsand familymodels
2.48 2.49 0.9192 0.65 5.5 35 QB1G,
QB1H
Entrepreneurialclimate:communitymodels
3.76 3.77 0.9161 0.38 5.5 35 QB1A,QB1F, QB1J
Econ/Communitycontext,uncertainty:overall
2.92 2.89 0.7582 0.73 5.5 36 QD1A,QD1B,QD1C,QD1D,QD1E,QD1F,QD1G,QD1H,QD1I, QD1J,QD1K
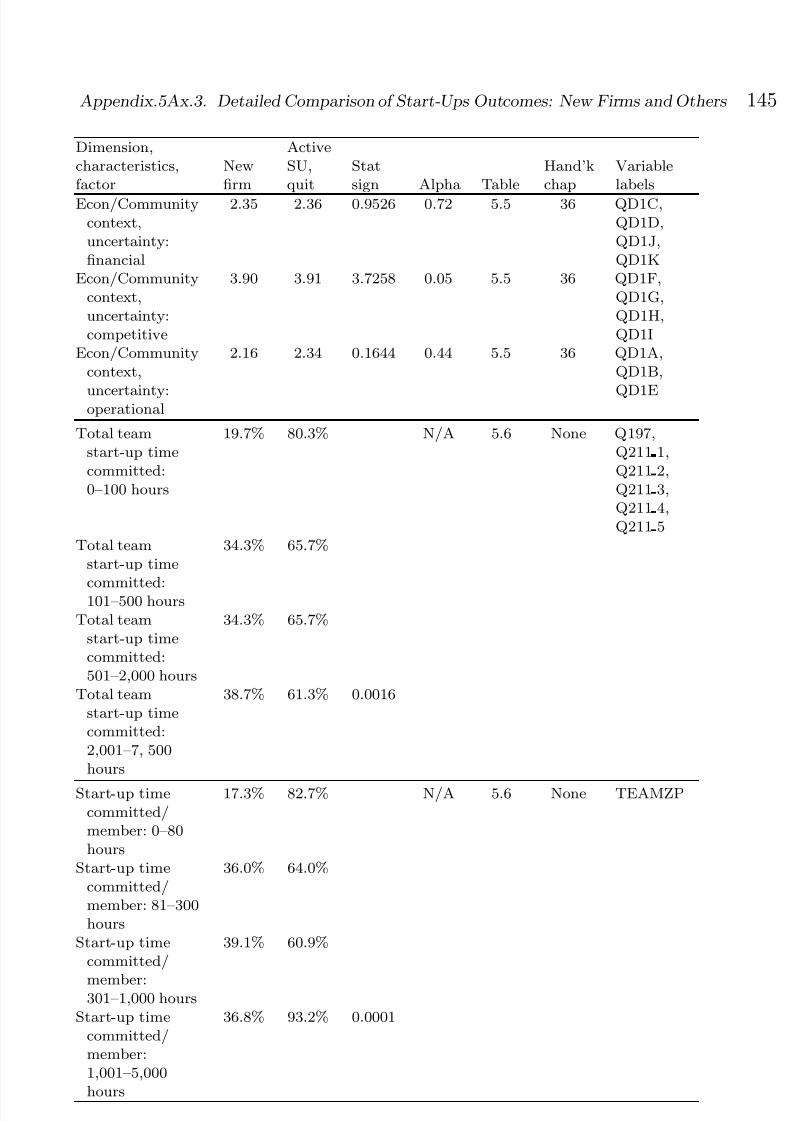
7/18/2019 New Firm Creation in the United
http://slidepdf.com/reader/full/new-firm-creation-in-the-united 158/168
Appendix.5Ax.3. Detailed Comparison of Start-Ups Outcomes: New Firms and Others 145
Dimension,characteristics,factor
Newfirm
ActiveSU,quit
Statsign Alpha Table
Hand’kchap
Variablelabels
Econ/Communitycontext,uncertainty:financial
2.35 2.36 0.9526 0.72 5.5 36 QD1C,QD1D,QD1J,QD1K
Econ/Communitycontext,uncertainty:competitive
3.90 3.91 3.7258 0.05 5.5 36 QD1F,QD1G,QD1H,QD1I
Econ/Communitycontext,
uncertainty:operational
2.16 2.34 0.1644 0.44 5.5 36 QD1A,QD1B,
QD1E
Total teamstart-up timecommitted:0–100 hours
19.7% 80.3% N/A 5.6 None Q197,Q211 1,Q211 2,Q211 3,Q211 4,Q211 5
Total teamstart-up time
committed:101–500 hours
34.3% 65.7%
Total teamstart-up timecommitted:501–2,000 hours
34.3% 65.7%
Total teamstart-up timecommitted:2,001–7, 500hours
38.7% 61.3% 0.0016
Start-up timecommitted/member: 0–80hours
17.3% 82.7% N/A 5.6 None TEAMZP
Start-up timecommitted/member: 81–300hours
36.0% 64.0%
Start-up timecommitted/
member:301–1,000 hours
39.1% 60.9%
Start-up timecommitted/member:1,001–5,000hours
36.8% 93.2% 0.0001

7/18/2019 New Firm Creation in the United
http://slidepdf.com/reader/full/new-firm-creation-in-the-united 159/168
146 Methodlogical Appendices
Dimension,characteristics,factor
Newfirm
ActiveSU,quit
Statsign Alpha Table
Hand’kchap
Variablelabels
Total teamstart-up timecommitted/month: 0–8hours
22.0% 78.0% N/A 5.6 None Conceptionto 1stinterview
Total teamstart-up timecommitted/month: 9–36hours
31.0% 69.0%
Total teamstart-up timecommitted/month: 37–80hours
36.9% 63.1%
Total teamstart-up timecommitted/month: 81–700hours
37.3% 62.7% 0.0084
Start-up timecommitted/member/month:0–6 hours
23.0% 77.0% N/A 5.6 None TEAMSZP;Conceptionto 1stinterview
Start-up timecommitted/member/month:7–20 hours
29.4% 70.6%
Start-up timecommitted/member/month:
21–50 hours
39.7% 60.3%
Start-up timecommitted/member/month:51–426 hours
37.2% 62.8% 0.0044
Extractive sectors 38.4% 61.6% N/A 5.6 23 SUSIC 5Transformative
sectors29.0% 71.0%
Distributivesectors
43.2% 56.8%
Business servicessectors
32.8% 67.2%
Consumerservices sectors
29.2% 70.8% 0.3831

7/18/2019 New Firm Creation in the United
http://slidepdf.com/reader/full/new-firm-creation-in-the-united 160/168
Appendix.5Ax.3. Detailed Comparison of Start-Ups Outcomes: New Firms and Others 147
Dimension,characteristics,factor
Newfirm
ActiveSU,quit
Statsign Alpha Table
Hand’kchap
Variablelabels
Soleproprietorship
34.4% 65.6% N/A 5.6 23 Q189
Partnership 25.1% 74.9%Corp, LLC 38.7% 61.3%Other, not yet 14.7% 85.3% 0.0098
Private home 30.5% 69.5% N/A 5.6 23 Q194Exist business
location38.0% 62.0%
Dedicated newfirm location
39.4% 60.6%
Other/notneeded
23.8% 76.2% 0.1042
Naturalpersons: 100%ownership
31.5% 68.5% N/A 5.6 27 AUTONSU
Naturalpersons:51–99%ownership
28.5% 71.5%
Natural
persons:0–50%ownership
74.1% 25.9% 0.0340
One personstart-up team
28.7% 71.3% N/A 5.6 27 TEAMZP
Two personsstart-up team
37.2% 62.8%
Three personsstart-up team
35.3% 64.7%
Four persons
start-up team
15.9% 84.1%
Five personsstart-up team
34.2% 65.8% 0.0922
Reportingsocial networkpresent(proportion)
66.7% 64.2% 0.5372 N/A 5.6 29 Q241
Number insocial network(average)
3.37 3.24 0.8057 N/A 5.6 29 Q242
Contact helpingprograms:four waves
35.3% 23.3% N/A 5.6 30 Q303,R755,S755, T755
No contact withhelpingprograms:four waves
64.7% 76.7% 0.0017

7/18/2019 New Firm Creation in the United
http://slidepdf.com/reader/full/new-firm-creation-in-the-united 161/168
148 Methodlogical Appendices
Dimension,characteristics,factor
Newfirm
ActiveSU,quit
Statsign Alpha Table
Hand’kchap
Variablelabels
Program sponsor:government
38.8% 61.2% N/A 5.6 30 Q306,R759,S759,T759
Program sponsor:educationalinstitution
43.7% 56.3%
Program sponsor:businessassociation
42.2% 57.8%
Program sponsor:for profitorganization
26.9% 73.1% 0.7073
Number programscontacted: fourwaves
2.21 3.68 0.1370 N/A 5.6 30 Q305,R757,S757,T757
Hours spend mostrecent program:four waves
116.35 89.03 0.7260 N/A 5.6 30 Q309,R762,S762,
T762Estimated valueof help indollars: fourwaves
1991.08 1980.48 0.9839 N/A 5.6 30 Q311,R764,S764,T764
Number of programsknown about:four waves
11.05 13.58 0.6598 N/A 5.6 30 Q316,R769,S769,T769
Total team fundsinvested:$0–$500
21.5% 78.5% N/A 5.6 31 Q198,Q212 1,Q212 2,Q212 3,Q212 4,Q212 5
Total team fundsinvested:$501–$3,000
27.0% 73.0%
Total team fundsinvested:$3,001–$12,000
38.1% 61.9%
Total team fundsinvested:$12,001–$56,000
40.6% 59.4% 0.0003
Funds invested/member:$0–$500
22.0% 78.0% N/A 5.6 31 TEAMSZP

7/18/2019 New Firm Creation in the United
http://slidepdf.com/reader/full/new-firm-creation-in-the-united 162/168
Appendix.5Ax.3. Detailed Comparison of Start-Ups Outcomes: New Firms and Others 149
Dimension,characteristics,factor
Newfirm
ActiveSU,quit
Statsign Alpha Table
Hand’kchap
Variablelabels
Funds invested/member:$501–$2,000
32.7% 67.3%
Funds invested/member:$2,001–$7,500
34.6% 65.4%
Funds invested/member: $7,501–$164,000
41.3% 58.7% 0.0020
Total team funds
invested/month:$0–$30
21.5% 78.5% N/A 5.6 31 Conception
to 1stinterview
Total team fundsinvested/month:$31–$150
26.7% 73.3%
Total team fundsinvested/month:$151–$500
38.2% 61.8%
Total team fundsinvested/month:
$501–$28,000
38.9% 61.1% 0.0008
Funds invested/member/month:$0–$25
24.1% 75.9% N/A 5.6 31 TEAMSZP;Conceptionto 1stinterview
Funds invested/member/month:$26–$100
27.9% 72.1%
Funds invested/member/month:$101–$500
34.0% 66.0%
Funds invested/member/month:$501–$10,000
43.0% 57.0% 0.0046
Accountingsophistication:cash accounting
24.4% 75.6% N/A 5.6 32 QE1A,QE1C,QE1E
Accountingsophistication:
bank account,not accrual
35.6% 64.4%
Accountingsophistication:bank acct,accrual
22.6% 77.4% 0.2504
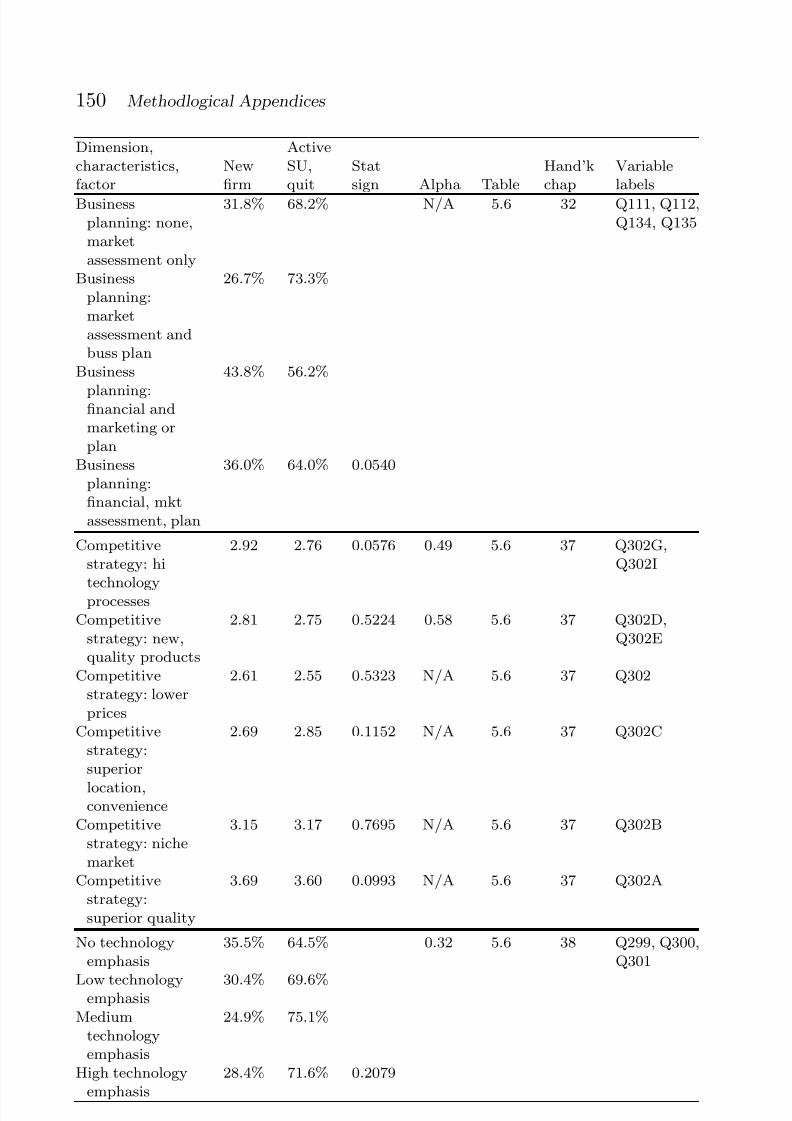
7/18/2019 New Firm Creation in the United
http://slidepdf.com/reader/full/new-firm-creation-in-the-united 163/168
150 Methodlogical Appendices
Dimension,characteristics,factor
Newfirm
ActiveSU,quit
Statsign Alpha Table
Hand’kchap
Variablelabels
Businessplanning: none,marketassessment only
31.8% 68.2% N/A 5.6 32 Q111, Q112,Q134, Q135
Businessplanning:marketassessment andbuss plan
26.7% 73.3%
Business
planning:financial andmarketing orplan
43.8% 56.2%
Businessplanning:financial, mktassessment, plan
36.0% 64.0% 0.0540
Competitivestrategy: hi
technologyprocesses
2.92 2.76 0.0576 0.49 5.6 37 Q302G,Q302I
Competitivestrategy: new,quality products
2.81 2.75 0.5224 0.58 5.6 37 Q302D,Q302E
Competitivestrategy: lowerprices
2.61 2.55 0.5323 N/A 5.6 37 Q302
Competitivestrategy:superior
location,convenience
2.69 2.85 0.1152 N/A 5.6 37 Q302C
Competitivestrategy: nichemarket
3.15 3.17 0.7695 N/A 5.6 37 Q302B
Competitivestrategy:superior quality
3.69 3.60 0.0993 N/A 5.6 37 Q302A
No technologyemphasis
35.5% 64.5% 0.32 5.6 38 Q299, Q300,Q301
Low technologyemphasis
30.4% 69.6%
Mediumtechnologyemphasis
24.9% 75.1%
High technologyemphasis
28.4% 71.6% 0.2079

7/18/2019 New Firm Creation in the United
http://slidepdf.com/reader/full/new-firm-creation-in-the-united 164/168
Appendix.5Ax.3. Detailed Comparison of Start-Ups Outcomes: New Firms and Others 151
Dimension,characteristics,factor
Newfirm
ActiveSU,quit
Statsign Alpha Table
Hand’kchap
Variablelabels
No and low tech 32.9% 67.1% 5.6 38 Q299, Q300,Q301
Medium and hightechnology
25.8% 74.2% 0.0820
Per capita totalpersonalincome, 1993:0–25%-tile
30.9% 69.1% N/A 5.7 None PCINC934
Per capita totalpersonal
income, 1993:25–50%-tile
35.0% 65.0%
Per capita totalpersonalincome, 1993:50–75%-tile
31.0% 69.0%
Per capita totalpersonalincome, 1993:75–100%-tile
30.0% 70.0% 0.7854
Per cent HH w/income$75,000-up,1989: 0–25%-tile
39.9% 60.1% N/A 5.7 None HH75K894
Per cent HH w/income$75,000-up,1989:50–75%-tile
27.0% 73.0%
Per cent HH w/income$75,000-up,1989:50–75%-tile
31.7% 68.3%
Per cent HH w/income$75,000-up,1989:75–100%-tile
29.8% 70.2% 0.1179
Per centpopulation
25–44 years old,1990: 0–25%-tile
33.2% 66.8% N/A 5.7 None P2544904
Per centpopulation25–44 years old,1990:25–50%-tile
32.0% 68.0%

7/18/2019 New Firm Creation in the United
http://slidepdf.com/reader/full/new-firm-creation-in-the-united 165/168
152 Methodlogical Appendices
Dimension,characteristics,factor
Newfirm
ActiveSU,quit
Statsign Alpha Table
Hand’kchap
Variablelabels
Per centpopulation25–44 years old,1990:50–75%-tile
35.8% 64.2%
Per centpopulation25–44 years old,1990:75–100%-tile
26.0% 74.0% 0.2312
Per cent 25+ yrsw/collegedegrees, 1990:0–25%-tile
34.6% 65.4% N/A 5.7 None PCOLL904
Per cent 25+ yrsw/collegedegrees, 1990:25–50%-tile
33.2% 66.8%
Per cent 25+ yrsw/college
degrees, 1990:50–75%-tile
33.4% 66.6%
Per cent 25+ yrsw/collegedegrees, 1990:75–100%-tile
26.1% 73.9% 0.3319
Urbanizationindex, fouritems:0–25%-tile
40.2% 59.8% 0.87 5.7 None PCINC934,HH75K894,P2544904,PCOLL904
Urbanizationindex, fouritems:25–50%-tile
26.2% 73.8%
Urbanizationindex, fouritems:50–75%-tile
34.1% 65.9%
Urbanizationindex, fouritems:
75–100%-tile
27.8% 72.2% 0.0447
Populationdensity,persons/sq mile,1992: 0–25%-tile
41.2% 58.8% N/A 5.7 None POPDN924

7/18/2019 New Firm Creation in the United
http://slidepdf.com/reader/full/new-firm-creation-in-the-united 166/168
Appendix.5Ax.4. Constructing Start-Up Activity Indices 153
Dimension,characteristics,factor
Newfirm
ActiveSU,quit
Statsign Alpha Table
Hand’kchap
Variablelabels
Population density,persons/sq mile,1992: 25–50%-tile
27.8% 72.2%
Population density,persons/sq mile,1992: 50–75%-tile
26.6% 73.4%
Population density,persons/sq mile,1992:75–100%-tile
32.4% 67.6% 0.0231
Population growth,avg annual:1980–1992:0–25%-tile
29.9% 70.1% N/A 5.7 None PC8092A4
Population growth,avg annual:1980–1992:25–50%-tile
35.3% 64.7%
Population growth,avg annual:
1980–1992:50–75%-tile
31.2% 68.8%
Population growth,avg annual:1980–1992:75–100%-tile
29.5% 70.5% 0.6498
Appendix.5Ax.4 Constructing Start-Up Activity IndicesThe procedure for developing the indices involved attention to both the
results of standard factor analysis and reliability measures using SPSS
PC 5.0.1. Final allocations of items to factors involved consideration of
results from both assessments.
Factors analysis was run on the acts initiated at 1 month, 6 months,
and 1, 2, 3, 4, 5, and 6 years following conception. There were few clear
patterns across the early periods, one and six months, but the resultsfor years two through six reflected considerable stability; a six fac-
tor solution appeared in most assessments, using the standard default
criteria. The weakest loading – split between two factors – was for ini-
tiating a bank account. The final allocation of items is as followed in

7/18/2019 New Firm Creation in the United
http://slidepdf.com/reader/full/new-firm-creation-in-the-united 167/168
154 Methodlogical Appendices
T a b l e 5 A x . 4 . 1 I t
e m s i n c l u d e d i n t h e s t a r t - u p
a c t i v i t y d o m a i n s
D o m a i n
I t e m s
P S E D I : V a r i a b l e l a b e l s
B u s i n e s s p r e s e n c e
E s t a b l i s h e d a n e x c l u s i v e b a n k a c c o
u n t
Q
1 6 0 ; R 6 1 7 ; S 6 1 7 ; T 6 1 7
D e v o t e d f u l l t i m e t o s t a r t - u p e ff o r t , 3 5 + h r s / w e e k
Q
1 5 3 ; R 6 1 0 ; S 6 1 0 ; T 6 1 0
I n s t a l l e d d e d i c a t e d p h o n e l i n e
Q
1 7 4 ; R 6 3 2 ; S 6 3 2 ; T 6 3 2
I n i t i a t
e d a p h o n e b o o k o r i n t e r n e t l i s t i n g
Q
1 7 1 ; R 6 2 9 ; S 6 2 9 ; T 6 2 9
H i r e d
a n e m p l o y e e f o r p a y
Q
1 5 5 ; R 6 1 2 ; S 6 1 2 ; T 6 1 2
P r o d u c t i o n i m p l e m e n t a t i o n
P u r c h a s e d r a w m a t e r i a l s , i n v e n t o r y , s u p p l i e s , c o m p o n e n t s
Q
1 2 8 ; R 5 8 5 ; S 5 8 5 ; T 5 8 5
P u r c h a s e d , l e a s e d p l a n t , e q u i p m e n t , p r o p e r t y
Q
1 3 1 ; R 5 8 8 ; S 5 8 8 ; T 5 8 8
P r o m o
t i o n o f p r o d u c t o r s e r v i c e h a s s t a r t e d
Q
1 2 2 ; R 5 7 9 ; S 5 7 9 ; T 5 7 9
R e c e i v
e d a n y m o n e y , i n c o m e , o r f e e s
Q
1 6 2 ; R 6 1 9 ; S 6 1 9 ; T 6 1 9
E s t a b l i s h e d s u p p l i e r c r e d i t
Q
1 4 9 ; R 6 0 6 ; S 6 0 6 ; T 6 0 6
I n i t i a l
p o s i t i v e m o n t h l y c a s h fl o w
Q
1 6 3 ; R 6 2 1 ; S 6 2 1 ; T 6 2 1
O r g a n i z a t i o n a l , fi n a n c i a l s t r u c t u r e
O r g a n i z e d a s t a r t - u p t e a m
Q
1 1 6 ; R 5 7 3 ; S 5 7 3 ; T 5 7 3
P r e p a r e d a b u s i n e s s p l a n
Q
1 1 1 ; R 5 6 8 ; S 5 6 8 ; T 5 6 8
D e v e l o
p fi n a n c i a l p r o j e c t i o n s
Q
1 3 7 ; R 5 9 4 ; S 5 9 4 ; T 5 9 4
A s k e d
fi n a n c i a l i n s t i t u t i o n s o r o t h e r p e o p l e f o r f u n d s
Q
1 4 5 ; R 6 0 2 ; S 6 0 2 ; T 6 0 2
P e r s o n a l p l a n n i n
g
T i m e t h i n k i n g a b o u t t h e n e w b u s i n e s s
Q
1 0 9 ; r 5 6 6 ; S 5 6 6 ; T 5 6 6
D e fi n e
m a r k e t o p p o r t u n i t i e s
Q
1 3 4 ; R 5 9 1 ; S 5 9 1 ; T 5 9 1
I n v e s t m e n t o w n m o n e y
Q
1 4 3 ; R 6 0 0 ; S 6 0 0 ; T 6 0 0
P e r s o n a l p r e p a r a
t i o n
B e g a n
t o s a v e m o n e y t o i n v e s t
Q
1 3 9 ; R 5 9 6 ; S 5 9 6 ; T 5 9 6
A r r a n g e d c h i l d c a r e , h o u s e h o l d h e l p
Q
1 5 1 ; R 6 0 8 ; S 6 0 8 ; T 6 0 8
T a k e n
a n y c l a s s e s o r w o r k s h o p
Q
1 6 7 ; R 6 2 5 ; S 6 2 5 ; T 6 2 5
T a s k o r p r o d u c t
D e v e l o
p e d p r o d u c t o r s e r v i c e m o d e l o r p r o t o t y p e
Q
1 2 0 ; R 5 7 7 ; S 5 7 7 ; T 5 7 7
P a t e n t , t r a d e m a r k , c o p y r i g h t a p p l i c a t i o n s u b m i t t e d
Q
1 2 4 ; R 5 8 2 ; S 5 8 2 ; T 5 8 2
F o r m a l r e g i s t r a t i o n
P a i d fi
r s t s t a t e u n e m p l o y m e n t i n s u
r a n c e t a x
Q
1 7 5 ; R 6 3 3 ; S 6 3 3 ; T 6 3 3
P a i d fi
r s t f e d e r a l s o c i a l s e c u r i t y t a x p a y m e n t
Q
1 7 8 ; R 6 3 6 ; S 6 3 6 ; T 6 3 6
F i l e d fi r s t f e d e r a l i n c o m e t a x r e t u r
n
Q
1 7 9 ; R 6 3 7 ; S 6 3 7 ; T 6 3 7
K n o w
fi r m l i s t e d w i t h D u n a n d B r
a d s t r e e t
Q
1 8 1 ; R 6 3 9 ; S 6 3 9 ; T 6 3 9

7/18/2019 New Firm Creation in the United
http://slidepdf.com/reader/full/new-firm-creation-in-the-united 168/168
Appendix.5Ax.4. Constructing Start-Up Activity Indices 155
Table 5Ax.4.2 Reliability for start-up activity domain indices, by year
First
month
Sixth
month
First
year
Second
year
Third
year
Fourth
yearBusiness presence 0.43 0.58 0.70 0.72 0.75 0.75Production implementation 0.45 0.67 0.66 0.72 0.72 0.74Organizational, financialstructure
0.21 0.58 0.59 0.59 0.58 0.58
Personal planning 0.37 0.55 0.52 0.54 0.52 0.51Personal preparation −0.02 0.38 0.31 0.36 0.36 0.38Task, product development 0.22 0.26 0.25 0.25 0.24 0.22
Table 5Ax.4.1 [first letter of PSED I variable labels indicates the datacollection wave: Q = 1,R = 2;S = 3; and T = 4].
Once the six factors were established, reliability to determine
Chronbach’s Alpha was completed on all eight time periods. “Initi-
ating a bank account” was allocated to equalize the reliability for the
first two factors. The reliabilities for the measures for the first six time
periods is presented in Table 5Ax.4.2, the results for years five and six