new insights on the sister lineage of percomorph fishes ... · new insights on the sister lineage...
TRANSCRIPT

Molecular Phylogenetics and Evolution 110 (2017) 27–38
Contents lists available at ScienceDirect
Molecular Phylogenetics and Evolution
journal homepage: www.elsevier .com/ locate /ympev
New insights on the sister lineage of percomorph fishes with ananchored hybrid enrichment dataset
http://dx.doi.org/10.1016/j.ympev.2017.02.0171055-7903/� 2017 Elsevier Inc. All rights reserved.
⇑ Corresponding author at: North Carolina Museum of Natural Sciences, Raleigh,NC 27601, USA.
E-mail address: [email protected] (A. Dornburg).
Alex Dornburg a,⇑, Jeffrey P. Townsend b,c,d, Willa Brooks a, Elizabeth Spriggs b, Ron I. Eytan e,Jon A. Moore f,g, Peter C. Wainwright h, Alan Lemmon i, Emily Moriarty Lemmon j,Thomas J. Near b,k
aNorth Carolina Museum of Natural Sciences, Raleigh, NC, USAbDepartment of Ecology & Evolutionary Biology and Peabody Museum of Natural History, Yale University, New Haven, CT 06520, USAcProgram in Computational Biology and Bioinformatics, Yale University, New Haven, CT 06520, USAdDepartment of Biostatistics, Yale University, New Haven, CT 06510, USAeMarine Biology Department, Texas A&M University at Galveston, Galveston, TX 77554, USAf Florida Atlantic University, Wilkes Honors College, Jupiter, FL 33458, USAg Florida Atlantic University, Harbor Branch Oceanographic Institution, Fort Pierce, FL 34946, USAhDepartment of Evolution & Ecology, University of California, Davis, CA 95616, USAiDepartment of Scientific Computing, Florida State University, 400 Dirac Science Library, Tallahassee, FL 32306, USAjDepartment of Biological Science, Florida State University, 319 Stadium Drive, Tallahassee, FL 32306, USAk Peabody Museum of Natural History, Yale University, New Haven, CT 06520, USA
a r t i c l e i n f o a b s t r a c t
Article history:Received 12 April 2016Revised 22 February 2017Accepted 25 February 2017Available online 27 February 2017
Keywords:HomoplasyNucleotide saturationBeryciformesCodon biasGC3Anchored phylogenomicsHybrid enrichment
Percomorph fishes represent over 17,100 species, including several model organisms and species of eco-nomic importance. Despite continuous advances in the resolution of the percomorph Tree of Life, resolu-tion of the sister lineage to Percomorpha remains inconsistent but restricted to a small number ofcandidate lineages. Here we use an anchored hybrid enrichment (AHE) dataset of 132 loci with over99,000 base pairs to identify the sister lineage of percomorph fishes. Initial analyses of this dataset failedto recover a strongly supported sister clade to Percomorpha, however, scrutiny of the AHE datasetrevealed a bias towards high GC content at fast-evolving codon partitions (GC bias). By combining severalexisting approaches aimed at mitigating the impacts of convergence in GC bias, including RY coding andanalyses of amino acids, we consistently recovered a strongly supported clade comprised ofHolocentridae (squirrelfishes), Berycidae (Alfonsinos), Melamphaidae (bigscale fishes), Cetomimidae(flabby whalefishes), and Rondeletiidae (redmouth whalefishes) as the sister lineage to Percomorpha.Additionally, implementing phylogenetic informativeness (PI) based metrics as a filtration methodyielded this same topology, suggesting PI based approaches will preferentially filter these fast-evolvingregions and act in a manner consistent with other phylogenetic approaches aimed at mitigating GC bias.Our results provide a new perspective on a key issue for studies investigating the evolutionary history ofmore than one quarter of all living species of vertebrates.
� 2017 Elsevier Inc. All rights reserved.
1. Introduction Rutschmann et al., 2011; Near et al., 2012a), and several model
With more than 17,100 species, percomorph fishes compriseone out of every four of the world’s living species of vertebrates(Eschmeyer and Fricke, 2015), including the majority of commer-cially important fishes (Rosenberg et al., 2005; Sethi et al., 2010;Rhyne et al., 2012), essential components in aquatic food webs(Carpenter et al., 1987; Winemiller, 1990; La Mesa et al., 2004;
organisms in scientific studies (Brenner et al., 1993; Shapiroet al., 2004; Seehausen, 2006). Concomitant with this staggeringdiversity have come some of the most vexing problems in verte-brate phylogenetics. The last decade has nevertheless yieldedunprecedented progress in achieving phylogenetic resolution ofpercomorphs, both among closely related species (Santini et al.,2013; Hundt et al., 2014; Santini and Carnevale, 2015; Thackeret al., 2015) and between major clades (Broughton et al., 2013;Chanet et al., 2013; Faircloth et al., 2013; Lautredou et al., 2013;Near et al., 2015; Sanciangco et al., 2015). While researchers havebeen honing in on a robust percomorph tree of life, resolution

28 A. Dornburg et al. /Molecular Phylogenetics and Evolution 110 (2017) 27–38
of the sister lineage to this remarkable radiation has remainselusive.
Recent molecular studies have consistently included severalfish families as candidate percomorph sister lineages. However,the resolution of the relationships between these families and per-comorphs remain divergent between studies. Over the last decade,molecular studies generally resolve one of the following threeclades as the percomorph sister lineage: (1) the Holocentridae(squirrelfishes) (Betancur-R et al., 2013a); (2) a clade that includesHolocentridae, Berycidae (alfonsinos), and several families of enig-matic deep sea fishes including Melamphaidae (ridgeheads) andvarious whalefishes such as Cetomimidae and Rondeletiidae(Miya et al., 2003); or (3) a clade containing all of the previouslymentioned lineages along with Trachichthyidae (roughies), Diret-midae (dories), Monocentridae (pinecone fish), Anoplogastridae(fangfishes), and Anomalopidae (flashlightfishes) (Miya et al.,2005; Smith and Wheeler, 2006; Near et al., 2012b, 2013);(Fig. 1). Identifying potential factors underlying this topologicalconflict is critical if we are to consistently resolve the sister lineageto percomorphs. Such efforts will serve to not only place studies ofmorphological and genomic evolution of teleost fishes into abroader context, but also provide a comparative perspective toinvestigate the processes that have generated a quarter of livingvertebrate biodiversity.
The lack of resolution concerning the sister lineage of Perco-morpha exemplifies an emerging problem in phylogenomics. Evenwith technological improvements in DNA sequencing (Schuster,2007; Mardis, 2008; Davey et al., 2011; Faircloth et al., 2012) thathave enabled a growing trend towards larger multi-locus andgenomic scale datasets (Crawford et al., 2012b, 2015; Jarvis et al.,2014; Crawford et al., 2015; Prum et al., 2015), some nodes stillcontinue to defy resolution (Jeffroy et al., 2006; Galtier andDaubin, 2008; Philippe et al., 2011; Morgan et al., 2013;Romiguier et al., 2013). This lack of topological resolution—one ofseveral potential pitfalls of phylogenomics—is often attributed tolarge numbers of sequence characters whose state represents con-vergence and not shared evolutionary history, masking the phylo-genetic signal of relationships (Jeffroy et al., 2006; Rokas andChatzimanolis, 2008). Correspondingly, detecting and filteringhomoplasious sites has become a critical step in phylogenomic
B.A. Percomorpha
Holocentridae
Diretmidae
Anoplogastridae
Trachichthyidae
Monocentridae
*Gibberichthyidae
Melamphaidae
Stephanoberycidae
*Hispidoberycidae
Cetomimidae
Rondeletiidae
Berycidae
Barbourisiidae
Anomalopidae
Holocentridae
Percomorpha
Diretmidae
Anoplogastridae
Trachichthyidae
Monocentridae
Anomalopidae
*Gibberichthyidae
Melamphaidae
Stephanoberycida
*Hispidoberycidae
Cetomimidae
Rondeletiidae
Berycidae
Barbourisiidae
Fig. 1. Examples of previous molecular based studies resolving the sister lineage of Percoet al. (2012b). Highlighted branches indicate the inferred sister clade to PercomorphaPercomorpha and its sister lineage. Lineages marked with a ‘‘*” indicate lineages not samNelson et al. (2016).
inference (Townsend et al., 2012; Lin et al., 2013; Salichos andRokas, 2013; Doyle et al., 2015).
Homoplasy is certainly not a problem unique to phyloge-nomics and has been a core issue since the advent of evolution-ary thinking. Decades of literature within phylogenetics canattest to the challenges of discerning whether a morphologicalcharacter represents a single origin, or is in fact the culminationof multiple independent origins (Goodman, 1967; Forey, 1973;Archie, 1989; Johnson and Patterson, 1993). Likewise, moleculardata are not infallible and convergence in nucleotide state iscommon in rapidly evolving genomic regions found in clades asdiverse as mammals (Parker et al., 2013), fishes (Betancur-Ret al., 2013b), and plants (Cox et al., 2014). Despite the recogni-tion of homoplasy as a problem, determining which portions ofan alignment contribute to erroneous inference is not straightfor-ward. Removing fast-evolving regions from analyses can certainlyimprove phylogenetic accuracy by eliminating homoplasious sites(Delsuc et al., 2005; Dornburg et al., 2014b). However, removingsites that are evolving at only a moderately fast rate can degradeaccuracy by eliminating sites containing essential phylogeneticinformation (Pisani, 2004). This contrast suggests that the assess-ment of homoplasy requires a defined relationship between ratesof character change and correct resolution of phylogeneticproblems.
Integrating phylogenetic informativeness (PI) profiles(Townsend, 2007) with theoretical models of phylogenetic signaland noise (Townsend et al., 2012; Su et al., 2014) presents anintriguing approach for evaluating potential homoplasy in datasets. PI profiles will by their nature depict the severity to whichphylogenetic information content has decayed over time(Townsend and Leuenberger, 2011), and investigators have readilycoopted the method to test for the accumulation of homoplasioussites in an alignment (Crawley and Hilu, 2012; Dornburg et al.,2014b; Hilu et al., 2014; Gilbert et al., 2015). Recently, Prumet al. (2015) combined PI profiles with signal and noise modelsto assess whether the rate of decay was predicted to impact nodesof varying lengths and depths. Such an approach accounts forheterogeneity in the effect of homoplasy based on inter-nodelength. However, it remains to be determined whether thisapproach could be used as a dataset filtration metric.
C.
e
Percomorpha
Diretmidae
Anoplogastridae
Trachichthyidae
Monocentridae
Anomalopidae
*Gibberichthyidae
Melamphaidae
*Hispidoberycidae
Cetomimidae
Rondeletiidae
Berycidae
Barbourisiidae
Holocentridae
Stephanoberycidae
morpha: A. Betancur-R et al. (2013a); B. Miya et al. (2003); C. Miya et al. (2005), Near, dashed lines indicate divergences prior to the most recent common ancestor ofpled in the referenced studies. Placement of these lineages in the tree is based on

Loci
Ave
rage
Locu
sLe
ngth
Percen
tread
sin
assembly
Cov
erag
epe
rlocu
sCov
erag
epe
rco
ntig
262
853.45
2.91
1318
.94
4166
3.44
260
803.43
1.94
1137
.40
3897
3.40
270
954.98
2.67
1386
.99
4778
3.32
247
770.80
1.83
982.63
3065
0.30
274
787.97
2.63
1512
.15
4734
6.67
274
831.07
1.82
1032
.28
4915
6.85
282
833.15
3.58
1476
.39
4376
8.10
293
949.75
5.40
2050
.82
6689
0.74
271
843.21
5.17
2028
.88
6641
5.41
280
872.54
2.51
1572
.36
5207
9.82
275
864.86
3.56
1396
.66
4612
4.14
299
983.68
6.02
2141
.75
6117
0.10
250
923.58
3.47
1848
.36
6535
8.33
265
920.52
5.01
1890
.03
4848
5.99
305
970.93
4.73
1736
.98
5582
5.18
273.8
877.59
3.55
1567
.50
5077
9.45
hat
assembled
toalocu
spo
stda
tafiltration
(Lem
mon
etal.,20
12)divide
dby
the
A. Dornburg et al. /Molecular Phylogenetics and Evolution 110 (2017) 27–38 29
Here we assess whether we can reconcile incongruent phyloge-netic hypotheses, or diagnose a lack of phylogenetic resolution,regarding the sister lineage of percomorph fishes using analysesof next-generation sequence data. With this aim, we sequenced132 loci for species representing lineages that span the candidatepool of major lineages proposed as sister to Percomorpha as wellas several percomorph, and outgroup taxa using anchored hybridenrichment (AHE; Lemmon et al., 2012; Lemmon and Lemmon,2013). We conducted a series of maximum likelihood (ML) phylo-genetic inferences using the nucleotide sequence alignments incombination with a data filtration approach that combines signaland noise approaches (Townsend et al., 2012) with PI profiling(Townsend, 2007). We compared these analyses with a Bayesiananalysis of the amino acid translations, a coalescent basedspecies-tree analysis, and a maximum likelihood analysis of thedata transformed using an RY coding scheme. Our analyses resultin consistent phylogenetic resolution of a clade containing Holo-centridae, Rondeletiidae, Cetomimidae, Berycidae, and Melam-phaidae as the sister lineage to Percomorpha. These findingshighlight that PI based filtration offers an additional tool in thephylogenomics toolbox for addressing homoplasy and elucidate apotential source of error that is increasingly ubiquitous in loci thatare used to investigate phylogenetic relationships at moderate todeep timescales.
Table1
Summarystatistics
ofthean
chored
hybrid
enrich
men
tcaptur
eprotoc
olpriorto
datasetcu
ration
bysp
ecies.
Species
Family
YFT
CNumbe
rRea
dsHiSeq
PE10
0Rea
dsMiSeq
PE15
0Con
tigs
Bases
inCon
tigs
Rea
dsin
Con
tigs
Enrich
men
tEfficien
cy
Macrourus
whitson
iMacrourida
e21
825
1136
8266
5228
7076
331
7892
0834
5563
213
Zeno
psis
conc
hifera
Zeidae
1373
014
5575
0268
3468
700
2728
1383
2957
2313
9Pe
rcop
sis
omiscomycus
Percop
sida
e21
744
1335
0502
6533
1072
234
4995
5937
4487
192
Poromitra
curilensis
Melam
phaida
e22
142
1274
5170
5149
8468
621
0261
0624
2710
131
Myripristis
jacobu
sHoloc
entridae
1362
515
0863
6463
8348
853
4038
6706
4143
2818
9Ano
malop
ska
toptron
Anom
alop
idae
2212
314
9569
1457
6002
685
3367
2444
2828
4513
0Gyrinom
imus
bruu
niCetom
imidae
1382
011
1470
8247
7296
902
3947
8823
4163
4125
6Diretmoide
spa
ucirad
iatus
Diretmidae
1453
410
6739
0844
5574
849
5679
0239
6008
9026
4
Ano
plog
astercornuta
Anop
loga
steridae
1455
510
1838
5044
3340
837
5558
9697
5498
2737
1Mon
ocen
trus
reidi
Mon
ocen
tridae
2175
316
8725
6465
8744
809
4213
2578
4402
6229
6Aulotrach
ichthy
ssajade
malen
sis
Trachichthyida
e14
889
1034
9390
4377
9276
935
4694
6138
4082
232
Ron
deletialoricata
Ron
deletiidae
1362
810
1600
5647
0604
1012
6190
4146
6403
8358
8Be
ryxde
cada
ctylus
Beryc
idae
1116
312
7989
1050
3622
741
4843
0525
4620
8924
0Men
idia
men
idia
Atherinop
sida
e17
777
9616
306
3713
5296
846
9344
3950
0858
396
Bovich
tusdiacan
thus
Bov
ichtida
e34
7710
6962
4850
9238
899
5018
6840
5297
8050
0
Ave
rage
1230
4202
.13
5271
02.93
813
4170
4810
.27
4320
11.2
275.8
Cov
erag
erepresen
tsthemax
imum
numbe
rof
read
sov
erlapp
ingasite
within
anassembled
locu
s,efficien
cyrepresen
tsthepe
rcen
tof
read
st
percen
tage
that
wou
ldhav
ebe
enob
tained
iflocu
sfrag
men
tswererando
mly
distribu
tedacross
agive
nge
nom
e.
2. Methods
2.1. Sequence data acquisition
We assembled a phylogenomic dataset that spans most majorlineages in the candidate pool of lineages sister to Percomorpha.Our sampling includes a representative species of each of the fol-lowing lineages: Anomalopidae, Anoplogastridae, Monocentridae,Diretmidae, Trachichthyidae, Holocentridae, Rondeletiidae, Beryci-dae, Melamphaidae, and Cetomimidae, as well as percomorph spe-cies of Ovalentaria and Notothenioidei. We included three speciesto serve as outgroups in our phylogenomic analyses: Zenopsis con-chifera, Macrourus whitsoni, and Percopsis omiscomycus that areconsistently considered as more deeply diverging in both molecu-lar and morphological studies (Johnson and Patterson, 1993;Moore, 1993b, 1993a; Colgan et al., 2000; Miya et al., 2003;Alfaro et al., 2009; Santini et al., 2009; Near et al., 2012b, 2013;Betancur-R et al., 2013a). A tissue sample of a holocentrid(Myripristis jacobus) was field collected in Curaçao and depositedin the fish tissue collection of the Yale Peabody Museum (YFTC).One individual per major lineage was additionally obtainedthrough the YFTC (Table 1). Muscle tissue biopsies were stored in95% ethanol or RNAlater (Qiagen, Valencia, CA) and DNA wasextracted using Qiagen DNAeasy Tissue Extraction Kits (Qiagen,Valencia, CA). Following extraction, DNA yields were quantifiedusing a Thermo Scientific NanoDrop. Library preparation, enrich-ment, and sequencing protocols followed the vertebrate protocolof Lemmon et al. (2012). Data were collected at the Center forAnchored Phylogenomics (www.anchoredphylogeny.com) at Flor-ida State University. After extraction, genomic DNA was sonicatedto a fragment size of �150–400 bp using a Covaris E220 Focused-ultrasonicator with Covaris microTUBES. Subsequently, librarypreparation and indexing were performed by hand following a pro-tocol modified from Meyer and Kircher (2010). Indexed sampleswere then pooled at equal quantities, and then the library poolwas enriched using the Vertebrate v.1 kit (Agilent TechnologiesCustom SureSelect XTd; enrichment probes available fromLemmon et al., 2012). This enrichment kit targets 512 conservedregions, primarily located in exons. The enriched library pool wasthen sequenced on 1 PE100 Illumina HiSeq 2000 lane at the Trans-

30 A. Dornburg et al. /Molecular Phylogenetics and Evolution 110 (2017) 27–38
lational Science Laboratory in the College of Medicine at FloridaState University.
Loci captured using AHE were assessed for paralogs using theAHE pipeline developed by Lemmon et al. (2012) and recently out-lined by Eytan et al. (2015). Briefly, this approach works by select-ing a reference individual based on capture efficiency. Consensussequences for each locus were aligned to the reference taxon’ssequences. Homolog sets are then constructed algorithmically foreach locus as follows: the first homolog set represents the firsthomolog identified for the first individual and the sequences fromeach other individual that had the greatest sequence similarity tothe reference sequence. This set is then removed from the candi-date pool of sequences. A second homolog set is then constructedfrom the next reference sequence, that may represent a secondcopy of a duplicated gene, and the corresponding sequences fromeach individual that best align to that reference sequence. Thesesequences are then removed, and the iterative process continuesuntil all potential homolog sets are constructed. Non-exon targetswere filtered and genes were edited and aligned in Geneious v7.0.6(Drummond et al., 2010), with the resulting nucleotide alignmentconsisting of 99,948 base pairs. All raw data, consensus sequences,and alignments are available on Zenodo (DOI: 105281/zenodo.321684).
2.2. Phylogenetic information and filtration
Although AHE is based on sequencing loci that are conservedacross all vertebrates (Lemmon et al., 2012), unequal rates ofnucleotide substitution, in particular saturation of third codon posi-tions, have been observed in other phylogenomic datasets over deeptimescales (Jeffroy et al., 2006; Dávalos and Perkins, 2008; Lin et al.,2013) and can create discordance between amino acid and nucleo-tide inferred topologies (Rota-Stabelli et al., 2013). Thus, we quanti-fied site-specific rates of substitution for each locus and codonposition using the program Hyphy (Pond and Muse, 2005) in thePhyDesign web interface (Lopez-Giraldez and Townsend, 2011)with a pruned chronogram fromNear et al. (2013). To assess generaltrends of information content over the temporal history of the taxain this study, profiles of phylogenetic informativeness (2007) for theconcatenated alignment, each locus, and each codon position weregenerated from the site-specific rates using the R package PhyIn-formR (Dornburg et al., 2016; available on CRAN and at https://github.com/carolinafishes/PhyInformR).
Relative time
Rel
ativ
e P
hylo
gene
tic In
form
ativ
enes
s
0.0 0.2 0.4 0.6 0.8 1.0 0.0 0.2 0.4
A. B.
00.
200.
400.
600.
801.
0
Fig. 2. Sample of relative PI profiles from the anchored hybrid enrichment based datasethat span the variance in profile shape. The X-axis reflects time from present and the y-axprofile of individual codon partitions. PI profiles are scaled to the maximum height in e
As PI profiles provide no direct prediction of how homoplasioussite patterns will influence phylogenetic resolution (Klopfsteinet al., 2010; Townsend et al., 2012), we also evaluated ‘‘signal” ver-sus ‘‘noise” probabilities (Townsend et al., 2012) for the phyloge-netic quartet representing the most recent common ancestor ofPercomorpha and ‘‘Beryciformes” (sensu Near et al., 2013). Weused the quartet internode homoplasy probability (QIHP), a quan-tification of ‘‘noise” specified in Townsend et al. (2012). Under a setof asymptotic assumptions, QIHP represents the probability of hav-ing greater strength of support at a given internode for an incorrectrather than correct quartet topology. Calculation of QIHP requiresspecification of heights for nodes of interest. Because these intern-ode lengths are typically imprecisely known, PI profiles were ini-tially used to guide selection of codon partitions and internodelengths that would maximize the range of the QIHP value distribu-tion from the posterior distribution of trees. Since declines in PIprofiles are correlated with increasing instances of homoplasy inan alignment (Townsend and Leuenberger, 2011), this usage facil-itates the ‘‘worst-case” quantification of QIHP values, as the result-ing internodes will include the steepest declines in PI and thecorrespondingly highest QIHP values.
Forty-five codon partitions from the genes that span the varia-tion in PI profile shapes (Fig. 2) were used to calculate the QIHPacross the posterior distribution of branch lengths that representthe most recent common ancestor (MRCA) of Percomorpha andits sister lineage from the Near et al. (2012b) study. The resultingdistribution of QIHP facilitated the identification of the tree depthand internode distances that maximized the interval of QIHP val-ues, as outlined in the approach above. With the identified combi-nation of branch lengths, we calculated the QIHP for first, second,and third position sites within codons for each gene, and retainedthose partitions up to the locus-median change point of QIHP usingthe R package changepoint (Killick and Eckley, 2014). This filtrationapproach was repeated nine additional times using random drawsof branch lengths from the posterior distribution of guide treesyielding a total of 10 datasets that contained between 69,6555and 87,397 nucleotides. To assess the influence of the guide treeon rate estimates and the retention of loci, this entire processwas also conducted using a guide tree that forced the Holocentri-dae to be the sister lineage to Percomorpha. Base frequencies werealso compared between the filtered and unfiltered datasets, tofacilitate identification of deviations from stationarity.
from present0.6 0.8 1.0 0.0 0.2 0.4 0.6 0.8 1.0
C.
t that span the variance of all visualized PI profiles. A-C represent the three bin setsis reflects phylogenetic informativeness. Line’s within each plot correspond to the PIach subset.

A. Dornburg et al. /Molecular Phylogenetics and Evolution 110 (2017) 27–38 31
2.3. Phylogenomic analysis
We assembled four permutations of the AHE nucleotide datasetfor ML analyses: (1) a concatenated analysis of the nucleotide data-set containing all loci partitioned by codon position, (2) a concate-nated analysis of the nucleotide dataset containing only the firstand second codon positions partitioned by codon position, (3) aconcatenated analysis of the nucleotide dataset, partitioned bycodon position, with third codon positions RY coded (Phillips andPenny, 2003; Phillips et al., 2004), and (4) a series of concatenatedanalyses of the nucleotide codon partitions with values below thelocus-median change point of QIHP (10 analyses per initial guidetree).
For all four datasets, ML analyses were conducted using theRandomized Accelerated Maximum Likelihood (RAxML) softwarev. 7.3.0 (Stamatakis, 2006). Nucleotide analyses were conductedunder a GTR + C model of nucleotide substitution. For each analy-sis, 200 ML searches were conducted using a random starting tree(-d setting) and a random search convergence criterion based onRobinson-Foulds distances (-D setting). One thousand bootstrapreplicates were conducted using the thorough bootstrap search(option –f i) for each dataset and confidence values were mappedonto the tree topology with the highest ML inferred from the ran-dom searches.
We additionally translated the nucleotide sequences into theircorresponding amino acid sequences using Geneious v7.0.6(Drummond et al., 2010). A Bayesian analysis of the amino aciddata was conducted using the site heterogeneous CAT-GTR + C4(Lartillot and Philippe, 2004) model in Phylobayes MPI 1.5(Lartillot et al., 2013). Constant sites were removed to prevent bias-ing the CAT model profiles using the –dc option (Lartillot et al.,2013). We ran four independent Monte Carlo Markov chains for20,000 iterations, discarded a burn-in of the first 2000 iterations,then sampled parameter values every 10 iterations to composean approximation of their joint posterior distribution.
To assess the impact of potential gene-tree discordance on ourconcatenated analysis, we conducted a gene-tree species-tree anal-ysis using ASTRAL, which has been found to be more accurate thanother leading methods for disentangling incomplete lineage sort-ing from phylogenomic scale analyses (Mirarab et al., 2014). FirstML analyses were conducted on each individual locus as well asloci that were RY coded, and filtered using the procedure outlinedabove. Species-tree inferences were then conducted using theresulting ML gene trees for each protocol and the exact algorithmin ASTRAL (Mirarab et al., 2014) using 1000 multi-locus bootstrapreplicates to account for topological uncertainty in gene-tree infer-ence (Seo, 2008).
Table 2Results of anchored hybrid enrichment capture by species following dataset curation. N in
Species Family Number of loci N/%
Macrourus whitsoni Macrouridae 122 235/0.3Zenopsis conchifera Zeidae 129 158/0.2Percopsis omiscomycus Percopsidae 129 62/0.1Poromitra curilensis Melamphaidae 129 362/0.4Myripristis jacobus Holocentridae 131 208/0.2Anomalops katoptron Anomalopidae 128 63/0.1Gyrinomimus bruuni Cetomimidae 129 379/0.4Diretmoides pauciradiatus Diretmidae 132 324/0.4Anoplogaster cornuta Anoplogasteridae 128 293/0.3Monocentrus reidi Monocentridae 132 61/0.1Aulotrachichthys sajademalensis Trachichthyidae 132 113/0.1Rondeletia loricata Rondeletiidae 131 243/0.3Beryx decadactylus Berycidae 132 204/0.2Menidia menidia Atherinopsidae 122 180/0.2Bovichtus diacanthus Bovichtidae 130 188/0.2
Total: 132 3073/0.2
3. Results
3.1. Phylogenomic data capture
Anchored hybrid enrichment resulted in an average of12,304,202 reads per species using the HiSeq and 527,102 on theMiSeq (Table 1), read numbers that are consistent with the expec-tations of Lemmon et al. (2012) on both Illumina HiSeq 2000 andMiSeq sequencers. Contig assembly produced an average of 813contigs and an averaged total of 41,704,810 base pairs per species(Table 1). Enrichment resulted in an average capture of 275 locispanning approximately 877 base pairs per locus, with a minimumof 130 loci for the flashlight fish Anomalops katoptron and a maxi-mumof 305 loci for the notothenioid Bovichtus diacanthus (Table 1).These values of loci are in line with the expectations (Lemmonet al., 2012) given that the probe design model, Danio, is more than260 million years divergent from our focal group (Lemmon et al.,2012; Near et al., 2012b). Limiting our dataset to only loci thatwere captured for more than 90% of all taxa and include greaterthan 450 base pairs, we assembled a data matrix containing 132loci with 99,948 base pairs, after removing trailing edges fromthe individual gene alignments (Table 2).
3.2. Maximum likelihood analysis
Maximum likelihood analysis of the concatenated datasetresulted in a tree topology that features a clade containing all can-didate lineages as the sister lineage to Percomorpha (Fig. 3A).Monophyly of this inclusive clade was not strongly supported[Bootstrap support (BSS) < 70], though monophyly of all subcladeswas strongly supported (BSS > 95). One of these clades comprisesDiretmidae as sister to a clade of two additional clades, respec-tively containing Anoplogasteridae and Trachichthyidae, andMonocentridae and Anomalopidae, with strong support presentfor all nodes (Fig. 3A; BSS = 100). In the other clade Holocentridaeis resolved as the sister lineage to a clade which includes two lin-eages, whalefishes (Cetomimidae and Rondeletiidae), and Melam-phaidae and Berycidae with strong support for all of the nodes(BSS = 100; Fig. 3A). Visualizations of the PI profiles for the com-bined codon positions of the AHE data suggest that third positionsites decline in informativeness prior to the origin of Percomorpha(Fig. 4). Despite this decline in signal, inclusion of third positionsdid not at first appear to contribute significant noise: analysis ofthe nucleotides with (Fig. 3A) and without third codon positions(Fig. 3B) resulted in identical topologies, with both sets of analysesstrongly supporting the same relationship among candidate lin-eages (BSS > 95; Fig. 3A and B), while providing weak support for
dicates number of ambiguous base reads and missing indicates missing data.
Missing/% GC% GC 1st Codon GC 2nd Codon GC 3rd Codon
20,429/20.5 47.8 56.8 42.6 80.78722/8.7 51.9 54.8 42.8 739195/9.2 52.7 50.3 39 68.514,194/14.2 49.3 54.6 42.9 75.15205/5.2 51.1 53.7 42.8 65.31748/0.7 52.9 52.8 41.8 63.815,132/15.3 47.4 54.3 43.1 70.810,064/10.1 49.2 53.9 42.8 67.610,155/10.2 49.9 54.2 42.5 702374/2.4 52.8 52.5 41.6 63.81921/1.9 54.6 53.9 42.6 66.99418/9.4 49.8 53.8 42.7 68.44259/4.3 53.4 54.1 42.9 7014,894/14.9 46.8 53.9 43 68.35980/6.0 50.3 53.4 42.5 64.5
133,870/8.9 55.7 53.8 42.3 69.1

Outgroup
Ovalentaria
Notothenioidei
Holocentridae
Rondeletiidae
Cetomimidae
Melamphaidae
Berycidae
Diretmidae
Anoplogastridae
Trachichthyidae
Anomalopidae
Monocentridae
0.03
A. B.
C.
Ovalentaria
Notothenioidei
Outgroup
Holocentridae
Rondeletiidae
Cetomimidae
Melamphaidae
Berycidae
Anoplogastridae
Trachichthyidae
Diretmidae
Anomalopidae
Monocentridae
0.008
BS=10 0 BS=95-9 9 BS<70
Perco morpha
0.008
Outgroup
Percomorph a
Ovalentaria
Notothenioidei
Holocentridae
Melamphaidae
Berycidae
Rondeletiidae
Cetomimidae
Anoplogastridae
Trachichthyidae
Diretmidae
Anomalopidae
Monocentridae
Percomorpha
unlabeled
0.02
Ovalentaria
Notothenioidei
Holocentridae
Melamphaidae
Berycidae
Rondeletiidae
Cetomimidae
Anoplogastridae
Trachichthyidae
Diretmidae
Anomalopidae
Monocentridae
Percomorph a
OutgroupD.
8490
8370
Fig. 3. Phylogenetic relationships based on maximum likelihood analyses of the anchored hybrid enrichment nucleotide data. A. Maximum likelihood inferred phylogenybased on the concatenated nucleotide alignment of 132 genes. B. Maximum likelihood inferred phylogeny based on the concatenated nucleotide alignment of 132 genes withall third codon positions removed. C. Maximum likelihood inferred phylogeny based on the concatenated nucleotide alignment of codon positions based on the locus-medianchange point of QIHP. D. Maximum likelihood inferred phylogeny based on the concatenated nucleotide alignment with third positions RY-coded. No circles at nodesrepresent bootstrap support values (BS) of 100, black circles represent BSS between 95 and 99, and open circles represent BS of 70–90. Node values above each node in Cindicate median BSS values based on analyses using site rates estimated on the guide topology of Near et al. (2013), while values below each node indicate median BSS valuesfrom analyses conditioned on site rites from a guide tree depicting Holocentridae as sister to Percomorpha. Highlighted branches indicate the inferred sister clade toPercomorpha. All branch lengths are in substitution units.
32 A. Dornburg et al. /Molecular Phylogenetics and Evolution 110 (2017) 27–38
the resolution of the sister lineage to Percomorpha (BSS < 70;Fig. 3B).
When conditioning analyses on partitions of below the locusmedian change point of QIHP, the topology deviates from the pre-vious analyses of the concatenated matrix. There is moderate tostrong support for a clade containing Holocentridae, Rondeletiidae,Cetomimidae, Berycidae, and Melamphaidae (Fig. 3C;84 < BSS < 90) as the sister lineage to Percomorpha across all repli-cates regardless of guidetree chosen (Fig. 3C; 70 < BSS < 83). Rela-tionships within this clade remain identical to those inferred inthe previous two analyses. This topology also strongly supportsthe previously inferred relationships among Diretmidae, Anoplo-gastridae, Trachichthyidae, Monocentridae, and Anomalopidae(Fig. 3C; BSS = 100). Quantification of base frequencies from the fil-tered versus retained datasets demonstrates that filtration basedon QIHP largely omitted partitions with elevated GC content(Fig. 5). Although QIHP calculations do not assume a set topology,starting topologies have the potential to alter site rate estimates.
However, comparisons of site rates generated under different start-ing topologies revealed a strong correlation, suggesting resultingQIHP calculations to be robust to different starting guide trees(Fig. S1), as is evident from our visualization of locus-medianchange points (Fig. S2). When accounting for GC bias potentiallymisleading inference by RY coding of third codon positions(Phillips and Penny, 2003; Phillips et al., 2004), (Fig. 3D), resultsare identical to those conditioned on QIHP values below the locusmedian change point (Fig. 3D).
3.3. Amino acid and species-tree analyses
Bayesian analyses of the concatenated amino acid dataset undera CAT-GTR +C4 model results in a well-supported phylogeny thatis identical to that inferred from the filtered nucleotide datasetwith partitions conditioned on the degree of homoplasy (Fig. 6).These results were also identical to the topology inferred using amulti-coalescent model and all individual loci (Fig. S2A) though

Percent Adenine
Freq
uenc
y
500
040 Retained
Filtered
Ade
nine
Percent Thymine
Freq
uenc
y
500
040
Thym
ine
40
present 0.2 0.4 0.6 0.8 root
020
0040
0060
0080
0010
000
1200
014
000
Relative Time
Phy
loge
netic
Info
rmat
iven
ess
1st position2nd position3rd position
Peak 3rd codons
increasehomoplasy
Origin of Percom
orpha
Fig. 4. Visualizations of the phylogenetic informativeness profiles for each codonposition in the anchored hybrid enrichment dataset.
A. Dornburg et al. /Molecular Phylogenetics and Evolution 110 (2017) 27–38 33
support was low. Analyses conditioned on loci that were RY codedyielded strong support for an identical topology to that condi-tioned on all loci, albeit with stronger support (Fig. S2B). Togetherthese results support a clade comprised of Holocentridae, Ron-deletiidae, Cetomimidae, Berycidae, and Melamphaidae as the sis-ter lineage to Percomorpha.
Percent Guanine
Freq
uenc
y
500
0
Gua
nine
Percent Cytosine
Freq
uenc
y
600
040
Cyto
sine
quen
cy30
Cyt
osin
e
4. Discussion
4.1. Bias and phylogenomic inference
Convergence in nucleotide state is predicted to mislead infer-ence based on the stochastic interaction of time, internode length,and substitution rate underlying the resulting site patterns. Ourresults empirically validate these theoretical expectations(Townsend et al., 2012), and underscore the observation thathomoplasy is not always apparent and will not necessarily leadto topological discordance (Roje, 2010). Many results in our study,such as the phylogenetic resolution of Berycidae, were unaffectedby which data set was used in the analysis. However, as exempli-fied by our efforts to resolve the sister lineage to Percomorpha, pat-terns of convergence such as those generated by compositionalbias are highly problematic for topological inference for some taxa.
Phylogenomic studies have observed that portions of the gen-ome with a bias toward one or more of the four nucleotides, suchas the GC bias in the third codon position of mammals, can misleadphylogenetic inference (Foster and Hickey, 1999; Mooers andHolmes, 2000; Romiguier et al., 2013; Cox et al., 2014). Screeningour AHE dataset sampled from acanthopterygian teleosts revealedan elevated frequency of GC at the third codon position that rangedbetween 65% and 80% across all genes in a given species. The GCcontent in the first and second codon positions ranged between42% and 54% (Table 2). This result mirrors a high GC3 in the mark-
Fig. 5. Nucleotide frequencies of the codon partitions in one of the retained (blue)versus filtered (grey) data sets. Frequencies within each panel correspond to thefrequency within each partition of either adenine, thymine, guanine, cytosine, orguanine + cytosine. (For interpretation of the references to colour in this figurelegend, the reader is referred to the web version of this article.)
"
ers commonly used for fish phylogenetic studies (Table 3) over thepast decade (Dornburg et al., 2008, 2015; Alfaro et al., 2009; Nearet al., 2012b; Wainwright et al., 2012; Betancur-R et al., 2013a;
Percent G+C
Fre
1000
0Gua
nine
+
Outgroup
Percomorpha
BPP=1.00
Ovalentaria
Notothenioidei
Holocentridae
Melamphaidae
Rondeletiidae
Cetomimidae
Berycidae
Anoplogastridae
Trachichthyidae
Anomalopidae
Diretmidae
Monocentridae
BPP=0.98
unlabeled
***
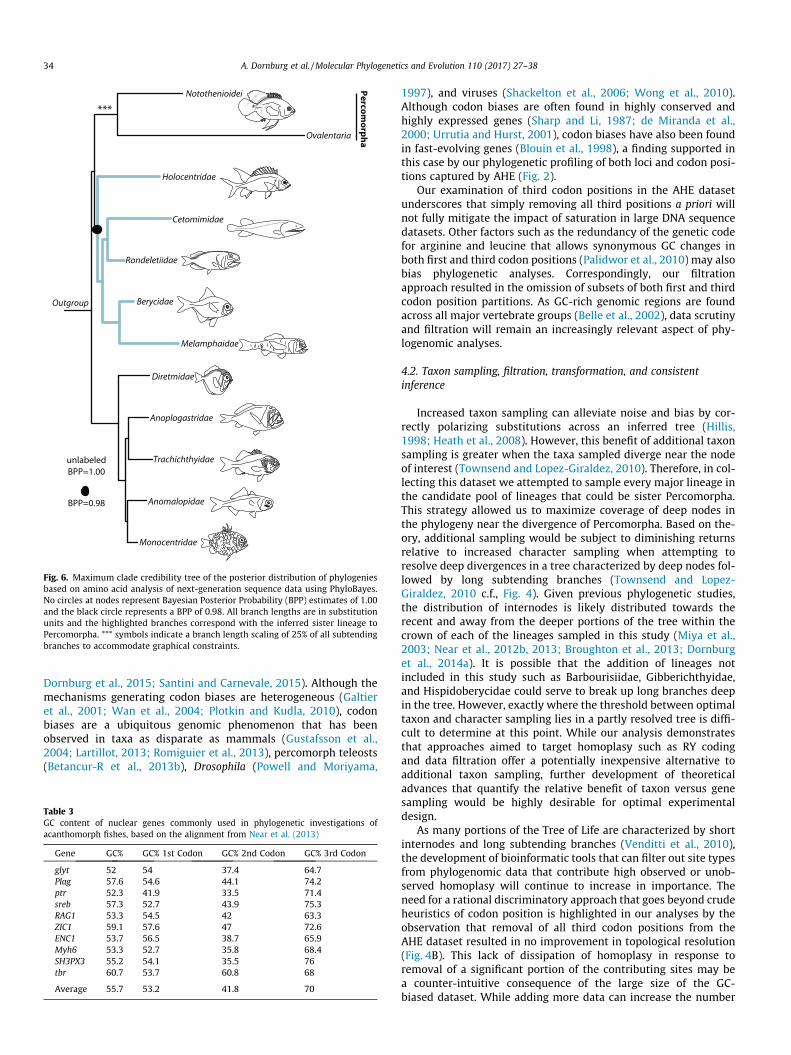
Fig. 6. Maximum clade credibility tree of the posterior distribution of phylogeniesbased on amino acid analysis of next-generation sequence data using PhyloBayes.No circles at nodes represent Bayesian Posterior Probability (BPP) estimates of 1.00and the black circle represents a BPP of 0.98. All branch lengths are in substitutionunits and the highlighted branches correspond with the inferred sister lineage toPercomorpha. *** symbols indicate a branch length scaling of 25% of all subtendingbranches to accommodate graphical constraints.
34 A. Dornburg et al. /Molecular Phylogenetics and Evolution 110 (2017) 27–38
Dornburg et al., 2015; Santini and Carnevale, 2015). Although themechanisms generating codon biases are heterogeneous (Galtieret al., 2001; Wan et al., 2004; Plotkin and Kudla, 2010), codonbiases are a ubiquitous genomic phenomenon that has beenobserved in taxa as disparate as mammals (Gustafsson et al.,2004; Lartillot, 2013; Romiguier et al., 2013), percomorph teleosts(Betancur-R et al., 2013b), Drosophila (Powell and Moriyama,
Table 3GC content of nuclear genes commonly used in phylogenetic investigations ofacanthomorph fishes, based on the alignment from Near et al. (2013)
Gene GC% GC% 1st Codon GC% 2nd Codon GC% 3rd Codon
glyt 52 54 37.4 64.7Plag 57.6 54.6 44.1 74.2ptr 52.3 41.9 33.5 71.4sreb 57.3 52.7 43.9 75.3RAG1 53.3 54.5 42 63.3ZIC1 59.1 57.6 47 72.6ENC1 53.7 56.5 38.7 65.9Myh6 53.3 52.7 35.8 68.4SH3PX3 55.2 54.1 35.5 76tbr 60.7 53.7 60.8 68
Average 55.7 53.2 41.8 70
1997), and viruses (Shackelton et al., 2006; Wong et al., 2010).Although codon biases are often found in highly conserved andhighly expressed genes (Sharp and Li, 1987; de Miranda et al.,2000; Urrutia and Hurst, 2001), codon biases have also been foundin fast-evolving genes (Blouin et al., 1998), a finding supported inthis case by our phylogenetic profiling of both loci and codon posi-tions captured by AHE (Fig. 2).
Our examination of third codon positions in the AHE datasetunderscores that simply removing all third positions a priori willnot fully mitigate the impact of saturation in large DNA sequencedatasets. Other factors such as the redundancy of the genetic codefor arginine and leucine that allows synonymous GC changes inboth first and third codon positions (Palidwor et al., 2010) may alsobias phylogenetic analyses. Correspondingly, our filtrationapproach resulted in the omission of subsets of both first and thirdcodon position partitions. As GC-rich genomic regions are foundacross all major vertebrate groups (Belle et al., 2002), data scrutinyand filtration will remain an increasingly relevant aspect of phy-logenomic analyses.
4.2. Taxon sampling, filtration, transformation, and consistentinference
Increased taxon sampling can alleviate noise and bias by cor-rectly polarizing substitutions across an inferred tree (Hillis,1998; Heath et al., 2008). However, this benefit of additional taxonsampling is greater when the taxa sampled diverge near the nodeof interest (Townsend and Lopez-Giraldez, 2010). Therefore, in col-lecting this dataset we attempted to sample every major lineage inthe candidate pool of lineages that could be sister Percomorpha.This strategy allowed us to maximize coverage of deep nodes inthe phylogeny near the divergence of Percomorpha. Based on the-ory, additional sampling would be subject to diminishing returnsrelative to increased character sampling when attempting toresolve deep divergences in a tree characterized by deep nodes fol-lowed by long subtending branches (Townsend and Lopez-Giraldez, 2010 c.f., Fig. 4). Given previous phylogenetic studies,the distribution of internodes is likely distributed towards therecent and away from the deeper portions of the tree within thecrown of each of the lineages sampled in this study (Miya et al.,2003; Near et al., 2012b, 2013; Broughton et al., 2013; Dornburget al., 2014a). It is possible that the addition of lineages notincluded in this study such as Barbourisiidae, Gibberichthyidae,and Hispidoberycidae could serve to break up long branches deepin the tree. However, exactly where the threshold between optimaltaxon and character sampling lies in a partly resolved tree is diffi-cult to determine at this point. While our analysis demonstratesthat approaches aimed to target homoplasy such as RY codingand data filtration offer a potentially inexpensive alternative toadditional taxon sampling, further development of theoreticaladvances that quantify the relative benefit of taxon versus genesampling would be highly desirable for optimal experimentaldesign.
As many portions of the Tree of Life are characterized by shortinternodes and long subtending branches (Venditti et al., 2010),the development of bioinformatic tools that can filter out site typesfrom phylogenomic data that contribute high observed or unob-served homoplasy will continue to increase in importance. Theneed for a rational discriminatory approach that goes beyond crudeheuristics of codon position is highlighted in our analyses by theobservation that removal of all third codon positions from theAHE dataset resulted in no improvement in topological resolution(Fig. 4B). This lack of dissipation of homoplasy in response toremoval of a significant portion of the contributing sites may bea counter-intuitive consequence of the large size of the GC-biased dataset. While adding more data can increase the number

A. Dornburg et al. /Molecular Phylogenetics and Evolution 110 (2017) 27–38 35
of sites contributing to an accurate topology, adding more data willalso increase the number of homoplasious sites (Philippe et al.,2011; Townsend et al., 2012; Lemmon and Lemmon, 2013). In con-trast to the arbitrary removal of all third codon positions, the tar-geted removal of specific codon positions at specific genes, whichwere identified as problematic, resulted in the well-supportedphylogenetic resolution of a clade containing Holocentridae, Ron-deletiidae, Cetomimidae, Berycidae, and Melamphaidae as sisterlineage of Percomorpha (Fig. 4C). An identical phylogenetic topol-ogy was observed in the analysis of the concatenated amino acidsequences (Fig. 4) and in a likelihood analysis that recoded thirdpositions into purines (R) and pyrimidines (Y; Fig. 4D). Both ofthese approaches are expected to mitigate the impact of composi-tional bias in phylogenomic inference, thereby lending support toresults obtained using our dataset filtration approach (Betancur-Ret al., 2013b; Cox et al., 2014; Li et al., 2014).
Reducing compositional heterogeneity through the use ofrecoding procedures such as RY coding (Phillips and Penny, 2003;Phillips et al., 2004) has successfully reconciled topological incon-gruence in lineages as diverse as flatfishes and early land plants(Betancur-R et al., 2013b; Li et al., 2014). This reconciliation isencouraging and corresponds with simulations that suggest thepotential of RY coding to greatly increase phylogenetic accuracyin the presence of compositional heterogeneity (Ishikawa et al.,2012). Nevertheless, RY coding may not be sufficient to suppressthe influence of homoplasy on phylogenetic inferences in moredivergent sequences or under conditions such as a bias in the ratioof transitions to transversions (Ishikawa et al., 2012). RY coding isalso unlikely to mitigate homoplasious sites arising from processesthat do not produce a compositional bias. In the case of our dataset,fast rates and compositional bias appear to be tightly linked; bothdataset filtration and RY coding remove the potential for charactersto mislead based on their evolution at a rate high enough that itleads to phylogenetic noise. Assuming the probability of resolutioncan be accurately quantified, dataset filtration could in principlemitigate the problem of homoplasy across a large range of datasets(Naylor and Brown, 1997), and is not limited to specific cases ofbase-pair heterogeneity. Filtration offers a tool that can be inte-grated with models of compositional heterogeneity to betterachieve accurate phylogenetic resolution and congruence betweencompeting hypotheses. An accurate filtration approach also pro-vides the means to integrate datasets from multiple genomicregions that may vary in signal and noise content such as on non-coding ultraconserved elements (UCEs) (Crawford et al., 2012a;Faircloth et al., 2012; McCormack et al., 2012) or RADSeq datasets.UCEs are generally more AT rich (Duret and Arndt, 2008;Romiguier et al., 2013); however, informativeness criteria for frag-ment lengths at different timescales for this type of phylogenomicdata has not been investigated. Comparing topological resultsbetween data filtration methods and data acquisition methods rep-resents an exciting and potentially fruitful avenue of research that,when combined with other approaches such as assessments ofmodel performance (Brown, 2014b, 2014a), will aid in our stabi-lization of a Genomic Tree of Life.
4.3. Sister to Percomorpha? A phylogenomic perspective
The staggering morphological diversity of percomorph teleostscombined with the scant fossil record of their early diverging lin-eages (Patterson, 1993), has complicated the identification of thesister lineage of Percomorpha. A range of phylogenetic hypothesesbased on analyses of morphology (Stiassny and Moore, 1992;Johnson and Patterson, 1993; Moore, 1993b, 1993a; Baldwin andJohnson, 1995) and molecular data (Miya et al., 2005; Betancur-Ret al., 2014; Near et al., 2013) have been proposed. Our resolutionof the sister lineage to Percomorpha is congruent with early
mitogenomic work (Miya et al., 2003; but see Miya et al., 2005)and is strongly supported both in the phylogenomic analyses ofthe DNA sequences filtered using PI based metrics, RY coding,and in the concatenated amino acid alignments(Figs. 3C & D and 5). It is important to note that our analyses donot span the entire spectrum of phylogenomic methods and thereare other factors that can drive topological incongruence (Brown,2014b, 2014a). However, our analyses highlight uncertainty inour understanding of phenotypic and ecological diversificationacross the fish lineages sampled. For example, Cetomimidae,Melamphaidae, and Rondeletiidae all inhabit deep-sea ecosystems(Paxton et al., 2001; Merrett and Moore, 2005; Bartow, 2011). Theresolution of Holocentridae as the sister lineage of a clade thatincludes these species and Berycidae suggests either independenttransitions to deep-sea habitats, or a shift to shallower (epipela-gic < 200 m) habitats in Holocentridae and some species of Beryci-dae. Transitions between deep-sea and marine habitats in thephotic zone are not unusual across the species in this study. Forexample, Berycidae are primarily slope and shelf dwelling fishesthat occupy a range of depths commonly spanning 50–700 m(Dürr and González, 2002), with juveniles often occurring in shal-low near-shore waters and even estuaries (Mundy, 1990; Smith,2000). Transitions between deep-sea and shallow marine habitatsare not limited to this clade, and shifts in depth ranges spanninghundreds, if not thousands of meters are observed across numer-ous lineages in this study. Increased taxon sampling in future stud-ies of the phylogenetics and timing of diversification in this part ofthe teleost Tree of Life offers an exciting perspective from which toinvestigate the temporal correlations between habitat usage andgeologic processes such as Cenozoic deep-sea anoxic events(Thomas, 2007), in generating and maintaining biodiversity indeep-sea fish communities.
5. Conclusion
Here we have shown that combining multiple approaches todataset scrutiny can mitigate the impact of homoplasy in a phy-logenomic dataset. We demonstrated that despite being conservedenough to identify across all gnathostomes, the loci captured byAHE exhibit high levels of nucleotide convergence characteristicof loci with a GC bias at the third codon position (GC3) at this tax-onomic scale. Accommodating this bias in the phylogenetic analy-ses of the AHE dataset results in a phylogeny where a cladecomprised of Holocentridae (squirrelfishes), Berycidae (alfonsinos),Melamphaidae (bigscale fishes), Cetomimidae (flabby whale-fishes), and Rondeletiidae (redmouth whalefishes) is resolved asthe sister lineage of Percomorpha. Our study highlights the difficul-ties in reconciling incongruent topologies between phylogenomicanalyses and published multi-locus datasets, and further suggeststhat GC3 is a feature of many phylogenetic ‘‘legacy markers.” Whilethe continual accumulation of sequence data on public databases,reduction in the cost of sequencing, and coordinated initiativesto resolve the phylogeny of major lineages have resulted in a21st century phylogenetic renaissance (Wheat and Wahlberg,2013; dos Reis et al., 2014; Graham Reynolds et al., 2014;Rochette et al., 2014), the promise of a fully assembled Tree of Lifeis an achievement that will require increasingly complex investiga-tions of nodes that continue to elude resolution.
Acknowledgements
This work was part of a symposium on the evolution of perco-morph fishes at the 9th Indo Pacific Fish Conference in Okinawa,Japan during June of 2013. We thank Masaki Miya for his organiza-tional help and motivation of this work and participants of the con-

36 A. Dornburg et al. /Molecular Phylogenetics and Evolution 110 (2017) 27–38
ference for their valuable feedback. Brian Park and Sarah Federmanprovided valuable assistance with analyses. Mark Westneat at theField Museum of Natural History, Andrew Bentley at the Universityof Kansas Natural History Collection, and Katherine Maslenikov atthe Burke Museum provided tissues for DNA sequencing. GregoryWatkins-Colwell provided assistance with specimen and tissuecollections of fishes at the Yale Peabody Museum of Natural His-tory. Steve Weston provided guidance on parallel processing in Rand with openMPI. Sandra Emme provided assistance with DNAsequencing. This work was supported in part by the facilities andstaff of the Yale University Faculty of Arts and Sciences High Per-formance Computing Center and by National Science Foundationawards to TJN (DEB-0716155 and ANT-0839007), EML (DEB1120516), EML and ARL (IIP 1313554), and to AD and TJN (DEB-1011328). All data and source code generated for this study areavailable on Zenodo (DOI: 105281/zenodo.321684); PhyInformRis hosted on CRAN and github: carolinafishes.github.io.
Appendix A. Supplementary material
Supplementary data associated with this article can be found, inthe online version, at http://dx.doi.org/10.1016/j.ympev.2017.02.017.
References
Alfaro, M.E., Santini, F., Brock, C., Alamillo, H., Dornburg, A., Rabosky, D.L., Carnevale,G., Harmon, L.J., 2009. Nine exceptional radiations plus high turnover explainspecies diversity in jawed vertebrates. Proc. Natl. Acad. Sci. USA 106, 13410–13414.
Archie, J.W., 1989. Homoplasy excess ratios: new indices for measuring levels ofhomoplasy in phylogenetic systematics and a critique of the consistency index.Syst. Biol. 38, 253–269.
Baldwin, C.C., Johnson, G.D., 1995. A larva of the Atlantic flashlight fish,Kryptophanaron alfredi (Beryciformes: Anomalopidae), with a comparison ofberyciform and stephanoberyciform larvae. Bull. Mar. Sci. 56, 1–24.
Bartow, K.A., 2011. Taxonomy and Ecology of the Deep-Pelagic Fish FamilyMelamphaidae, With Emphasis on Interactions With a Mid-Ocean RidgeSystem. Florida Atlantic University.
Belle, Elise M.S., Smith, Nick, Eyre-Walker, Adam, 2002. Analysis of the phylogeneticdistribution of isochores in vertebrates and a test of the thermal stabilityhypothesis. J. Mol. Evol. 55 (3), 356–363.
Betancur-R, R., Broughton, R.E., Wiley, E.O., Carpenter, K., López, J.A., Li, C., Holcroft,N.I., Arcila, D., Sanciangco, M., Cureton II., J.C., 2013a. The tree of life and a newclassification of bony fishes. PLoS Curr. 5.
Betancur-R, R., Li, C., Munroe, T.A., Ballesteros, J.A., Ortí, G., 2013b. Addressing genetree discordance and non-stationarity to resolve a multi-locus phylogeny of theflatfishes (Teleostei: Pleuronectiformes). Syst. Biol. 62, 763–785.
Betancur-R, R., Wiley, E.O., Miya, M., Lecointre, G., Bailly, N., Ortí, G., 2014. New andrevised classification of bony fishes. Version 2. <http://www.deepfin.org/Classification_v2.htm%3E>. Electronic version accessed 24 Jun 2014.
Blouin, M.S., Yowell, C.A., Courtney, C.H., Dame, J.B., 1998. Substitution bias, rapidsaturation, and the use of mtDNA for nematode systematics. Mol. Biol. Evol. 15,1719–1727.
Brenner, S., Elgar, G., Sanford, R., Macrae, A., Venkatesh, B., Aparicio, S., 1993.Characterization of the pufferfish (Fugu) genome as a compact model vertebrategenome. Nature 366, 265–268.
Broughton, R.E., Betancur-R, R., Li, C., Arratia, G., Ortí, G., 2013. Multi-locusphylogenetic analysis reveals the pattern and tempo of bony fish evolution.PLoS Curr. 5.
Brown, J.M., 2014a. Detection of implausible phylogenetic inferences usingposterior predictive assessment of model fit. Syst. Biol. 63, 334–348.
Brown, J.M., 2014b. Predictive approaches to assessing the fit of evolutionarymodels. Syst. Biol. 63, 289–292.
Carpenter, S., Kitchell, J., Hodgson, J., Cochran, P., Elser, J., Elser, M., Lodge, D.,Kretchmer, D., He, X., Von Ende, C., 1987. Regulation of lake primaryproductivity by food web structure. Ecology 68, 1863–1876.
Chanet, B., Guintard, C., Betti, E., Gallut, C., Dettaï, A., Lecointre, G., 2013. Evidencefor a close phylogenetic relationship between the teleost ordersTetraodontiformes and Lophiiformes based on an analysis of soft anatomy.Cybium 37, 179–198.
Colgan, D.J., Zhang, C.G., Paxton, J.R., 2000. Phylogenetic investigations of theStephanoberyciformes and Beryciformes, particularly whalefishes (Euteleostei:Cetomimidae), based on partial 12S rDNA and 16S rDNA sequences. Mol.Phylogenet. Evol. 17, 15–25.
Cox, C.J., Li, B., Foster, P.G., Embley, T.M., Civán, P., 2014. Conflicting phylogenies forearly land plants are caused by composition biases among synonymoussubstitutions. Syst. Biol. 63, 272–279.
Crawford, N.G., Faircloth, B.C., McCormack, J.E., Brumfield, R.T., Glenn, T.C., 2012a.More than 1000 ultraconserved elements provide evidence that turtles are thesister group of archosaurs. Biol. Lett. 8, 783–786.
Crawford, N.G., Faircloth, B.C., McCormack, J.E., Brumfield, R.T., Winker, K., Glenn, T.C., 2012b. More than 1000 ultraconserved elements provide evidence thatturtles are the sister group of archosaurs. Biol. Lett. 8, 783–786.
Crawford, N.G., Parham, J.F., Sellas, A.B., Faircloth, B.C., Glenn, T.C., Papenfuss, T.J.,Henderson, J.B., Hansen, M.H., Simison, W.B., 2015. A phylogenomic analysis ofturtles. Mol. Phylogenet. Evol. 83, 250–257.
Crawley, S.S., Hilu, K.W., 2012. Caryophyllales: evaluating phylogenetic signal intrnK intron versus matK. J. System. Evol. 50, 387–410.
Dávalos, L.M., Perkins, S.L., 2008. Saturation and base composition bias explainphylogenomic conflict in Plasmodium. Genomics 91, 433–442.
Davey, J.W., Hohenlohe, P.A., Etter, P.D., Boone, J.Q., Catchen, J.M., Blaxter, M.L.,2011. Genome-wide genetic marker discovery and genotyping using next-generation sequencing. Nat. Rev. Genet. 12, 499–510.
de Miranda, A.B., Alvarez-Valin, F., Jabbari, K., Degrave, W.M., Bernardi, G., 2000.Gene expression, amino acid conservation, and hydrophobicity are the mainfactors shaping codon preferences in Mycobacterium tuberculosis andMycobacterium leprae. J. Mol. Evol. 50, 45–55.
Delsuc, F., Brinkmann, H., Philippe, H., 2005. Phylogenomics and the reconstructionof the tree of life. Nat. Rev. Genet. 6, 361–375.
Dornburg, A., Friedman, M., Near, T.J., 2015. Phylogenetic analysis of molecular andmorphological data highlights uncertainty in the relationships of fossil andliving species of Elopomorpha (Actinopterygii: Teleostei). Mol. Phylogenet. Evol.89, 205–218.
Dornburg, A., Moore, J.A., Beaulieu, J.M., Eytan, R.I., Near, T.J., 2014a. The impact ofshifts in marine biodiversity hotspots on patterns of range evolution: evidencefrom the Holocentridae (squirrelfishes and soldierfishes). Evolution 69, 146–161.
Dornburg, A., Santini, F., Alfaro, M.E., 2008. The influence of model averaging onclade posteriors: an example using the triggerfishes (Family Balistidae). Syst.Biol. 57, 905–919.
Dornburg, A., Townsend, J.P., Friedman, M., Near, T.J., 2014b. Phylogeneticinformativeness reconciles ray-finned fish molecular divergence times. BMCEvol. Biol. 14, 169.
Dornburg, A., Fisk, J.N., Tamagnon, J., Townsend, J.P., 2016. PhyinformR:Phylogenetic experimantal design and Phylogenomic data exploration in R.BMC Evol. Biol. 16, 262.
dos Reis, M., Donoghue, P.C., Yang, Z., 2014. Neither phylogenomic norpalaeontological data support a Palaeogene origin of placental mammals. Biol.Lett. 10, 20131003.
Doyle, V.P., Young, R.E., Naylor, G.J., Brown, J.M., 2015. Can we identify genes withincreased phylogenetic reliability? Syst. Biol. 64, 824–837.
Drummond, A.J., Ashton, B., Buxton, S., Cheung, M., Cooper, A., Duran, C., Field, M.,Heled, J., Kearse, M., Markowitz, S., Moir, R., Stones-Havas, S., Sturrock, S.,Thierer, T., Wilson, A., 2010. Geneious v7.0.6. Available from: <http://www.geneious.com/>.
Duret, L., Arndt, P.F., 2008. The impact of recombination on nucleotide substitutionsin the human genome. PLoS Genet. 4, e1000071.
Dürr, J., González, J., 2002. Feeding habits of Beryx splendens and Beryx decadactylus(Berycidae) off the Canary Islands. Fish. Res. 54, 363–374.
Eschmeyer, W.N., Fricke, R. (Eds.), 2015. Catalog of Fishes electronic version (9 Sept2015), California Academy of Sciences, San Francisco. <http://research.calacademy.org/research/ichthyology/catalog/fishcatmain.asp>.
Eytan, R.I., Evans, B.R., Dornburg, A., Lemmon, A.R., Lemmon, E.M., Wainwright, P.C.,Near, T.J., 2015. Are 100 enough? Inferring acanthomorph teleost phylogenyusing Anchored Hybrid Enrichment. BMC Evol. Biol. 15, 113.
Faircloth, B.C., McCormack, J.E., Crawford, N.G., Harvey, M.G., Brumfield, R.T., Glenn,T.C., 2012. Ultraconserved elements anchor thousands of genetic markersspanning multiple evolutionary timescales. Syst. Biol. 61, 717–726.
Faircloth, B.C., Sorenson, L., Santini, F., Alfaro, M.E., 2013. A phylogenomicperspective on the radiation of ray-finned fishes based upon targetedsequencing of ultraconserved elements (UCEs). PLoS ONE 8, e65923.
Forey, P.L., 1973. A revision of the elopiform fishes, fossil and recent. Bull. Br. Mus.(Natural History) Geol. 10 (Supplement), 1–222.
Foster, P.G., Hickey, D.A., 1999. Compositional bias may affect both DNA-based andprotein-based phylogenetic reconstructions. J. Mol. Evol. 48, 284–290.
Galtier, N., Daubin, V., 2008. Dealing with incongruence in phylogenomic analyses.Philos. Trans. Roy. Soc. B: Biol. Sci. 363, 4023–4029.
Galtier, N., Piganeau, G., Mouchiroud, D., Duret, L., 2001. GC-content evolution inmammalian genomes: the biased gene conversion hypothesis. Genetics 159,907–911.
Gilbert, P.S., Chang, J., Pan, C., Sobel, E.M., Sinsheimer, J.S., Faircloth, B.C., Alfaro, M.E.,2015. Genome-wide ultraconserved elements exhibit higher phylogeneticinformativeness than traditional gene markers in percomorph fishes. Mol.Phylogenet. Evol. 92, 140–146.
Goodman, M., 1967. Deciphering primate phylogeny from macromolecularspecificities. Am. J. Phys. Anthropol. 26, 255–275.
Graham Reynolds, R., Niemiller, M.L., Revell, L.J., 2014. Toward a tree-of-life for theboas and pythons: multilocus species-level phylogeny with unprecedentedtaxon sampling. Mol. Phylogenet. Evol. 71, 201–213.
Gustafsson, C., Govindarajan, S., Minshull, J., 2004. Codon bias and heterologousprotein expression. Trends Biotechnol. 22, 346–353.
Heath, T.A., Hedtke, S.M., Hillis, D.M., 2008. Taxon sampling and the accuracy ofphylogenetic analyses. J. System. Evol. 46, 239–257.

A. Dornburg et al. /Molecular Phylogenetics and Evolution 110 (2017) 27–38 37
Hillis, D.M., 1998. Taxonomic sampling, phylogenetic accuracy, and investigatorbias. Syst. Biol. 47, 3–8.
Hilu, K.W., Black, C.M., Oza, D., 2014. Impact of gene molecular evolution onphylogenetic reconstruction: a case study in the rosids (Superorder Rosanae,Angiosperms). PLoS ONE 9, e99725.
Hundt, P.J., Iglésias, S.P., Hoey, A.S., Simons, A.M., 2014. A multilocus molecularphylogeny of combtooth blennies (Percomorpha: Blennioidei: Blenniidae):multiple invasions of intertidal habitats. Mol. Phylogenet. Evol. 70, 47–56.
Ishikawa, S.A., Inagaki, Y., Hashimoto, T., 2012. RY-coding and non-homogeneousmodels can ameliorate the maximum-likelihood inferences from nucleotidesequence data with parallel compositional heterogeneity. Evol. Bioinform.Online 8, 357.
Jarvis, E.D., Mirarab, S., Aberer, A.J., Li, B., Houde, P., Li, C., Ho, S.Y., Faircloth, B.C.,Nabholz, B., Howard, J.T., 2014. Whole-genome analyses resolve early branchesin the tree of life of modern birds. Science 346, 1320–1331.
Jeffroy, O., Brinkmann, H., Delsuc, F., Philippe, H., 2006. Phylogenomics: thebeginning of incongruence? Trends Genet. 22, 225–231.
Johnson, G.D., Patterson, C., 1993. Percomorph phylogeny: a survey ofacanthomorphs and a new proposal. Bull. Mar. Sci. 52, 554–626.
Killick, Rebecca, Eckley, Idris, 2014. Changepoint: an R package for changepointanalysis. J. Stat. Softw. 58 (3), 1–19.
Klopfstein, S., Kropf, C., Quicke, D.L., 2010. An evaluation of phylogeneticinformativeness profiles and the molecular phylogeny of Diplazontinae(Hymenoptera, Ichneumonidae). Syst. Biol. 59, 226–241.
La Mesa, M., Eastman, J.T., Vacchi, M., 2004. The role of notothenioid fish in the foodweb of the Ross Sea shelf waters: a review. Polar Biol. 27, 321–338.
Lartillot, N., 2013. Phylogenetic patterns of GC-biased gene conversion in placentalmammals and the evolutionary dynamics of recombination landscapes. Mol.Biol. Evol. 30, 489–502.
Lartillot, N., Philippe, H., 2004. A Bayesian mixture model for across-siteheterogeneities in the amino-acid replacement process. Mol. Biol. Evol. 21,1095–1109.
Lartillot, N., Rodrigue, N., Stubbs, D., Richer, J., 2013. PhyloBayes MPI: phylogeneticreconstruction with infinite mixtures of profiles in a parallel environment. Syst.Biol. 62, 611–615.
Lautredou, A.-C., Motomura, H., Gallut, C., Ozouf-Costaz, C., Cruaud, C., Lecointre, G.,Dettai, A., 2013. New nuclear markers and exploration of the relationshipsamong Serraniformes (Acanthomorpha, Teleostei): the importance of workingat multiple scales. Mol. Phylogenet. Evol. 67, 140–155.
Lemmon, A.R., Emme, S.A., Lemmon, E.M., 2012. Anchored hybrid enrichment formassively high-throughput phylogenomics. Syst. Biol. 61, 727–744.
Lemmon, E.M., Lemmon, A.R., 2013. High-throughput genomic data in systematicsand phylogenetics. Annu. Rev. Ecol. Evol. Syst. 44, 99–121.
Li, B., Lopes, J.S., Foster, P.G., Embley, T.M., Cox, C.J., 2014. Compositional biasesamong synonymous substitutions cause conflict between gene and proteintrees for plastid origins. Mol. Biol. Evol. 31, 1697–1709.
Lin, J., Chen, G., Gu, L., Shen, Y., Zheng, M., Zheng, W., Hu, X., Zhang, X., Qiu, Y., Liu, X.,2013. Phylogenetic affinity of tree shrews to Glires is attributed to fastevolution rate. Mol. Phylogenet. Evol. 71, 193–200.
Lopez-Giraldez, F., Townsend, J.P., 2011. PhyDesign: an online application forprofiling phylogenetic informativeness. BMC Evol. Biol. 11.
Mardis, E.R., 2008. The impact of next-generation sequencing technology ongenetics. Trends Genet. 24, 133–141.
McCormack, J.E., Faircloth, B.C., Crawford, N.G., Gowaty, P.A., Brumfield, R.T., Glenn,T.C., 2012. Ultraconserved elements are novel phylogenomic markers thatresolve placental mammal phylogeny when combined with species-treeanalysis. Genome Res. 22, 746–754.
Merrett, N., Moore, J., 2005. A new genus and species of deep demersal fish(Teleostei: Stephanoberycidae) from the tropical eastern North Atlantic. J. FishBiol. 67, 1699–1710.
Meyer, M., Kircher, M., 2010. Illumina sequencing library preparation for highlymultiplexed target capture and sequencing. Cold Spring Harb. Protoc 2010 (6),pdb-prot5448.
Mirarab, S., Reaz, R., Bayzid, M.S., Zimmermann, T., Swenson, M.S., Warnow, T.,2014. ASTRAL: genome-scale coalescent-based species tree estimation.Bioinformatics 30, i541–i548.
Miya, M., Satoh, T.R., Nishida, M., 2005. The phylogenetic position of toadfishes(order Batrachoidiformes) in the higher ray-finned fish as inferred frompartitioned Bayesian analysis of 102 whole mitochondrial genome sequences.Biol. J. Linn. Soc. 85, 289–306.
Miya, M., Takahashi, M., Endo, H., Ishiguro, N.B., Inoue, J.G., Mukai, T., Satoh, T.P.,Yamaguchi, M., Kawaguchi, A., Mabuchi, K., Shirai, S.M., Nishida, M., 2003. Majorpatterns of higher teleostean phylogenies: a new perspective based on 100complete mitochondrial DNA sequences. Mol. Phylogenet. Evol. 26, 121–138.
Mooers, A.O., Holmes, E.C., 2000. The evolution of base composition andphylogenetic inference. Trends Ecol. Evol. 15, 365–369.
Moore, J.A., 1993a. The Phylogeny and Evolution of the Trachichthyiformes(Teleostei: Percomorpha), with Comments on the intrarelationships of theAcanthomorpha Ph.D. Dissertation. Yale University, New Haven, CT.
Moore, J.A., 1993b. Phylogeny of the Trachichthyiformes (Teleostei: Percomorpha).Bull. Mar. Sci. 52, 114–136.
Morgan, C.C., Foster, P.G., Webb, A.E., Pisani, D., McInerney, J.O., O’Connell, M.J.,2013. Heterogeneous models place the root of the placental mammalphylogeny. Mol. Biol. Evol. 30, 2145–2156.
Mundy, B.C., 1990. Development of larvae and juveniles of the alfonsins, Beryxsplendens and B. decadactylus (Berycidae, Beryciformes). Bull. Mar. Sci. 46,257–273.
Naylor, G.J.P., Brown, W.M., 1997. Structural biology and phylogenetic estimation.Nature 388, 527–528.
Near, T.J., Dornburg, A., Eytan, R.I., Keck, B.P., Smith, W.L., Kuhn, K.L., Moore, J.A.,Price, S.A., Burbrink, F.T., Friedman, M., Wainwright, P.C., 2013. Phylogeny andtempo of diversification in the superradiation of spiny-rayed fishes. Proc. Natl.Acad. Sci. 110, 12738–12743.
Near, T.J., Dornburg, A., Harrington, R.C., Oliveira, C., Pietsch, T.W., Thacker, C.E.,Satoh, T.P., Katayama, E., Wainwright, P.C., Eastman, J.T., 2015. Identification ofthe notothenioid sister lineage illuminates the biogeographic history of anAntarctic adaptive radiation. BMC Evol. Biol. 15, 109.
Near, T.J., Dornburg, A., Kuhn, K.L., Eastman, J.T., Pennington, J.N., Patarnello, T.,Zane, L., Fernandez, D.A., Jones, C.D., 2012a. Ancient climate change, antifreeze,and the evolutionary diversification of Antarctic fishes. Proc. Natl. Acad. Sci. USA109, 3434–3439.
Near, T.J., Eytan, R.I., Dornburg, A., Kuhn, K.L., Moore, J.A., Davis, M.P., Wainwright, P.C., Friedman, M., Smith, W.L., 2012b. Resolution of ray-finned fish phylogenyand timing of diversification. Proc. Natl. Acad. Sci. USA 109, 13698–13703.
Nelson, J.S., Grande, T.C., Wilson, M.V.H., 2016. Fishes of the World. John Wiley,Hoboken.
Palidwor, G.A., Perkins, T.J., Xia, X., 2010. A general model of codon bias due to GCmutational bias. PLoS ONE 5, e13431.
Parker, J., Tsagkogeorga, G., Cotton, J.A., Liu, Y., Provero, P., Stupka, E., Rossiter, S.J.,2013. Genome-wide signatures of convergent evolution in echolocatingmammals. Nature 502, 228–231.
Patterson, C., 1993. An overview of the early fossil record of acanthomorphs. Bull.Mar. Sci. 52, 29–59.
Paxton, J.R., Johnson, G.D., Trnski, T., 2001. Larvae and Juveniles of the Deepsea‘‘whalefishes”, Barbourisia and Rondeletia (Pisces: Beryciformes), withComments on Relationships. Rec. Aust. Mus. 53, 407–425.
Philippe, H., Brinkmann, H., Lavrov, D.V., Littlewood, D.T.J., Manuel, M., Worheide,G., Baurain, D., 2011. Resolving difficult phylogenetic questions: why moresequences are not enough. PLoS Biol. 9.
Phillips, M.J., Delsuc, F., Penny, D., 2004. Genome-scale phylogeny and the detectionof systematic biases. Mol. Biol. Evol. 21, 1455–1458.
Phillips, M.J., Penny, D., 2003. The root of the mammalian tree inferred from wholemitochondrial genomes. Mol. Phylogenet. Evol. 28, 171–185.
Pisani, D., 2004. Identifying and removing fast-evolving sites using compatibilityanalysis: an example from the Arthropoda. Syst. Biol. 53, 978–989.
Plotkin, J.B., Kudla, G., 2010. Synonymous but not the same: the causes andconsequences of codon bias. Nat. Rev. Genet. 12, 32–42.
Pond, S.L.K., Muse, S.V., 2005. HyPhy: Hypothesis Testing Using Phylogenies.Statistical Methods in Molecular Evolution. Springer, pp. 125–181.
Powell, J.R., Moriyama, E.N., 1997. Evolution of codon usage bias in Drosophila. Proc.Natl. Acad. Sci. 94, 7784–7790.
Prum, R.O., Berv, J.S., Dornburg, A., Field, D.J., Townsend, J.P., Moriarty Lemmon, E.,Lemmon, A.R., 2015. A comprehensive phylogeny of birds (Aves) using targetednext generation DNA sequencing. Nature 526, 569–573.
Rhyne, A.L., Tlusty, M.F., Schofield, P.J., Kaufman, L., Morris Jr, J.A., Bruckner, A.W.,2012. Revealing the appetite of the marine aquarium fish trade: the volume andbiodiversity of fish imported into the United States. PLoS ONE 7, e35808.
Rochette, N.C., Brochier-Armanet, C., Gouy, M., 2014. Phylogenomic test of thehypotheses for the evolutionary origin of eukaryotes. Mol. Biol. Evol., mst272
Roje, D.M., 2010. Incorporating molecular phylogenetics with larval morphologywhile mitigating the effects of substitution saturation on phylogeny estimation:a new hypothesis of relationships for the flatfish family Pleuronectidae(Percomorpha: Pleuronectiformes). Mol. Phylogenet. Evol. 56, 586–600.
Rokas, A., Chatzimanolis, S., 2008. From Gene-Scale to Genome-Scale Phylogenetics:The Data Flood in, but the Challenges Remain. Phylogenomics. Springer, pp. 1–12.
Romiguier, J., Ranwez, V., Delsuc, F., Galtier, N., Douzery, E.J., 2013. Less is more inmammalian phylogenomics: AT-rich genes minimize tree conflicts and unravelthe root of placental mammals. Mol. Biol. Evol. 30, 2134–2144.
Rosenberg, A.A., Bolster, W.J., Alexander, K.E., Leavenworth, W.B., Cooper, A.B.,McKenzie, M.G., 2005. The history of ocean resources: modeling cod biomassusing historical records. Front. Ecol. Environ. 3, 78–84.
Rota-Stabelli, O., Lartillot, N., Philippe, H., Pisani, D., 2013. Serine codon-usage biasin deep phylogenomics: pancrustacean relationships as a case study. Syst. Biol.62, 121–133.
Rutschmann, S., Matschiner, M., Damerau, M., Muschick, M., Lehmann, M.F., Hanel,R., Salzburger, W., 2011. Parallel ecological diversification in Antarcticnotothenioid fishes as evidence for adaptive radiation. Mol. Ecol. 20, 4707–4721.
Salichos, L., Rokas, A., 2013. Inferring ancient divergences requires genes withstrong phylogenetic signals. Nature 497, 327–331.
Sanciangco, M.D., Carpenter, K.E., Betancur-R, R., 2015. Phylogenetic placement ofenigmatic percomorph families (Teleostei: Percomorphaceae). Mol. Phylogenet.Evol. 94, 565–576.
Santini, F., Carnevale, G., 2015. First multilocus and densely sampled timetree oftrevallies, pompanos and allies (Carangoidei, Percomorpha) suggests aCretaceous origin and Eocene radiation of a major clade of piscivores. Mol.Phylogenet. Evol. 83, 33–39.

38 A. Dornburg et al. /Molecular Phylogenetics and Evolution 110 (2017) 27–38
Santini, F., Harmon, L.J., Carnevale, G., Alfaro, M.E., 2009. Did genome duplicationdrive the origin of teleosts? A comparative study of diversification in ray-finnedfishes. BMC Evol. Biol. 9, 164.
Santini, F., Sorenson, L., Marcroft, T., Dornburg, A., Alfaro, M.E., 2013. A multilocusmolecular phylogeny of boxfishes (Aracanidae, Ostraciidae; Tetraodontiformes).Mol. Phylogenet. Evol. 66, 153–160.
Schuster, S.C., 2007. Next-generation sequencing transforms today’s biology. Nature200.
Seehausen, O., 2006. African cichlid fish: a model system in adaptive radiationresearch. Proc. Roy. Soc. B: Biol. Sci. 273, 1987–1998.
Seo, T.-K., 2008. Calculating bootstrap probabilities of phylogeny using multilocussequence data. Mol. Biol. Evol. 25, 960–971.
Sethi, S.A., Branch, T.A., Watson, R., 2010. Global fishery development patterns aredriven by profit but not trophic level. Proc. Natl. Acad. Sci. 107, 12163–12167.
Shackelton, L.A., Parrish, C.R., Holmes, E.C., 2006. Evolutionary basis of codon usageand nucleotide composition bias in vertebrate DNA viruses. J. Mol. Evol. 62,551–563.
Shapiro, M.D., Marks, M.E., Peichel, C.L., Blackman, B.K., Nereng, K.S., Jónsson, B.,Schluter, D., Kingsley, D.M., 2004. Genetic and developmental basis ofevolutionary pelvic reduction in threespine sticklebacks. Nature 428, 717–723.
Sharp, P., Li, W.-H., 1987. The rate of synonymous substitution in enterobacterialgenes is inversely related to codon usage bias. Mol. Biol. Evol. 4, 222–230.
Smith, K.A., 2000. Active and passive dispersal of Centroberyx affinis (Berycidae)and Gonorynchus greyi (Gonorynchidae) larvae on the Sydney shelf. Mar.Freshw. Res. 51, 229–234.
Smith, W.L., Wheeler, W.C., 2006. Venom evolution widespread in fishes: aphylogenetic road map for the bioprospecting of piscine venoms. J. Hered. 97,206–217.
Stamatakis, A., 2006. RAxML-VI-HPC: maximum likelihood-based phylogeneticanalyses with thousands of taxa and mixed models. Bioinformatics 22 (21),2688–2690.
Stiassny, M.L.J., Moore, J.A., 1992. A review of the pelvic girdle of acanthomorphfishes, with comments on hypotheses of acanthomorph intrarelationships. Zool.J. Linn. Soc. 104, 209–242.
Su, Z., Wang, Z., Lopez-Giraldez, F., Townsend, J.P., 2014. The impact ofincorporating molecular evolutionary model into predictions of phylogeneticsignal and noise. Phylogenet. Phylogenom. System. 2, 11.
Thacker, C.E., Satoh, T.P., Katayama, E., Harrington, R.C., Eytan, R.I., Near, T.J., 2015.Molecular phylogeny of percomorpha resolves trichonotus as the sister lineageto gobioidei (Teleostei: Gobiiformes) and confirms the polyphyly ofTrachinoidei. Mol. Phylogenet. Evol. 93, 172–179.
Thomas, E., 2007. Cenozoic mass extinctions in the deep sea: what perturbs thelargest habitat on Earth? Geol. Soc. Am. 424, 1.
Townsend, J.P., 2007. Profiling phylogenetic informativeness. Syst. Biol. 56, 222–231.
Townsend, J.P., Leuenberger, C., 2011. Taxon sampling and the optimal rates ofevolution for phylogenetic inference. Syst. Biol. 60, 358–365.
Townsend, J.P., Lopez-Giraldez, F., 2010. Optimal selection of gene and ingrouptaxon sampling for resolving phylogenetic relationships. Syst. Biol. 59, 446–457.
Townsend, J.P., Su, Z., Tekle, Y.I., 2012. Phylogenetic signal and noise: predicting thepower of a data set to resolve phylogeny. Syst. Biol. 61, 835–849.
Urrutia, A.O., Hurst, L.D., 2001. Codon usage bias covaries with expression breadthand the rate of synonymous evolution in humans, but this is not evidence forselection. Genetics 159, 1191–1199.
Venditti, C., Meade, A., Pagel, M., 2010. Phylogenies reveal new interpretation ofspeciation and the Red Queen. Nature 463, 349–352.
Wainwright, P.C., Smith, W.L., Price, S.A., Tang, K.L., Sparks, J.S., Ferry, L.A., Kuhn, K.L., Eytan, R.I., Near, T.J., 2012. The evolution of pharyngognathy: a phylogeneticand functional appraisal of the pharyngeal jaw key innovation in Labroidei andbeyond. Syst. Biol. 61, 1001–1027.
Wan, X.-F., Xu, D., Kleinhofs, A., Zhou, J., 2004. Quantitative relationship betweensynonymous codon usage bias and GC composition across unicellular genomes.BMC Evol. Biol. 4, 19.
Wheat, C.W., Wahlberg, N., 2013. Phylogenomic insights into the Cambrianexplosion, the colonization of land and the evolution of flight in Arthropoda.Syst. Biol. 62, 93–109.
Winemiller, K.O., 1990. Spatial and temporal variation in tropical fish trophicnetworks. Ecol. Monogr. 60, 331–367.
Wong, E.H.M., Smith, D.K., Rabadan, R., Peiris, M., Poon, L.L.M., 2010. Codon usagebias and the evolution of influenza A viruses. Codon usage biases of influenzavirus. BMC Evol. Biol. 10, 253.