new jersey competitiveness - harvard business school files/newjerseycompetitiveness... · new...
TRANSCRIPT

1April 2010 – NJ Governor Christie Copyright © 2010 Professor Michael E. Porter
New Jersey CompetitivenessState and Cluster Performance
Professor Michael E. PorterHarvard Business School
Prepared for Governor Chris ChristieApril 17, 2010
None of this information may be duplicated, disseminated or copied without express written consent from the Institute for Strategy and Competitiveness.Additional information may be found at the website of the Institute for Strategy and Competitiveness, www.isc.hbs.eduData drawn from Michael E. Porter, Cluster Mapping Project, Institute for Strategy and Competitiveness, Harvard Business School; Richard Bryden, Project Director. data.isc.hbs.edu/isc/
2April 2010 – NJ Governor Christie Copyright © 2010 Professor Michael E. Porter
State Comparisons
3April 2010 – NJ Governor Christie Copyright © 2010 Professor Michael E. Porter
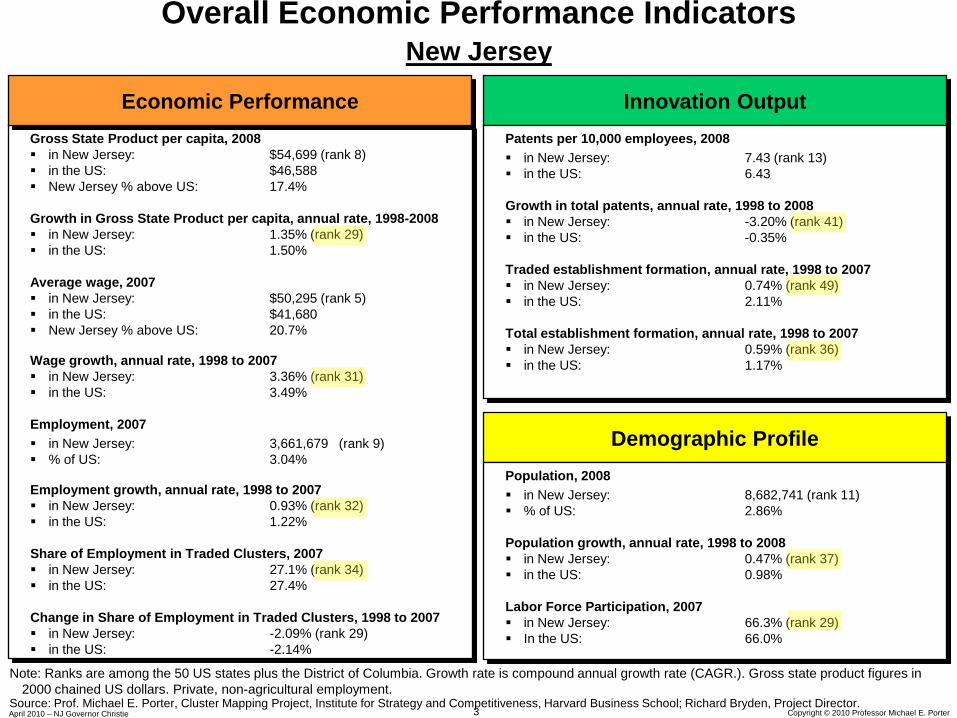
Overall Economic Performance IndicatorsNew Jersey
Gross State Product per capita, 2008 in New Jersey: $54,699 (rank 8) in the US: $46,588 New Jersey % above US: 17.4%
Growth in Gross State Product per capita, annual rate, 1998-2008 in New Jersey: 1.35% (rank 29) in the US: 1.50%
Average wage, 2007 in New Jersey: $50,295 (rank 5) in the US: $41,680 New Jersey % above US: 20.7%
Wage growth, annual rate, 1998 to 2007 in New Jersey: 3.36% (rank 31) in the US: 3.49%
Employment, 2007 in New Jersey: 3,661,679 (rank 9) % of US: 3.04%
Employment growth, annual rate, 1998 to 2007 in New Jersey: 0.93% (rank 32) in the US: 1.22%
Share of Employment in Traded Clusters, 2007 in New Jersey: 27.1% (rank 34) in the US: 27.4%
Change in Share of Employment in Traded Clusters, 1998 to 2007 in New Jersey: -2.09% (rank 29) in the US: -2.14%
Economic Performance
Source: Prof. Michael E. Porter, Cluster Mapping Project, Institute for Strategy and Competitiveness, Harvard Business School; Richard Bryden, Project Director.
Note: Ranks are among the 50 US states plus the District of Columbia. Growth rate is compound annual growth rate (CAGR.). Gross state product figures in 2000 chained US dollars. Private, non-agricultural employment.
Innovation OutputPatents per 10,000 employees, 2008 in New Jersey: 7.43 (rank 13) in the US: 6.43
Growth in total patents, annual rate, 1998 to 2008 in New Jersey: -3.20% (rank 41) in the US: -0.35%
Traded establishment formation, annual rate, 1998 to 2007 in New Jersey: 0.74% (rank 49) in the US: 2.11%
Total establishment formation, annual rate, 1998 to 2007 in New Jersey: 0.59% (rank 36) in the US: 1.17%
Demographic ProfilePopulation, 2008 in New Jersey: 8,682,741 (rank 11) % of US: 2.86%
Population growth, annual rate, 1998 to 2008 in New Jersey: 0.47% (rank 37) in the US: 0.98%
Labor Force Participation, 2007 in New Jersey: 66.3% (rank 29) In the US: 66.0%
4April 2010 – NJ Governor Christie Copyright © 2010 Professor Michael E. Porter
$20,000
$25,000
$30,000
$35,000
$40,000
$45,000
$50,000
$55,000
$60,000
-2.5% -1.5% -0.5% 0.5% 1.5% 2.5% 3.5%
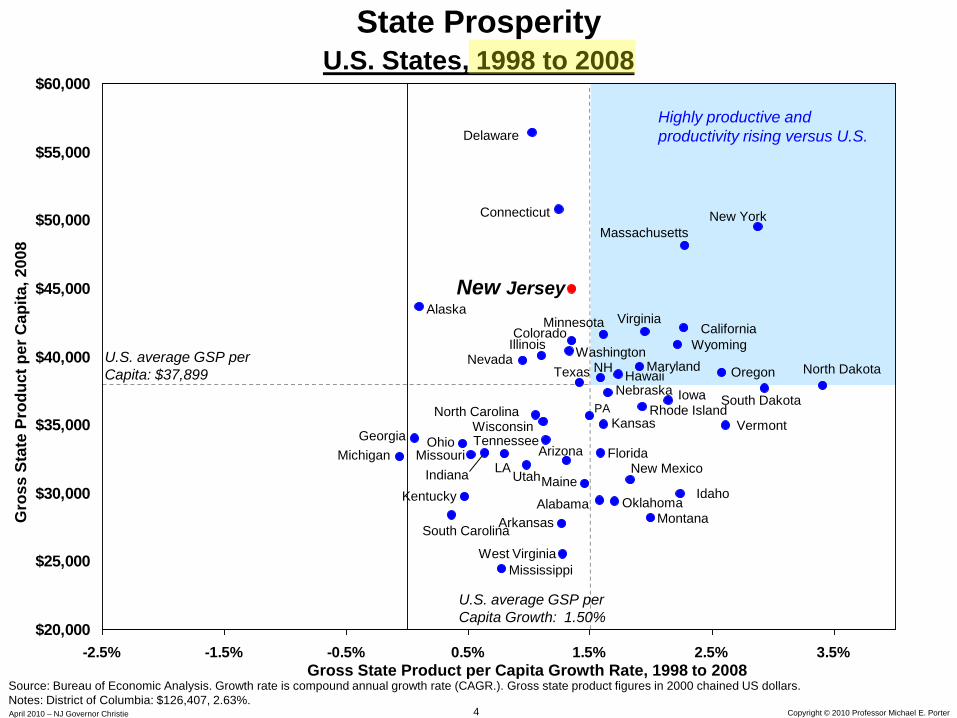
State ProsperityU.S. States, 1998 to 2008
Source: Bureau of Economic Analysis. Growth rate is compound annual growth rate (CAGR.). Gross state product figures in 2000 chained US dollars.Notes: District of Columbia: $126,407, 2.63%.
U.S. average GSP per Capita Growth: 1.50%
U.S. average GSP per Capita: $37,899
Gross State Product per Capita Growth Rate, 1998 to 2008
Gro
ss S
tate
Pro
duct
per
Cap
ita, 2
008
Highly productive and productivity rising versus U.S.Delaware
ConnecticutMassachusetts
New York
California
Oregon
South Dakota
North Dakota
VermontRhode Island
Iowa
Idaho
Montana
New Mexico
Alabama OklahomaMaine
Arkansas
West VirginiaMississippi
South Carolina
Michigan Missouri
KentuckyIndiana
OhioGeorgia
AlaskaNew Jersey
Nevada
MinnesotaIllinoisColorado
Washington
HawaiiMaryland
Wyoming
Virginia
Nebraska
FloridaArizona
Texas NH
North CarolinaWisconsinTennessee
Utah
PAKansas
LA
5April 2010 – NJ Governor Christie Copyright © 2010 Professor Michael E. Porter
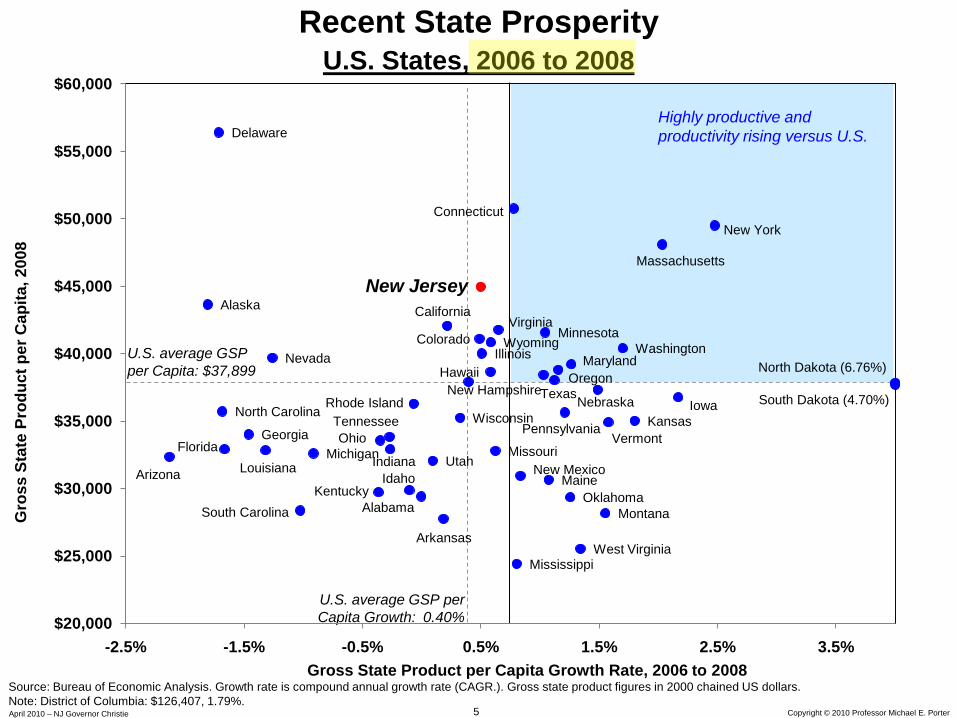
Recent State ProsperityU.S. States, 2006 to 2008
Source: Bureau of Economic Analysis. Growth rate is compound annual growth rate (CAGR.). Gross state product figures in 2000 chained US dollars.Note: District of Columbia: $126,407, 1.79%.
U.S. average GSP per Capita Growth: 0.40%
Gross State Product per Capita Growth Rate, 2006 to 2008
Gro
ss S
tate
Pro
duct
per
Cap
ita, 2
008
Highly productive and productivity rising versus U.S.
Alabama
Alaska
Arizona
Arkansas
California
Colorado
Connecticut
Delaware
FloridaGeorgia
Hawaii
Idaho
Illinois
Indiana
IowaKansas
Kentucky
LouisianaMaine
Maryland
Massachusetts
Michigan
Minnesota
Mississippi
Missouri
Montana
Nebraska
Nevada
New Hampshire
New Jersey
New Mexico
New York
North Carolina
North Dakota (6.76%)
Ohio
Oklahoma
Oregon
Pennsylvania
Rhode Island
South Carolina
South Dakota (4.70%)Tennessee
Texas
Utah
Vermont
Virginia
Washington
West Virginia
Wisconsin
Wyoming
$20,000
$25,000
$30,000
$35,000
$40,000
$45,000
$50,000
$55,000
$60,000
-2.5% -1.5% -0.5% 0.5% 1.5% 2.5% 3.5%
U.S. average GSP per Capita: $37,899
6April 2010 – NJ Governor Christie Copyright © 2010 Professor Michael E. Porter
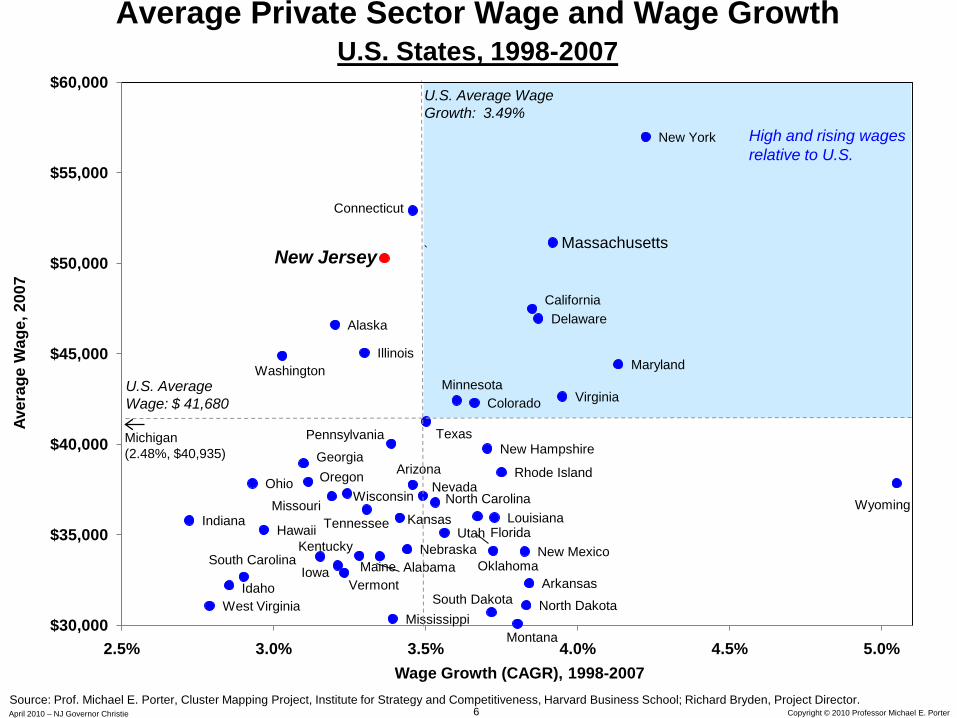
`
Alabama
Alaska
Arizona
Arkansas
California
Colorado
Connecticut
Delaware
Florida
Georgia
Hawaii
Idaho
Illinois
Indiana
Iowa
Kansas
Kentucky
Louisiana
Maine
MarylandMinnesota
Mississippi
Missouri
Montana
Nebraska
Nevada
New Hampshire
New Jersey
New Mexico
New York
North Carolina
North Dakota
Ohio
Oklahoma
Oregon
Pennsylvania
Rhode Island
South Carolina
South Dakota
Tennessee
Texas
Utah
Vermont
Virginia
Washington
West Virginia
Wisconsin Wyoming
$30,000
$35,000
$40,000
$45,000
$50,000
$55,000
$60,000
2.5% 3.0% 3.5% 4.0% 4.5% 5.0%
Average Private Sector Wage and Wage Growth U.S. States, 1998-2007
U.S. Average Wage Growth: 3.49%
U.S. Average Wage: $ 41,680
Wage Growth (CAGR), 1998-2007
Aver
age
Wag
e, 2
007
High and rising wages relative to U.S.
Source: Prof. Michael E. Porter, Cluster Mapping Project, Institute for Strategy and Competitiveness, Harvard Business School; Richard Bryden, Project Director.
Massachusetts
Michigan(2.48%, $40,935)
7April 2010 – NJ Governor Christie Copyright © 2010 Professor Michael E. Porter
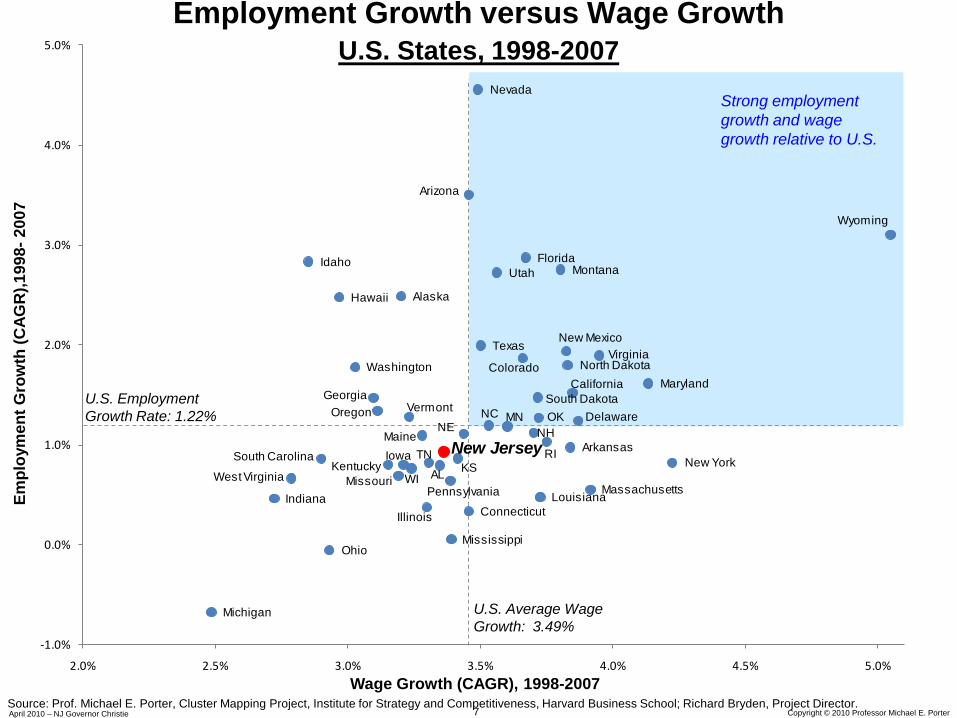
Employment Growth versus Wage GrowthU.S. States, 1998-2007
U.S. Average Wage Growth: 3.49%
U.S. Employment Growth Rate: 1.22%
Wage Growth (CAGR), 1998-2007
Empl
oym
ent G
row
th (C
AGR
),199
8-20
07
Strong employment growth and wage growth relative to U.S.
Source: Prof. Michael E. Porter, Cluster Mapping Project, Institute for Strategy and Competitiveness, Harvard Business School; Richard Bryden, Project Director.
AL
Alaska
Arizona
Arkansas
CaliforniaColorado
Connecticut
Delaware
Florida
Georgia
Hawaii
Idaho
IllinoisIndiana
IowaKSKentucky
Louisiana
Maine
Maryland
Massachusetts
Michigan
MN
Mississippi
Missouri
Montana
NE
Nevada
NHNew Jersey
New Mexico
New York
NC
North Dakota
Ohio
OKOregon
Pennsylvania
RISouth Carolina
South Dakota
TN
Texas
Utah
Vermont
VirginiaWashington
West Virginia WI
Wyoming
-1.0%
0.0%
1.0%
2.0%
3.0%
4.0%
5.0%
2.0% 2.5% 3.0% 3.5% 4.0% 4.5% 5.0%
8April 2010 – NJ Governor Christie Copyright © 2010 Professor Michael E. Porter
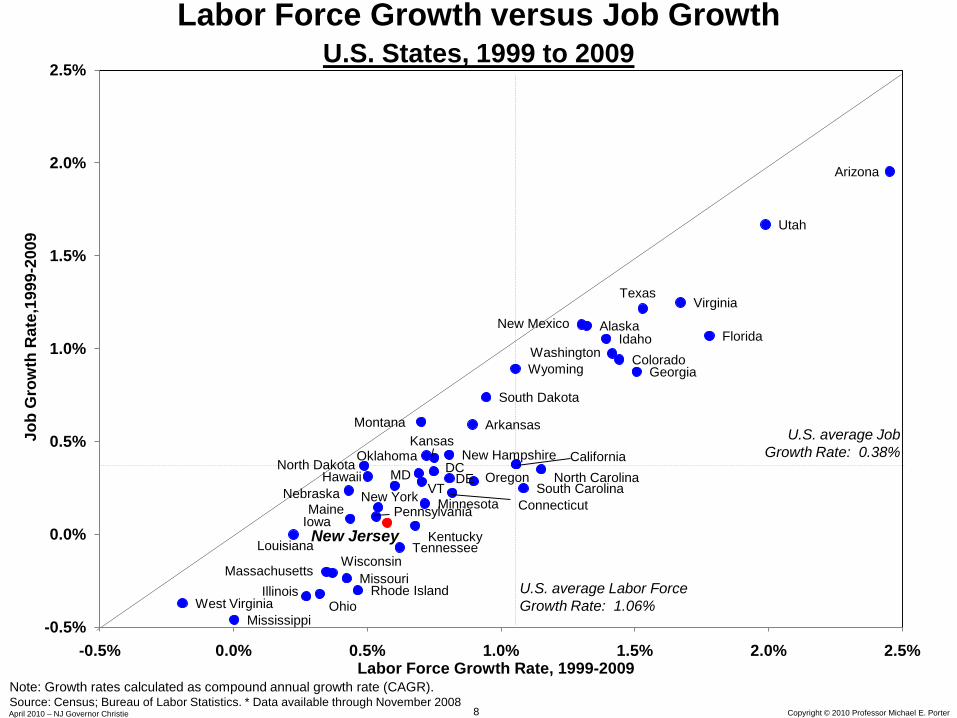
Labor Force Growth versus Job GrowthU.S. States, 1999 to 2009
Note: Growth rates calculated as compound annual growth rate (CAGR).Source: Census; Bureau of Labor Statistics. * Data available through November 2008
Labor Force Growth Rate, 1999-2009
Job
Gro
wth
Rat
e,19
99-2
009
U.S. average Labor Force Growth Rate: 1.06%
U.S. average Job Growth Rate: 0.38%
Alaska
Arizona
Arkansas
California
Colorado
Connecticut
DEDC
Florida
Georgia
Hawaii
Idaho
Illinois
Iowa
Kansas
KentuckyLouisiana
Maine
MD
Massachusetts
Minnesota
Mississippi
Missouri
Montana
Nebraska
New Hampshire
New Jersey
New Mexico
New YorkNorth Carolina
North Dakota
Ohio
OklahomaOregon
Pennsylvania
Rhode Island
South Carolina
South Dakota
Tennessee
Texas
Utah
VT
Virginia
Washington
West Virginia
Wisconsin
Wyoming
-0.5%
0.0%
0.5%
1.0%
1.5%
2.0%
2.5%
-0.5% 0.0% 0.5% 1.0% 1.5% 2.0% 2.5%
9April 2010 – NJ Governor Christie Copyright © 2010 Professor Michael E. Porter
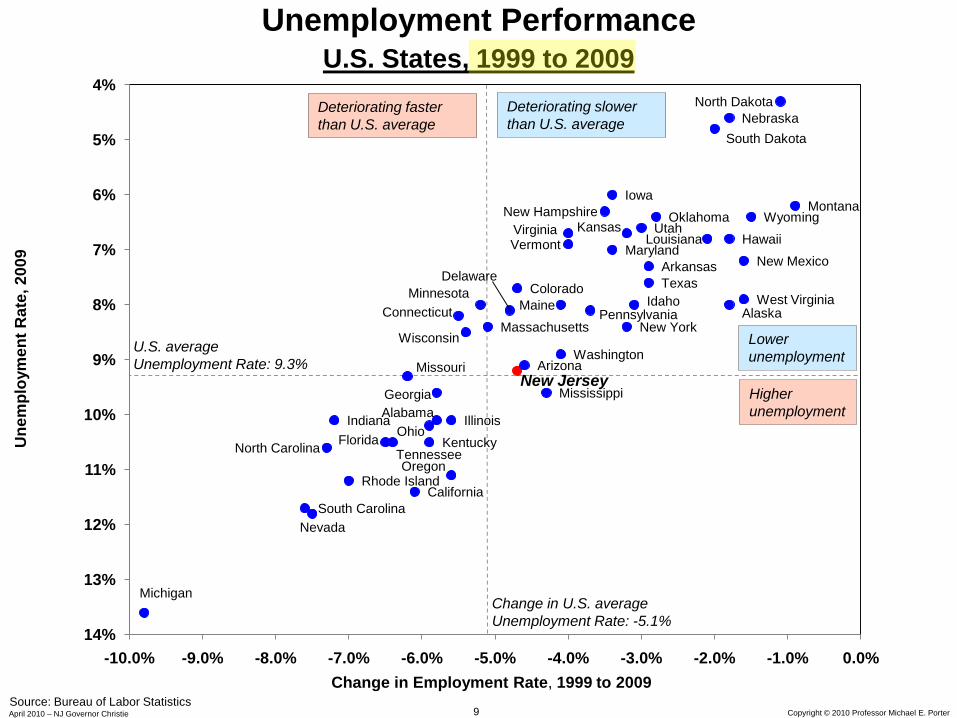
Unemployment Performance U.S. States, 1999 to 2009
Change in U.S. average Unemployment Rate: -5.1%
U.S. average Unemployment Rate: 9.3%
Change in Employment Rate, 1999 to 2009
Une
mpl
oym
ent R
ate,
200
9
Source: Bureau of Labor Statistics
Alabama
Alaska
Arizona
Arkansas
California
Colorado
Connecticut
Delaware
Florida
Georgia
Hawaii
Idaho
IllinoisIndiana
Iowa
Kansas
Kentucky
Louisiana
Maine
Maryland
Massachusetts
Michigan
Minnesota
Mississippi
Missouri
Montana
Nebraska
Nevada
New Hampshire
New Jersey
New Mexico
New York
North Carolina
North Dakota
Ohio
Oklahoma
Oregon
Pennsylvania
Rhode Island
South Carolina
South Dakota
Tennessee
Texas
UtahVermontVirginia
Washington
West Virginia
Wisconsin
Wyoming
-14%
-13%
-12%
-11%
-10%
-9%
-8%
-7%
-6%
-5%
-4%
-10.0% -9.0% -8.0% -7.0% -6.0% -5.0% -4.0% -3.0% -2.0% -1.0% 0.0%
Lower unemployment
Higher unemployment
Deteriorating faster than U.S. average
Deteriorating slower than U.S. average
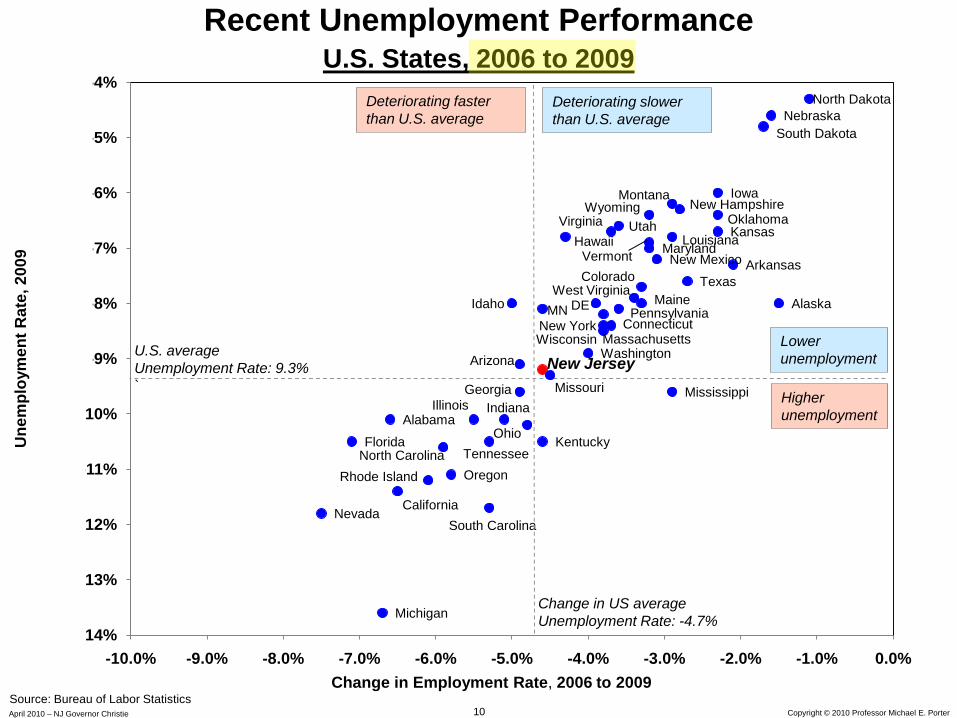
10April 2010 – NJ Governor Christie Copyright © 2010 Professor Michael E. Porter
Alabama
Alaska
Arizona
Arkansas
California
Colorado
ConnecticutDE
Florida
Georgia
Hawaii
Idaho
Illinois Indiana
Iowa
Kansas
Kentucky
Louisiana
Maine
Maryland
Massachusetts
Michigan
MN
MississippiMissouri
Montana
Nebraska
Nevada
New Hampshire
New Jersey
New Mexico
New York
North Carolina
North Dakota
Ohio
Oklahoma
Oregon
Pennsylvania
Rhode Island
South Carolina
South Dakota
Tennessee
Texas
Utah
Vermont
Virginia
Washington
West Virginia
Wisconsin
Wyoming
-14%
-13%
-12%
-11%
-10%
-9%
-8%
-7%
-6%
-5%
-4%
-10.0% -9.0% -8.0% -7.0% -6.0% -5.0% -4.0% -3.0% -2.0% -1.0% 0.0%
Recent Unemployment Performance U.S. States, 2006 to 2009
Change in US average Unemployment Rate: -4.7%
Change in Employment Rate, 2006 to 2009
Une
mpl
oym
ent R
ate,
200
9
Source: Bureau of Labor Statistics
U.S. average Unemployment Rate: 9.3% `
Lower unemployment
Higher unemployment
Deteriorating faster than U.S. average
Deteriorating slower than U.S. average
11April 2010 – NJ Governor Christie Copyright © 2010 Professor Michael E. Porter
$60,000
$70,000
$80,000
$90,000
$100,000
$110,000
$120,000
$130,000
$140,000
-1.0% 0.0% 1.0% 2.0% 3.0% 4.0% 5.0% 6.0% 7.0% 8.0%
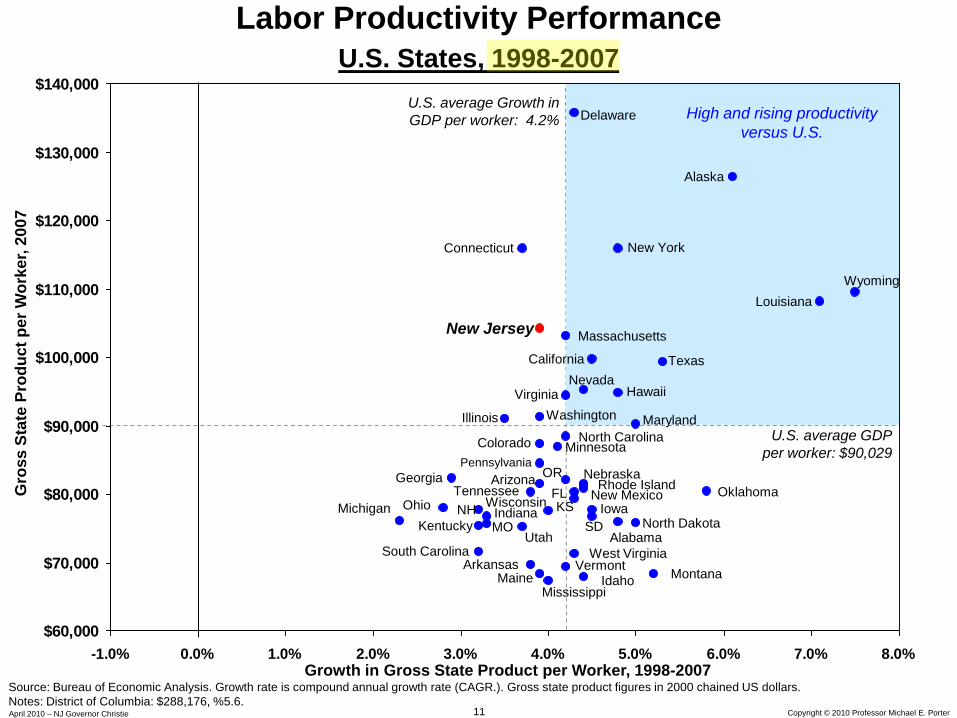
Labor Productivity PerformanceU.S. States, 1998-2007
Source: Bureau of Economic Analysis. Growth rate is compound annual growth rate (CAGR.). Gross state product figures in 2000 chained US dollars.Notes: District of Columbia: $288,176, %5.6.
U.S. average Growth in GDP per worker: 4.2%
U.S. average GDP per worker: $90,029
Growth in Gross State Product per Worker, 1998-2007
Gro
ss S
tate
Pro
duct
per
Wor
ker,
2007
High and rising productivity versus U.S.
Delaware
Connecticut
Massachusetts
New York
California
OR
SD North Dakota
Vermont
Rhode Island
Iowa
Idaho Montana
New Mexico
Alabama
Oklahoma
MaineArkansas
West Virginia
Mississippi
South Carolina
MichiganMOKentuckyIndianaOhio
Georgia
Alaska
New Jersey
Nevada
Minnesota
Illinois
Colorado
Washington
Hawaii
Maryland
Wyoming
Virginia
NebraskaFL
Arizona
Texas
NH
North Carolina
WisconsinTennessee
Utah
Pennsylvania
KS
Louisiana
12April 2010 – NJ Governor Christie Copyright © 2010 Professor Michael E. Porter
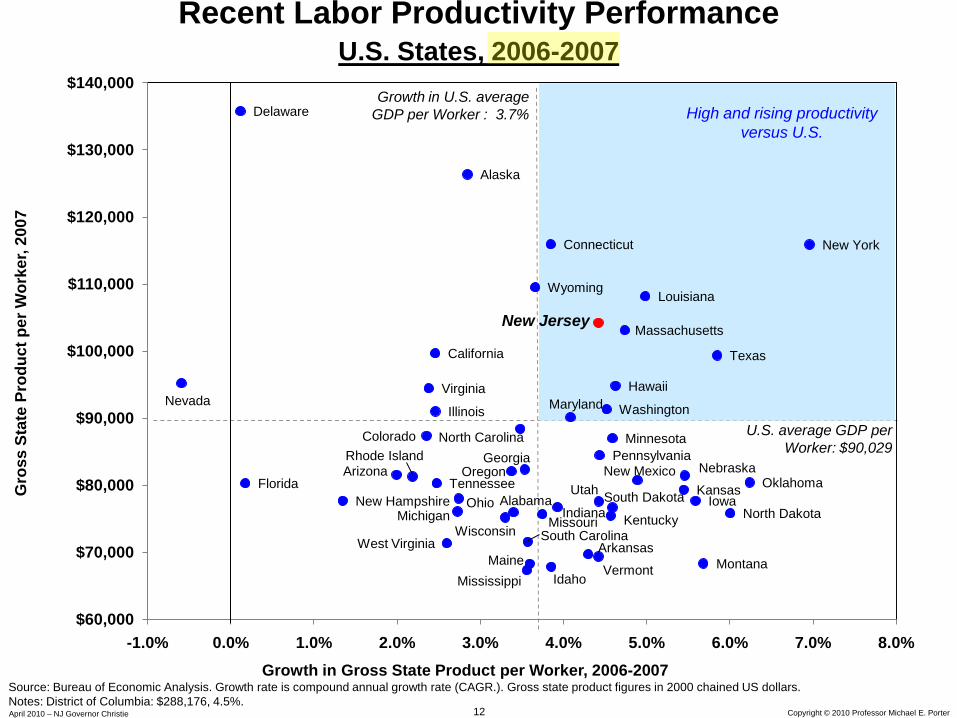
Recent Labor Productivity PerformanceU.S. States, 2006-2007
Source: Bureau of Economic Analysis. Growth rate is compound annual growth rate (CAGR.). Gross state product figures in 2000 chained US dollars.Notes: District of Columbia: $288,176, 4.5%.
Growth in U.S. average GDP per Worker : 3.7%
U.S. average GDP per Worker: $90,029
Growth in Gross State Product per Worker, 2006-2007
Gro
ss S
tate
Pro
duct
per
Wor
ker,
2007
Alabama
Alaska
Arizona
Arkansas
California
Colorado
Connecticut
Delaware
Florida
Georgia
Hawaii
Idaho
Illinois
IndianaIowa
Kansas
Kentucky
Louisiana
Maine
Maryland
Massachusetts
Michigan
Minnesota
Mississippi
Missouri
Montana
Nebraska
Nevada
New Hampshire
New Jersey
New Mexico
New York
North Carolina
North DakotaOhio
OklahomaOregon
PennsylvaniaRhode Island
South Carolina
South DakotaTennessee
Texas
Utah
Vermont
VirginiaWashington
West VirginiaWisconsin
Wyoming
$60,000
$70,000
$80,000
$90,000
$100,000
$110,000
$120,000
$130,000
$140,000
-1.0% 0.0% 1.0% 2.0% 3.0% 4.0% 5.0% 6.0% 7.0% 8.0%
High and rising productivity versus U.S.
13April 2010 – NJ Governor Christie Copyright © 2010 Professor Michael E. Porter
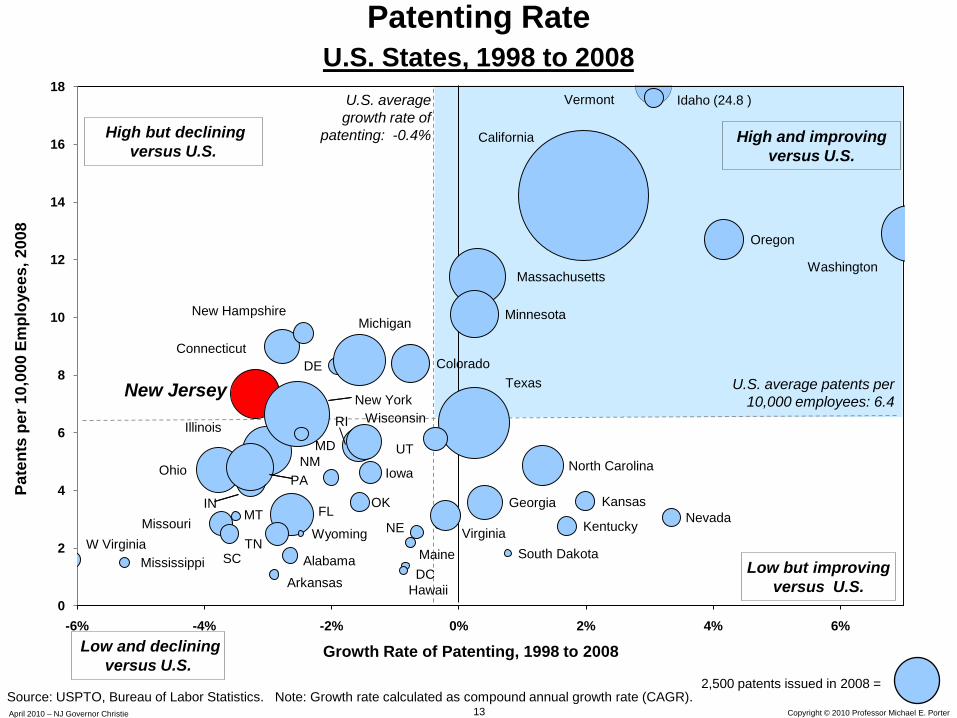
Patenting RateU.S. States, 1998 to 2008
Growth Rate of Patenting, 1998 to 2008
Pate
nts
per 1
0,00
0 Em
ploy
ees,
200
8
Source: USPTO, Bureau of Labor Statistics. Note: Growth rate calculated as compound annual growth rate (CAGR).2,500 patents issued in 2008 =
U.S. average growth rate of
patenting: -0.4%
U.S. average patents per 10,000 employees: 6.4
High and improving versus U.S.
High but decliningversus U.S.
Low and declining versus U.S.
Low but improving versus U.S.
AlabamaArkansas
California
ColoradoConnecticut
DE
DC
FL Georgia
Hawaii
Illinois
IN
Iowa
Kansas
Kentucky
Maine
MD
Massachusetts
Michigan Minnesota
Mississippi
MissouriMT
NENevada
New Hampshire
New Jersey
NM
New York
North CarolinaOhio
OK
Oregon
PA
RI
SC South DakotaTN
Texas
UT
Vermont
Virginia
Wisconsin
Wyoming
0
2
4
6
8
10
12
14
16
18
-6% -4% -2% 0% 2% 4% 6%
Washington
W Virginia
Idaho (24.8 )

14April 2010 – NJ Governor Christie Copyright © 2010 Professor Michael E. Porter
Top New Jersey Patenting Organizations2003-2007
Source: USPTO; utility patents granted. Prof. Michael E. Porter, Cluster Mapping Project, Institute for Strategy and Competitiveness, Harvard Business School; Richard Bryden, Project Director.
Note: Government, educational and other non-profit research institutions are highlighted.
Rank Organization 2003 2004 2005 2006 2007 Five-year Total
1 LUCENT TECHNOLOGIES INC. 421 330 256 306 237 1,550 2 AT&T CORP. 179 172 151 229 218 949 3 AGERE SYSTEMS INC. 82 85 45 54 37 303 4 BRISTOL-MYERS SQUIBB COMPANY 51 29 41 69 72 262 5 SCHERING CORP. 40 31 47 53 53 224 6 MERCK + CO., INC. 71 31 28 25 43 198 7 HONEYWELL INTERNATIONAL INC. 41 44 28 22 29 164 8 METROLOGIC INSTRUMENTS INC. 30 22 39 38 31 160 9 SARNOFF CORPORATION 61 38 25 22 14 160
10 EXXONMOBIL RESEARCH AND ENGINEERING COMPANY 35 52 22 25 23 157 11 ETHICON, INC. 26 20 25 34 29 134 12 SIEMENS CORPORATE RESEARCH, INC. 26 22 16 36 33 133 13 COLGATE-PALMOLIVE COMPANY 49 21 14 24 23 131 14 UNITED STATES OF AMERICA, ARMY 25 21 27 42 16 131 15 WYETH 24 28 21 29 16 118 16 PRINCETON UNIVERSITY 25 20 27 19 22 113 17 UNILEVER HOME & PERSONAL CARE USA, DIVISION OF CONOPCO 36 18 32 19 8 113 18 RUTGERS UNIVERSITY 22 19 16 30 19 106 19 BECTON, DICKINSON AND COMPANY 32 19 20 17 15 103 20 EXXONMOBIL CHEMICAL PATENTS INC. 18 17 19 23 23 100 21 TELCORDIA TECHNOLOGIES, INC. 20 17 21 30 8 96 22 AVAYA TECHNOLOGY CORP. 25 20 15 17 19 96 23 NATIONAL STARCH AND CHEMICAL INVESTMENT HOLDING CORP 24 23 16 18 10 91 24 MATSUSHITA ELECTRIC INDUSTRIAL CO., LTD. 14 14 14 37 10 89 25 ENGELHARD CORPORATION 23 18 16 15 8 80
48 UNIVERSITY OF MEDICINE AND DENTISTRY OF NEW JERSEY 11 6 4 15 7 43 75 NEW JERSEY INSTITUTE OF TECHNOLOGY 4 6 6 6 22 82 UNITED STATES OF AMERICA, NAVY 4 2 8 2 5 21
115 TRUSTEES OF THE STEVENS INSTITUTE OF TECHNOLOGY 1 4 4 2 3 14
15April 2010 – NJ Governor Christie Copyright © 2010 Professor Michael E. Porter
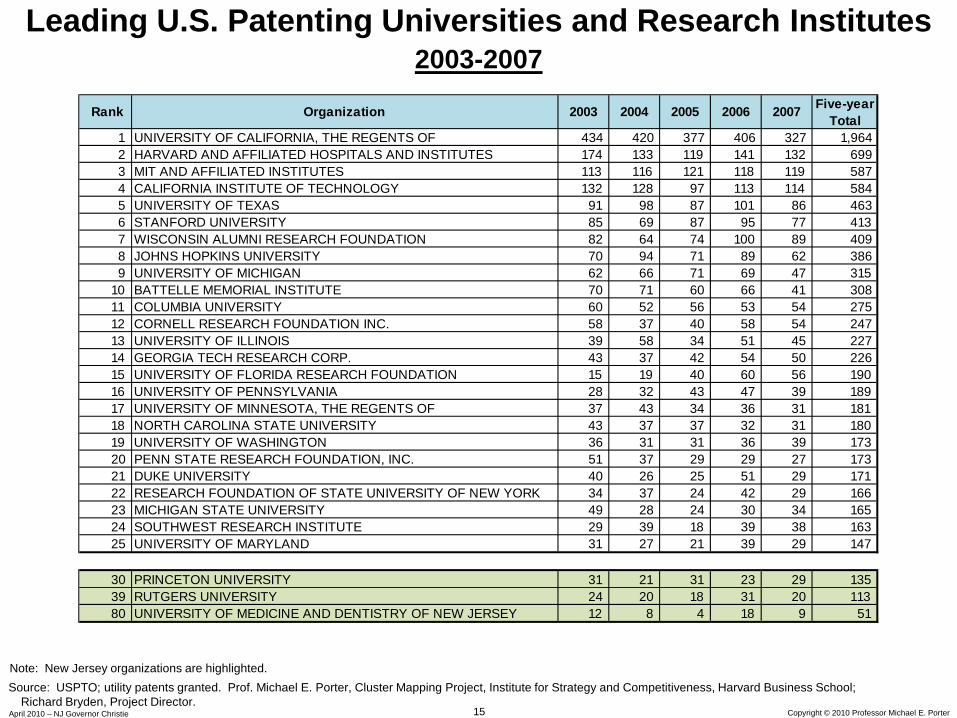
Leading U.S. Patenting Universities and Research Institutes 2003-2007
Note: New Jersey organizations are highlighted.Source: USPTO; utility patents granted. Prof. Michael E. Porter, Cluster Mapping Project, Institute for Strategy and Competitiveness, Harvard Business School;
Richard Bryden, Project Director.
Rank Organization 2003 2004 2005 2006 2007 Five-year Total
1 UNIVERSITY OF CALIFORNIA, THE REGENTS OF 434 420 377 406 327 1,964 2 HARVARD AND AFFILIATED HOSPITALS AND INSTITUTES 174 133 119 141 132 699 3 MIT AND AFFILIATED INSTITUTES 113 116 121 118 119 587 4 CALIFORNIA INSTITUTE OF TECHNOLOGY 132 128 97 113 114 584 5 UNIVERSITY OF TEXAS 91 98 87 101 86 463 6 STANFORD UNIVERSITY 85 69 87 95 77 413 7 WISCONSIN ALUMNI RESEARCH FOUNDATION 82 64 74 100 89 409 8 JOHNS HOPKINS UNIVERSITY 70 94 71 89 62 386 9 UNIVERSITY OF MICHIGAN 62 66 71 69 47 315
10 BATTELLE MEMORIAL INSTITUTE 70 71 60 66 41 308 11 COLUMBIA UNIVERSITY 60 52 56 53 54 275 12 CORNELL RESEARCH FOUNDATION INC. 58 37 40 58 54 247 13 UNIVERSITY OF ILLINOIS 39 58 34 51 45 227 14 GEORGIA TECH RESEARCH CORP. 43 37 42 54 50 226 15 UNIVERSITY OF FLORIDA RESEARCH FOUNDATION 15 19 40 60 56 190 16 UNIVERSITY OF PENNSYLVANIA 28 32 43 47 39 189 17 UNIVERSITY OF MINNESOTA, THE REGENTS OF 37 43 34 36 31 181 18 NORTH CAROLINA STATE UNIVERSITY 43 37 37 32 31 180 19 UNIVERSITY OF WASHINGTON 36 31 31 36 39 173 20 PENN STATE RESEARCH FOUNDATION, INC. 51 37 29 29 27 173 21 DUKE UNIVERSITY 40 26 25 51 29 171 22 RESEARCH FOUNDATION OF STATE UNIVERSITY OF NEW YORK 34 37 24 42 29 166 23 MICHIGAN STATE UNIVERSITY 49 28 24 30 34 165 24 SOUTHWEST RESEARCH INSTITUTE 29 39 18 39 38 163 25 UNIVERSITY OF MARYLAND 31 27 21 39 29 147
30 PRINCETON UNIVERSITY 31 21 31 23 29 135 39 RUTGERS UNIVERSITY 24 20 18 31 20 113 80 UNIVERSITY OF MEDICINE AND DENTISTRY OF NEW JERSEY 12 8 4 18 9 51
16April 2010 – NJ Governor Christie Copyright © 2010 Professor Michael E. Porter
New JerseyCluster Performance
17April 2010 – NJ Governor Christie Copyright © 2010 Professor Michael E. Porter
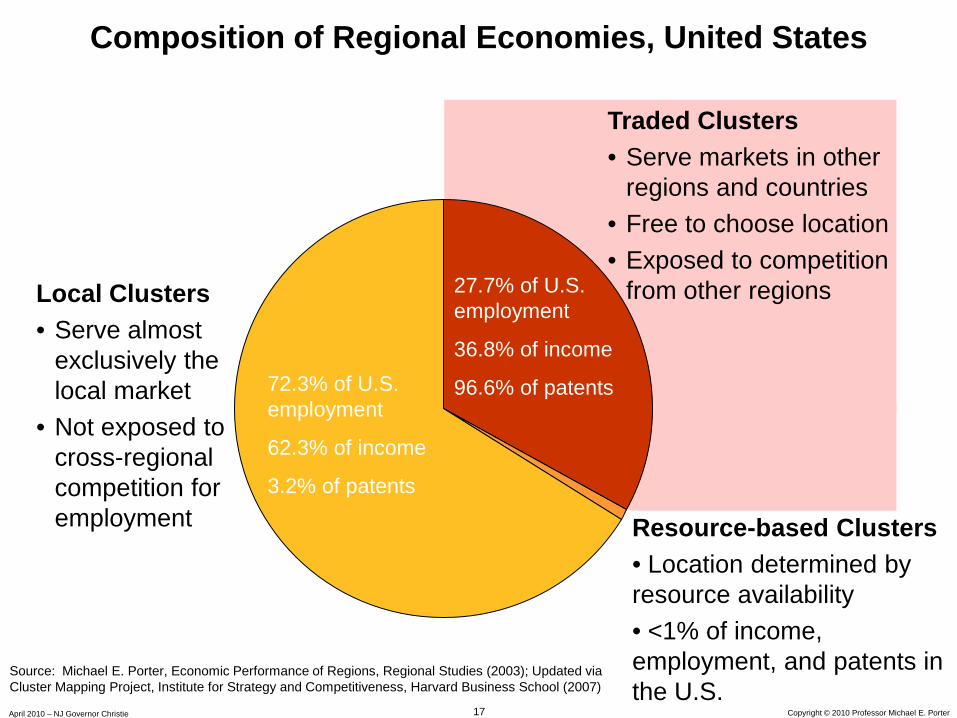
Composition of Regional Economies, United States
Local Clusters• Serve almost
exclusively the local market
• Not exposed to cross-regional competition for employment
72.3% of U.S.employment
62.3% of income
3.2% of patents
27.7% of U.S. employment
36.8% of income
96.6% of patents
Traded Clusters• Serve markets in other
regions and countries • Free to choose location• Exposed to competition
from other regions
Source: Michael E. Porter, Economic Performance of Regions, Regional Studies (2003); Updated via Cluster Mapping Project, Institute for Strategy and Competitiveness, Harvard Business School (2007)
Resource-based Clusters• Location determined by resource availability • <1% of income, employment, and patents in the U.S.
18April 2010 – NJ Governor Christie Copyright © 2010 Professor Michael E. Porter
0%
1%
2%
3%
4%
5%
6%
-1.5% -1.0% -0.5% 0.0% 0.5% 1.0%Change in New Jersey share of National Employment, 1998 to 2007
New
Jer
sey’
nat
iona
l em
ploy
men
t sha
re, 2
007
Employees 40,000 =
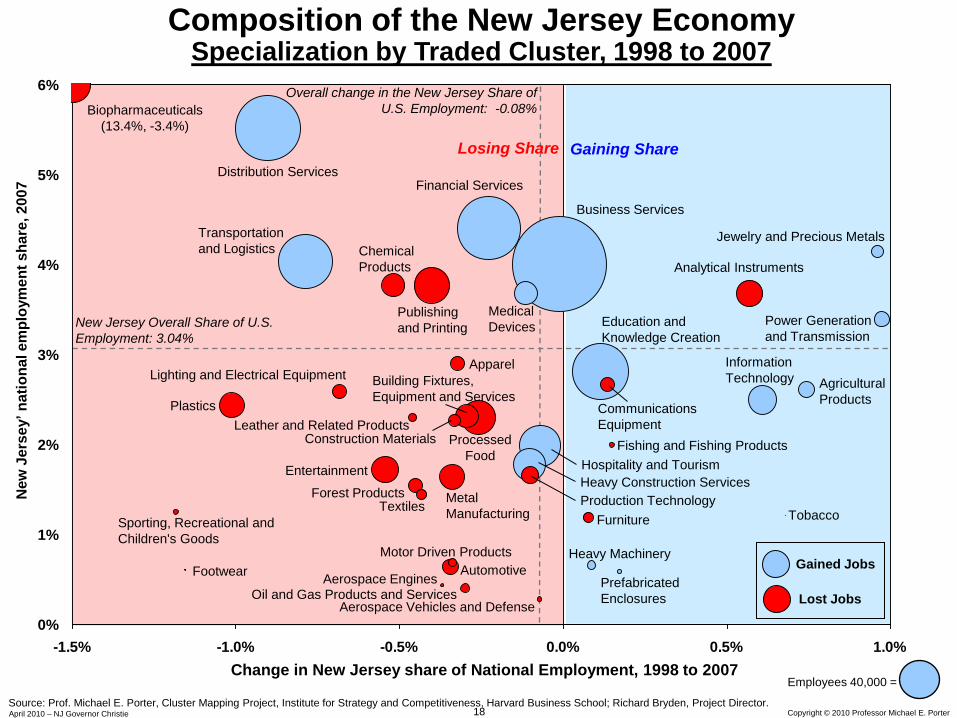
Composition of the New Jersey EconomySpecialization by Traded Cluster, 1998 to 2007
New Jersey Overall Share of U.S. Employment: 3.04%
Overall change in the New Jersey Share of U.S. Employment: -0.08%
Source: Prof. Michael E. Porter, Cluster Mapping Project, Institute for Strategy and Competitiveness, Harvard Business School; Richard Bryden, Project Director.
Gained Jobs
Lost Jobs
Biopharmaceuticals(13.4%, -3.4%)
Business Services
Distribution ServicesFinancial Services
Jewelry and Precious MetalsTransportation and Logistics
Publishing and Printing
Chemical Products Analytical Instruments
Medical Devices Power Generation
and Transmission
Apparel
Education and Knowledge Creation
Communications Equipment
Agricultural Products
Information TechnologyLighting and Electrical Equipment
Plastics
Building Fixtures, Equipment and Services
Processed Food
Leather and Related ProductsConstruction Materials Fishing and Fishing Products
Hospitality and TourismHeavy Construction Services
Entertainment
Production TechnologyMetal Manufacturing
Forest ProductsTextiles
Sporting, Recreational and Children's Goods
TobaccoFurniture
Motor Driven Products Heavy MachineryAutomotiveFootwear
Prefabricated Enclosures
Aerospace EnginesOil and Gas Products and Services
Aerospace Vehicles and Defense
Losing Share Gaining Share
19April 2010 – NJ Governor Christie Copyright © 2010 Professor Michael E. Porter
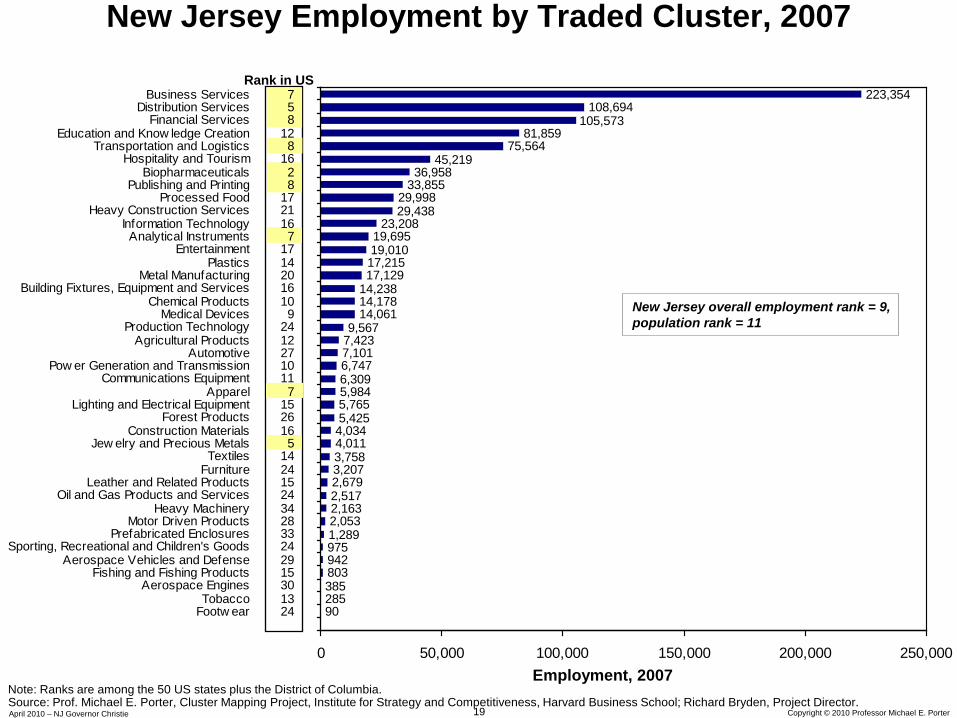
New Jersey Employment by Traded Cluster, 2007
Rank in US
Note: Ranks are among the 50 US states plus the District of Columbia. Source: Prof. Michael E. Porter, Cluster Mapping Project, Institute for Strategy and Competitiveness, Harvard Business School; Richard Bryden, Project Director.
Employment, 2007
902853858039429751,2892,0532,1632,5172,6793,2073,7584,0114,0345,4255,7655,9846,3096,7477,1017,4239,567
14,06114,17814,23817,12917,21519,01019,695
23,20829,43829,998
33,85536,958
45,21975,564
81,859
108,694223,354
105,573
0 50,000 100,000 150,000 200,000 250,000
Footw ear 24Tobacco 13
Aerospace Engines 30Fishing and Fishing Products 15
Aerospace Vehicles and Defense 29Sporting, Recreational and Children's Goods 24
Prefabricated Enclosures 33Motor Driven Products 28
Heavy Machinery 34Oil and Gas Products and Services 24
Leather and Related Products 15Furniture 24Textiles 14
Jew elry and Precious Metals 5Construction Materials 16
Forest Products 26Lighting and Electrical Equipment 15
Apparel 7Communications Equipment 11
Pow er Generation and Transmission 10Automotive 27
Agricultural Products 12Production Technology 24
Medical Devices 9Chemical Products 10
Building Fixtures, Equipment and Services 16Metal Manufacturing 20
Plastics 14Entertainment 17
Analytical Instruments 7Information Technology 16
Heavy Construction Services 21Processed Food 17
Publishing and Printing 8Biopharmaceuticals 2
Hospitality and Tourism 16Transportation and Logistics 8
Education and Know ledge Creation 12Financial Services 8
Distribution Services 5Business Services 7
New Jersey overall employment rank = 9, population rank = 11
20April 2010 – NJ Governor Christie Copyright © 2010 Professor Michael E. Porter
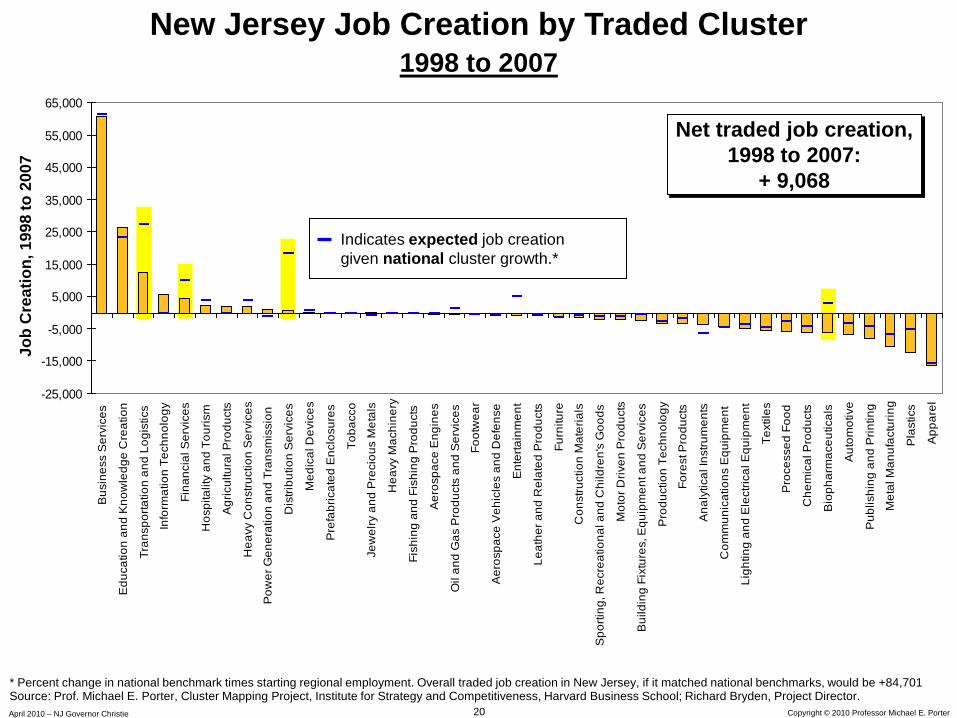
New Jersey Job Creation by Traded Cluster1998 to 2007
Job
Cre
atio
n, 1
998
to 2
007
-25,000
-15,000
-5,000
5,000
15,000
25,000
35,000
45,000
55,000
65,000B
usin
ess
Ser
vice
s
Edu
catio
n an
d K
now
ledg
e C
reat
ion
Tran
spor
tatio
n an
d Lo
gist
ics
Info
rmat
ion
Tech
nolo
gy
Fina
ncia
l Ser
vice
s
Hos
pita
lity
and
Tour
ism
Agr
icul
tura
l Pro
duct
s
Hea
vy C
onst
ruct
ion
Ser
vice
s
Pow
er G
ener
atio
n an
d Tr
ansm
issi
on
Dis
tribu
tion
Ser
vice
s
Med
ical
Dev
ices
Pre
fabr
icat
ed E
nclo
sure
s
Toba
cco
Jew
elry
and
Pre
ciou
s M
etal
s
Hea
vy M
achi
nery
Fish
ing
and
Fish
ing
Pro
duct
s
Aer
ospa
ce E
ngin
es
Oil
and
Gas
Pro
duct
s an
d S
ervi
ces
Foot
wea
r
Aer
ospa
ce V
ehic
les
and
Def
ense
Ent
erta
inm
ent
Leat
her a
nd R
elat
ed P
rodu
cts
Furn
iture
Con
stru
ctio
n M
ater
ials
Spo
rting
, Rec
reat
iona
l and
Chi
ldre
n's
Goo
ds
Mot
or D
riven
Pro
duct
s
Bui
ldin
g Fi
xtur
es, E
quip
men
t and
Ser
vice
s
Pro
duct
ion
Tech
nolo
gy
Fore
st P
rodu
cts
Ana
lytic
al In
stru
men
ts
Com
mun
icat
ions
Equ
ipm
ent
Ligh
ting
and
Ele
ctric
al E
quip
men
t
Text
iles
Pro
cess
ed F
ood
Che
mic
al P
rodu
cts
Bio
phar
mac
eutic
als
Aut
omot
ive
Pub
lishi
ng a
nd P
rintin
g
Met
al M
anuf
actu
ring
Pla
stic
s
App
arel
Net traded job creation, 1998 to 2007:
+ 9,068
Indicates expected job creation given national cluster growth.*
Source: Prof. Michael E. Porter, Cluster Mapping Project, Institute for Strategy and Competitiveness, Harvard Business School; Richard Bryden, Project Director.* Percent change in national benchmark times starting regional employment. Overall traded job creation in New Jersey, if it matched national benchmarks, would be +84,701

21April 2010 – NJ Governor Christie Copyright © 2010 Professor Michael E. Porter
$0 $25,000 $50,000 $75,000 $100,000 $125,000
FootwearAerospace Engines
ApparelHospitality and Tourism
Fishing and Fishing ProductsFurniture
Sporting, Recreational and Children's GoodsLeather and Related Products
TextilesPrefabricated Enclosures
Building Fixtures, Equipment and ServicesPlastics
Motor Driven ProductsConstruction Materials
Metal ManufacturingAutomotive
Transportation and LogisticsProcessed FoodForest Products
Lighting and Electrical EquipmentJewelry and Precious Metals
Production TechnologyTobacco
EntertainmentHeavy Machinery
Heavy Construction ServicesEducation and Knowledge Creation
Analytical InstrumentsAgricultural Products
Chemical ProductsPublishing and Printing
Aerospace Vehicles and DefenseBusiness Services
Communications EquipmentOil and Gas Products and Services
Distribution ServicesMedical Devices
BiopharmaceuticalsInformation Technology
Power Generation and TransmissionFinancial Services
New Jersey Wages by Traded Clustervs. National Benchmarks
Wages, 2007
New Jersey average traded wage: $69,070
l Indicates average national wage in the traded cluster.
Source: Prof. Michael E. Porter, Cluster Mapping Project, Institute for Strategy and Competitiveness, Harvard Business School; Richard Bryden, Project Director.
U.S. average traded wage: $56,248
22April 2010 – NJ Governor Christie Copyright © 2010 Professor Michael E. Porter
47,620
49,605
50,914
62,040
69,987
94,901
99,968
108,062
110,314
113,027
127,707
156,278
260,257
285,492
474,902
521,843
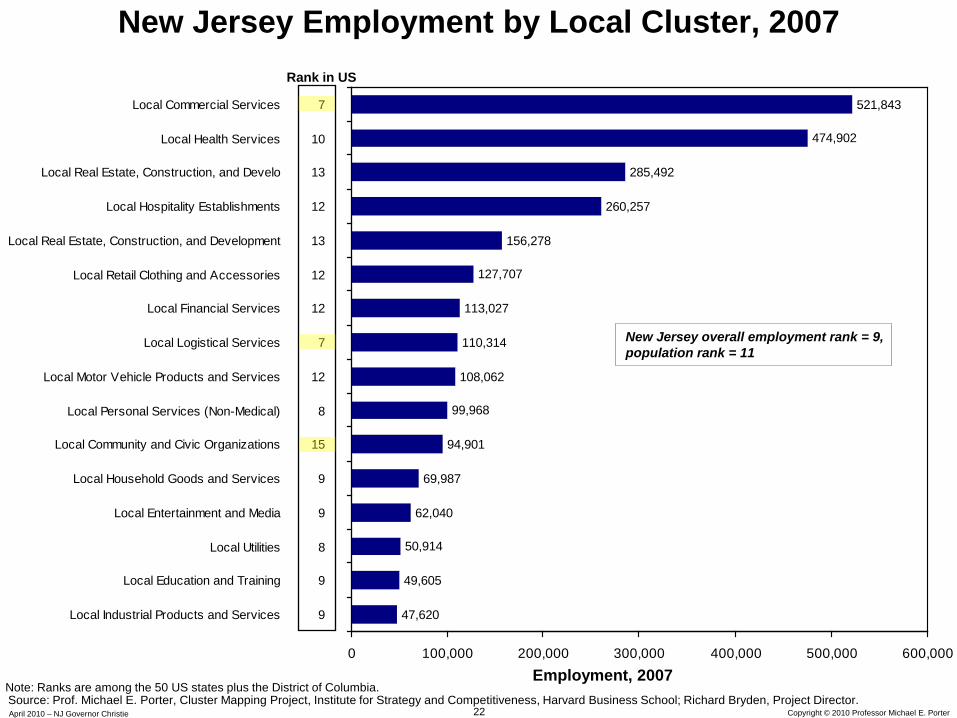
0 100,000 200,000 300,000 400,000 500,000 600,000
Local Industrial Products and Services 9
Local Education and Training 9
Local Utilities 8
Local Entertainment and Media 9
Local Household Goods and Services 9
Local Community and Civic Organizations 15
Local Personal Services (Non-Medical) 8
Local Motor Vehicle Products and Services 12
Local Logistical Services 7
Local Financial Services 12
Local Retail Clothing and Accessories 12
Local Real Estate, Construction, and Development 13
Local Hospitality Establishments 12
Local Real Estate, Construction, and Develo 13
Local Health Services 10
Local Commercial Services 7
New Jersey Employment by Local Cluster, 2007
Employment, 2007
Rank in US
Note: Ranks are among the 50 US states plus the District of Columbia. Source: Prof. Michael E. Porter, Cluster Mapping Project, Institute for Strategy and Competitiveness, Harvard Business School; Richard Bryden, Project Director.
New Jersey overall employment rank = 9, population rank = 11
23April 2010 – NJ Governor Christie Copyright © 2010 Professor Michael E. Porter
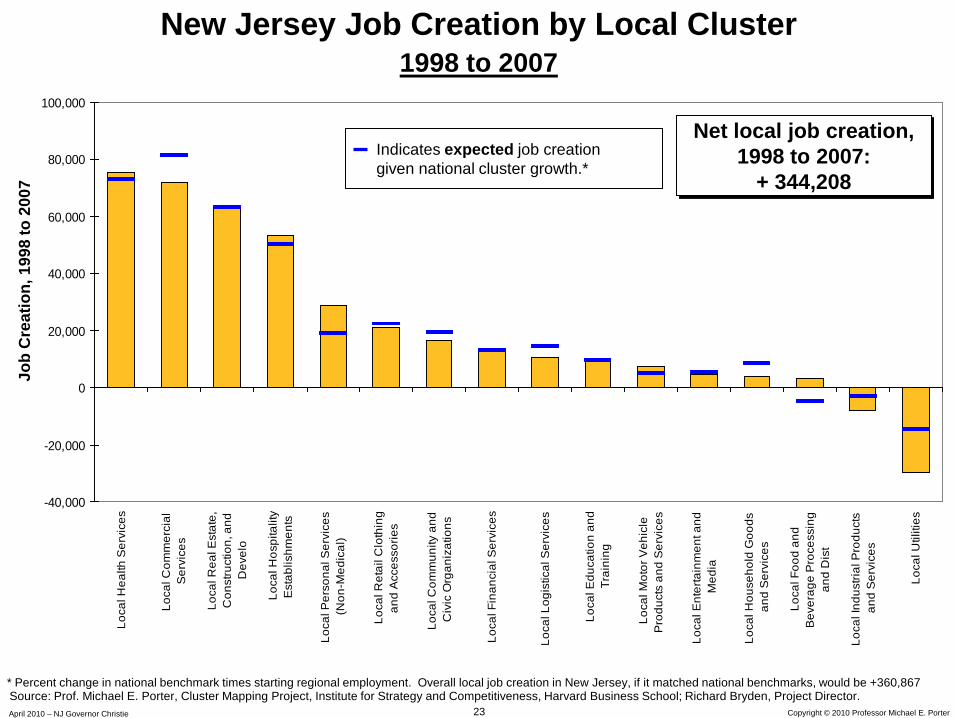
New Jersey Job Creation by Local Cluster1998 to 2007
Job
Cre
atio
n, 1
998
to 2
007
-40,000
-20,000
0
20,000
40,000
60,000
80,000
100,000Lo
cal H
ealth
Ser
vice
s
Loca
l Com
mer
cial
Ser
vice
s
Loca
l Rea
l Est
ate,
Con
stru
ctio
n, a
ndD
evel
o
Loca
l Hos
pita
lity
Est
ablis
hmen
ts
Loca
l Per
sona
l Ser
vice
s(N
on-M
edic
al)
Loca
l Ret
ail C
loth
ing
and
Acc
esso
ries
Loca
l Com
mun
ity a
ndC
ivic
Org
aniz
atio
ns
Loca
l Fin
anci
al S
ervi
ces
Loca
l Log
istic
al S
ervi
ces
Loca
l Edu
catio
n an
dTr
aini
ng
Loca
l Mot
or V
ehic
leP
rodu
cts
and
Ser
vice
s
Loca
l Ent
erta
inm
ent a
ndM
edia
Loca
l Hou
seho
ld G
oods
and
Ser
vice
s
Loca
l Foo
d an
dB
ever
age
Pro
cess
ing
and
Dis
t
Loca
l Ind
ustri
al P
rodu
cts
and
Ser
vice
s
Loca
l Util
ities
Net local job creation, 1998 to 2007:
+ 344,208Indicates expected job creation given national cluster growth.*
Source: Prof. Michael E. Porter, Cluster Mapping Project, Institute for Strategy and Competitiveness, Harvard Business School; Richard Bryden, Project Director.* Percent change in national benchmark times starting regional employment. Overall local job creation in New Jersey, if it matched national benchmarks, would be +360,867
24April 2010 – NJ Governor Christie Copyright © 2010 Professor Michael E. Porter
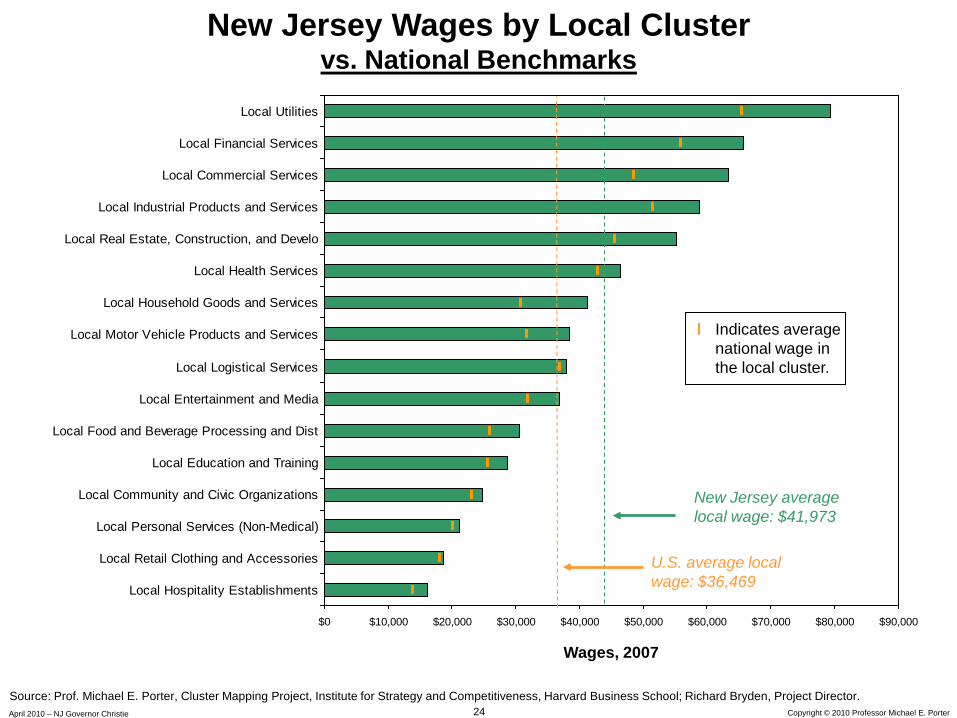
$0 $10,000 $20,000 $30,000 $40,000 $50,000 $60,000 $70,000 $80,000 $90,000
Local Hospitality Establishments
Local Retail Clothing and Accessories
Local Personal Services (Non-Medical)
Local Community and Civic Organizations
Local Education and Training
Local Food and Beverage Processing and Dist
Local Entertainment and Media
Local Logistical Services
Local Motor Vehicle Products and Services
Local Household Goods and Services
Local Health Services
Local Real Estate, Construction, and Develo
Local Industrial Products and Services
Local Commercial Services
Local Financial Services
Local Utilities
New Jersey Wages by Local Clustervs. National Benchmarks
Wages, 2007
New Jersey average local wage: $41,973
l Indicates average national wage in the local cluster.
Source: Prof. Michael E. Porter, Cluster Mapping Project, Institute for Strategy and Competitiveness, Harvard Business School; Richard Bryden, Project Director.
U.S. average local wage: $36,469
25April 2010 – NJ Governor Christie Copyright © 2010 Professor Michael E. Porter
0%
2%
4%
6%
8%
10%
12%
14%
16%
18%
20%
-5.0% -4.5% -4.0% -3.5% -3.0% -2.5% -2.0% -1.5% -1.0% -0.5% 0.0%Change in Subcluster’s share of National Employment, 1998 – 2007
Subc
lust
er’s
Nat
iona
l em
ploy
men
t sha
re, 2
007
Employees 10,000 =
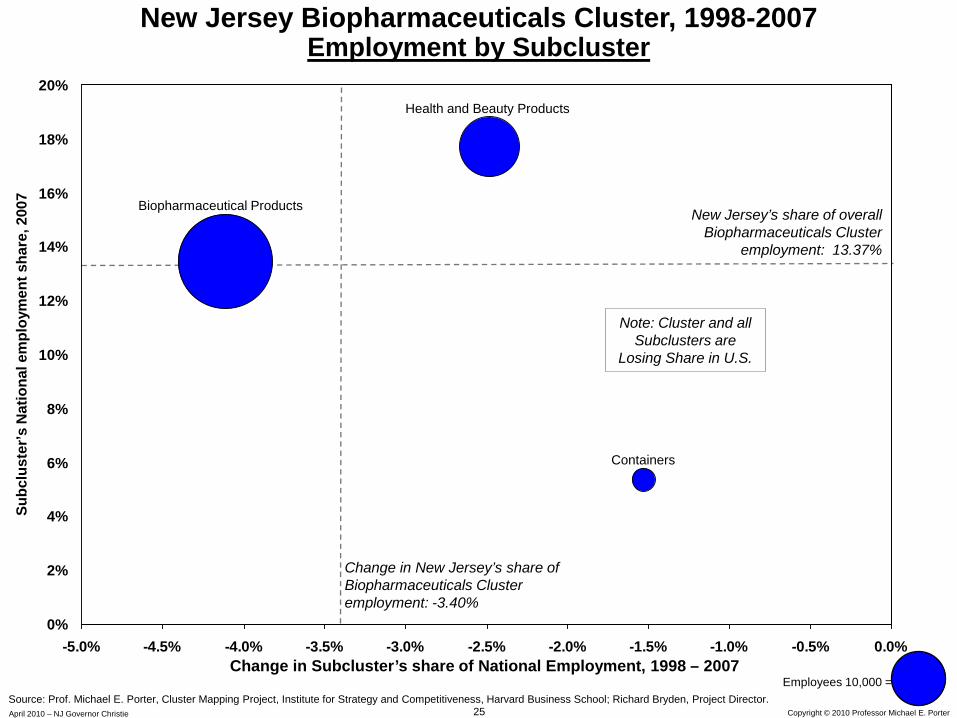
New Jersey Biopharmaceuticals Cluster, 1998-2007Employment by Subcluster
Health and Beauty Products
New Jersey’s share of overall Biopharmaceuticals Cluster
employment: 13.37%
Change in New Jersey’s share of Biopharmaceuticals Cluster employment: -3.40%
Source: Prof. Michael E. Porter, Cluster Mapping Project, Institute for Strategy and Competitiveness, Harvard Business School; Richard Bryden, Project Director.
Biopharmaceutical Products
Containers
Note: Cluster and all Subclusters are
Losing Share in U.S.

26April 2010 – NJ Governor Christie Copyright © 2010 Professor Michael E. Porter
0%
1%
2%
3%
4%
5%
6%
7%
8%
-3.0% -2.5% -2.0% -1.5% -1.0% -0.5% 0.0% 0.5% 1.0% 1.5%Change in Subcluster’s share of National Employment, 1998 – 2007
Subc
lust
er’s
Nat
iona
l em
ploy
men
t sha
re, 2
007
Employees 20,000 =
New Jersey Distribution Services Cluster, 1998-2007Employment by Subcluster
New Jersey’s share of overallDistribution Services Cluster
employment: 5.51%
Change in New Jersey’s share of Distribution Services Cluster
employment: -0.90%
Source: Prof. Michael E. Porter, Cluster Mapping Project, Institute for Strategy and Competitiveness, Harvard Business School; Richard Bryden, Project Director.
Merchandise Wholesaling
Apparel and Accessories Wholesaling
Catalog and Mail-order
Food Products Wholesaling
Transportation Vehicle and Equipment Distribution
Farm Material and Supplies Wholesaling
Losing Share
Gaining Share
27April 2010 – NJ Governor Christie Copyright © 2010 Professor Michael E. Porter
0%
1%
2%
3%
4%
5%
6%
7%
-8.0% -7.0% -6.0% -5.0% -4.0% -3.0% -2.0% -1.0% 0.0% 1.0% 2.0%Change in Subcluster’s share of National Employment, 1998 – 2007
Subc
lust
er’s
Nat
iona
l em
ploy
men
t sha
re, 2
007
Employees 20,000 =
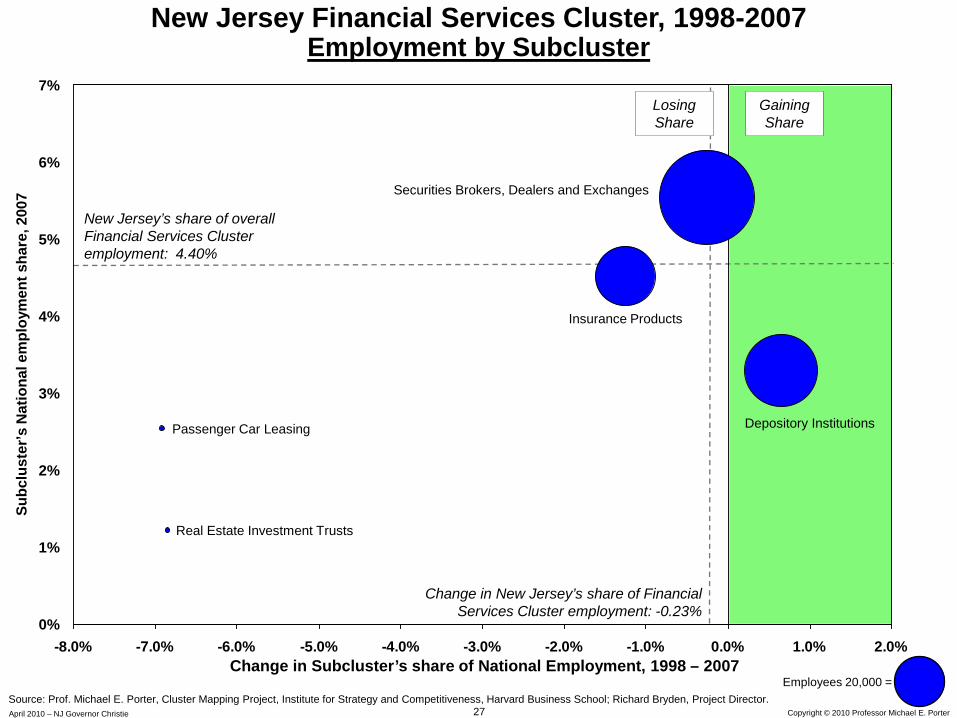
New Jersey Financial Services Cluster, 1998-2007Employment by Subcluster
New Jersey’s share of overall Financial Services Cluster employment: 4.40%
Change in New Jersey’s share of Financial Services Cluster employment: -0.23%
Source: Prof. Michael E. Porter, Cluster Mapping Project, Institute for Strategy and Competitiveness, Harvard Business School; Richard Bryden, Project Director.
Securities Brokers, Dealers and Exchanges
Depository Institutions
Insurance Products
Real Estate Investment Trusts
Passenger Car Leasing
Losing Share
Gaining Share
28April 2010 – NJ Governor Christie Copyright © 2010 Professor Michael E. Porter
0%
2%
4%
6%
8%
10%
12%
-18% -16% -14% -12% -10% -8% -6% -4% -2% 0% 2%Change in Subcluster’s share of National Employment, 1998 – 2007
Subc
lust
er’s
Nat
iona
l em
ploy
men
t sha
re, 2
007
Employees 15,000 =
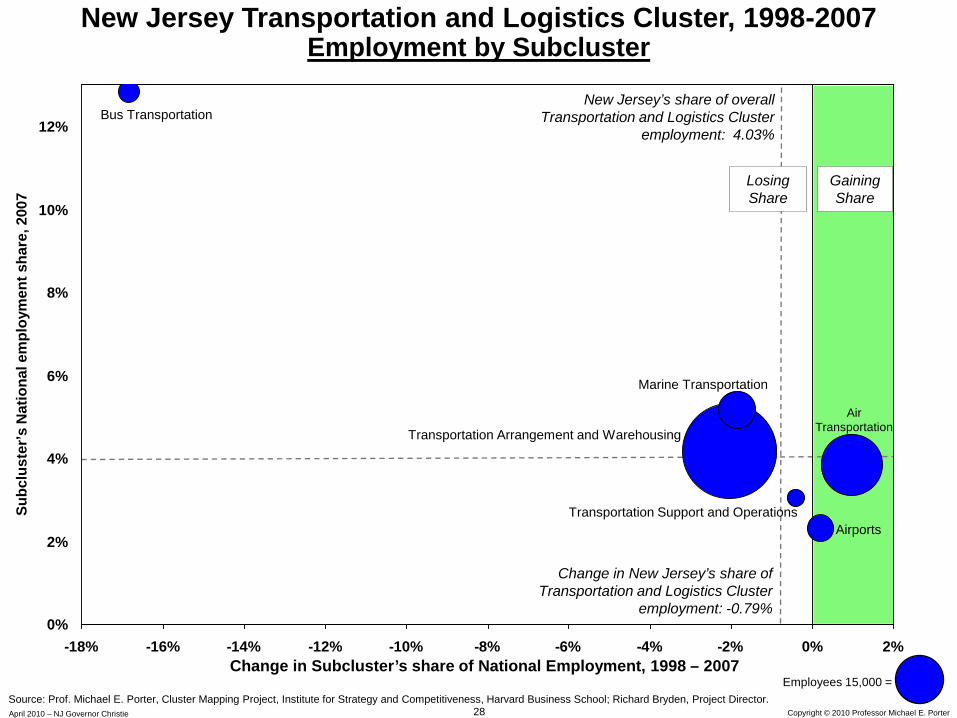
New Jersey Transportation and Logistics Cluster, 1998-2007Employment by Subcluster
New Jersey’s share of overall Transportation and Logistics Cluster
employment: 4.03%
Change in New Jersey’s share of Transportation and Logistics Cluster
employment: -0.79%
Source: Prof. Michael E. Porter, Cluster Mapping Project, Institute for Strategy and Competitiveness, Harvard Business School; Richard Bryden, Project Director.
Transportation Arrangement and Warehousing
Air Transportation
Marine Transportation
Airports
Bus Transportation
Transportation Support and Operations
Losing Share
Gaining Share
29April 2010 – NJ Governor Christie Copyright © 2010 Professor Michael E. Porter
Comparative Performanceof New Jersey Regions
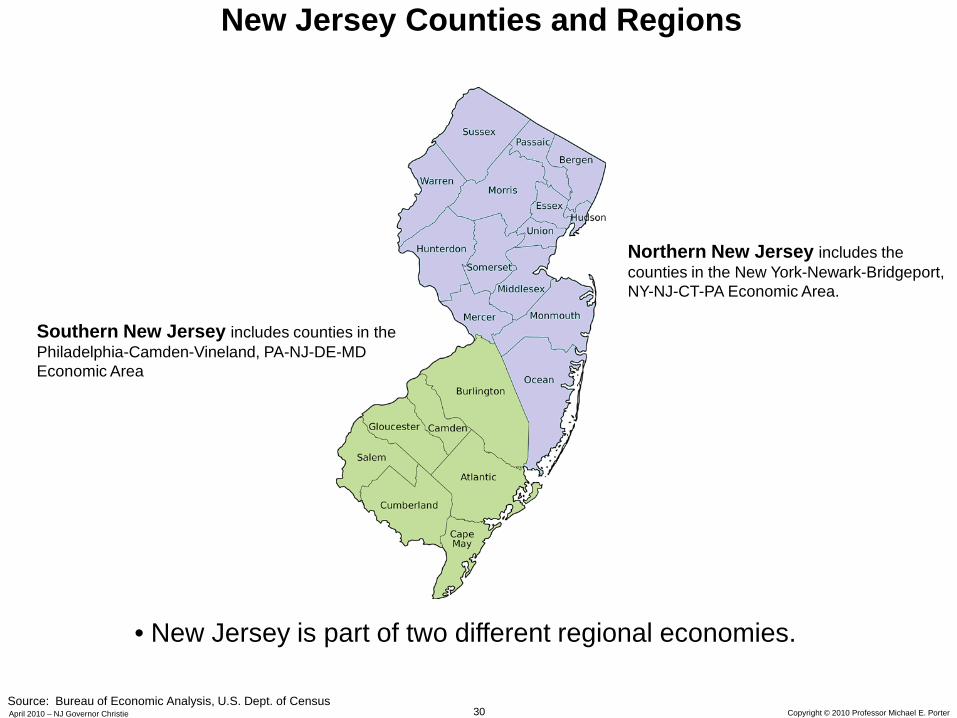
30April 2010 – NJ Governor Christie Copyright © 2010 Professor Michael E. Porter
New Jersey Counties and Regions
Northern New Jersey includes the counties in the New York-Newark-Bridgeport, NY-NJ-CT-PA Economic Area.
Southern New Jersey includes counties in the Philadelphia-Camden-Vineland, PA-NJ-DE-MD Economic Area
Source: Bureau of Economic Analysis, U.S. Dept. of Census
• New Jersey is part of two different regional economies.
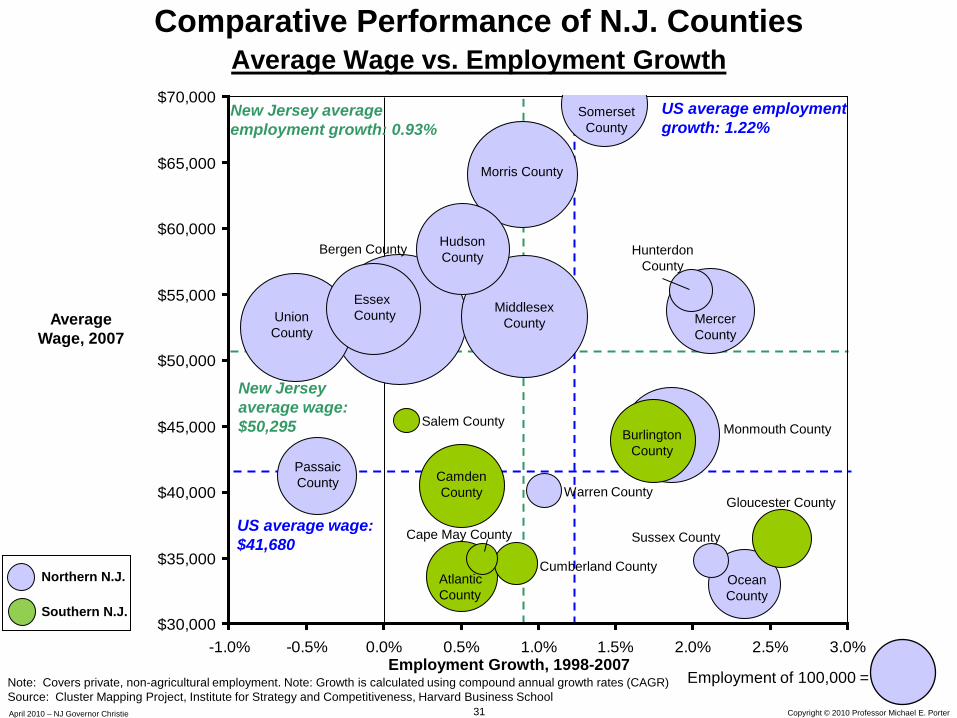
31April 2010 – NJ Governor Christie Copyright © 2010 Professor Michael E. Porter
$30,000
$35,000
$40,000
$45,000
$50,000
$55,000
$60,000
$65,000
$70,000
-1.0% -0.5% 0.0% 0.5% 1.0% 1.5% 2.0% 2.5% 3.0%Employment Growth, 1998-2007
Average Wage, 2007
Note: Covers private, non-agricultural employment. Note: Growth is calculated using compound annual growth rates (CAGR)Source: Cluster Mapping Project, Institute for Strategy and Competitiveness, Harvard Business School
US average employment growth: 1.22%
US average wage: $41,680
New Jersey average wage: $50,295
New Jersey average employment growth: 0.93%
Comparative Performance of N.J. CountiesAverage Wage vs. Employment Growth
Somerset County
Morris County
Hudson County Hunterdon
County
Union County
Mercer County
Middlesex County
Bergen County
Essex County
Salem County Monmouth CountyBurlington County
Passaic County Camden
County Warren CountyGloucester County
Cape May County Sussex County
Ocean County
Cumberland CountyAtlantic County
Employment of 100,000 =
Northern N.J.
Southern N.J.
32April 2010 – NJ Governor Christie Copyright © 2010 Professor Michael E. Porter
$30,000
$35,000
$40,000
$45,000
$50,000
$55,000
$60,000
$65,000
$70,000
2.0% 2.5% 3.0% 3.5% 4.0% 4.5% 5.0% 5.5%Wage Growth, 1998-2007
Average Wage, 2007
Employment of 100,000 =Note: Covers private, non-agricultural employment. Note: Growth is calculated using compound annual growth rates (CAGR)Source: Cluster Mapping Project, Institute for Strategy and Competitiveness, Harvard Business School
US average wage growth: 3.49%
US average wage: $41,680
New Jersey average wage: $50,295
New Jersey average wage growth: 3.36%
Comparative Performance of N.J. CountiesWages vs. Wage Growth
Somerset County
Northern N.J.
Southern N.J.
Morris County
Hudson CountyHunterdon County
Union County
Mercer County
Middlesex CountyBergen County
Essex County
Monmouth County
Passaic County
Warren County
Sussex County
Ocean County
Salem CountyBurlington
County
Camden County
Gloucester County
Cape May County
Cumberland County
Atlantic County
33April 2010 – NJ Governor Christie Copyright © 2010 Professor Michael E. Porter
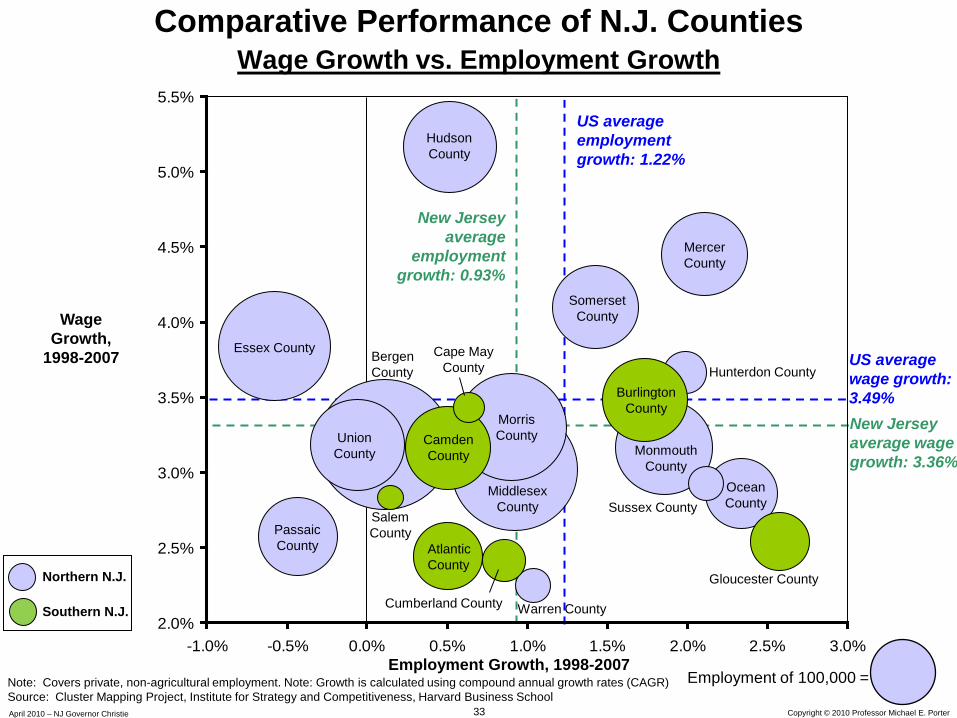
2.0%
2.5%
3.0%
3.5%
4.0%
4.5%
5.0%
5.5%
-1.0% -0.5% 0.0% 0.5% 1.0% 1.5% 2.0% 2.5% 3.0%Employment Growth, 1998-2007
Wage Growth,
1998-2007
Note: Covers private, non-agricultural employment. Note: Growth is calculated using compound annual growth rates (CAGR)Source: Cluster Mapping Project, Institute for Strategy and Competitiveness, Harvard Business School
US average employment growth: 1.22%
New Jersey average
employment growth: 0.93%
Comparative Performance of N.J. CountiesWage Growth vs. Employment Growth
US average wage growth: 3.49%New Jersey average wage growth: 3.36%
Employment of 100,000 =
Hudson County
Mercer County
Somerset County
Essex County
Hunterdon CountyBurlington
County
Cape May County
Morris County
Bergen County
Union County Monmouth
County
Camden County
Middlesex County Sussex County
Ocean County
Salem CountyPassaic
County
Gloucester County
Atlantic County
Cumberland County Warren County
Northern N.J.
Southern N.J.
34April 2010 – NJ Governor Christie Copyright © 2010 Professor Michael E. Porter
Northern New JerseyCluster Performance
35April 2010 – NJ Governor Christie Copyright © 2010 Professor Michael E. Porter
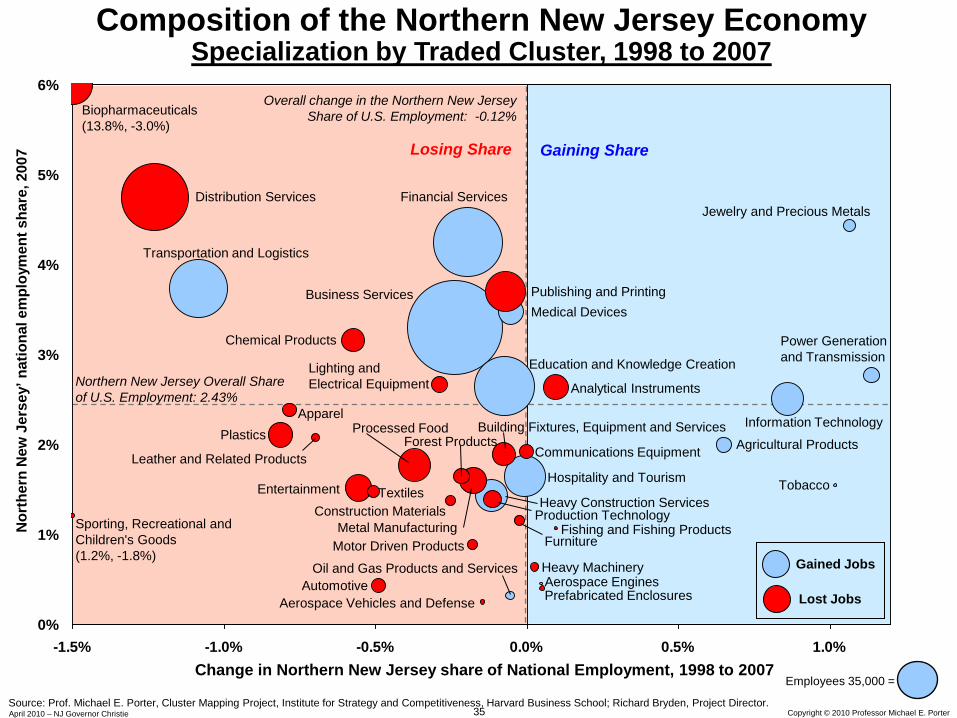
0%
1%
2%
3%
4%
5%
6%
-1.5% -1.0% -0.5% 0.0% 0.5% 1.0%Change in Northern New Jersey share of National Employment, 1998 to 2007
Nor
ther
n N
ew J
erse
y’ n
atio
nal e
mpl
oym
ent s
hare
, 200
7
Employees 35,000 =
Composition of the Northern New Jersey EconomySpecialization by Traded Cluster, 1998 to 2007
Northern New Jersey Overall Share of U.S. Employment: 2.43%
Overall change in the Northern New Jersey Share of U.S. Employment: -0.12%
Source: Prof. Michael E. Porter, Cluster Mapping Project, Institute for Strategy and Competitiveness, Harvard Business School; Richard Bryden, Project Director.
Gained Jobs
Lost Jobs
Biopharmaceuticals(13.8%, -3.0%)
Distribution ServicesJewelry and Precious Metals
Financial Services
Transportation and Logistics
Publishing and PrintingMedical Devices
Business Services
Chemical Products Power Generation and Transmission
Lighting and Electrical Equipment
Education and Knowledge Creation
Hospitality and Tourism
Analytical Instruments
Information TechnologyApparelPlastics
Leather and Related ProductsAgricultural ProductsCommunications Equipment
Building Fixtures, Equipment and ServicesProcessed FoodForest Products
Metal Manufacturing
TobaccoEntertainment TextilesHeavy Construction Services
Production TechnologyConstruction MaterialsSporting, Recreational and Children's Goods(1.2%, -1.8%)
FurnitureFishing and Fishing Products
Motor Driven ProductsHeavy MachineryAerospace EnginesAutomotivePrefabricated Enclosures
Oil and Gas Products and Services
Aerospace Vehicles and Defense
Losing Share Gaining Share
36April 2010 – NJ Governor Christie Copyright © 2010 Professor Michael E. Porter
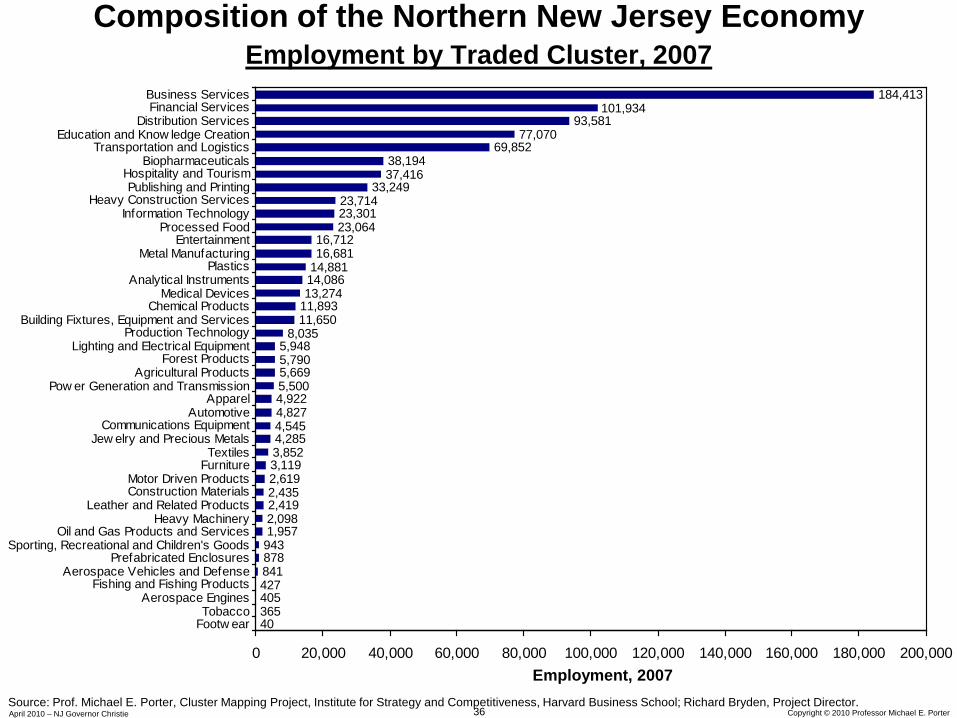
Composition of the Northern New Jersey EconomyEmployment by Traded Cluster, 2007
Source: Prof. Michael E. Porter, Cluster Mapping Project, Institute for Strategy and Competitiveness, Harvard Business School; Richard Bryden, Project Director.
Employment, 2007
403654054278418789431,9572,0982,4192,4352,6193,1193,8524,2854,5454,8274,9225,5005,6695,7905,948
8,03511,65011,89313,27414,08614,88116,68116,712
23,06423,30123,714
33,24937,41638,194
69,85277,070
93,581
184,413101,934
0 20,000 40,000 60,000 80,000 100,000 120,000 140,000 160,000 180,000 200,000
Footw earTobacco
Aerospace EnginesFishing and Fishing Products
Aerospace Vehicles and DefensePrefabricated Enclosures
Sporting, Recreational and Children's GoodsOil and Gas Products and Services
Heavy MachineryLeather and Related Products
Construction MaterialsMotor Driven Products
FurnitureTextiles
Jew elry and Precious MetalsCommunications Equipment
AutomotiveApparel
Pow er Generation and TransmissionAgricultural Products
Forest ProductsLighting and Electrical Equipment
Production TechnologyBuilding Fixtures, Equipment and Services
Chemical ProductsMedical Devices
Analytical InstrumentsPlastics
Metal ManufacturingEntertainment
Processed FoodInformation Technology
Heavy Construction ServicesPublishing and Printing
Hospitality and TourismBiopharmaceuticals
Transportation and LogisticsEducation and Know ledge Creation
Distribution ServicesFinancial ServicesBusiness Services
37April 2010 – NJ Governor Christie Copyright © 2010 Professor Michael E. Porter
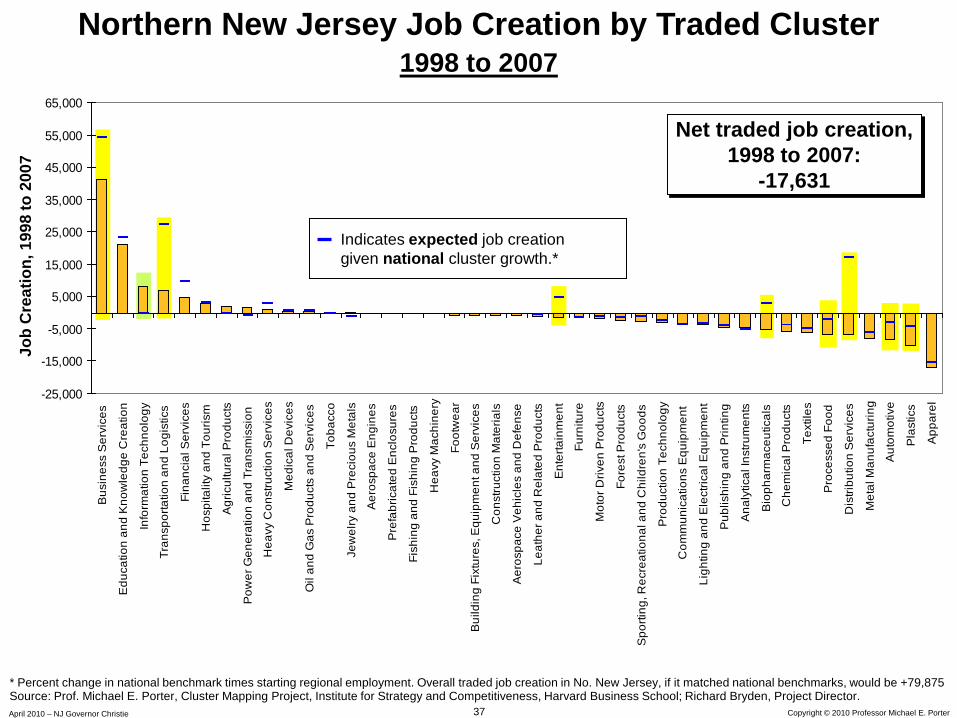
Northern New Jersey Job Creation by Traded Cluster1998 to 2007
Job
Cre
atio
n, 1
998
to 2
007
-25,000
-15,000
-5,000
5,000
15,000
25,000
35,000
45,000
55,000
65,000B
usin
ess
Ser
vice
s
Edu
catio
n an
d K
now
ledg
e C
reat
ion
Info
rmat
ion
Tech
nolo
gy
Tran
spor
tatio
n an
d Lo
gist
ics
Fina
ncia
l Ser
vice
s
Hos
pita
lity
and
Tour
ism
Agr
icul
tura
l Pro
duct
s
Pow
er G
ener
atio
n an
d Tr
ansm
issi
on
Hea
vy C
onst
ruct
ion
Ser
vice
s
Med
ical
Dev
ices
Oil
and
Gas
Pro
duct
s an
d S
ervi
ces
Toba
cco
Jew
elry
and
Pre
ciou
s M
etal
s
Aer
ospa
ce E
ngin
es
Pre
fabr
icat
ed E
nclo
sure
s
Fish
ing
and
Fish
ing
Pro
duct
s
Hea
vy M
achi
nery
Foot
wea
r
Bui
ldin
g Fi
xtur
es, E
quip
men
t and
Ser
vice
s
Con
stru
ctio
n M
ater
ials
Aer
ospa
ce V
ehic
les
and
Def
ense
Leat
her a
nd R
elat
ed P
rodu
cts
Ent
erta
inm
ent
Furn
iture
Mot
or D
riven
Pro
duct
s
Fore
st P
rodu
cts
Spo
rting
, Rec
reat
iona
l and
Chi
ldre
n's
Goo
ds
Pro
duct
ion
Tech
nolo
gy
Com
mun
icat
ions
Equ
ipm
ent
Ligh
ting
and
Ele
ctric
al E
quip
men
t
Pub
lishi
ng a
nd P
rintin
g
Ana
lytic
al In
stru
men
ts
Bio
phar
mac
eutic
als
Che
mic
al P
rodu
cts
Text
iles
Pro
cess
ed F
ood
Dis
tribu
tion
Ser
vice
s
Met
al M
anuf
actu
ring
Aut
omot
ive
Pla
stic
s
App
arel
Net traded job creation, 1998 to 2007:
-17,631
Indicates expected job creation given national cluster growth.*
Source: Prof. Michael E. Porter, Cluster Mapping Project, Institute for Strategy and Competitiveness, Harvard Business School; Richard Bryden, Project Director.* Percent change in national benchmark times starting regional employment. Overall traded job creation in No. New Jersey, if it matched national benchmarks, would be +79,875
38April 2010 – NJ Governor Christie Copyright © 2010 Professor Michael E. Porter
$0 $25,000 $50,000 $75,000 $100,000 $125,000
FootwearAerospace Engines
TobaccoFishing and Fishing Products
ApparelHospitality and Tourism
Motor Driven ProductsEntertainment
Agricultural ProductsFurniture
Leather and Related ProductsConstruction Materials
Prefabricated EnclosuresTextiles
Building Fixtures, Equipment and ServicesPlastics
Metal ManufacturingProcessed Food
Sporting, Recreational and Children's GoodsTransportation and Logistics
Production TechnologyHeavy MachineryForest Products
AutomotiveLighting and Electrical Equipment
Jewelry and Precious MetalsAnalytical Instruments
Publishing and PrintingOil and Gas Products and Services
Power Generation and TransmissionHeavy Construction Services
Education and Knowledge CreationAerospace Vehicles and Defense
Chemical ProductsBusiness Services
BiopharmaceuticalsDistribution Services
Information TechnologyCommunications Equipment
Medical DevicesFinancial Services
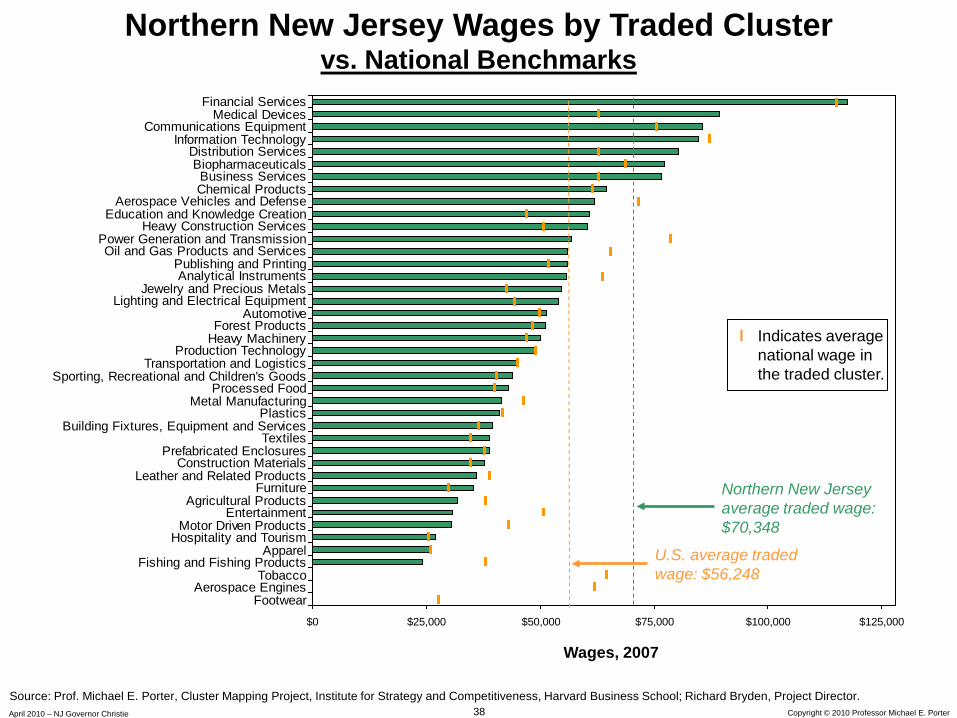
Northern New Jersey Wages by Traded Clustervs. National Benchmarks
Wages, 2007
Northern New Jersey average traded wage: $70,348
l Indicates average national wage in the traded cluster.
Source: Prof. Michael E. Porter, Cluster Mapping Project, Institute for Strategy and Competitiveness, Harvard Business School; Richard Bryden, Project Director.
U.S. average traded wage: $56,248
39April 2010 – NJ Governor Christie Copyright © 2010 Professor Michael E. Porter
Southern New JerseyCluster Performance

40April 2010 – NJ Governor Christie Copyright © 2010 Professor Michael E. Porter
0.0%
0.2%
0.4%
0.6%
0.8%
1.0%
1.2%
1.4%
-0.4% -0.3% -0.2% -0.1% 0.0% 0.1% 0.2% 0.3% 0.4% 0.5%Change in Southern New Jersey share of National Employment, 1998 to 2007
Sout
hern
New
Jer
sey’
nat
iona
l em
ploy
men
t sha
re, 2
007
Employees 40,000 =
Composition of the Southern New Jersey EconomySpecialization by Traded Cluster, 1998 to 2007
Southern New Jersey Overall Share of U.S. Employment: 0.57%
Overall change in the Southern New Jersey Share of U.S.
Employment: -0.006%
Source: Prof. Michael E. Porter, Cluster Mapping Project, Institute for Strategy and Competitiveness, Harvard Business School; Richard Bryden, Project Director.
Gained Jobs
Lost Jobs
Analytical Instruments(1.65%, +0.91%)
Fishing and Fishing ProductsCommunications Equipment
Power Generation and Transmission
Construction Materials
Chemical Products
Distribution ServicesProcessed Food
Agricultural Products
Building Fixtures, Equipment and ServicesBiopharmaceuticals
Apparel
Leather and Related Products Footwear
Medical DevicesTransportation and
Logistics
Production Technology
Publishing and Printing Heavy Construction Services
Business ServicesHospitality and Tourism
PlasticsLighting and Electrical Equipment
EntertainmentSporting, Recreational and Children's Goods
Financial Services
AutomotiveOil and Gas Products and Services Metal Manufacturing
Information Technology
Jewelry and Precious MetalsForest Products Furniture
Education and Knowledge Creation
Heavy MachineryPrefabricated Enclosures
Textiles
Motor Driven ProductsAerospace Vehicles and Defense
Losing Share Gaining Share
41April 2010 – NJ Governor Christie Copyright © 2010 Professor Michael E. Porter
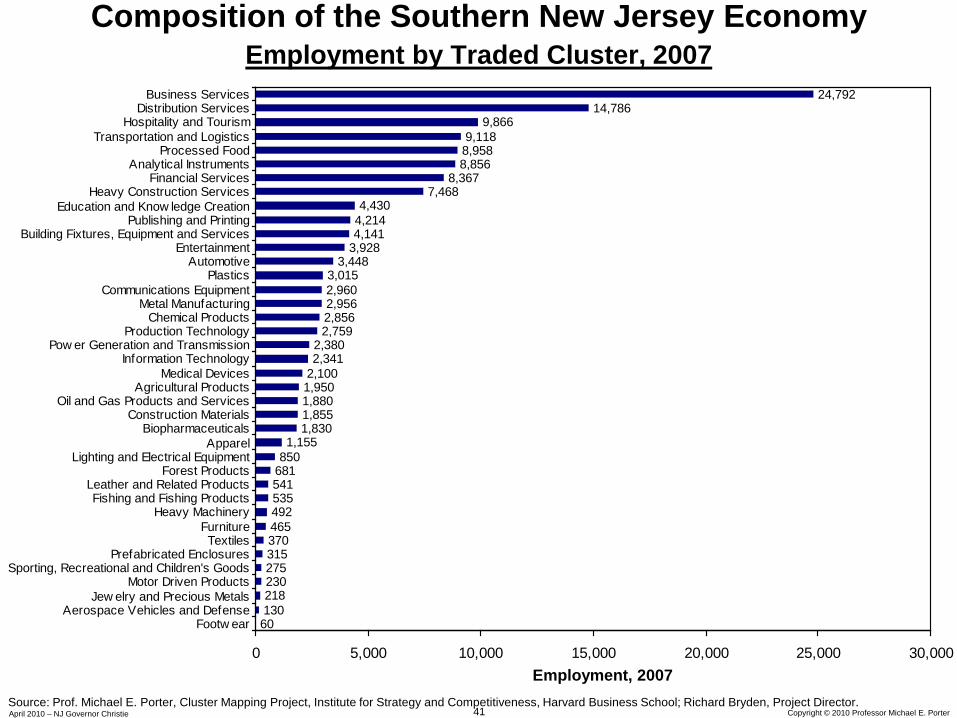
Composition of the Southern New Jersey EconomyEmployment by Traded Cluster, 2007
Source: Prof. Michael E. Porter, Cluster Mapping Project, Institute for Strategy and Competitiveness, Harvard Business School; Richard Bryden, Project Director.
Employment, 2007
601302182302753153704654925355416818501,155
1,8301,8551,8801,9502,1002,3412,380
2,7592,8562,9562,9603,015
3,4483,9284,1414,2144,430
7,4688,367
8,8568,9589,118
9,86614,786
24,792
0 5,000 10,000 15,000 20,000 25,000 30,000
Footw earAerospace Vehicles and Defense
Jew elry and Precious MetalsMotor Driven Products
Sporting, Recreational and Children's GoodsPrefabricated Enclosures
TextilesFurniture
Heavy MachineryFishing and Fishing Products
Leather and Related ProductsForest Products
Lighting and Electrical EquipmentApparel
BiopharmaceuticalsConstruction Materials
Oil and Gas Products and ServicesAgricultural Products
Medical DevicesInformation Technology
Pow er Generation and TransmissionProduction Technology
Chemical ProductsMetal Manufacturing
Communications EquipmentPlastics
AutomotiveEntertainment
Building Fixtures, Equipment and ServicesPublishing and Printing
Education and Know ledge CreationHeavy Construction Services
Financial ServicesAnalytical Instruments
Processed FoodTransportation and Logistics
Hospitality and TourismDistribution Services
Business Services
42April 2010 – NJ Governor Christie Copyright © 2010 Professor Michael E. Porter
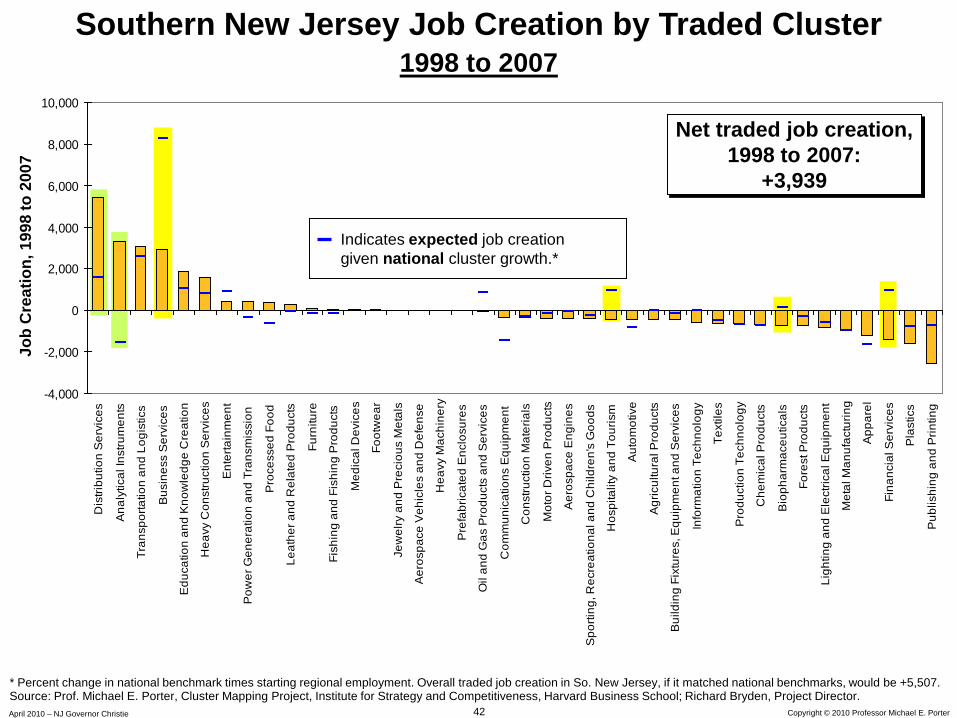
Southern New Jersey Job Creation by Traded Cluster1998 to 2007
Job
Cre
atio
n, 1
998
to 2
007
-4,000
-2,000
0
2,000
4,000
6,000
8,000
10,000D
istri
butio
n S
ervi
ces
Ana
lytic
al In
stru
men
ts
Tran
spor
tatio
n an
d Lo
gist
ics
Bus
ines
s S
ervi
ces
Edu
catio
n an
d K
now
ledg
e C
reat
ion
Hea
vy C
onst
ruct
ion
Ser
vice
s
Ent
erta
inm
ent
Pow
er G
ener
atio
n an
d Tr
ansm
issi
on
Pro
cess
ed F
ood
Leat
her a
nd R
elat
ed P
rodu
cts
Furn
iture
Fish
ing
and
Fish
ing
Pro
duct
s
Med
ical
Dev
ices
Foot
wea
r
Jew
elry
and
Pre
ciou
s M
etal
s
Aer
ospa
ce V
ehic
les
and
Def
ense
Hea
vy M
achi
nery
Pre
fabr
icat
ed E
nclo
sure
s
Oil
and
Gas
Pro
duct
s an
d S
ervi
ces
Com
mun
icat
ions
Equ
ipm
ent
Con
stru
ctio
n M
ater
ials
Mot
or D
riven
Pro
duct
s
Aer
ospa
ce E
ngin
es
Spo
rting
, Rec
reat
iona
l and
Chi
ldre
n's
Goo
ds
Hos
pita
lity
and
Tour
ism
Aut
omot
ive
Agr
icul
tura
l Pro
duct
s
Bui
ldin
g Fi
xtur
es, E
quip
men
t and
Ser
vice
s
Info
rmat
ion
Tech
nolo
gy
Text
iles
Pro
duct
ion
Tech
nolo
gy
Che
mic
al P
rodu
cts
Bio
phar
mac
eutic
als
Fore
st P
rodu
cts
Ligh
ting
and
Ele
ctric
al E
quip
men
t
Met
al M
anuf
actu
ring
App
arel
Fina
ncia
l Ser
vice
s
Pla
stic
s
Pub
lishi
ng a
nd P
rintin
g
Net traded job creation, 1998 to 2007:
+3,939
Indicates expected job creation given national cluster growth.*
Source: Prof. Michael E. Porter, Cluster Mapping Project, Institute for Strategy and Competitiveness, Harvard Business School; Richard Bryden, Project Director.* Percent change in national benchmark times starting regional employment. Overall traded job creation in So. New Jersey, if it matched national benchmarks, would be +5,507.
43April 2010 – NJ Governor Christie Copyright © 2010 Professor Michael E. Porter
$0 $25,000 $50,000 $75,000 $100,000 $125,000
ApparelFootwearFurnitureTextiles
Prefabricated EnclosuresSporting, Recreational and Children's
Motor Driven ProductsOil and Gas Products and Services
BiopharmaceuticalsAerospace Vehicles and Defense
Power Generation and TransmissionEntertainment
Medical DevicesAgricultural Products
Hospitality and TourismLeather and Related Products
Processed FoodTransportation and Logistics
Forest ProductsPlastics
Construction MaterialsJewelry and Precious Metals
Metal ManufacturingAutomotive
Building Fixtures, Equipment and ServicesHeavy Machinery
Education and Knowledge CreationAnalytical Instruments
Publishing and PrintingLighting and Electrical Equipment
Distribution ServicesHeavy Construction Services
Information TechnologyBusiness Services
Fishing and Fishing ProductsFinancial Services
Production TechnologyChemical Products
Communications Equipment
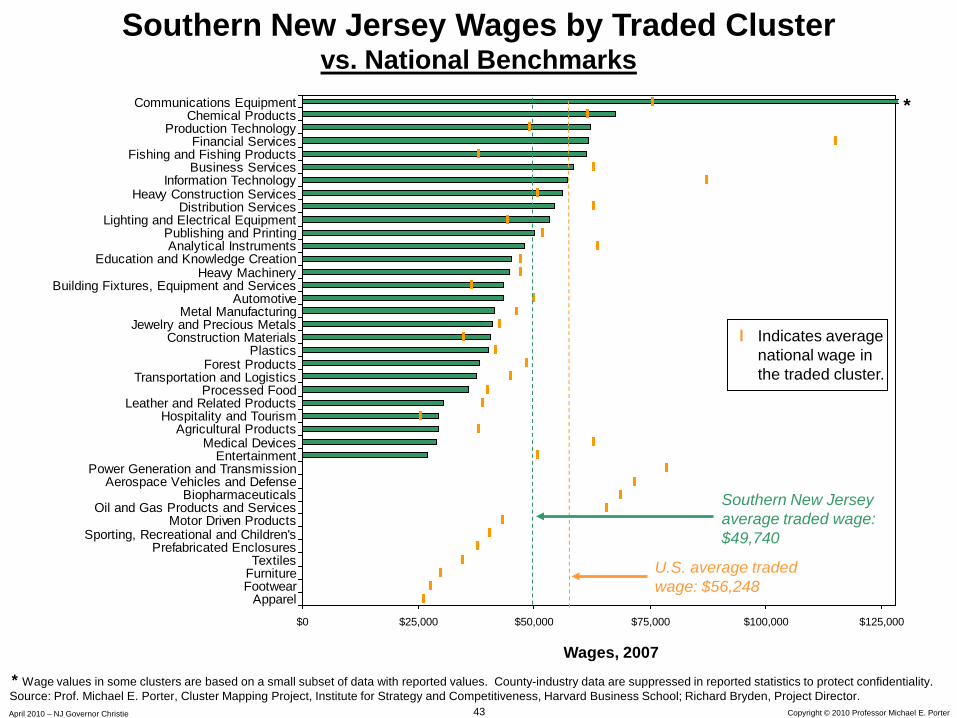
Southern New Jersey Wages by Traded Clustervs. National Benchmarks
Wages, 2007
Southern New Jersey average traded wage: $49,740
l Indicates average national wage in the traded cluster.
Source: Prof. Michael E. Porter, Cluster Mapping Project, Institute for Strategy and Competitiveness, Harvard Business School; Richard Bryden, Project Director.
U.S. average traded wage: $56,248
*
* Wage values in some clusters are based on a small subset of data with reported values. County-industry data are suppressed in reported statistics to protect confidentiality.