new jersey jersey department of ... 3 823 81 -90% -742 n % points pre post change loss of 2,938...
TRANSCRIPT

New JerseyDepartment of Environmental Protection
Bob Martin, Commissioner
Division of Fish & WildlifeDave Chanda, Director
Larry Herrighty, Assistant Director
Bureau of Wildlife ManagementPatrick C. Carr, Supervising Biologist
Deer Research ProjectCarole Kandoth, Project Leader

Request to include Zones 28, 30, 31, 34 & 47 in APR program.
Upcoming hunter survey on APR.
Present data from existing APR zones.
Fish & GameCouncil
Division Biologists
Data collected from field work, harvest, surveys.Input from hunters, farmers, conservationists,
homeowners, and otherinterested parties.
Possible regulatory change?
Game Code – 2 yr cycle
Quality Deer Management:
“Protection of younger bucks.”“Protection of younger bucks.”
“Quality Deer Management (QDM) is a management philosophy/practicethat unites landowners, hunters, and managers in a common goal ofproducing biologically and socially balanced deer herds within existingenvironmental, social, and legal constraints.” QDMA
“Adequate harvest of female deer to maintain a“Adequate harvest of female deer to maintain ahealthy population in balance with existinghealthy population in balance with existinghabitat conditions and landowner desires.”habitat conditions and landowner desires.”
Proper habitat management.Proper habitat management.

NJ’s APR Program
Instituted in 2000.
3 points per side.
Zone 6 removed in 2007.
Northvs.
South
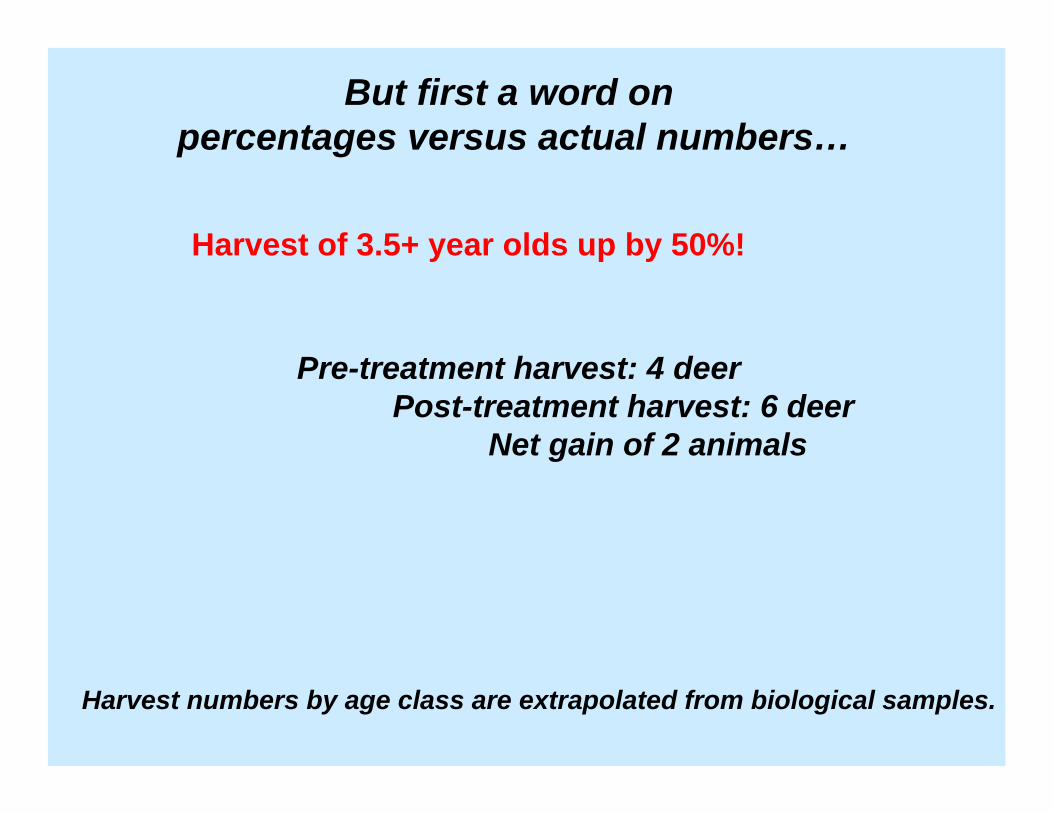
But first a word on percentages versus actual numbers…
Harvest of 3.5+ year olds up by 50%!
Pre-treatment harvest: 4 deerPost-treatment harvest: 6 deer
Net gain of 2 animals
Harvest numbers by age class are extrapolated from biological samples.
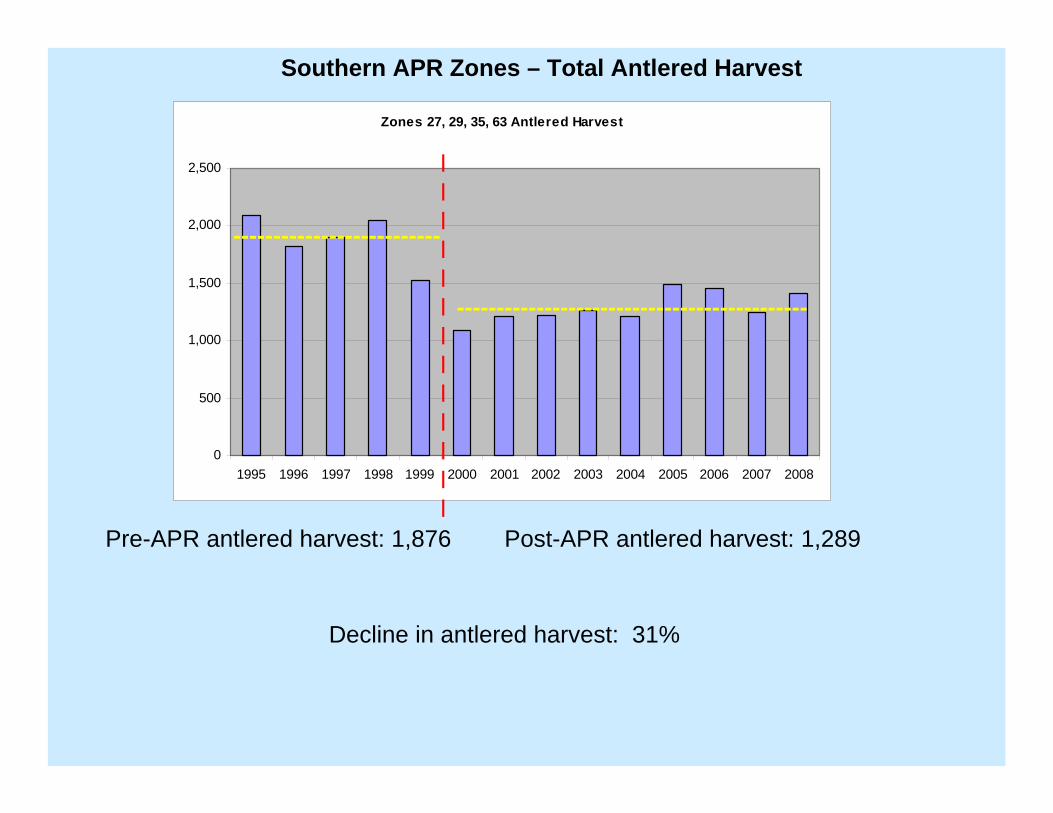
Zones 27, 29, 35, 63 Antlered Harvest
0
500
1,000
1,500
2,000
2,500
1995 1996 1997 1998 1999 2000 2001 2002 2003 2004 2005 2006 2007 2008
lllllllllllll
--------------------------
Pre-APR antlered harvest: 1,876
--------------------------------------------
Post-APR antlered harvest: 1,289
Southern APR Zones – Total Antlered Harvest
Decline in antlered harvest: 31%

Southern APR Zones – Age Class by Percentage of Total Antlered Harvest
APR Zones 27, 29, 35, 63
0%
10%
20%
30%
40%
50%
60%
70%
80%
1995 1996 1997 1998 1999 2000 2001 2002 2003 2004 2005 2006
1.5 yr old 2.5 yr old 3.5 yr old
lllllllllllll

Southern APR Zones – Age Class by Percentage of Total Antlered Harvest
Southern APR Zones
0%
10%
20%
30%
40%
50%
60%
70%
80%
90%
1995 1996 1997 1998 1999 2000 2001 2002 2003 2004 2005 2006
1.5 yr old 2.5 yr old 3.5 yr old
Linear (1.5 yr old) Linear (2.5 yr old) Linear (3.5 yr old)

APR Zones 27, 29, 35, 63 – Age Class by NumberNumber 1.5 yr olds harvested
0
200
400
600
800
1000
1200
1400
1600
1800
1995 1996 1997 1998 1999 2000 2001 2002 2003 2004 2005 2006
llllllll
--------------------Avg. Yearling Harvest
Pre-APR Harvest: 1,325 Post-APR Harvest: 613
-------------------------
Avg. 2.5 yr old Harvest
Pre-APR Harvest: 456Post-APR Harvest: 486
Number 2.5 yr olds harvested
0
200
400
600
800
1000
1200
1400
1600
1800
1995 1996 1997 1998 1999 2000 2001 2002 2003 2004 2005 2006
lllllll
----------------- ------------------------Number 3.5+ yr olds harvested
0
200
400
600
800
1000
1200
1400
1600
1800
1995 1996 1997 1998 1999 2000 2001 2002 2003 2004 2005 2006
llllllll
Avg. 3.5+ yr old Harvest
Pre-APR Harvest: 95Post-APR Harvest: 179
------------------ ------------------------

1,2781,876Total
+84179953.5+
+304864562.5
-7126131,3251.5
N changePost-APRPre-APRAge Class
APR Zones 27, 29, 35, 63 – Age Class by Number
-712 + 114 = -598 (average number of bucks lost to harvest per year in the southern APR zones.)
On 361 sq. miles of deer range, that’s 1.7 bucks per sq. mile not harvested.

APR Zones 27, 29, 35, 63 – Harvest by Antler Points
-1-100%0118
1100%1017
00%1116
00%1115
-2-50%2414
00%4413
210%232112
1643%533711
1611%16514910
4015%3152759
111%128412738
-206-22%7289347
-523-33%103915626
-381-35%70510865
-1083-85%19412774
-742-90%818233
N%
changePOSTPREPoints
Loss of 2,938 bucks ≤ 7 pointsGain of 86 bucks with ≥ 8 points
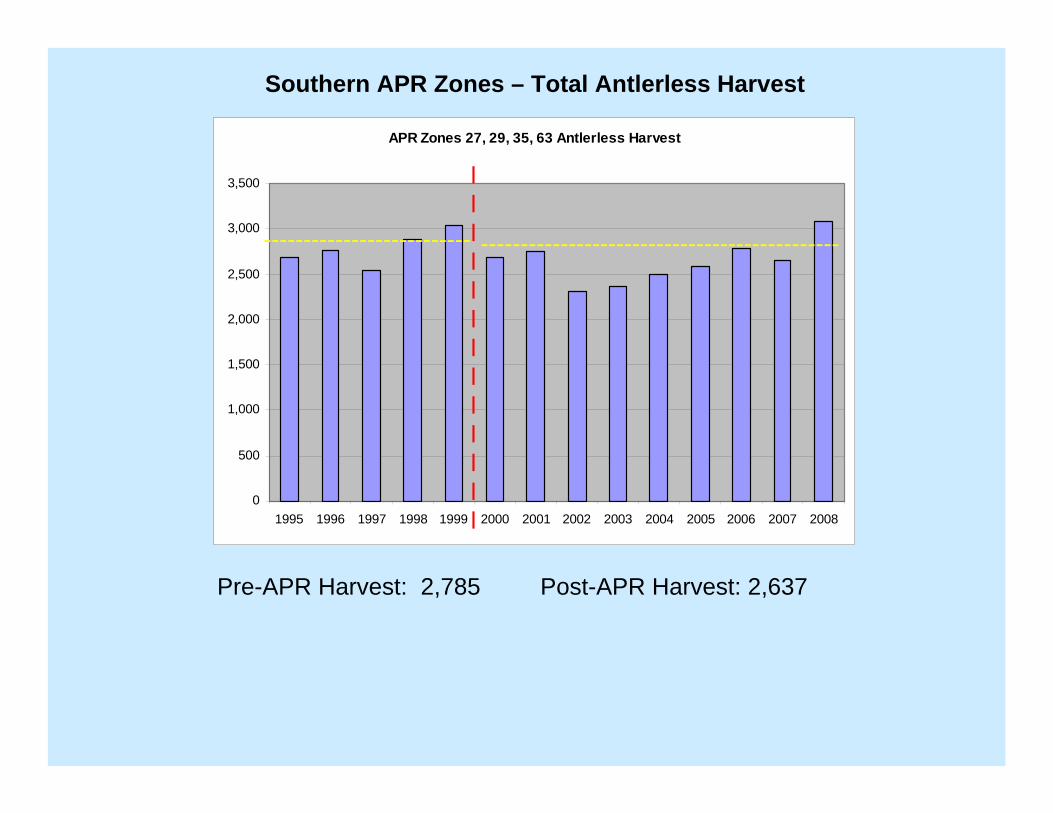
APR Zones 27, 29, 35, 63 Antlerless Harvest
0
500
1,000
1,500
2,000
2,500
3,000
3,500
1995 1996 1997 1998 1999 2000 2001 2002 2003 2004 2005 2006 2007 2008
Southern APR Zones – Total Antlerless Harvest
lllllllllllll
--------------------------
Pre-APR Harvest: 2,785 Post-APR Harvest: 2,637
---------------------------------------------
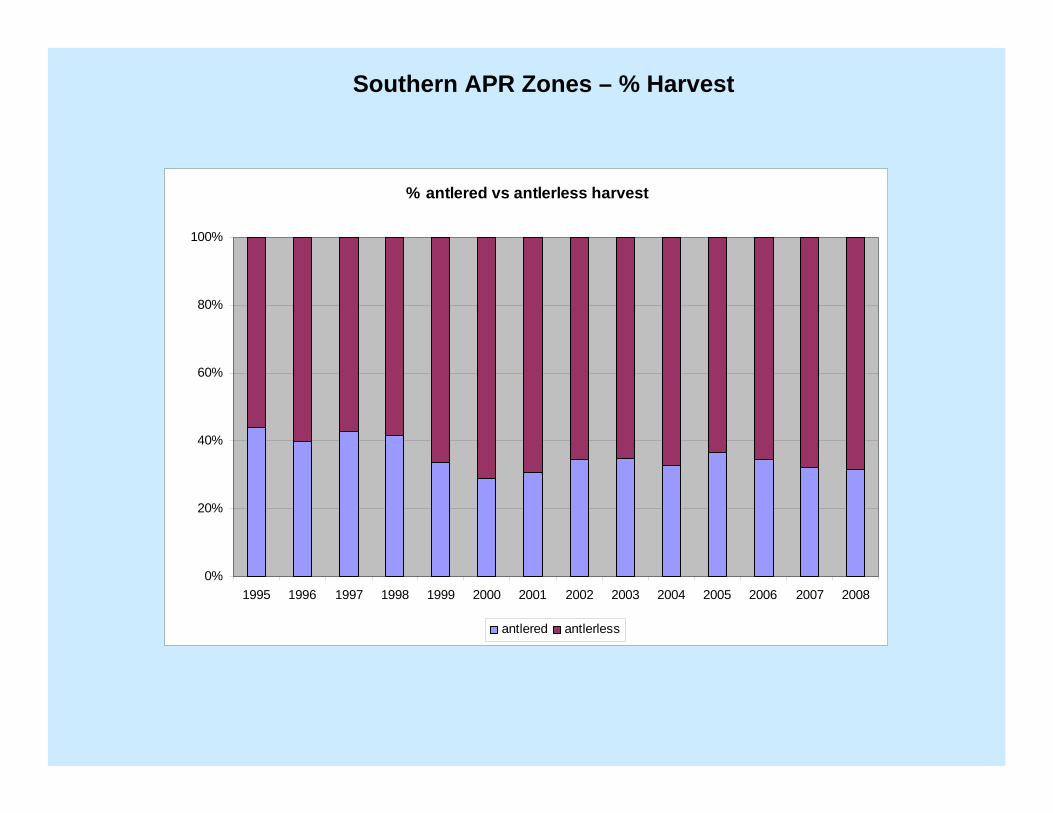
% antlered vs antlerless harvest
0%
20%
40%
60%
80%
100%
1995 1996 1997 1998 1999 2000 2001 2002 2003 2004 2005 2006 2007 2008
antlered antlerless
Southern APR Zones – % Harvest

Total Antlered Harvest by Zone for existing APRZone 27 Antlered Harvest
0
100
200
300
400
500
600
1995 1996 1997 1998 1999 2000 2001 2002 2003 2004 2005 2006 2007 2008
Zone 29 Antlered Harvest
0
100
200
300
400
500
600
1995 1996 1997 1998 1999 2000 2001 2002 2003 2004 2005 2006 2007 2008
Zone 35 Antlered Harvest
0
100
200
300
400
500
600
700
800
900
1995 1996 1997 1998 1999 2000 2001 2002 2003 2004 2005 2006 2007 2008
Zone 63 Antlered Harvest
0
50
100
150
200
250
300
1995 1996 1997 1998 1999 2000 2001 2002 2003 2004 2005 2006 2007 2008
lllllll
lllllll
lllllll
lllllll
------------------ ------------------
------------------------------------
Pre-APR antlered harvest: 476 Post-APR antlered harvest: 339 Pre-APR antlered harvest: 481
Pre-APR antlered harvest: 729 Pre-APR antlered harvest: 190
Post-APR antlered harvest: 343
Post-APR antlered harvest: 501 Post-APR antlered harvest: 119
------------------------------- -------------------------------
--------------------------------------------------------------
29% decline in antlered harvest 29% decline in antlered harvest
31% decline in antlered harvest 37% decline in antlered harvest

Age Class by Percentage of Total Antlered Harvest for existing APR
Zone 27 Aged Antlered Harvest
0%
10%
20%
30%
40%
50%
60%
70%
80%
1995 1996 1997 1998 1999 2000 2001 2002 2003 2004 2005 2006
1.5 yr old 2.5 yr old 3.5+ yr old
Zone 29 Aged Antlered Harvest
0%10%20%30%40%50%60%70%80%90%
1995 1996 1997 1998 1999 2000 2001 2002 2003 2004 2005 2006
1.5 yr old 2.5 yr old 3.5+ yr old
Zone 35 Aged Antlered harvest
0%
10%
20%
30%
40%
50%
60%
70%
80%
90%
1995 1996 1997 1998 1999 2000 2001 2002 2003 2004 2005 2006
1.5 yr old 2.5 yr old 3.5 yr old
Zone 63 Aged Antlered Harvest
0%
10%
20%
30%
40%
50%
60%
70%
80%
90%
1995 1996 1997 1998 1999 2000 2001 2002 2003 2004 2005 2006
1.5 yr old 2.5 yr old 3.5+ yr old

Age Class by Percentage of Total Antlered Harvest for existing APR
Zone 27 Aged Antlered Harvest
0%
10%
20%
30%
40%
50%
60%
70%
80%
1995 1996 1997 1998 1999 2000 2001 2002 2003 2004 2005 2006
1.5 yr old 2.5 yr old 3.5+ yr old Line a r (1.5 yr old) Line a r (2.5 yr old) Line a r (3.5+ yr old)
Zone 29 Aged Antlered Harvest
0%10%20%30%40%50%60%70%80%90%
1995 1996 1997 1998 1999 2000 2001 2002 2003 2004 2005 2006
1.5 yr old 2.5 yr old 3.5+ yr old
Linear (1.5 yr old) Linear (2.5 yr old) Linear (3.5+ yr old)
Zone 35 Aged Antlered harvest
0%
10%
20%
30%
40%
50%
60%
70%
80%
90%
1995 1996 1997 1998 1999 2000 2001 2002 2003 2004 2005 2006
1.5 yr old 2.5 yr old 3.5 yr old Line a r (1.5 yr old) Linea r (2.5 yr old) Line a r (3.5 yr old)
Zone 63 Aged Antlered Harvest
0%
10%
20%
30%
40%
50%
60%
70%
80%
90%
1995 1996 1997 1998 1999 2000 2001 2002 2003 2004 2005 2006
1.5 yr old 2.5 yr old 3.5+ yr old Line a r (1.5 yr old) Line a r (2.5 yr old) Linea r (3.5+ yr old)

-152342494Total
+3350173.5+
+31451422.5
-1881473351.5
N changePost-APRPre-APRAge Class
APR Zone 27 – Age Class by Number
-188 + 36 = -152 (average number of bucks lost to harvest per year in Zone 27.)
On 103 sq. miles of deer range, that’s 1.5 bucks per sq. mile not harvested.
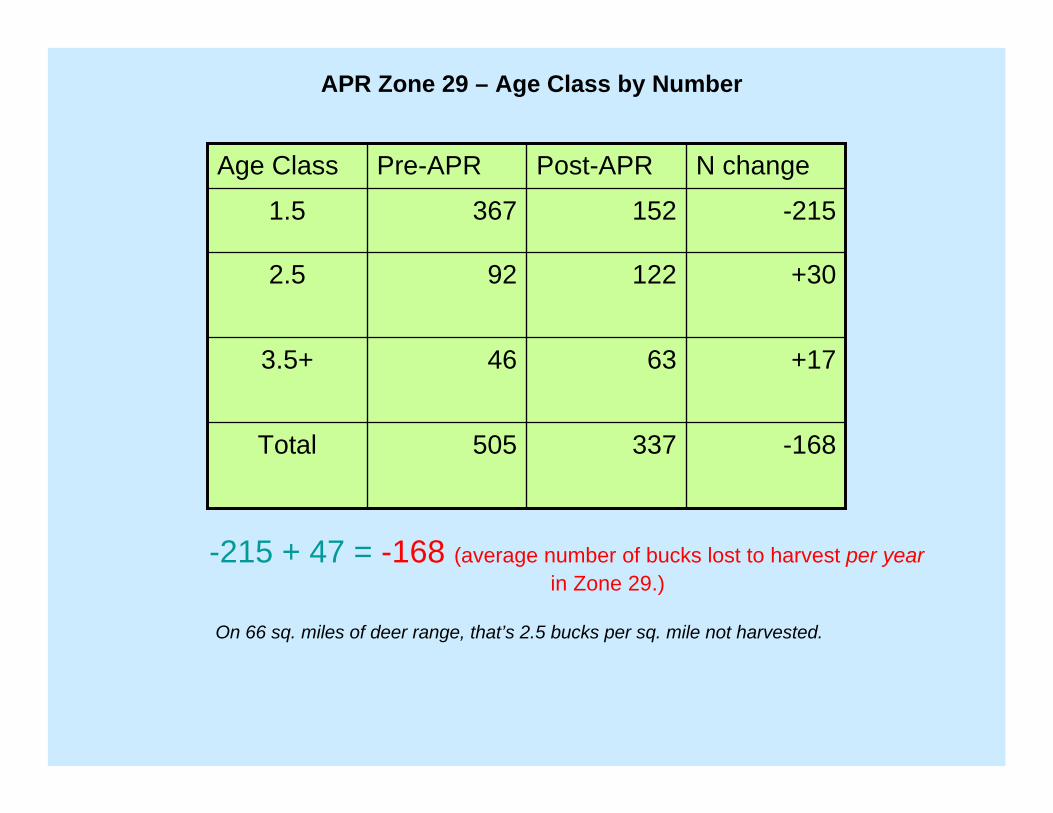
-168337505Total
+1763463.5+
+30122922.5
-2151523671.5
N changePost-APRPre-APRAge Class
APR Zone 29 – Age Class by Number
-215 + 47 = -168 (average number of bucks lost to harvest per year in Zone 29.)
On 66 sq. miles of deer range, that’s 2.5 bucks per sq. mile not harvested.

-258494752Total
+1650343.5+
-371732102.5
-2372715081.5
N changePost-APRPre-APRAge Class
APR Zone 35 – Age Class by Number
-274 + 16 = -258 (average number of bucks lost to harvest per year in Zone 35.)
On 171 sq. miles of deer range, that’s 1.5 bucks per sq. mile not harvested.

-105105210Total
+616103.5+
046462.5
-111431541.5
N changePost-APRPre-APRAge Class
APR Zone 63 – Age Class by Number
-111 + 6 = -105 (average number of bucks lost to harvest per year in Zone 63.)
On 21 sq. miles of deer range, that’s 5 bucks per sq. mile not harvested.

Recap of existing south Jersey APR Zones:
Average %s of bucks in harvest by Age Class:
14%38%48%all south
15%44%41%63
10%35%55%35
19%36%45%29
15%42%43%27
3.5+2.51.5
Average reduction in antlered harvest: 31%
For every 6.25 yearlings passed up, 1 older age class buck appears in the harvest.
Loss of 712 yearlings, gain of 114 older age class bucks.
84% of “saved” yearlings do NOT show up in harvest.
5%24%71%all south
4%22%73%63
4%27%69%35
9%17%74%29
4%28%69%27
3.5+2.51.5
Pre-APR Post-APR

Will Antler Point Restrictions Produce Trophy Bucks?
1. Age at maturity.
2. “High-grading”.
Mississippi data shows a decrease in gross B&C scores of5" to 9" for 2.5 yr olds, and 10" to 17" for 3.5 yr olds.

Where have all the yearlings gone…?
- sub-legal bucks being checkedin adjacent zones?
Surrounding Zones' Average Annual Yearling HarvestsZone Pre-APR Post-APR n diff25 288 326 3828 266 331 6530 126 117 -931 78 90 12
Total 106
Surrounding Zones' Average Annual Antlered HarvestsZone Pre-APR Post-APR n diff25 516 478 -3828 431 484 5330 209 194 -1531 135 142 7
Total 7
598 yearlings do not show upin harvest as older age class bucks
Cars, refugia, smarter!

Where have all the yearlings gone…?
NJ Deer Population Estimate
0
50,000
100,000
150,000
200,000
250,000
1988
1991
1994
1997
2000
2003
2006
Pop estharvest
- reduction in overall population?

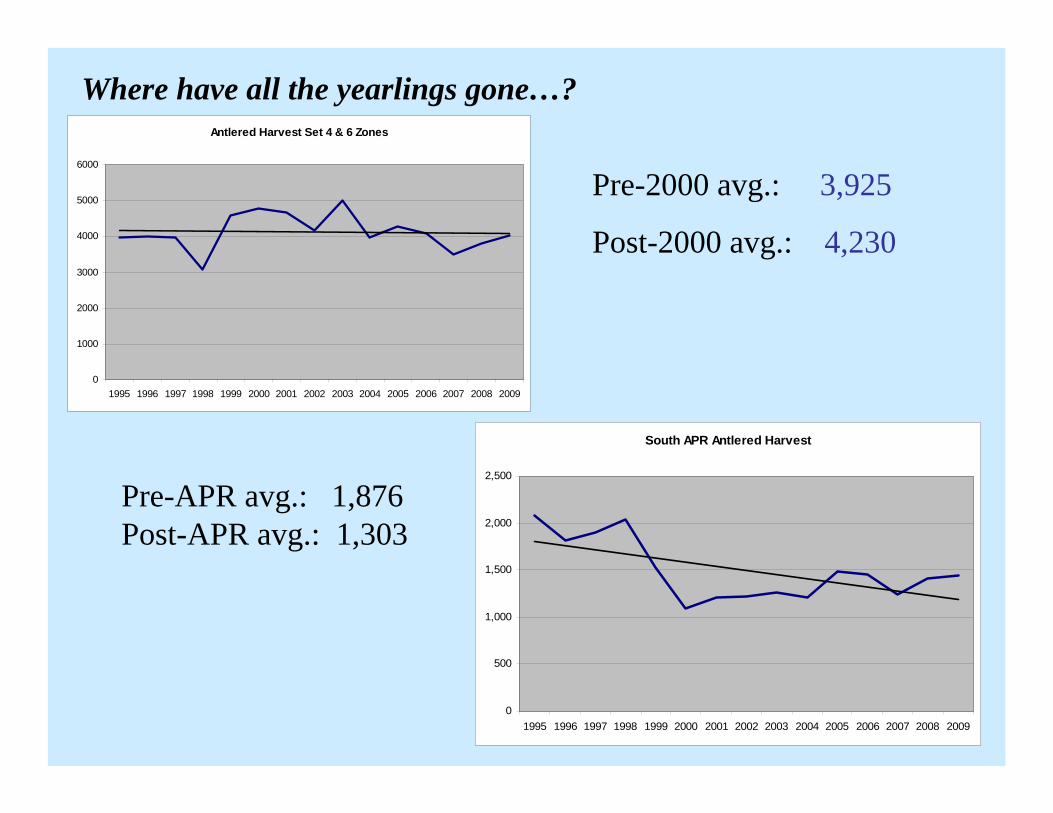
Where have all the yearlings gone…?Antlered Harvest Set 4 & 6 Zones
0
1000
2000
3000
4000
5000
6000
1995 1996 1997 1998 1999 2000 2001 2002 2003 2004 2005 2006 2007 2008 2009
South APR Antlered Harvest
0
500
1,000
1,500
2,000
2,500
1995 1996 1997 1998 1999 2000 2001 2002 2003 2004 2005 2006 2007 2008 2009
Pre-2000 avg.: 3,925
Post-2000 avg.: 4,230
Pre-APR avg.: 1,876Post-APR avg.: 1,303

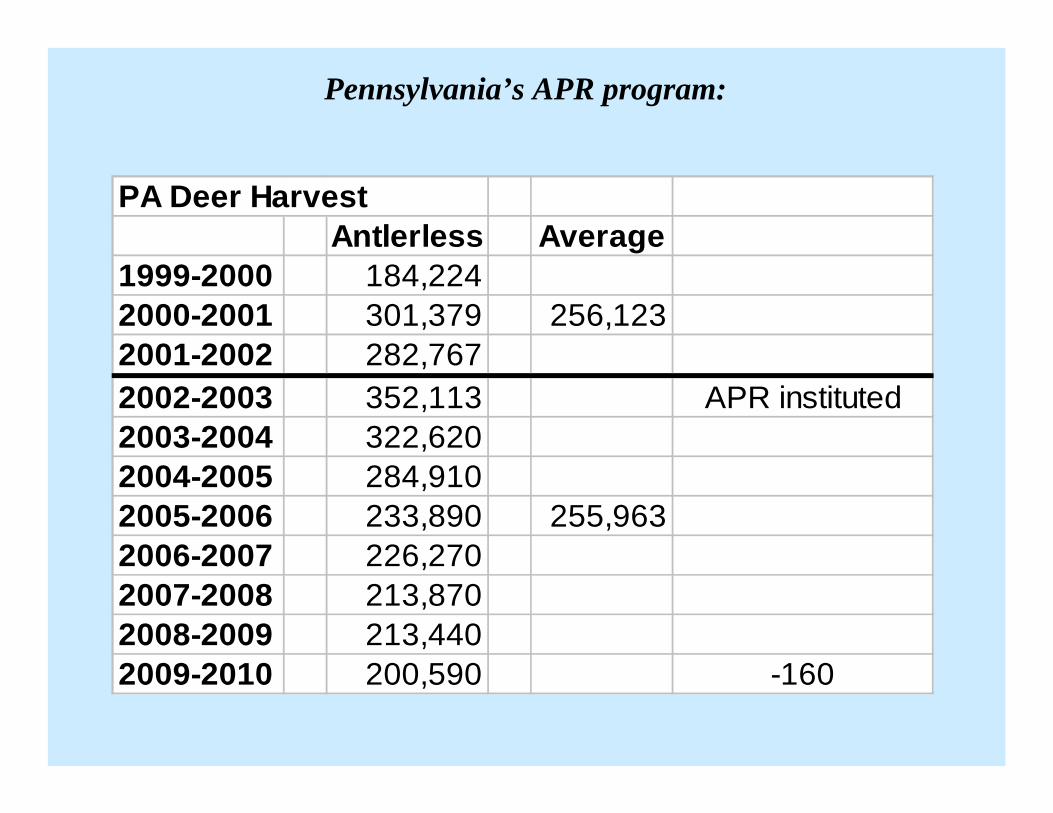
Pennsylvania’s APR program:
PA Deer Harvest
Antlered Average
%age Yearling Bucks in Antlered
Harvest1999-2000 194,3682000-2001 203,221 200,2792001-2002 203,247 78%2002-2003 165,416 APR instituted 68%2003-2004 142,270 56%2004-2005 124,410 50%2005-2006 120,500 128,478 -36% 52%2006-2007 135,290 71,800 56%2007-2008 109,200 56%2008-2009 122,410 52%2009-2010 108,330 49%
Pennsylvania’s APR program:
PA Deer HarvestAntlerless Average
1999-2000 184,2242000-2001 301,379 256,1232001-2002 282,7672002-2003 352,113 APR instituted2003-2004 322,6202004-2005 284,9102005-2006 233,890 255,9632006-2007 226,2702007-2008 213,8702008-2009 213,4402009-2010 200,590 -160

Proposed APR – Zone 28
Zone 28 Antlered Harvest by Age Class
0%10%20%30%40%50%60%70%80%
1995 1996 1997 1998 1999 2000 2001 2002 2003 2004 2005 2006
1.5 2.5 3.5+
Deer Management Zone 28
0
200
400
600
800
1000
1200
Num
ber
of d
eer
harv
este
d
Antlered 552 514 472 498 443 497 509 404 471 492
Antlerle ss 961 1035 719 951 876 839 686 600 715 831
Buck goal 315 315 315 370 375 375 375 375 375 500 500
Strategy Decrease Decrease Decrease Decrease Decrease Decrease Decrease Decrease Decrease Stabilize Stabilize
2000 2001 2002 2003 2004 2005 2006 2007 2008 2009 2010
Reg Set 4
Deer Range = 125 sq.mi.
Extended A & B since 2003
EHD
2007 Deer Density: 30.6

Proposed APR – Zone 28
Zone 28 Antlered Harvest
0
100
200
300
400
500
600
1995 1996 1997 1998 1999 2000 2001 2002 2003 2004 2005 2006 2007 2008
Current average antlered harvest: 465465
Predicted average antlered harvest under APR: 321
Net loss of ~ 144 yearling bucks per year. Net gain of ~ 23 older age class bucks per year.
-----------------------------------------------------
-----------------------------------------------------

Proposed APR – Zone 30
Deer Management Zone 30
050
100150200250300350
Num
ber
of d
eer
harv
este
d
Antlered 212 160 183 226 179 205 217 198 170 157
Antlerless 333 284 248 275 247 208 209 192 240 236
Buck goal 170 170 170 170 151 151 151 151 151 215 215
Strategy Stabilize Stabilize Stabilize Stabilize Decrease Decrease Decrease Decrease Decrease Stabilize Stabilize
2000 2001 2002 2003 2004 2005 2006 2007 2008 2009 2010
Reg Set 3
Deer Range = 43 sq.mi.
2007 Deer Density: 23.2
Zone 30 Antlered Harvest by Age Class
0%
10%
20%
30%
40%
50%
60%
70%
80%
1995 1996 1997 1998 1999 2000 2001 2002 2003 2004 2005 2006
1.5 2.5 3.5+
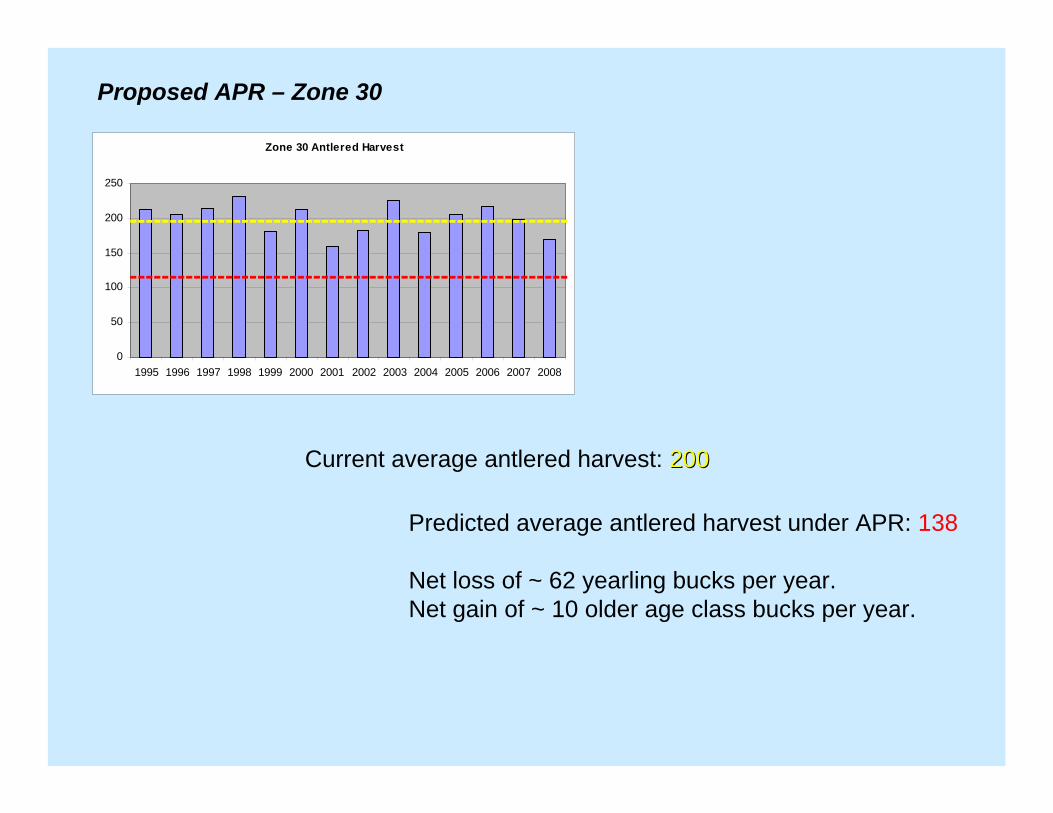
Proposed APR – Zone 30
Zone 30 Antlered Harvest
0
50
100
150
200
250
1995 1996 1997 1998 1999 2000 2001 2002 2003 2004 2005 2006 2007 2008
Current average antlered harvest: 200200
Predicted average antlered harvest under APR: 138
Net loss of ~ 62 yearling bucks per year.Net gain of ~ 10 older age class bucks per year.
-------------------------------------------------------
-------------------------------------------------------

Proposed APR – Zone 31
Deer Management Zone 31
0
100
200
300
400
500
Num
ber
of d
eer
harv
este
d
Antlered 168 156 118 179 123 150 133 102 148 152
Antlerless 202 413 277 449 324 337 272 224 205 283
Buck goal 110 110 110 99 100 100 100 100 100 120 120
Strategy Stabilize Stabilize Stabilize Decrease Decrease Decrease Decrease Decrease Decrease Stabilize Stabilize
2000 2001 2002 2003 2004 2005 2006 2007 2008 2009 2010
Reg Set 4
Deer Range = 40 sq.mi.
Extended A & B since 2003
Unlimited Antlerless since 2001
2007 Deer Density: 12.3
Zone 31 Antlered Harvest by Age Class
0%
10%
20%
30%
40%
50%
60%
70%
80%
90%
1995 1996 1997 1998 1999 2000 2001 2002 2003 2004 2005 2006
1.5 2.5 3.5+
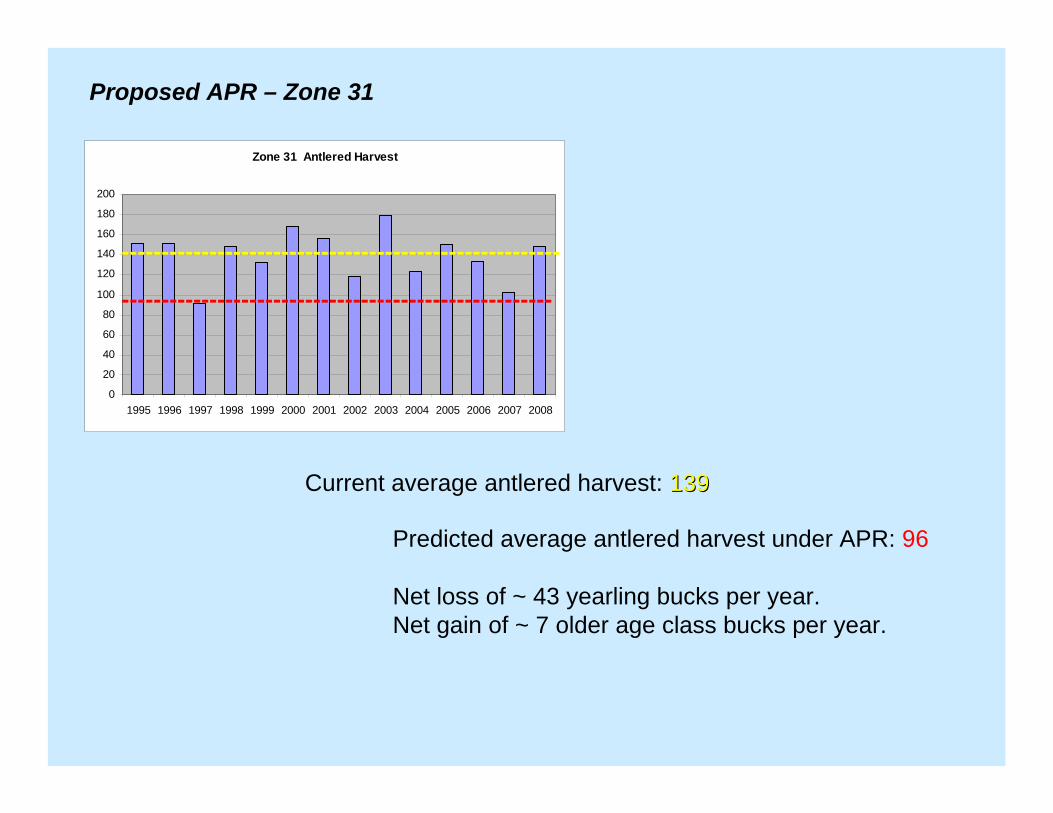
Proposed APR – Zone 31
Zone 31 Antlered Harvest
0
20
40
60
80
100
120
140
160
180
200
1995 1996 1997 1998 1999 2000 2001 2002 2003 2004 2005 2006 2007 2008
Current average antlered harvest: 139139
Predicted average antlered harvest under APR: 96
Net loss of ~ 43 yearling bucks per year.Net gain of ~ 7 older age class bucks per year.
-------------------------------------------------------
------------------------------------------------------

Proposed APR – Zone 34
Deer Management Zone 34
0100200300400500600700
Num
ber
of d
eer
harv
este
d
Antlered 494 457 350 646 357 451 328 323 287 348
Antlerless 638 587 457 561 438 445 318 373 394 258
Buck goal 390 390 390 390 340 340 340 340 340 291 291
Strategy Decrease Decrease Decrease Decrease Decrease Decrease Decrease Decrease Decrease Increase Increase
2000 2001 2002 2003 2004 2005 2006 2007 2008 2009 2010
Moved from Reg Set 3 to Regulation Set 0 in 2009-10
Deer Range = 97 sq.mi.
2007 Deer Density: 14.8
Zone 34 Antlered Harvest by Age Class
0%
10%
20%
30%
40%
50%
60%
70%
1995 1996 1997 1998 1999 2000 2001 2002 2003 2004 2005 2006
1.5 2.5 3.5+

Proposed APR – Zone 34
Zone 34 Antlered Harvest
0
100
200
300
400
500
600
700
1995 1996 1997 1998 1999 2000 2001 2002 2003 2004 2005 2006 2007 2008
Current average antlered harvest: 447447
Predicted average antlered harvest under APR: 308
Net loss of ~ 139 yearling bucks per year.Net gain of ~ 22 older age class bucks per year.
-----------------------------------------------------------------------------------------------------------

Proposed APR – Zone 47
Deer Management Zone 47
050
100150200250300350
Num
ber
of d
eer
harv
este
d
Antlered 113 164 101 143 111 129 97 112 120 125
Antlerless 246 298 253 257 206 189 117 129 160 184
Buck goal 85 85 85 81 81 81 81 81 81 81 81
Strategy Decrease DecreaseDecrease Decrease Decrease DecreaseDecrease Decrease Decrease DecreaseDecrease
2000 2001 2002 2003 2004 2005 2006 2007 2008 2009 2010
Reg Set 4
Buck goal = 1.5 bu cks per square mile .
Deer Range = 54 sq.mi.
Extended A & B since 20 03
EHD
2007 Deer Density: 14.6
Zone 47 Antlered Harvest by Age Class
0%10%20%30%40%50%60%70%80%90%
1995 1996 1997 1998 1999 2000 2001 2002 2003 2004 2005 2006
1.5 2.5 3.5+

Proposed APR – Zone 47
Zone 47 Antlered Harvest
0
20
40
60
80
100
120
140
160
180
1995 1996 1997 1998 1999 2000 2001 2002 2003 2004 2005 2006 2007 2008
Current average antlered harvest: 127127
Predicted average antlered harvest under APR: 88
Net loss of ~ 39 yearling bucks per year.Net gain of ~ 6 older age class bucks per year.
------------------------------------------------------------------------------------------------------------
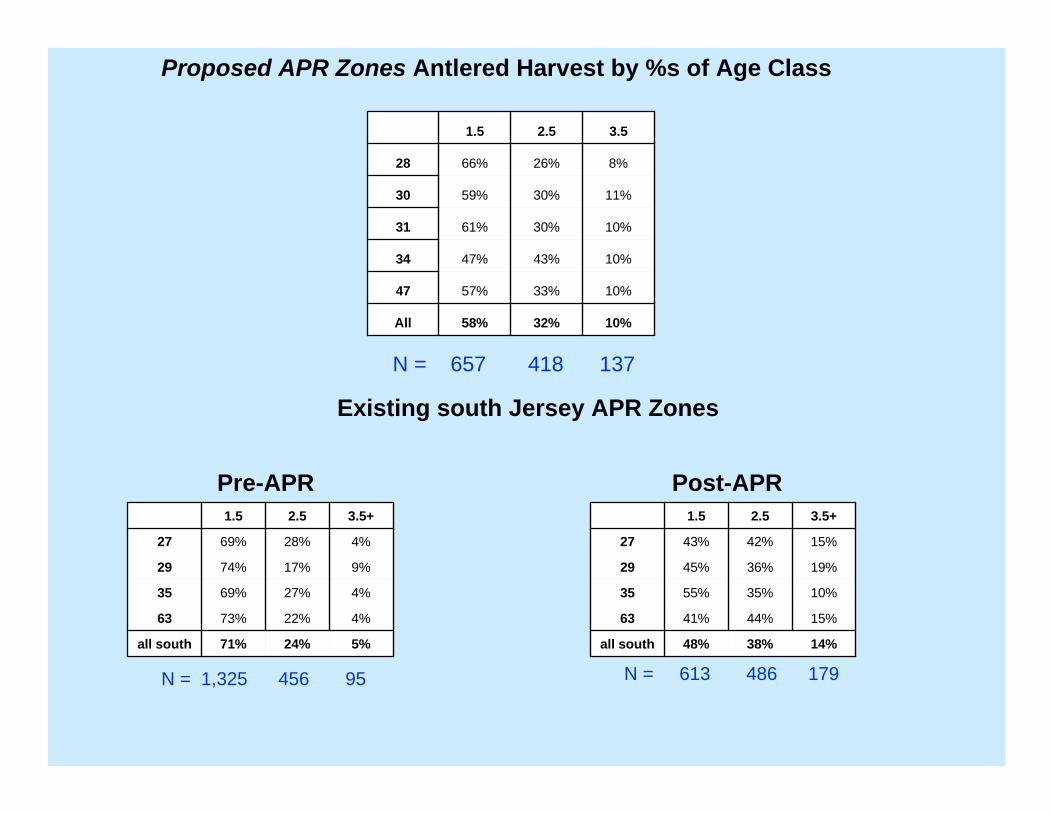
Proposed APR Zones Antlered Harvest by %s of Age Class
Existing south Jersey APR Zones
Pre-APR
5%24%71%all south
4%22%73%63
4%27%69%35
9%17%74%29
4%28%69%27
3.5+2.51.5
10%32%58%All
10%33%57%47
10%43%47%34
10%30%61%31
11%30%59%30
8%26%66%28
3.52.51.5
Post-APR
14%38%48%all south
15%44%41%63
10%35%55%35
19%36%45%29
15%42%43%27
3.5+2.51.5
N = 657 418 137
N = 1,325 456 95 N = 613 486 179

substantially abovestandard>19.0
above standard>17.0<19.0
standard>15.0<17.0
below standard<15.0
Aaron Moen
Condition ratingYearling antler beam
diameter
10%32%58%All
10%33%57%47
10%43%47%34
10%30%61%31
11%30%59%30
8%26%66%28
3.52.51.5
Proposed APR Zones Antlered Harvest by %s of Age Class
17.03 Zone 47
13.03Zone 34
16.67Zone 31
14.99Zone 30
19.31 Zone 28
5 yravg
ProposedZones
21.296 Zone 63
21.382Zone 35
19.962Zone 29
20.814 Zone 27
5 yravg
ExistingZones
Habitat!Mast-dependence

1,2781,876Total
+84179953.5+
+304864562.5
-7126131,3251.5
N changePost-APRPre-APRAge Class
Existing APR Zones 27, 29, 35, 63 – Age Class by Number
-712 + 114 = -598 (average number of bucks lost to harvest per year in the southern APR zones.)
- 116%
+ 7%
+ 88%
On 361 sq. miles of deer range, that’s 1.7 bucks per sq. mile not harvested.
On 361 sq. miles of deer range, that’s <1/3 older age class buck per sq. mile harvested. (1 older buck ~>3 miles)

In Conclusion… Division of Fish & Wildlife supports QDM
on private lands where supported by quality habitat.
APR has positives & negatives:
Positives- harvest of older age class bucks increase.- increase in higher point classes
Negatives
- decrease in overall buck harvest- number of older age classes did not equal number ofyearlings saved.- increase in higher point classes did not equal decrease inlower point classes.

Questions?
Contact:Biologist Joe Leskie609-748-2043