new jersey water resources research institute … jersey water resources research institute annual...
TRANSCRIPT

New Jersey Water Resources Research Institute Annual Technical Report
FY 2003
IntroductionThe New Jersey Water Resources Research Institute continues to support a diverse program of researchprojects and information transfer activities. Research projects emphasize studies of pollutant fate andtransport, reflecting the primary pool of expertise in the state, and involve studies of arsenic, selenium,halogenated organic compounds, and volatile organic compounds. However, several projects in aquaticecology have also been supported. As in previous years, most of the Federal grant money was used tosupport research; two faculty researchers were funded to carry out substantial research projects, and fivegraduate students were supported with grants-in-aid. In addition, a small amount of funding was availablefor an undergraduate project. We continued to publish the newsletter, and hosted a major conference onwatershed research conducted through university classes.
Our major challenge this year has been that the supplementary funds supplied by the central administrationof Rutgers University have been expended, and, due to a change of administration and reorganization ofthe university, it has not yet been possible to renew this funding. This has had a major impact on ourinformation transfer program and our ability to support undergraduate internships. Rutgers has a newpresident and executive vice-president whose focus has been in areas other than the environmentalsciences. Moreover, they have instituted a complete reorganization of the funding mechanisms among theunits of the university, a reorganization which is still incomplete and has led to an inability of either theCook College/New Jersey Agricultural Experiment Station or the central administration to be able tocommit dollars to the Institute. We continue to work with both the Cook/NJAES and the centraladministration to renew the support for our information transfer and undergraduate programs.
Research Program

Investigation of Design Parameters for EngineeredRhizoremediation Systems to Treat Contaminated Sediments In Situ
Basic Information
Title: Investigation of Design Parameters for Engineered Rhizoremediation Systems toTreat Contaminated Sediments In Situ
Project Number: 2003NJ38B
Start Date: 3/1/2003
End Date: 3/1/2004
Funding Source: 104B
Congressional District: 6
Research Category: Not Applicable
Focus Category: Treatment, Sediments, Toxic Substances
Descriptors: Rhizosphere, Biodegradation, Bioremediation, Rhizoremediation, PolynuclearAromatic Hydrocarbons, Contaminated Sediments, In Situ Remediation
Principal Investigators: Jerome Kukor, Max Haggblom
Publication1. Plant-Mediated Effects on Polycyclic Aromatic Hydrocarbon (PAH) Degradation by Bacteria in the
Rhizosphere of the Salt Marsh Grasses Spartina alterniflora and Phragmites australis. AmericanSociety of Microbiology, 103rd General Meeting. Washington, D.C. May 18-22, 2003.
NJWRRI Report – Document 2: Project Information Problem and Research Objectives
Contamination of estuarine environments by toxic organic contaminants, such as
polyaromatic hydrocarbons (PAHs) and related petroleum hydrocarbons, has become a
significant environmental concern. The industrial activities in New Jersey have resulted
in widespread contamination of estuarine sediments. Accordingly, there is an increased
awareness in the need for restoration of these damaged habitats and the importance of
wetland preservation. Despite these pressing needs, remediation of sediments in estuaries
and associated wetlands is a non-trivial undertaking. Ex situ treatment methods, such as
composting and soil washing, are by their very nature disruptive and costly. In situ
remediation is an attractive alternative, but methods based on injection of surfactants or
chemical oxidants (which have been employed in several large-scale sediment
remediation projects) can be as expensive and ecologically disruptive as ex situ
approaches requiring excavation. In contrast, in situ approaches that rely on the
biodegradative activities of microorganisms are generally viewed as being less costly and
less disruptive of the ecosystem. Nevertheless the overall rates of intrinsic
biodegradation of target contaminant compounds (e.g., PAHs) in estuarine sediments is
often limited both by the reduced availability of oxygen in the sediments and by the
reduced bioavailability of the contaminant molecules to the biodegradative microbes.
However, vascular plants that are adapted to thrive in the tidal marsh zones of such
estuarine habitats establish microniches that can favor enhanced microbial activity in
their rhizosphere.
Previous work in our laboratory has demonstrated that the rhizosphere of Spartina

sp. contains a wide variety of PAH-degrading bacteria that are distinct from those found
in bulk sediment (Daane et al. 1998a,b). Identification of the isolates using a combination
of phenotypic, morphologic and molecular techniques assigned them into three main
bacterial groups: gram-negative pseudomonads, gram-positive non-spore forming
nocardioforms, and the newly described gram-positive spore forming bacilli group,
Paenibacillus (Daane et al., 1998a). Comparison to the classical genes (nah and pah) for
naphthalene degradation from Pseudomonas, Comamonas, and Sphingomonas strains
suggested that the nocardioform and Paenibacillus strains may have novel genes for PAH
degradation. It is of interest to determine whether the PAH-degrading Paenibacillus
group is specific to the Spartina rhizosphere, since this group has not been found in other
studies examining PAH-degrading bacteria in marine and intertidal sediments
(Geiselbrech et al. 1998; Dyksterhouse et al. 1995, Hedlund et al. 1999; Berardesco et al.
1998). Additional PAH-degrading bacteria have been isolated from the Spartina
rhizosphere in work associated with this grant.
Spartina (Howes and Teal, 1994) is known to pump oxygen into the rhizosphere
however the potential for this process enhancing biodegradation in the rhizosphere by
creating more oxidized conditions has not been addressed. Experiments with Spartina salt
marsh mesocosms indicated that biodegradation of oil was influenced by flooding and
fertilization conditions (Wright et al. 1997). Of specific interest is to evaluate the role of
oxygen cycling by roots of salt marsh plants relative to enhancement of biodegradative
activities of rhizosphere-associated microorganisms.
The objective of this study is the investigation of the key design features of a
model engineered rhizoremediation system for remediation of New Jersey sediments

contaminated with complex mixture of anthropogenic organic pollutants. Our approach
will be to investigate the development of engineered rhizoremediation systems in which
plants adapted to estuarine habitats, namely Spartina alterniflora, are combined with
bioaugmented microbial consortia designed for particular suites of target contaminants.
The basic hypothesis being tested is that microbial degradative activity towards target
pollutants will be enhanced in the rhizosphere via an overall enhancement of microbial
metabolic activity as a consequence of oxygen cycling and nutrient provision from the
plant’s root system.
Methodology
Soil Sampling
Soil samples were collected in early July of 2000 from a petroleum-contaminated
salt marsh in northeastern New Jersey. Three sample areas were selected at the sight: a
stand of Spartina alterniflora, a stand of Spartina patens, and a heavily polluted pitch
field. Samples were taken by carving a 10 in. X 10 in. square in the soil with a spade.
These soil blocks were then pried up from the ground and removed intact. Any existing
plant matter was included in the samples. Once removed, the soil blocks were transferred
to plastic bags and placed on ice for transport. Three soil samples were extracted from
each of the plots.
Enrichment
Soil blocks were cut open aseptically in a laminar flow hood using sterile
instruments for further sampling. Approximately 6 to 7 grams of soil were removed from
each block in this fashion to be used in the enrichment of indigenous PAH degrading
organisms.

Enrichment of bacteria was carried out in 25 ml serum vials. Clean, sterile vials
were spiked with PAHs by the addition of stock solutions in acetone. The solvent was
allowed to evaporate from the vials prior to further amendment. 0.5 grams of soil was
then added to each spiked vial. Following soil addition, 10 ml of liquid medium was
added to the vials, bringing the final concentration of PAH to 100 ppm.
Enrichment vials were then transferred to an incubator/shaker where they were
shaken at 28o C at a speed of 200 rpm for a total of 4 weeks. Following the initial
incubation period, a 100 ul inoculum was taken from each vial and transferred to a fresh
vial containing 10 ml of liquid medium and 100 ppm of PAH. These subculture vials
were then returned to the incubator shaker for an additional 4 weeks.
A total of three PAHs (phenanthrene, fluoranthene, and pyrene) were enriched for
separately in this study. Chemicals were obtained from the Sigma Chemical Company.
The physical and chemical properties of these compounds are summarized in Table 2.
PAH stock solutions were created by dissolving solid PAHs in 5 ml of acetone to a final
concentration of 5000 ppm. The stock solutions were kept at 4o C in amber glass, Teflon-
capped vials. Glass Hamilton syringes were used to inoculate serum vials with the stock
solutions.
A second enrichment, from soils from the same site that were aged at 4°C for 2
years, was performed using the methods described above.
Isolation and Characterization
Following incubation of the secondary enrichments, a loopful of culture medium
(approximately 1 ul) was taken from each vial and streaked onto a 1:5 carbon strength LB

plate and incubated at 30o C. After a 24-hour growth period, these plates were then
streaked for isolation based on colony morphology.
Individual isolates were streaked onto PAH overlayer plates (50 ppm PAH in
minimal medium) and incubated at 30o C for 4 to 6 weeks. Isolates showing distinct
colony growth and clearing zones in the medium were scored positive for PAH
degradation. Positive isolates were confirmed by streaking on minimal plates without
any added PAH. Positive isolates were then frozen in 20% glycerol at –80o C.
Positive isolates were grown on TSA and tentatively identified using fatty acid
esterification and the MIDI identification system (MIDI Labs, Inc.).
Amplification of Dioxygenase Gene Fragments
Genomic DNA was extracted from positive isolates using the Nucleospin Tissue
Kit (Clontech Laboratories, Inc.). The PCR primers DIOX1 (5’- AGGGATCCCCANC
RTGRTANSWRCA - 3’) and DIOX2 (5’ - GGAATTCTGYMGNCAYMGNGG - 3’)
were used to amplify a conserved sequence within the Reiske iron-sulfur center of the
PAH initial dioxygenase gene (Cigolini & Zylstra, 2000). 50 ul reactions were set up
with Promega PCR buffer (1X), 2 mM MgCl2, 0.4 mM dNTP mix, 0.2 uM each primer,
2.5 u of Promega Taq, and 1 ul of template DNA. The following program was used to
amplify the conserved dioxygenase gene fragment: 95o C for 2 minutes, denaturation at
95o C for 1 minute, primer annealing at 45o C for 1 minute, elongation at 72o C for 1
minute (40 cycles), and final elongation at 72o C for 5 minutes. PCR products were
electropheretically run on a 1% agarose gel at 80 V for approximately 75-80 minutes.
Agarose gels were stained with a 1 ug/ml solution of ethidium bromide and visualized
under UV light using Kodak 1D (v. 3.5) image-capturing software.

PCR product bands corresponding to the expected product size were excised from
the gel and eluted using the QIAquick Gel Extraction Kit (QIAgen, Inc.). Eluted product
was then reamplified under identical conditions to increase DNA yield for sequencing.
Indole Assay
The conversion of indole to indigo was used as an indicator of dioxygenase
activity in further plant model system experiments. Several isolates were assayed for
indigo production. Bacterial isolates were inoculated at high density (~108 cells/ml) into
serum vials containing M9 minimal medium, 100 uM PAH for induction, and 1 mM
indole. After the vials were sealed, they were shaken at 30o C at a speed of 200 RPM and
monitored for production of indigo (blue precipitate). Isolate PCpG-3 (Pseudomonas
putida) was selected for use in rhizosphere model experiments based on its ability to
produce a substantial indigo precipitate after a period of 12 hours.
Rhizosphere Model System
A rhizosphere model system was constructed in order to show the effects of plant
root activities on PAH catabolism in these zones. Essentially, this system uses the indole
reaction as an indicator of dioxygenase activity, providing a visual confirmation of plant-
microbe interactions.
Live Spartina alterniflora and Phragmites australis grasses were collected from
stands adjacent to an unnamed creek in Cheesequake State Park in Matawan, New Jersey,
and transported back to the greenhouse. The plants were then separated and gently
washed with clean water. The grasses were transplanted to washed sand and irrigated
with tap water for 7 to 10 days, in order to acclimate them to the artificial experimental
conditions.

Acclimated plants were removed from the sand and fully separated. The roots
were surface sterilized with a 5% bleach solution to remove as much biomass as possible.
Each individual plant root mass was then inserted into a 50 ml plastic centrifuge tube
with small (2 mm) holes drilled along the length on all sides. These tubes were then
filled with washed sand and saturated with a 1% Miracle-Grow solution. These tubes
prolonged the viability of the plants in the experimental system.
These plant tubes were then used to create the experimental system. A glass tank
(16 in. wide X 8 in. long X 10 in. deep) was filled with approximately 1.5 inches of
washed sand. This served as a support for the tubes, which were inserted into it. A layer
of 0.4% agar approximately 0.5 inches thick was then poured on top of the sand and
allowed to set. Indole crystals were added directly on top of this support agar.
Next, approximately 2 to 3 inches of a 0.2% agar solution were added on top of
the indole crystals. This agar (made from the mineral salts medium) contained a high-
density inoculum of PCpG-3 and 100 uM phenanthrene for enzyme induction. The
indole crystals dispersed throughout this layer upon addition to the tank. This cell layer
was then allowed to partially set before further amendment.
Finally, a 2-inch thick layer of 0.4% agar was added to the tank on top of the cell
layer. This layer served to impede the diffusion of atmospheric oxygen into the lower
levels of the system, leaving the plant roots as the only source of oxygen flux.
Additionally, it served to confine all necessary experimental components to the middle
layer within the tank.
A total of 8 plant vials were included in the system: 2 S. alterniflora (light), 2 S.
alterniflora (dark), 2 P. australis (light), and 2 P. australis (dark). Dark controls were

performed by covering the aerial portions of the plants with opaque black plastic. The
rhizosphere system was transported to the greenhouse and observed for an indicator
reaction over a period of three weeks.
Plant Root Extracts
Roots from Spartina alterniflora individuals were washed in deionized water and
dried overnight in a convection oven. Samples of fine roots (5.0 g) were ground to a fine
powder in a mortar and pestle and boiled in 150 ml of deionized water for 30 minutes.
Boiled extracts were filter sterilized and stored at 4°C.
Phenolic Content of Extracts
Total phenolic assessment was made using a variant of the Folin-Ciocalteu phenol
reaction (Kramling and Singleton 1969, Singleton and Rossi 1965, Somers and Ziemelis
1980). Extract samples (1 ml) were added to glass test tubes. Five (5.0) ml of a 1:10
dilution of Folin-Ciocalteau reagent was added, and the mixture was vortexed and
incubated at room temperature for 5 minutes. Four (4.0) ml of a 7.5% Na2CO3 solution
was added, and the mixture is vortexed. The reaction was allowed to incubate at room
temperature for 2 hours. Phenolic content was assessed by spectrophotometric
quantitation at 740 nm.
Chromatographic Analysis of Extracts
For HPLC analysis, extracts were diluted to 25% in deionized water and run on a
Shimadzu HPLC with the following conditions: 95% aqueous to 40% aqueous over 60
minutes, aqueous = 0.3% H3PO4, organic = methanol, detection at 275 nm.
For GC/MS analysis, extracts were extracted with an equal volume of hexane in
sealed serum vials for 24 hours (30°C, 200 RPM shaking). The organic fraction was

transferred to GC vials and run on an HP 5800 series GC/MS under the following
conditions: HP5 column (30m X 0.25mm), initial temp = 70°C, ramp to 280°C over 45
minutes, carrier = He (5 ml/min), MS detection.
Culture Growth on Extracts
Triplicate cultures of each isolate were set up in root extract, glucose, and p-
hydroxybenzoate media, each adjusted to a concentration of 100 mg/L in mineral salts
(phenolic concentration was used for extracts). Cultures were incubated at 30ºC with
shaking for 3 days. Cell density was measured spectrophotometrically at 600 nm.
Principle Findings / Significance
Isolates
First round isolation: Isolate Soil Type1 Substrate MIDI match SI2 ABy52 rhizosphere pyrene Phenylobacterium immobile 0.15 PAyG1 rhizosphere pyrene Bacillus GC grp. 22 0.22 PR-P3 rhizosphere phenanthrene Alcaligenes oxydans 0.46 ACpM3 rhizosphere phenanthrene Alcaligenes xylosoxidans 0.53 PCfM3 rhizosphere fluoranthene Pseudomonas balearica 0.49 TPpG1 bulk phenanthrene Agrobacterium radiobacter 0.85 TPpG3 bulk phenanthrene Nocardia asteroides 0.64 ABpM2 rhizosphere phenanthrene Methylobacterium radiotolerans 0.82 PAy51 rhizosphere pyrene Pseudomonas putida 0.56 PBfG2 rhizosphere fluoranthene Bacillus pumilis 0.44 PCpM2 rhizosphere phenanthrene Arthrobacter atrocyaneus 0.62 PByG3 rhizosphere pyrene Rhodococcus equi 0.33 PCpG4 rhizosphere phenanthrene Acinetobacter calcoaceticus 0.34
1 Rhizosphere soil was isolated from the root zones of Spartina alterniflora. 2 SI = similarity index, as calculated by the MIDI software. This is a measure of the extent to which the putative identification matches the typical characteristics for the named strain.

Second round isolation: Isolate Soil Type Substrate MIDI Match SI A3YSY rhizosphere pyrene Bacillus globisporus A3NY1 rhizosphere pyrene Nocardia carnea A3PRY rhizosphere phenanthrene Bacillus globisporus A3PRW rhizosphere phenanthrene Bacillus cereus
TP2P bulk phenanthrene Rhodococcus rhodochrous P2P1 rhizosphere phenanthrene Yersinia pseudotuberculosis
A3YSW rhizosphere pyrene Pseudomonas fluorescens A3PRB rhizosphere phenanthrene Bacillus globisporus
A3PWW rhizosphere phenanthrene Bacillus subtilis TP2Y bulk phenanthrene Hydrogenophaga palleronii
A3NY2 rhizosphere pyrene No Match A3NY3 rhizosphere pyrene No Match P2Y1 rhizosphere pyrene Yersinia pseudotuberculosis
A3NY4 rhizosphere pyrene Rhodococcus equi Dioxygenase Amplification
1----------- ----------12
Row 1
Row 2
Amplification of dioxygenase gene fragments using degenerate PCR primers. Key (Row 1): Lane (1)1kb ladder, (2)B. cepacia LB400, (3)ABpM-2, (4)ACpM-2 large fragment, (5)ACpM-2 small fragment, (6)TPpG-1, (7)ACpG-1, (8)PBfG-2, (9)PCfM-3, (10)PCpG-4, (11)ACfM-2. Row 2: Lane (1)1kb ladder, (2)PAyG-1, (3)TPyG-1 large fragment, (4)TPyG-1 small fragment, (5)PAy5-1, (6)PCy5 large fragment, (7)PCy5 small fragment, (8)H2O blank. The red arrows indicate the approximate position of the expected product.

Model Rhizosphere
A.
B.
Photos of model rhizosphere root tubes following three weeks of greenhouse incubation. On the left, a P. australis light tube (note the deep red color). The middle tube is a S. alterniflora light tube. The yellow arrow indicates a drilled hole where formation of indigo was observed. The tube on the right is a S. alterniflora dark control tube, with no visible color reaction. 6B gives a closer view of the system, where the diffusion of indigo from the drill hole area is more evident.
Setup of the bench-scale model rhizosphere apparatus. Individual plant tubes are inserted into the base sand layer (D). The lower layer of 0.4% agar (C) is poured directly on top of the sand. The cell layer, containing the culture inoculum, indigo, and phenanthrene (B) is added on top of this layer. The system is then capped with another layer of 0.4 % agar (A). Dark controls were made by covering the aerial portions of the plants with black plastic.

Root Extracts
HPLC chromatogram of Spartina alterniflora root extracts (275 nm)
GC chromatogram of hexane extraction from aqueous Spartina alterniflora root extracts

Results of growth experiments involving primary PAH isolates growing on root extracts, p-hydroxybenzoate, and glucose. Data points represent triplicate values.
Root Exudate Growth Assay
-0.1
0
0.1
0.2
0.3
0.4
0.5
0.6
0.7
ABy52 PAyG1 PR-P3 ACpM3 PCfM3 TPpG1 TPpG3 ABpM2 PAy51 PBfG2 PCpM2 PByG3 PCpG4
Isolate
OD
Rea
ding
Root Extract
Glucose
Hydroxybenzoate

Literature Cited Berardesco G, Dyhrman S, Gallagher E, Shiaris MP (1998) Spatial and temporal variation of phenanthrene-degrading bacteria in intertidal sediments. Appl. Environ. Microbiol. 64:2560-2565. Cigolini, J.F. and G.J. Zylstra. 2000. Molecular analysis of polycyclic aromatic hydrocarbon degradation by Mycobacterium sp. strain PYR1. Doctoral Thesis, Rutgers, The State University of New Jersey. Daane LL, Im QI, Zylstra GJ, Häggblom MM (1998) Comparative study of PAH-degrading bacteria isolated from the rhizosphere of salt marsh plants. Abstract Q-286. American Society for Microbiology 98th General Meeting, May 17-21, 1998. Daane LL, Harjono I, Im QI, Zylstra GJ, Häggblom MM (1998) Polyaromatic hydrocarbon-degrading Paenibacillus species isolated from the rhizosphere of salt marsh plants. Eighth International Symposium on Microbial Ecology, August 9-14, Halifax, Canada. Dyksterhouse SE, Gray JP, Herwig RP, Lara JC, Staley JT (1995) Cycloclasticus pugetii gen. nov., sp. nov., an aromatic hydrocarbon-degrading bacterium from marine sediments. Int. J. Syst. Bacteriol. 45:116-123. Geiselbrecht AD, Hedlund BP, Tichi MA, Staley JT (1998) Isolation of marine polycyclic aromatic hydrocarbon (PAH)-degrading Cycloclasticus strains from the gulf of Mexico and comparison of their PAH degradation ability with that of Puget sound Cycloclasticus strains. Appl. Environ. Microbiol. 64:4703-4710 Hedlund BP, Geiselbrecht AD, Bair TJ, Staley JT (1999) Polycyclic aromatic hydrocarbon degradation by a new marine bacterium, Neptunomonas naphthovorans gen. nov., sp. nov. Appl. Environ. Microbiol. 65:251-259. Howes BL, Teal JM (1994) Oxygen loss from Spartina alterniflora and its relationship to salt marsh oxygen balance. Oecologia 97: 431-438. Kramling, T.E. and V.L. Singleton. 1969. An estimate of non-flavonoid phenols in wine. Amer. J. Enol. Vitic. 20: 86-92. Singleton, V.L. and J.A. Rossi. 1965. Colorimetry of total phenolics with phosphomolybdic-phosphotungstic acid reagents. Amer. J. Enol. Vitic. 16: 144-158. Somers, T.C. and G. Ziemelis. 1980. Gross interference by sulphur dioxide in standard determinations of wine phenolics. J. Sci. Fd. Agr. 31: 600-610.

Wright AL, Weaver RW, Webb JW (1997) Oil bioremediation in salt marsh mesocosms as influenced by N and P fertilization, flooding, and season. Water Air Soil Poll. 95:179-191.

Validation of the PMF (Preprocessor to MODFLOW forFractured Media) Package
Basic Information
Title: Validation of the PMF (Preprocessor to MODFLOW for Fractured Media) Package
Project Number: 2003NJ39B
Start Date: 3/1/2003
End Date: 3/1/2004
Funding Source: 104B
Congressional District: 6
Research Category: Water Quality
Focus Category: Groundwater, Models, Non Point Pollution
Descriptors: Fractured Media, Percolation Theory
Principal Investigators: Yuri Mun
Publication1. Mun, Yuri and Christopher.G. Uchrin, 2003: Ground Water Flow Modeling in a Layered
Sedimentary Fractured Media Aquifer System using MODFLOW with the PMF package. In: EosTrans. AGU 84(46), Fall Meet. Suppl., San Francisco, CA, Abstract H42B-1069.
2. Mun, Yuri and Christopher.G. Uchrin, 2003: PMF package (a Preprocessor to MODFLOW forFractured Media), In: MODFLOW and MORE 2003 Understanding through Modeling Ed. Poeter. E.,C. Zheng, M. Hill, and J. Doherty, Colorado School of Mine, Golden, CO. pp.555-559.
3. Mun, Yuri and Christopher.G. Uchrin, 2003: Pollutant transport in Fractured Media Aquifers, In:Physicochemical Processes in Environmental Systems: Symposium in Honor of Professor Walter J.Weber, Jr. in American Chemical Society, New York, NY. pp.1157-1163.

Validation of the PMF (Preprocessor to MODFLOW for Fractured Media) Package
Yuri Mun
Problem Statement Ground water is the largest accessible freshwater source in the world. In New Jersey, 50
percent of the population depends on ground water as their water source (Zapecza, 1990). Since public health concerns arise from drinking water being contaminated, the importance of predicting ground water movement and quality has increased. The best tool available for this prediction is usually a ground water model (Anderson and Woessner, 1992).
There are two types of principal aquifers in New Jersey: Coastal Plain aquifers south of
the fall line and non-Coastal Plain aquifers north of the fall line. While the Coastal Plain consists of porous media having a continuous change of flow properties, the non-Coastal Plain consists of fractured media having a discrete change of flow properties which can compose the preferred fluid pathways. There are a multitude of well-developed models for ground water in porous media. In contrast, ground water flow in fractured media has often been simulated by either focusing on flow in individual fractures (fracture flow approach (Amadei and Illangasekare, 1994)) or by assuming a uniform distribution of fractures (equivalent porous medium approach). Although the latter approach has been utilized by many hydrogeologists due to its ability to handle the environmental impact of pollutants in a larger geographic area, it might have the limitation to represent the preferred fluid pathways. Therefore, a new approach, which can assist the EPM approach to address its limitations, is needed.
The PMF (Preprocessor to MODFLOW for Fractured media) package was developed in
conjunction with the Multi-Media Nonpoint Source Model which investigated the problems of eutrophication with nonpoint sources for the Cranberry Lake system (Mun and Uchrin, 2004; Uchrin et al., 2002). It can depict the preferred fluid pathway in the EPM approach, as it utilizes percolation theory which can describe the connected fluid pathways. The conceptual model, which represents the fractured media by a finite difference grid, must have two or more different categories of cells such that one represents the case of abundant more fractures while the other represents no or less fractures. If MODFLOW is combined with percolation theory, the model domain can have two kinds of cells which are considered as active and inactive (Figure 1). The active cell represents the preferred fluid pathways and the inactive cell represents the part having no flow. This preprocessor can construct the different conceptual models with different percolation numbers. The percolation number is the number which determines the amount of active cells. The appropriate conceptual model and percolation number could be determined by comparison of alternatives (Mun and Uchrin, 2004). The application of the PMF package can assess different simulation scenarios having different percolation numbers which indicate the amount of cells defining preferred flow pathways. If the percolation number (p) is equal to 1, the PMF package is not applied and all cells are defined as active, thus able to transmit ground water flow (like porous media). If the percolation number (p) is 0.6, then 60% of the cells in the model domain define the preferred flow pathway.
Yuri Mun: [email protected] 1

(a) (b) (c) Figure 1. Development of PMF package; (a) Percolation theory: black dots showing occupation and lines showing connection, (b) MODFLOW: a finite difference model and (c) Combination of MODFLOW and Percolation theory.
PMF package was applied to Cranberry Lake system located in the crystalline Highlands
Province of northern New Jersey. Its major aquifer is comprised of fractured media and most of the available water is within 300ft of the land surface. Yields from crystalline fractured rock are limited by the degree of weathering and fracturing and do not exceed more than a few hundred gallons per minute. In calculation of the ground water discharge to the lake, while EPM approach employed in the beginning of this project projected 325 percent of the observed value, the application of PMF package projected just 92 percent of the observed value with 100 percent representing a perfect match between calculation and observation (Figure 2). In addition, while the EPM approach showed that larger calculated values have larger residuals which could suggest either a systematic model error or of assumptions, the PMF package showed a random distribution of residuals which should be shown by ideal modeling (Mun and Uchrin, 2004). Therefore, the PMF package can be considered to provide a more rigorous model and to open new chapter of ground water flow modeling in fractured media.
3.25
1.18 1.14 0.720.92
0
1
2
3
4
1 0.8 0.6 0.45 0.25
percolation numbers
calc
ulat
ion/
obse
rvat
ion
Figure 2. Comparison of Modeling Results between different Percolation Numbers: Water Balance
Even though this PMF package provided a better model for ground water flow in
fractured media in one instance, it still needs to be improved and generalized in order to apply it to other fractured media ground water flow system. That is, this new approach needed further validation, which means it has to be determined if the model includes all major processes and can describe suitably observed phenomena (Schnoor, 1996).
Yuri Mun: [email protected] 2

Methodology The validation could be performed by applying the PMF package to other fractured
media. This study selected the layered sedimentary fractured media located at the Busch Campus of Rutgers University, which was reported with its ground water contamination by PCE and TCE (Lewis-Brown and dePaul, 2000). Ground water modeling was performed by MODFLOW 2000 after application of PMF package. Since calibration by strictly trial-and-error methods was judged to be both ineffective and inefficient, the inverse modeling technique using nonlinear-regression methods was employed, which was considered to be a better approach to estimate optimal parameter values.
Results and Discussion The selected system consists of two major geologic structures: a water bearing unit and a
confining unit. The water bearing unit generally has a higher hydraulic conductivity and horizontal flow, while the confining unit has lower hydraulic conductivity and vertical flow. This system was tested with five different simulation scenarios with five percolation numbers (1.0, 0.8, 0.6, 0.45 and 0.25). Modeling calibration result using hydraulic head and stream flow shows that the scenarios with the percolation numbers of 0.8 and 0.45 provided the smallest values for sum of error squared (Figure 3). Only the scenario with p = 0.45, however, provides agreement with the characteristics of the geologic system which shows horizontal flow in the water bearing unit and vertical flow in the confining unit (Table 1) and is therefore the best representation of the real system. Figure 4 exhibits the resultant three-dimensional piezometeric surface for p = 0.45.
0
1000
2000
3000
4000
1 0.8 0.6 0.45 0.25
Percolation Number
Sum
of S
quar
ed E
rror
Stream FlowHydraulic Head
Figure 3. Calibration Results: Sum of Squared Error
Table 1. Selected Calibrated Parameters
Percolation Number 1.0 0.8 0.45 Horizontal Hydraulic Conductivity 2.131 2.5 16.68
Water Bearing Unit Vertical Hydraulic Conductivity 2.674 25 2.704 Horizontal Hydraulic Conductivity 0.5 0.883
Confining Unit Vertical Hydraulic Conductivity
N/A 0.005 1.747
Yuri Mun: [email protected] 3

Figure 4. 3-dimensional Piezometric Surface at Busch Campus (unit: feet)
Summary The PMF package has been constructed as a preprocessor to MODFLOW by employing
percolation theory so that it can assist the EPM approach for simulation of groundwater flow and transport in fractured media. This project validated the superiority of this new method by applying it to two different geologic systems.
References Amadei, B. and T. Illangasekare, 1994: A Mathematical Model for Flow and Solute Transport in Non-homogeneous
Rock Fracture. International Journal of Rock Mechanics and Mining Sciences & Geomechanics Abstracts, 31(6), 719-731.
Anderson, M.P. and W.W. Woessner, 1992: Applied Groundwater Modeling: Simulation of Flow and Advective Transport. Academic Press, Inc. California, 381pp.
Lewis-Brown, J.C. and V.T. dePaul, 2000: Ground-Water Flow and Distribution of Volatile Organic Compounds, Rutgers University Busch Campus and Vicinity, Piscataway Township, New Jersey: Geological Survey Water-Resources Investigations Report 99-4256, 72 pp.
Mun, Y., and C.G. Uchrin, 2004: Development and Application of a MODFLOW Preprocessor using Percolation Theory for Fractured Media, Journal of the American Water Resources Association 40(1): 229-240
Schnoor, J.L., 1996: Environmental Modeling: Fate and Transport of Pollutants in Water, Air and Soil. John Wiley & Sons, Inc. New York, 682pp.
Uchrin, C.G., H.C. Ahn, Y. Mun, A. Rowan and T. Belton 2002: A Watershed Mathematical Model for Assessing Septic Impacts to Cranberry Lake, NJ. In: Proceedings 34th Mid-Atlantic Industrial and Hazardous Waste Conference, Haggblom, M.M., K.Y. Lee, and D.E. Fennell (Editors). Rutgers University, pp. 5-14.
Zapecza, O.S. 1990: An Overview of New Jersey Ground Water Hydrology. In Aspects of Groundwater in New Jersey, Seventh Annual Meeting of the Geological Association of New Jersey, Field Guide and Proceedings, Eds. Brown, J.O., and Kroll, R.L.Kean College of New Jersey.
Yuri Mun: [email protected] 4

Microbial respiration of arsenic and selenium
Basic Information
Title: Microbial respiration of arsenic and selenium
Project Number: 2003NJ42B
Start Date: 3/1/2003
End Date: 3/1/2004
Funding Source: 104B
Congressional District: 6
Research Category: Water Quality
Focus Category: Geochemical Processes, Sediments, Wetlands
Descriptors: arsenic, selenium, anaerobic reduction
Principal Investigators: Priya Narasingarao, Max Haggblom
Publication1. Narasingarao, P and Häggblom , MM. (2004). Physiological Characterization of a Dissimilatory
Selenate Reducing Bacterium Strain AK4OH1. in American Society for Microbiology GeneralMeeting 2004.

Microbial Respiration of Arsenic and Selenium
1
Project Information
Problem and Research Objectives
Arsenic and selenium though naturally present in the earth’s crust become very toxic
when their oxyions gain entry into water systems. Oxidation-reduction reactions play a
major role in increasing the mobility of these elements whereby they enter water systems.
Previous studies indicate that microorganisms mediate these redox reactions using them
as alternate electron acceptors during respiration by the process of dissimilatory arsenate
or selenate reduction. Both these elements have gained importance in recent years in
terms of their toxicity because of human impact on the lithosphere, which has resulted in
large-scale release of toxic forms of arsenic and selenium.
Arsenic is widely distributed throughout the earth’s crust and is introduced through the
dissolution of minerals and ores and ground water levels get elevated due to erosion from
local rocks. It is also used in alloying agents, wood preservatives, and pesticides and is
also released during the combustion of fossil fuels followed by atmospheric deposition.
Seleniferous soils and fossil fuels constitute natural selenium sources; anthropogenic
sources such as the combustion of fossil fuels, runoff from irrigated seleniferous soils and
draining from mines also add selenium into the environment.
The primary goal of this study is to elucidate the role of microorganisms involved in
redox transformations of arsenic and selenium in soils and sediments. In the absence of
oxygen, microorganisms use a wide range of terminal electron acceptors from nitrate
through iron, sulphate and carbonate for their respiration. Recent evidence indicates that
there are microorganisms that exist in nature which are capable of utilizing arsenate or
selenate for respiration by the process of dissimilatory arsenate or selenate reduction
(Stolz and Oremland, 1999).

Microbial Respiration of Arsenic and Selenium
2
Specific objectives of this study
Of particular interest are the microbial transformations that occur in the anaerobic zone
because these are central in determining the mobility of arsenic and selenium in the
environment.
The main objectives and some questions that are be addressed in this study are:
Ø How diverse are the microorganisms that have the capability to carry out
dissimilatory arsenate or selenate reduction and how widely are they present in
the environment, in particular New Jersey where arsenic rich soils are found.
Ø Is the reduction of arsenate and selenate coupled to respiration in these
organisms?
Ø How do other electron acceptors such as nitrate compete for carbon source in the
same environment?
Ø What is the metabolic diversity of arsenate and selenate reducing bacteria in terms
of carbon requirements?
Methodology
1. Sampling: Sediment grab samples were taken in the Meadowlands regions
along the Hackensack River, NJ, from Sawmill Creek and Kearny Marsh.
Sediments associated with vegetation from the two primary wetland plants
Spartina sp. and Phragmites sp. and also an unvegetated mudflat were taken as a
transect along the river, to determine the impact that vegetation may have on
anaerobic reduction of arsenate and selenate. Plastic jars were filled to capacity
with sediment, sealed and brought to the lab and stored at 4°C until used.
2. Enrichment setup: To determine the potential for dissimilatory selenate or
arsenate reduction in the sediment, microcosms were setup with 10% w/v of
sediment as an inoculum following strict anaerobic techniques in mineral salts
media with 10 mM sodium selenate or 10 mM sodium arsenate as a terminal
electron acceptor and 5 mM pyruvate and 200 µM 4-hydroxybenzoate as electron

Microbial Respiration of Arsenic and Selenium
3
donor. The microcosms were incubated at 27°C and sampled periodically.
Samples were filtered through 0.4µm syringe filter and stored at –20°C until
analyzed.
3. Growth experiments with bacterial strain AK4OH1: Strain AK4OH1
capable of selenate reduction was isolated from Arthur Kill (Knight et al. 2002).
Cells grown in batch cultures were washed, centrifuged and re suspended in
buffer and was used for growth experiments. Stoichiometry of selenate reduction
was determined by incubating the cultures with and without electron donor or
acceptor, to prove growth coupled to selenate respiration.
4. Analytical techniques: The selenium oxyions were analyzed using ion
chromatography with an AS14 (Dionex) column and conductivity detector. The
mobile phase was 3.5mM sodium carbonate and 1.5mM sodium bicarbonate at a
flow rate of 1.5mL/min. The benzoates were analyzed with a high performance
liquid chromatography system with C18 column (Phenomenex) and UV detection.
The mobile phase was methanol:water:acetic acid in the ratio 60:58:2 at 1mL/min
flow rate. Biomass was measured as increase in protein concentration according
to Bradford’s assay using Bio-Rad protein assay kit.
5. DNA analysis: The 16S rRNA gene from AK4OH1 was amplified and
sequenced using eubacterial primers. Phylogenetic trees were constructed using
Vector NTI suite 6.1.
Principal Findings and Significance
I. Physiological characterization of bacterial strain AK4OH1
capable of dissimilatory selenate reduction
Strain AK4OH1 is an anaerobic selenate reducing bacterium previously isolated from
Arthur Kill, an intertidal strait between NY-NJ harbors (Knight et al. 2002). The present

Microbial Respiration of Arsenic and Selenium
4
work aims to characterize this strain and elucidate its capability to respire 4-
hydroxybenzoate coupled to selenate reduction to selenite.
A. Growth coupled to selenate reduction
Figure1 Figure2
Figure 3
Figures 1, 2 and 3 shows that selenate is reduced to selenite with 4-hydroxybenzoate utilization. Protein concentration increased only when both electron acceptor and donor were present. Table 1 shows the final electron balance when AK4OH1 was incubated in the presence of both electron donor and acceptor.

Microbial Respiration of Arsenic and Selenium
5
Table 1 Balance of electron donors and acceptors during the utilization of
4-hydroxybenzoate by strain AK4OH1
System
Substrate
utilized
(µM)
Protein
increase
(µg/mL)
Carbon
conversion
to cell (%)1
Se (VI)
reduced
(mM)
Se (IV)
produced
(mM)
Electrons
produced2
(µmoles)
Electrons
consumed3
(µmoles)
Electron
balance
(%)
4-OHB and
Se (VI) 524.53 19 43 5.73 4.75 209 236 113
W/O Se (VI) 0.45 0 0 NA NA 12.6 NA NA
W/O 4OHB NA 0 0 0.0356 0.0056 NA 0.1312 NA
1The increase in cell carbon was estimated to be equal to increase in protein concentration. 2Calculated on the basis of stoichiometric equation: C7H6O3 + 11H2O 7CO2 + 28H+ +28e -
3Calculated on the basis of reduction of electron acceptor as follows: SeO42- +H2O +2e- SeO32- +2OH-
SeO32- +3H2O + 4e - Se0 +6OH-
B. Metabolic diversity of AK4OH1
Table 2
Compounds
Growth with protein increase
Electron donors
4-hydroxybenzoate +
3-hydroxybenzoate +
Benzoate +
Acetate +
Lactate +
Electron acceptors
Nitrate +
Selenate +
Sulfate -
Arsenate -

Microbial Respiration of Arsenic and Selenium
6
Table 2 summarizes the various electron donors and acceptors that AK4OH1 can utilize.
Growth was considered positive only when there was loss of the compound accompanied
with increase in protein concentration
C: Phylogenetic Analysis
Figure 4
Based on 16S rRNA gene sequence, a phylogenetic tree was constructed shown in figure
4. It shows the relationship of AK4OH1 with other selenate reducers and their closely
related species.
Conclusions
Bacterial strain AK4OH1 can be classified as a new genus and species based on
phylogenetic sequence analysis of 16S rRNA gene. It clusters with a group of uncultured
sulfur-oxidizing symbionts of bivalves and its closest relatives are, a humic acid reducing
Humic acid reducing bacterium
0.1
Bacillus selenitireducens Selenihalanerobacter shriftii
Geobacter metallireducens
Desulfomonile tiedjei
Wolinella succinogenes Geospirillum arsenophilus
Sulfurospirillum barnesii
Dechloromonas agitata
Thauera aromatica
Thauera selenatis Aeromonas hydrophila
Shewanella putrefaciens P. stutzeri P.stutzeri (Laboratory
contaminant)* Gill symbiont of T. flexuosa
NSS AF170459 KE4OH1
AK4OH1
γ
β
ε
δ

Microbial Respiration of Arsenic and Selenium
7
bacterium and a perchlorate reducing strain with 99% and 97% similarity respectively.
Strain AK4OH1 is capable of selenate reduction to selenite coupled to respiration and
growth utilizing 4-hydroxybenzoate as sole carbon and energy source. In addition to
selenate, nitrate can also serve as an electron acceptor for the growth of strain AK4OH1
but not sulfate or arsenate. The strain can also utilize other aromatic compounds such as
3-hydroxybenzoate and benzoate and short chain fatty acids such as acetate.
II. Sediment microcosms:
Figure 5: Selenate reducing enrichments showing a red precipitate indicating the
formation of elemental selenium, autoclaved controls shows no selenate transformation

Microbial Respiration of Arsenic and Selenium
8
Table 3: Microcosms setup with sediments from various sampling sites showing selenate
reducing potential
Sampling site
Selenate reducing potential
Sawmill creek- Phragmites +
Sawmill creek -Spartina +
Sawmill creek- Mudflat +
Kearny Marsh +
Chesequake- Phragmites +
Chesequake- Spartina +
Initial enrichment with the sediments from various regions in NJ showed that selenate
could be readily transformed to selenite and even to elemental selenium. Subsequent
transfers have been made and monitored for activity of the sediments. Future studies will
focus on demonstrating activity in sequential transfers and isolation of pure cultures. The
analysis of microcosms fed with arsenate is currently in progress.
References 1. Stolz, J.F and Oremland. R.S. (1999). Bacterial respiration of arsenic and selenium. FEMS Microbiol Reviews. 23: 615-627. 2. Knight V.K, Nijenhuis, I., Kerkhof, L.J., Häggblom, M.M. (2002). Degradation of aromatic compound coupled to selenate reduction. Geomicrobiology Journal. 19:77-86

Development of Supported Liquid Membrane Micro-Extraction(SLMME) followed by Ion-Pair Chromatography (IPC) foranalysis of halo-acetic acids (HAAs) and chlorinated acidherbicides (CAHs) in water
Basic Information
Title:Development of Supported Liquid Membrane Micro-Extraction (SLMME) followedby Ion-Pair Chromatography (IPC) for analysis of halo-acetic acids (HAAs) andchlorinated acid herbicides (CAHs) in water
Project Number: 2003NJ43B
Start Date: 3/1/2003
End Date: 3/1/2004
Funding Source: 104B
Congressional District: 10
Research Category: Water Quality
Focus Category: Methods, Toxic Substances, Water Quality
Descriptors: supported liquid membrane extraction, haloacetic acids, continuous on-line monitoring
Principal Investigators: Xiaoyan Wang, Somenath Mitra
Publication1. Dawen Kou, Xiaoyan Wang and Somenath Mitra Supported Liquid Membrane Micro-Extraction
(SLMME) with HPLC-UV Detection for Monitoring Trace Haloacetic Acids in Water Submitted toJournal of Chromatography A. (2004), in review
2. Xiaoyan Wang, Dawen Kou, Edmund J. Bishop and Somenath Mitra Supported Liquid MembraneMicro-Extraction (SLMME) for the Determination of Trace Organic Acids. Posted at: 227th ACSNational Meeting, March 2004, Anaheim, CA
3. Somenath Mitra, Dawen Kou and Xiaoyan Wang Supported Liquid Membrane Micro-Extraction(SLMME) with HPLC Detection for the Monitoring Trace Haloacetic Acids in Water Presented at:42nd Annual Eastern Analytical Symposium, Nov. 2003, Somerset, NJ
4. Somenath Mitra, Dawen Kou and Xiaoyan Wang Interfacing membrane Extraction with HPLC forContinuous On-line Monitoring Presented at: 42nd Annual Eastern Analytical Symposium, Nov.

2003, Somerset, NJ

Annual Report submitted to USGS/NJWRRI (Year 2003) Development of Supported Liquid Membrane Micro-Extraction (SLMME) followed
by Ion-Pair Chromatography (IPC) for analysis of halo-acetic acids (HAAs) and chlorinated acid herbicides (CAHs) in water
Xiaoyan Wang and Somenath Mitra*
New Jersey Institute of Technology
Research Objectives: The objective of this study is to develop an analytical method for the continuous on-line monitoring haloacetic acids, which is the major group of the nonvolatile disinfection byproducts (DBPs) in drinking water [1]. Table 1 lists the names, formula, acronyms and properties of the nine HAAs [2]. Continuous supported liquid membrane extraction (SLME) followed by high performance liquid chromatography is designed for the on-line monitoring. This technique is automated, fast, and eco-friendly, i.e., it uses minimum amount of organic solvent and other chemicals. This technique provides high enrichment factors for real-time monitoring, and the liquid membrane is inexpensive and is easy to be regenerated. Table 1. Names, Formula, Acronyms, and Properties of Haloacetic Acids
Names Formula Abbreviation pKa LogP Monochloroacetic acid ClCH2COOH MCAA 2.87 0.22 Dichloroacetic acid Cl2CHCOOH DCAA 1.26 0.92 Monobromoacetic acid BrCH2COOH MBAA 2.89 0.41 Bromochloroacetic acid BrClCHCOOH BCAA 1.39 1.14 Dibromoacetic acid Br2CHCOOH DBAA 1.47 1.69 Trichloroacetic acid Cl3CCOOH TCAA 0.51 1.33 Bromodichloroacetic acid BrCl2CCOOH BDCAA 1.09 2.31 Chlorodibromoacetic acid ClBr2CCOOH CDBAA 1.09 2.91 Tribromoacetic acid Br3CCOOH TBAA 2.13 3.46 Methodology: Figure 1 shows the system of continuous supported liquid membrane extraction followed by online HPLC-UV detection. It includes a hollow fiber membrane module, two pumps and a HPLC system. The first pump (a Hewlett-Packard 1050 HPLC pump) was used for the delivery of the acceptor (0.05 M tris buffer PH=8.7) and the other (a Beckman 110B pump) for the acidified HAAs water sample. A timer controlled six-port HPLC injection valve (Valco Instruments Co. Inc., Houston TX) was used to make automatic injections into a Hewlett-Packard 1050 HPLC system with a Waters 486 tunable absorbance UV detector. The wavelength was set at 210nm. Water sample flowed

through the shell side of the membrane module while the acceptor flowed inside the hollow fiber lumen. The HAAs molecules in the water sample were extracted and enriched into the acceptor. The extract was injected automatically into the HPLC system by a timer controlled six-port injection valve every fifteen minutes. The sample loop volume was 20 µl. Minichrom V 1.62 software (VG Data System) was used for data acquisition.
Figure 1. Schematic diagram of continuous supported liquid membrane extraction followed by HPLC-UV detection. The membrane module for SLME was made with by packing three pieces of 130 cm long hollow fiber membrane into a Teflon tube. The membrane was Celgard® X20 (Hoechst Celanese, Charlotte, NC). It had an I.D. of 400 µm and an O.D. of 460 µm, with an average pore size of 0.03 µm and porosity of 40%. The membranes were soaked with membrane liquid (5% trioctylphosphine oxide in Di-hexyl ether) before fixed into the system. The HPLC column used here was a 150 mm × 4.6 mm YMC ODS-A C18 column with 3 micron packing. The HPLC mobile phase was 95:5 (v/v) 15 mM KH2PO4 (PH 2.2): Acetonitrile at a flow rate of 1.0 ml/min. Only 0.75 ml acetonitrile was consumed per HPLC run (5%*1ml/min*15min=0.75ml). Principal Findings and Significance: The effects of the acceptor flow rate on enrichment factor (EF) and extraction efficiency (EE%) in continuous SLME were studied. The flow rate of water sample was kept constant at 1 ml/min, while the acceptor flow rate was changed from 0.005 ml/min to 0.02 ml/min. The acceptor was first collected and the volume was measured. It was found that the loss of acceptor during extraction was negligible. Thus the experiment was

carried out online with HPLC-UV detection. EF and EE (%) as a function of the acceptor flow rate are shown in Figure 2 and Figure 3 respectively. EF decreased significantly with the increase of the donor flow rate. At a lower flow rate, the contact time of the analytes with the acceptor increased, thus relatively more analytes could be trapped into the acceptor. Also with a lower acceptor flow rate the concentrations of analytes were higher than in with a higher flow rate because of the less volume of acceptor. The EE increased with acceptor flow rate increase from 0.005 ml/min to 0.015 ml/min, then decreased as the acceptor flow rated increased to 0.02 ml/min.
0
10
20
30
40
50
60
70
80
0 0.005 0.01 0.015 0.02
Acceptor flow rate (ml/min)
EF
MCAADCAAMBAABCAADBAATCAABDCAACDBAATBAA
Figure 2. EF as a function of acceptor flow rate, the donor flow rate was kept constant at 1 ml/min.
0
10
20
30
40
50
60
0 0.005 0.01 0.015 0.02
Acceptor flow rate (ml/min)
EE
(%)
MCAADCAAMBAABCAADBAATCAABDCAACDBAATBAA
Figure 3. EE (%) as a function of acceptor flow rate, the donor flow rate was kept constant at 1 ml/min.

The effects of the donor flow rate on EF and EE was also studied. The acceptor flow rate was kept constant at 0.005 ml/min, while the donor flow rate was increased from 1 ml/min to 4 ml/min. Analysis was performed online. EF as a function of the donor flow rate is shown in Figure 4. EF increased dramatically as the flow rate of water sample increased from 1 ml/min to 4 ml/min. With a higher donor flow rate, more analytes contacted the membrane, thus resulting in more analytes trapped in the acceptor, which led to higher EF. EE increases with the increase of EF but decreases with the increase of the donor flow rate, the result is shown in Figure 5.
0
100
200
300
400
500
0 1 2 3 4 5
Donor flow rate (ml/min)
EF
MCAADCAAMBAABCAADBAATCAABDCAACDBAATBAA
Figure 4. EF as a function of water sample (Donor) flow rate, the flow rate of acceptor was kept constant at 0.005 ml/min
0
10
20
30
40
50
60
70
0 1 2 3 4 5
Donor flow rate (ml/min)
EE
(%)
MCAADCAAMBAABCAADBAATCAABDCAACDBAATBAA
Figure 5. EE (%) as a function of water sample (Donor) flow rate, the flow rate of acceptor was kept constant at 0.005 ml/min

The continuous online monitoring of nine HAAs was performed by SLME combined with online HPLC-UV detection. The HAAs in acidified donor were extracted and trapped in alkaline acceptor. The enriched acceptor was automatically injected into the HPLC-UV system every fifteen minutes by the timer controlled six-port injection valve. Sequential chromatograms were obtained and shown in Figure 6. The donor was a water sample (PH=1.9) containing 80 ng/ml (ppb) of nine HAAs. The donor flow rate was 4 ml/min. The acceptor was 0.05 M tris buffer (PH 8.7) at a flow rate of 0.005 ml/min. Good reproducibility in peak shape and retention time were observed.
Figure 6. Chromatogram of continuous SLME of a water sample (PH 1.9) containing 80 ng/ml (ppb) nine HAAs: 1: MCAA, 2: DCAA, 3: MBAA, 4: BCAA, 5: DBAA, 6: TCAA, 7: BDCAA, 8: CDBAA, and 9: TBAA. The water sample flow rate was 4 ml/min. The acceptor was 0.05 M tris buffer (PH 8.7) at a flow rate of 0.005 ml/min. Injections were made every 15 min. Relative standard deviations, enrichment factors, extraction efficiencies and method detection limits (MDLs) were obtained and listed in Table 2. The donor used was a water sample (PH=1.9) containing 21 ppb MCAA, 3 ppb MBAA and 1 ppb other seven HAAs. The donor flow rate was 4 ml/min. The acceptor was 0.05 M tris buffer (PH 8.7) at a flow rate of 0.005 ml/min. The RSDs are between 3.3 and 10.3 %. With this new developed method enrichment factor as high as 500 and MDLs at sub-ppb levels were obtained. With minor modification, this method should also be able to analyze basic compounds in water.

Table 2. Analytical Performance of continuous SLME-HPLC HAAs RSD* (%) EF EE** (%) MDL*** (ng/ml) MCAA 10.3 71.3 8.9 6.84 DCAA 10.3 335.5 41.9 0.32 MBAA 3.5 335.9 42.0 0.33 BCAA 4.2 273.6 34.2 0.13 DBAA 4.8 412.1 51.5 0.15 TCAA 5.7 383.4 48.0 0.18 BDCAA 5.9 412.3 51.5 0.18 CDBAA 3.3 428.4 53.6 0.10 TBAA 8.8 305.5 38.2 0.28 *Relative Standard Deviations (RSD) based on seven replications were obtained at concentrations of 21 ppb MCAA, 3 ppb MBAA, and 1 ppb rest 7 HAAs. **EF and EE were obtained using spiked water samples at the above concentrations. ***The Method Detection Limits (MDLs) were obtained following a standard EPA procedure [3]. References: 1. Shukairy, H. M.; Milter, R. J.; Scott, S. R. J. AWWA (1994), 86, 72 2. Kou, D.; Wang, X.; Mitra, S. submitted to J. Chromatogr. A. (2004), in review 3. 40 Code Fed. Register. 1994, Part 136, Appendix B.

Seed Dispersal Dynamics in a Restored Salt Marsh: Implicationsfor Restoration Success
Basic Information
Title: Seed Dispersal Dynamics in a Restored Salt Marsh: Implications forRestoration Success
Project Number: 2003NJ44B
Start Date: 3/1/2003
End Date: 3/1/2004
Funding Source: 104B
Congressional District: 6
Research Category: Water Quality
Focus Category: Wetlands, Ecology, Management and Planning
Descriptors: wetlands, seed dispersal, urban tidal marsh, wetland plants
Principal Investigators: Polly L. Hicks, Joan G. Ehrenfeld
Publication1. Hicks, P. L. and J. M. Hartman. 2004. Can natural colonization successfully restore salt marsh
habitat?: a three-year assessment (New Jersey). Ecological Restoration 22(2): 141-143.

Hicks – NJWRRI Final Report 1
DOCUMENT 2 Seed Dispersal Dynamics in a Restored Tidal Marsh: Implications for Restoration Success
Annual Report Submitted to the NJWRRI By Polly L. Hicks
Problem and Research Objectives With the passing of the 1987 Freshwater Wetlands Protection Act, New Jersey established one of the most stringent and protective wetlands regulations in the United States. However, New Jersey is still experiencing a substantial decline in its wetlands with a loss of over 15,798 acres since 1986 (Balzano et al. 2002). Many of these losses are due to the apparent failure of wetland mitigation, which is the compensation for unavoidable negative impacts to wetland habitat through the restoration or creation of other wetlands. A federal study by the National Research Council (2001) and a state-wide study through the NJ Department of Environmental Protection (Balzano et al. 2002) have found that mitigation practices are not achieving the goal of preventing wetland loss. Mitigation failure is, in part, due to gaps in our ecological understanding of these valuable ecosystems and a lack of rigorous testing of restoration practices (NRC 2001; Balzano et al. 2002). Even in systems with relatively simple community structures, such as salt and brackish marshes, restorations still suffer from the trial and error approaches that plague all wetland restorations (Zedler 1995). To make restoration more successful, methodologies must be rigorously tested in different systems to determine under what conditions they can be effectively implemented (Zedler 2000; Roman et al. 2002). This research, which was supported by the New Jersey Water Resources Research Institute, critically examined one restoration approach (natural colonization) and its application to marsh restoration. Saline and brackish marshes (tidal marshes) are wetland systems that are flushed daily by two high and two low tides of saline or brackish water. The vegetation of a tidal marsh is characterized by low diversity and distinct vegetation zones that occur within specific tidal ranges (Mitsch and Gosselink 2000). These vegetation bands or zones are generally dominated by one or two clonal graminoids with small populations of other species occurring in infrequent patches (Niering and Warren 1980; Mitsch and Gosselink 2000). The most common approach to tidal marsh restoration is to plant only one or two of the dominant graminoids, such as Spartina alterniflora, across the entire site. It is assumed that other tidal marsh species will eventually colonize the restored site as seeds are carried in on the incoming tide. Predicting the amount of natural colonization that is likely to occur at a restoration site is difficult because the basic ecology of dispersal through tidal flushing in tidal marshes has not been well researched. The few studies that have directly examined the issue of tidal transport in these marsh systems have produced conflicting results. While Koustaal et al. (1987) documented the long distance, mass transport of seeds from a marsh interior, Rand (2000) found little indication of seed movement between different marsh zones. Huiskes et al. (1995) found that although seeds moved out of the marsh in large numbers, very few seeds moved into the marsh system. Seed bank studies of tidal marsh systems have produced similar conflicting results. Several studies found well-mixed, species-rich seed banks that contrasted the zonation pattern of the vegetation indicating strong dispersal forces (Hopkins and Parker 1984; Baldwin et al. 1996);

Hicks – NJWRRI Final Report 2
however, others found seed banks to strongly reflect the vegetation (Hutchings and Russell 1989; Rand 2000; Egan and Ungar 2000). Based on these dispersal and seed bank studies it appears that secondary dispersal of seeds by tides may, under certain conditions, allow for natural colonization of tidal marshes. The goal of this study was to critically investigate seed dispersal dynamics in a restored urban tidal marsh with the aim of furthering our understanding of the influence of seed dispersal on restoration success. More specifically, I examined whether new species are occurring within the restored marsh, whether tidal inundation and/or position along the main channel are influencing dispersal patterns, and how dispersal patterns relate to vegetation community development.
Methodology This study was conducted in the Mill Creek Marsh Wetlands Restoration Site (the Site) located in the Hackensack Meadowlands (Meadowlands) of northeastern New Jersey. The Meadowlands is a heavily degraded saline and brackish marsh system. A majority of wetlands within the Meadowlands are dominated by Phragmites australis, an invasive wetland species that forms dense monocultures in which few, if any, plant species can exist (Windham and Lathrop 1999; Keller 2000). The Site is a 137-acre tidal marsh that was restored in 1999. During restoration Phragmites australis was removed and the site was re-graded to restore the tidal cycle and elevation gradient. Spartina alterniflora was seeded and planted in over 30 acres of the low marsh zone.
Seed Input Characterization and Vegetation Community Sampling
To examine the influence of position within the Site, I established 26 sampling stations, 13 around the mouth of the marsh (where the channel enters the Site) and 13 in the marsh interior. At each sampling station three 1 x 1 m plots were established using stratified random sampling, with one plot in the low marsh, one in the high marsh and one in the transitional habitat (transition) between the high marsh and upland habitats. To characterize the seed input, 20 x 20 cm seed traps were placed at the center of each plot in July of 2002, well before most species set seed. To maximize seed input and minimizes trap deterioration, the seed traps were replaced in September 2002 and December 2002, with the final trap collection occurring in April. Collected seeds were grown out for identification purposes. A majority of tidal marsh plants require cold stratification to break dormancy (Baskin and Baskin 1998); therefore, to maximize germination, traps collected in September and December were kept at 4oC for a minimum of six weeks to mimic the over-wintering process. Traps collected in April were not subjected to this regime because they over-wintered in the marsh. After stratification, the traps were placed in germination chambers and subjected to spring temperature and light regimes (14 light hours at 25oC and 10 dark hours at 15oC). Traps were kept continuously damp with freshwater. As seeds germinated, seedlings were counted and marked with colored toothpicks. Representative seedlings were transferred to soil-filled pots to be grown until they could be identified. The number of seedlings for each species found in a seed trap was recorded. The total seed input for a plot was calculated by combining the data from the September, December and April traps.

Hicks – NJWRRI Final Report 3
Any plots with a missing trap were excluded from the analyses; as a result, there were 17 low marsh plots, 20 high marsh plots and 24 transition plots. During July and August of 2002 and 2003, the standing vegetation within the 1 x 1 m plots was surveyed, excluding the 400 cm2 area where the seed traps were placed. Each species found within a plot was identified and its percent cover recorded. The 2002 standing vegetation data was compared against the seed input data to determine the magnitude of secondary dispersal that was occurring in each plot. A comparison of the seed input with the vegetation community of the following year allowed for an examination of how the seed input is influencing the vegetation community. Experimental Seed Release During the spring tides of September and October, a seed release experiment was conducted at four locations in the middle portion of the marsh. These spring tides are some of the highest tides of the year and, therefore, represent the largest potential for tidal movement of seeds. At each sampling location, two plots were established, one in the low marsh and one in the high marsh zones. Eight 2-meter long transects extended out from the center of the plots with adjacent transects at 45 degree angles from each other. Two days before the highest tide of the month, dyed seeds (one color for low marsh and one for high marsh) were released at the center of each plot during low tide. 10,000 seeds were released in the high marsh and 1,000 in the low marsh plots. After four days, the number of dyed seeds found at 20-cm intervals along each transect was measured. The data collected for this portion of the experiment is currently being analyzed. From this information I will be able to develop a detailed contour of the seed shadow including the different densities at which seeds are found as well as estimate the number of seeds that have been transported out of the local area due to tidal forces.
Principal Findings and Significance
Seed Input The seed input for the site was comprised of 54 species including 34 forbs, 13 graminoids and 7 woody species. Twelve of these species have not been previously found within the site; thirteen species were known to occur within the Site but had not been found in any of the plots monitored for this experiment. The twelve species new to the Site represent a mixture of common weedy species and wetland plants. Typha angustifolia and Ranunculus scerleratus are the only wetland species known to tolerate brackish and saline conditions (Hough 1983; Gleason and Cronquist 1991). Panicum dichtoflorum is also a weedy species that is commonly found along the edges of brackish and salt marshes (Hough 1983; Gleason and Cronquist 1991). Spartina alterniflora was the only typical dominant clonal graminoid, excluding P. australis, to have viable seeds in the seed input. S. alterniflora occurred in two plots with one viable seed in each. The seed input was heavily dominated by forb species, which accounted for over 50% of the seed input in the low and transition zones and 80.2964.74% of the high marsh seeds (Figure 1). The mean relative composition of graminoids was highest in the low marsh zone (46.786 6.06%) with the transition following at 31.726 6.14%. Only 13.5763.31% of the seed input to the high
Hicks – NJWRRI Final Report 4
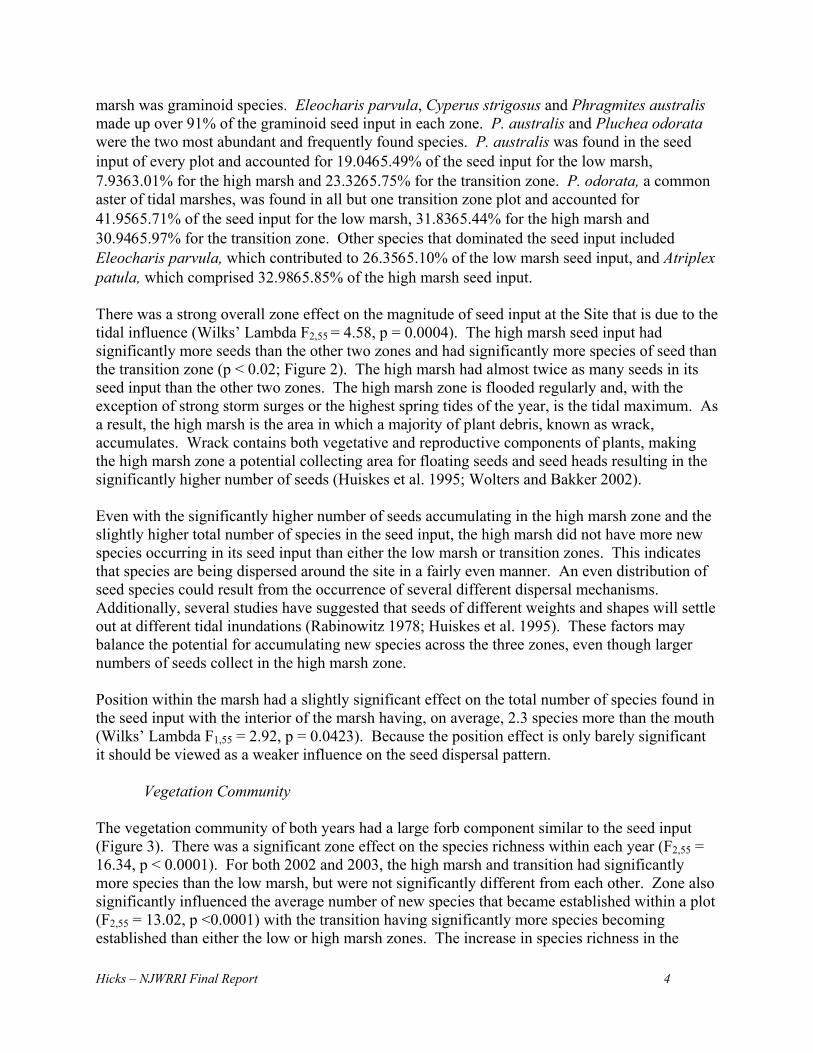
marsh was graminoid species. Eleocharis parvula, Cyperus strigosus and Phragmites australis made up over 91% of the graminoid seed input in each zone. P. australis and Pluchea odorata were the two most abundant and frequently found species. P. australis was found in the seed input of every plot and accounted for 19.0465.49% of the seed input for the low marsh, 7.9363.01% for the high marsh and 23.3265.75% for the transition zone. P. odorata, a common aster of tidal marshes, was found in all but one transition zone plot and accounted for 41.9565.71% of the seed input for the low marsh, 31.8365.44% for the high marsh and 30.9465.97% for the transition zone. Other species that dominated the seed input included Eleocharis parvula, which contributed to 26.3565.10% of the low marsh seed input, and Atriplex patula, which comprised 32.9865.85% of the high marsh seed input. There was a strong overall zone effect on the magnitude of seed input at the Site that is due to the tidal influence (Wilks’ Lambda F2,55 = 4.58, p = 0.0004). The high marsh seed input had significantly more seeds than the other two zones and had significantly more species of seed than the transition zone (p < 0.02; Figure 2). The high marsh had almost twice as many seeds in its seed input than the other two zones. The high marsh zone is flooded regularly and, with the exception of strong storm surges or the highest spring tides of the year, is the tidal maximum. As a result, the high marsh is the area in which a majority of plant debris, known as wrack, accumulates. Wrack contains both vegetative and reproductive components of plants, making the high marsh zone a potential collecting area for floating seeds and seed heads resulting in the significantly higher number of seeds (Huiskes et al. 1995; Wolters and Bakker 2002). Even with the significantly higher number of seeds accumulating in the high marsh zone and the slightly higher total number of species in the seed input, the high marsh did not have more new species occurring in its seed input than either the low marsh or transition zones. This indicates that species are being dispersed around the site in a fairly even manner. An even distribution of seed species could result from the occurrence of several different dispersal mechanisms. Additionally, several studies have suggested that seeds of different weights and shapes will settle out at different tidal inundations (Rabinowitz 1978; Huiskes et al. 1995). These factors may balance the potential for accumulating new species across the three zones, even though larger numbers of seeds collect in the high marsh zone. Position within the marsh had a slightly significant effect on the total number of species found in the seed input with the interior of the marsh having, on average, 2.3 species more than the mouth (Wilks’ Lambda F1,55 = 2.92, p = 0.0423). Because the position effect is only barely significant it should be viewed as a weaker influence on the seed dispersal pattern.
Vegetation Community The vegetation community of both years had a large forb component similar to the seed input (Figure 3). There was a significant zone effect on the species richness within each year (F2,55 = 16.34, p < 0.0001). For both 2002 and 2003, the high marsh and transition had significantly more species than the low marsh, but were not significantly different from each other. Zone also significantly influenced the average number of new species that became established within a plot (F2,55 = 13.02, p <0.0001) with the transition having significantly more species becoming established than either the low or high marsh zones. The increase in species richness in the

Hicks – NJWRRI Final Report 5
vegetation community between years can be partially attributed to the seed input. When compared to the 2002 vegetation community, the seed input for the three marsh zones had on average 3 to7 more species and included 6 to 7 new species. Even though the high marsh had a significantly more species rich and abundant seed input than the transition zone, it was the transition zone that had the greatest increase in species richness between years. The discrepancy between the seed input and species establishment is likely due to the harsher environmental conditions of the high marsh in comparison to the transition zone. The high marsh is flooded approximately 20 days out of the month and has waterlogged and sometimes anaerobic soils. In contrast, the transition zone is inundated only once or twice during the course of a year and thus has more aerated soils, which are more favorable to germination and vegetation establishment. Additionally, 2002 was a drought year and 2003 was a very wet year. The vegetation community of the transition zone, which is not regularly flooded, would have been more impacted by a very dry year than the regularly flooded high marsh. Therefore, the large increase in species between 2002 and 2003 in the transition may be, in part, due to the more favorable germination and establishment condition of 2003.
Relationship between Seed Input and Vegetation
A nonmetric multidimensional scaling ordination of the two-year vegetation community data and the seed input, showed that the vegetation community was separating out across the three zones with only slight overlapping occurring between the communities of adjacent zones (Figure 4). The seed input of the three zones overlapped with the vegetation communities, but clustered together more tightly than the vegetation data (Figure 5). Within the seed input cluster, the input of each zone formed individual groups with some overlapping among adjacent zones. The seed input for all three zones also remained close to or overlapped with the vegetation of that zone. This pattern indicates that although there is some mixing of seeds among marsh zones, resulting in the seed input of the zones being more similar than the standing vegetation, the seed input still retains the signature of its zonal community.
Conclusion
The results of this study indicate that although there are a substantial number of new species occurring in the seed input and that there are significant strong zone and weaker position effects, the local signature of the vegetation community and adjacent habitats remains very strong. Twelve seed species (22% of the total number of species in seed) were entirely new to the site. Only three of the new species are tolerant of brackish or saline conditions. Common tidal marsh forbs have readily colonized the site and comprise a large portion of the seed input and standing vegetation communities. Although the forb species are common in tidal marshes they typically occur in small, scattered populations within the larger bands of clonal graminoids. The desired graminoid dominants are not readily colonizing the Site, even though healthy populations of these species are known to occur within the Meadowlands. Prior studies have found that vegetative reproduction is more important than sexual reproduction for structuring tidal marsh communities and for the colonization of bare patches on the marsh surface (Bertness and Ellison 1987; Shumway and Bertness 1992). Because of the important

Hicks – NJWRRI Final Report 6
role that vegetative reproduction plays in tidal marsh community, dominant clonal species may not be producing as many viable seeds as other marsh species, making dispersal a limiting factor to their successful establishment in restored marshes. The population dynamics of Spartina alterniflora provides some support for this idea. S. alterniflora successfully planted in approximately 30 acres of the Site. Although these populations did set seed in the fall of 2002, only two plots had viable seeds of this species with one seed in each plot. Phragmites australis is another clonal graminoid for which the viability of its seeds has been under debate in recent literature. In this experiment, I found high numbers of viable P. australis seeds through out the Site, which comprised 8 to 23% of the seed input for the three marsh zones. Because this species dominates thousands of wetland acres in the Meadowlands, even with a low proportion of viable seeds, it could still potentially dominate the seed input of a restored sites. To prevent restored sites from returning to Phragmites-stands, managers should implement long-term monitoring of these sites for starter populations of P. australis. Reliance on natural colonization to effectively restore saline and brackish tidal marsh systems must be examined carefully. In a highly urban and degraded system such as the Meadowlands, dispersal may be a limiting factor for the dominant components of the target community. Until these dispersal dynamics are better understood, practitioners working in tidal marshes with reduced populations of desired species and distant seed sources should strongly consider planting a variety of species rather than one dominant species.
Literature Cited Baldwin, A. H., K. L. McKee and I. A. Mendelssohn. 1996. The influence of vegetation, salinity and inundation on seed banks of oligohaline coastal marshes. American Journal of Botany 83: 470-479. Balzano, S., A. Ertman, L. Brancheau, and W. Smajkal. 2002. Creating Indicators of Wetland Status (Quantity and Quality): Freshwater Wetland Mitigation in New Jersey. NJ Department of Environmental Protection, Division of Science, Research and Technology. Trenton, NJ. Baskin, C. C. and J. M. Baskin. 1998. Seeds: Ecology, Biogeography, and Evolution of Dormancy and Germination. Academic Press, New York. Bertness, M. D. and A. M. Ellison. 1987. Determinants of patterns in a New England salt marsh plant community. Ecological Monographs 57: 129-147. Egan, T. and I. A. Ungar. 1999. The effects of temperature and seasonal change on the germination of two salt marsh species, Atriplex prostrate and Salicornia europea, along a salinity gradient. International Journal of Plant Sciences 160: 861-867. Gleason, A. and A. Cronquist. 1991. Manual of Vascular Plants of Northeastern United States and Adjacent Canada, 2nd edition. New York Botanical Gardens, Bronx, New York.

Hicks – NJWRRI Final Report 7
Hopkins, D. R. and V. T. Parker. 1984. A Study of the seed bank of a salt marsh in northern San Francisco Bay. American Journal of Botany 71: 348-355. Hough, M. Y. 1983. New Jersey Wild Plants. Harmony Press. Harmony, New Jersey.
Huiskes, A. H., B. P. Koustaal, P. M. Herman, W. G. Beeftink, M. M. Markusse and W. DeMunk. 1995. Seed dispersal of halophytes in tidal salt marshes. Journal of Ecology 83: 559-567. Hutchings, M. J. and P. J. Russell. 1989. The seed regeneration dynamics of an emergent salt marsh. Journal of Ecology 77: 615-637. Keller, B. E. M. 2000. Plant diversity in Lythrum, Phragmites, and Typha marshes, Massachusetts, U.S.A. Wetlands Ecology and Management 8: 391-401. Koustaal, B. P., M. M. Markusse, and W. De Munck. 1987. Aspects of seed dispersal by tidal movements. Pages. 226-233 in A. H. L. Huiskes, C. W. P. M. Bloom and J. Rozema, editors. Vegetation Between Land and Sea. Junk Publishers, Boston. Mitsch, W. J. and J. G. Gosselink. 2000. Wetlands, 3rd edition. John Wiley and Sons, Inc., New York. Niering, W. A. and R. S. Warren. 1980. Vegetation patterns and processes in New England salt marshes. BioScience 30: 301-307. National Research Council. 2001. Compensating for Wetlands Losses Under the Clean Water Act. National Academy Press, Washington, D. C. Rabinowitz, D. 1978. Early growth of mangrove seedlings in Panama, and an hypothesis concerning the relationship of dispersal and zonation. Journal of Biogeography 5: 113-133. Rand, T. A. 2000. Seed dispersal, habitat suitability and the distribution of halophytes across a salt marsh tidal gradient. Journal of Ecology 88: 608-621. Roman, C. T., K. B. Raposa, S. C. Adamowicz, M. James-Pirri, and J. G. Catena. 2002. Quantifying vegetation and nekton response to tidal restoration of a New England salt marsh. Restoration Ecology 10: 450-460. Shumway, S. W. and M. D. Bertness. 1992. Salt stress limitation of seedling recruitment in a salt marsh plant community. Oecologia 92: 490-497. Windham, L. and Lathrop, R. G. 1999. Effects of Phragmites australis (common reed) invasion on aboveground biomass and soil properties in brackish tidal marsh of the Mullica River, New Jersey. Estuaries 22: 927-935.

Hicks – NJWRRI Final Report 8
Wolters, M. and J. P. Bakker. 2002. Soil seed bank and driftline composition along a successional gradient on a temperate salt marsh. Applied Vegetation Science 5:55-62. Zedler, J. B. 1995. Salt marsh restorations: lessons from California. Pages 75-95 in J. Cairns, editor. Rehabilitating Damaged Ecosystems, 2nd edition. Lewis Publishers, Ann Arbor. Zedler, J. B. 2000. Progress in wetland restoration ecology. Trends in Ecology and Evolution 15: 402-407.

Hicks – NJWRRI Final Report 9
Figure 1. Mean percent composition of the seed input for the three marsh zones. Forbs are represented by the solid white bar, graminoids by diagonal bars and woody species by the solid gray bar.
0
20
40
60
80
100
Low Marsh High Marsh Transition
Mea
n %
Com
post
ion
0
2
4
6
8
10
12
14
Mea
n #
Spec
ies
0
0.75
1.5
2.25
Mea
n Se
ed D
ensi
ty (s
eeds
/cm
2 )
0
300
600
900A
vera
ge #
See
dsA
b
a
b
Low Marsh High Marsh Transition
Figure 2. Mean seed density/number of seeds (A) and mean number of species (B) occurring in the seed input for the three marsh zones. Letters correspond to statistical differences found from Bonferroni tests (p<0.05).
B
Low Marsh High Marsh Transition
aab
b

Hicks – NJWRRI Final Report 10
0102030405060708090
100
Low High Transition Low High Transition
2002 2003
Mea
n R
elat
ive
Cov
er
Figure 3. Mean relative cover of the standing vegetation communities found in the three marsh zones in 2002 and 2003. Forbs are represented by the solid white bar, graminoids by diagonal bars and woody species by the solid gray bar.
-2
-1.5
-1
-0.5
0
0.5
1
1.5
-2 -1.5 -1 -0.5 0 0.5 1 1.5
Figure 4. Nonmetric multidimensional scaling ordination of the two-year vegetation community and seed input data. The low marsh data is represented by triangles, high marsh by circles and the transition zone by squares. The 2002 plots are represented by the filled symbols and the 2003 plots by the open symbols; the seed input data is in gray. Lines have been drawn around the vegetation communities of the different zones and years. The solid line represents the low marsh, dashed line the high marsh and dotted line the transition zone. The 2002 lines are black and the 2003 lines are gray.
Axis 1
Axis 3

Hicks – NJWRRI Final Report 11
Figure 5. Nonmetric multidimensional scaling ordination of the two-year vegetation community and seed input data. The seed input plot data is in balck and the vegetation data for both years is in gray. The low marsh data is represented by triangles, high marsh by circles and the transition zone by squares. Lines have been drawn around the seed input of the three zones with the the solid line representing the low marsh, dashed line the high marsh and dotted line the transition zone.
-1.5
-1
-0.5
0
0.5
1
1.5
-1.5 -1 -0.5 0 0.5 1 1.5
Axis 1
Axis 3

Potential Nitrogen Saturation in Urban Wetlands
Basic Information
Title: Potential Nitrogen Saturation in Urban Wetlands
Project Number: 2003NJ47B
Start Date: 3/1/2003
End Date: 3/1/2004
Funding Source: 104B
Congressional District: 6
Research Category: Water Quality
Focus Category: Nitrate Contamination, Wetlands, Ecology
Descriptors: nitrogen cycling, denitrification, nitrate leaching, urban ecology, urban hydrology
Principal Investigators: Emilie Stander, Joan G. Ehrenfeld
Publication

Project Information Problem and Research Objectives: It is a widely held belief that wetland systems do not experience nitrogen (N) saturation owing to their ability to remove nitrate (NO3
-) through denitrification. However, due to hydrological alteration resulting from urban land use, urban wetlands in northeastern New Jersey may experience lowered water tables and thus overall drier conditions and wet-dry cycles that may reduce NO3
- removal capacity. This may cause New Jersey’s urban wetlands to be acting as sources rather than sinks of NO3
-, leading to elevated NO3
- concentrations in receiving water bodies and associated impacts on the integrity of aquatic ecosystems in this state. This research investigates the occurrence of N saturation symptoms in urban wetlands located in northeastern New Jersey and therefore directly addresses research priorities one, the integrity of aquatic and water-associated systems, and five, the impacts of land-use practice and change on water resources, of NJWRRI’s grants program. This research can also serve to direct restoration and management guidelines in the state. If it is demonstrated that lowered water tables, dry soils, and wet-dry cycles are responsible for degradation of wetland function, streambank and riparian buffer restoration projects can focus on restoring saturated hydrological conditions to these systems.
Elevated NO3- levels in New Jersey’s streams and groundwater suggest that
riparian buffers and riverine wetlands could be a management tool for improving the integrity of this state’s aquatic systems. However, the existing body of research on these systems in other parts of the country and the world does not serve as an adequate predictor of riverine wetland NO3
- removal capacity in New Jersey for several reasons. First, many of these wetlands are located in urbanized watersheds. In particular I consider the wetlands of the northeastern portion of the state in the area bounded to the west and south by I-287. This area includes the most highly urbanized region of the state. This landscape setting may critically alter structure and function of urban wetlands as compared to wetlands located in less disturbed areas. Impervious surfaces associated with urban and suburban land use result in altered hydrology in the wetlands and their receiving streams. Reduced infiltration of stormwater due to impervious cover leads to reduced groundwater recharge and flow and thus reduced baseflow. It also leads to reduced surface water storage and thus increased surface runoff following rain events. This runoff is channeled from impervious surfaces directly to receiving water bodies. The high volume of stormwater reaching receiving streams over a short period of time results in increased erosive force, which causes stream incision and downcutting. These large-scale hydrological alterations can cause or associate with hydrological alterations in wetland soils which in turn affect wetland function, in particular NO3
- removal capacity. Stream incision and downcutting caused by high peak flows can result in lowered water tables. This means that the biologically active zone of the soil where the roots and microbial populations are located no longer experiences frequent saturation. Because denitrification requires saturated, anoxic soils, this process may be inhibited in urban wetlands as a result of lowered water tables. I hypothesize that these hydrological alterations lead to a new hydrological regime in wetland soils which affects the ability of wetlands to retain N. Soils that were

previously saturated much of the year now experience periods of dryness followed by saturation after rain events. This new hydrological regime may have consequences for biogeochemical processes in these wetland soils and may in fact cause these systems to produce endogenous NO3
-. The dry periods may stimulate nitrification, the microbially mediated transformation of NH4
+ to the mobile anion NO3-. Following the first flush of
rainfall, this mobile NO3- may be transported to the groundwater and then to receiving
water bodies. Remaining NO3- should be removed by denitrification stimulated by the
newly saturated soils; however, it is unclear how much of the NO3- produced during the
dry periods will be exported before denitrification sets in. The effects of wet-dry cycles on denitrification rates have been studied in wetland systems which have been restored following drainage for agriculture and also in less disturbed wetlands which were artificially flooded in an attempt to increase nutrient removal. These studies indicated that denitrification was stimulated in dry soils following rewetting. These studies did not evaluation NO3
- loss during the initial flush. These dynamics have not yet been investigated thoroughly in urban wetlands. In this study I aim to: 1. Document net N mineralization, nitrification, and denitrification under wet and dry conditions in urban wetlands of contrasting soil types over the course of a one year field-based study. 2. Determine whether urban wetlands with organic and mineral soils are displaying symptoms of N saturation. For the purposes of this study, symptoms of N saturation are considered to be high rates of nitrogen mineralization and nitrification coupled with low rates of denitrification. Methodology: I looked for the presence or absence of N saturation in six urban wetlands adjacent to streams in northeastern New Jersey. I conducted this study in six wetlands representing the two main wetland soil types in this part of the state. The six sites consist of three depressional wetlands with organic soils and three riverine wetlands with mineral soils. The wetlands have hydrographs which display typical urban disturbance: overall low water tables and dramatic fluctuations associated with storm events. Sites are located in Paramus, Cedar Grove, Hillside, Scotch Plains, Edison, and Franklin Lakes. Ideally the presence or absence of N saturation should be determined through measuring inputs and outputs of nitrogen in the system to generate a nitrogen budget. It is not possible to generate a full nitrogen budget, especially for six sites, with this level of funding. Instead I measured specific indicators of N saturation. These include in situ rates of net N mineralization, nitrification, and denitrification. High rates of nitrogen mineralization and nitrification coupled with low rates of denitrification would signal N saturation. I used the intact static core technique developed by Tiedje and others to measure in situ rates of net N mineralization and nitrification. The acetylene block technique was used to measure denitrification rates on the same cores. Three replicate sets of soil cores

were taken in two locations at each site. One location was covered with a plastic tarp to keep out rain; the other location was sited out in the open. Each set of cores consisted of two cores taken from the top 15 cm of the soil. One of the two cores was returned immediately to the laboratory for analysis; the other core was returned to its hole to incubate for three to four weeks.
Upon arrival at the lab, the denitrification analysis was carried out. Rubber septa were placed on each end of the cores, and then five mls of acetylene gas were added to the headspace of each core to block denitrification from progressing from N2O to N2. N2O samples were taken after 2 hours and 6 hours (to generate a rate of denitrification) and analyzed using a Shimadzu GC-14A gas chromatograph equipped with an electron capture detector. Headspace volume was measured using a pressure transducer. After the six hour measurement samples were kept at 4ºC until extracted with 2M KCl. KCl extracts are frozen until analyzed on an RFA/2 autoanalyzer for NH4
+ and NO3-
concentrations. The rate of net N mineralization is calculated as the amount of NH4+ and
NO3- accumulated over the course of the month-long incubation; net nitrification rate is
the amount of NO3- accumulated over the month.
Principal Findings and Significance: Soil cores have been collected and extracted over the period of about one year. I am still in the process of analyzing both gas samples and soil extracts. As a result I do not have data to present in this report. Data will be forthcoming by the end of the summer.

Automated Identification and Quantification of VOCs UsingElectronic Nose Systems
Basic Information
Title: Automated Identification and Quantification of VOCs Using Electronic Nose Systems
Project Number: 2003NJ48B
Start Date: 3/1/2003
End Date: 3/1/2004
Funding Source: 104B
Congressional District: 2
Research Category: Water Quality
Focus Category: Water Quality, ,
Descriptors: Volatile organic compound, Electronic Nose, Pattern classification,
Principal Investigators: Robi Polikar, Kauser Jahan
Publication

AUTOMATED IDENTIFICATION AND QUANTIFICATION OF VOCS USING ELECTRONIC NOSE SYSTEMS
PI: Robi Polikar, Ph.D., Rowan University, Electrical and Computer Engineering
Co PI: Kauser Jahan, Ph.D., P.E., Rowan University, Civil and Environmental Engineering
PROGRESS REPORT Problem and Research Objectives: Volatile organic compounds (VOCs) are found in almost all natural and synthetic materials
and are commonly used in fuels, fuel additives, solvents, perfumes, flavor additives and deodor-ants. Direct industrial and wastewater discharges, accidental spills of fuel products or industrial solvents, and urban runoff are the most likely sources of VOCs in surface waters. Potential health hazards and environmental degradation resulting from the widespread use of VOCs has prompted increasing concern among scientists, industry, regulatory agencies and the general public. Interest in ambient level of VOCs in the environment has increased because of the hu-man health concerns. Of particular interest is the state of New Jersey, due to its hydrogeologi-cally diverse, densely populated and highly industrialized nature. The Long Island – New Jersey (LINJ) study by the USGS in 1997 explored the presence of VOCs in surface and ground waters. Numerous VOCs are frequently detected in these waters.
A common method for analyzing water quality is the analytical detection of such VOCs in a laboratory setting. This method is quite sensitive, accurate and repeatable; however it requires advanced, expensive and bulky equipment, such as gas chromatographs or mass spectrometers. In addition, since these equipment are not portable, they cannot be deployed in the field, and hence require that the samples be transferred to a laboratory. Measurements can also be done by human odor assessors for certain odorous contaminants; however, such measurements are lengthy, labor intensive, expensive and subject to large variability among panelists. Furthermore, neither of the techniques allows continuous long term monitoring, since samples must be ob-tained from the site and transferred to an off-site where the analysis is made.
Therefore, a chemical analysis scheme that is objective, fast, accurate, cost effective, quan-tifiable, and field deployable would be of invaluable benefit in assessing water quality. A recent technology that has spurred interest in measurement and detection of VOCs is the Electronic Nose (Enose) technology. Recently, the application of Enose systems for detecting odorous compounds in wastewater treatment plants, agricultural and landfill sites has also gained promi-nence. Such systems usually have an array of sensors that detect odorous compounds without reference to its chemical composition. The patterns of responses obtained by these sensors are then analyzed through an automated pattern recognition system, such as a neural network. How-ever, most studies to date have concentrated on identification of a specific VOC. In most practi-cal cases, the VOCs appear in a mixture with other gases, typically other VOCs. Existence of several VOCs in a mixture makes the identification task considerably more challenging, primar-ily due to two reasons: i) the sensors themselves usually are not very selective (which is the rea-son for using an array of sensors); and more importantly ii) the sensors tend to be more sensitive to one of the mixture components (dominant component) then they are to others (secondary components). The responses to secondary components are then usually masked by the responses

to dominant components, which make the pattern recognition a very difficult task. This problem is illustrated in Figure 1, which shows the responses of a six-sensor array to four mixtures of Xy-lene (XL), with acetonitrile (ACN), methyl-ethly ketone (MEK), tricholoroethane (TCA) and ethanol (ET). We note that the responses of the sensors, which are polymer coated quartz crystal microbalances (QCMs), are remarkably similar for all four mixtures, and hence the difficulty in identifying the individual components.
The specific goal of this project is therefore to develop an artificial neural network based
automated system for objective, fast, and accurate identification of VOCs that appear in mix-tures. In this preliminary work, we restrict our attention to binary mixtures of VOCs, whose measurements are made by QCM type chemical sensors.
The data available to investigators for this study were acquired previously and include the 24 binary mixtures shown below. The VOC indicated at the topof each column indicate the dominant VOC. The twelve VOCs are Acetonitrile (ACN), Acetone (AC), methyl-ethyl-ketone (MEK), Octane (OC), Hexane (HX), Ethanol (ET), Methanol (ME), Xylene (XL), Toluene (TL), 1,1,1-Trichloroethane (TCA), Trichloroethylene (TCE), and 1,2-Dichloroethane (DCA).
Octane Xylene Toluene TCE EthanolOC & ACN XL & ACN TL & ACN TCE & TCA ET & ACNOC & ET XL & ET TL & ET TCE & MEK ET & MEKOC & MEK XL & MEK TL & MEK TCE & TL ET & HXOC & TL XL & HX TL & HX TCE & ET ET & TCAOC & TCA XL & TCA TL & TCA TCE & HX
Sensors were exposed to these mixtures at all combinations of 150, 300, 500 and 700 parts per million (ppm), giving 16 combinations of concentrations for each of the 24 mixtures listed above (that is, 150 and 150, 150 and 300, 150 and 500, 150 and 700, 300 and 150,..., 700 and 500, 700 and 700 ppm). The concentration information will first be removed from all patterns by normalizing with respect to amplitude, so that identification can be made objectively based on pattern. Once the identification is obtained, the concentrations can then be determined from cali-bration curves, since sensor responses are linear with respect to concentration.
Methodology: The sensor used for determining the reactions of the VOCs in the air is an array of six quartz
crystal microbalances. Each of the six microbalances is coated with a unique polymer film that reacts with the VOCs. When the coated crystal comes in contact with the VOC molecules, the molecules are deposited on the crystal surface, which then causes a measurable change in the resonant frequency of the crystal. The coatings are selected to maximize this frequencychange

for the target VOCs. The coating on the sensors used in this study were: Apiezon (APZ), Poly(isobutylene) (PIB), Poly(diethyleneglycoladipate) (DEGA), Sol-gel (SG), Poly[bis(cyanoallyl)polysiloxane)] (OV), and Poly(diphenoxylphosphorazene) (PDPP). Each of the unique polymers will react differently with the VOC mixtures and hopefully provide dis-criminating information for each of the different mixtures.
The automated classification system is designed as a two stage approach that attempts to
classify the dominant VOC in the mixture and then uses that information to classify the secon-dary component. In order to facilitate the classifier’s operation, separability algorithms are being considered as a preprocessing stage to accentuate the minor differences among response patterns of different VOCs. We are considering several existing algorithms, as well as developing alterna-tives that may work well for this particular application. Those to be explored are defined below.
• Principal Component Analysis (PCA) o This well-established algorithm attempts to find the values that project the data
onto new axes where the variances of the data are greatest. Typically used to re-duce the dimensionality of the problem [1].
• Fisher Linear Discriminant (FLD) o This algorithm, also well established, tries to find the projection that maximizes
the discrimination between different classes of the data in a lower dimensional space [1].
o The projection will minimize the intracluster distance (a measure of similarity of the response patterns corresponding to the same VOCs), while at the same time maximizing the intercluster distance (a measure of similarity of the response pat-terns corresponding to different VOCs).
• Feature Range Stretching (FRS) o Currently being developed, this algorithm adjusts the numerical ranges of pattern
responses: when data values for a feature all fall in a narrow range, this algorithm maps those values to a range of [0 1] to help spread that data and make identifying classes easier [2].
• Nonlinear Cluster Transform (NCT) o Also currently being developed, this algorithm attempts to physically separate
patterns from each other, without changing the dimensionality of the problem. The NCT algorithm finds a vector for each class along which all patterns are pro-jected so that patterns of different classes are well separated from each other [2].
After application of one or more of these algorithms to the data, an automated classifier is
required to determine the dominant and secondary components of the VOCs. As mentioned above, this will be done in two stages: first a neural network will be trained to identify the domi-nant VOC in the mixture. After this classification the data instance (the response pattern) will be passed along to one of five specialized classifiers trained specifically for the classification of the secondary VOC, given one of the five dominant VOCs. These specialized classifiers are trained on a subset of the data that contains only instances from those mixtures with a unique dominant VOC.
A series of classifiers are being explored to find a classifier that will work best for each of the stages of the classification. While one type of classifier may work for the dominant classifi-cation, a different type may be required for the secondary, so those options will be explored.

Each of the classifiers under consideration is described below along with some of the advantages or disadvantages of that approach.
• Multi Layer Perceptron (MLP) Neural Networks o By far the most commonly used and popular neural network architecture. It con-
sists of an input layer and an output layer with one or more hidden layers in be-tween, where each layer itself consists of a series of information processing ele-ments, called nodes. Each node in a layer is connected to every node in the next layer through “weights”, and it is these where the knowledge resides [3].
o Each of the nodes has a nonlinear activation function associated with it, and the output value of the node is based upon the output of that function in relation to its input values. The nonlinear activation function allows the classifier to find deci-sion boundaries between classes that are not linearly separable.
o If the hidden layers do not have the proper number of nodes, the classifier will not be able to learn the boundary between the classes or it will over fit and not be able to classify data it has not seen accurately.
• Radial Basis Function (RBF) Neural Network o Similar to the architecture of a Multi Layer Perceptron, but the activation func-
tions is a radial basis functions and there is only one hidden layer [3]. o This network attempts to map the inputs from a nonlinearly separable feature
space to one that is linearly separable. o This network is more suited for function approximation, but it has been proven to
be a universal approximator, so it can be used as a classifier. • General Regression Neural Network (GRNN)
o A special case of the Radial Basis Function Neural Network, with the only differ-ence being how the weights on the output layer of the network are determined [2].
o Uses a statistical function approximation scheme known as nonlinear regression analysis.
o This network does not require iterative training, so training the network becomes a less time consuming task.
• Probabilistic Neural Network (PNN) o A neural network with only one hidden layer. Each node in the hidden layer cor-
responds to one training data instance [1]. o This network learns only those instances it has seen and classifies based upon
how a new instance relates to those it has seen o For large training data sets, this algorithm requires large amounts of memory for
storage of the network. • Learn ++
o An in-house developed meta-classifier that combines multiple classifiers through weighted majority voting. Learn++ seeks an improved prediction accuracy com-pared any single-classifier system.
o Based upon the principle that a series of weak classifiers appropriately combined into an ensemble can perform better than one strong classifier [4].
o Classifiers are trained using a strategic procedure where consecutive classifiers are trained to focus on those patterns that were misclassified by the previously trained classifiers.

o Each classifier is given a weight based upon how it performs on the training data. Once the system is fully trained, a response pattern is presented to all classifiers and a weighted vote is taken based on the output of each classifier and its weights. The class with the greatest weighted vote is the output of the classifier.
Work is already in progress and in all of these fronts. The specific details of the classifiers
will be provided in subsequent reports as classification performance results become available.
References [1] Duda, R., Hart, P., and Stork, D. Pattern Classification, Second Edition. John Wiley &
Sons, 2001 [2] R. Polikar, Algorithms for enhancing pattern separability, feature selection, and incremental
learning with applications to gas sensing electronic nose applications, Ph.D. Dissertation, Iowa State University, Ames IA , 2000.
[3] D.R. Hush and B.G., Horne, “Progress in supervised neural networks,” IEEE Signal Processing Magazine, vol. 10, no.1, pp.8-39, 1993.
[4] R. Polikar, L. Udpa, S. Udpa, and V. Honavar, Learn++: An incremental learning algorithm for supervised neural networks, IEEE Transactions on System, Man and Cybernetics (C), Special Issue on Knowledge Management, vol. 31, no. 4, pp. 497-508, 2001.

Wetlands in urban regions: connections among wetlandstructure, wetland function and regional water quality.
Basic Information
Title: Wetlands in urban regions: connections among wetland structure, wetlandfunction and regional water quality.
Project Number: 2002NJ16G
Start Date: 10/1/2001
End Date: 9/30/2003
Funding Source: 104G
Congressional District: 6th
Research Category: Biological Sciences
Focus Category: Non Point Pollution, Water Quality, Ecology
Descriptors: denitrification, nitrogen retention, stream macrobiota, wetland function, water quality
Principal Investigators: Joan G. Ehrenfeld, Jonathan G. Kennen
Publication

Wetlands in Urban Regions: Connections Among Wetland Structure, Wetland Function and Regional Water Quality” Significance and Regional Importance: The New Jersey Department of Environmental Protection has made watershed management the primary process for the protection of water resources throughout the state. Of the 20 watershed management units that have been designated, nearly half are primarily urban in land-use (www.state.nj.us/dep/gis/), reflecting the largely urban/suburban nature of the east coast, as well as many regions throughout the country. Watershed management requires knowledge of the functional relationship between landscape elements and water quality and quantity. While extensive data is available to demonstrate the deleterious effects of urban land-use on water resources, there is much less information concerning the ameliorative effects of natural areas, particularly wetlands, within urban regions. In fact, there is remarkably little known about the biotic integrity or functional capacity of urban wetlands, as well as their role in protecting water quality . Analysis of data collected as part of the Long Island-New Jersey Study Unit of the NAWQA Program demonstrate clearly that stream health, as indicated by both benthic invertebrate-based indices of biological integrity (Kennan 1998, 1999) and measurements of pollution by nutrients and pollutant chemicals (O’Brien 1997, O’Brien et al. 1997, Stackelberg 1997, Reiser and O’Brien 1999) is highly correlated with the amount of wetland in the basin. While the ability of wetlands to improve water quality is known in general, especially for agricultural landscapes, there is little information available to evaluate the effectiveness of different qualities and locations of wetlands within urban basins to improve or protect water quality. Indeed, there is little data permitting direct comparisons of wetland structure and function, especially for urban wetlands. Management of urban/suburban watersheds, as well as the restoration of these wetlands, requires better knowledge of the functional role of wetlands in protecting stream water. While the proposed study specifically addresses the urban watersheds of the LI-NJ NAWQA, the results will be widely applicable to urban/suburban watersheds throughout the country. The research will result in quantitative and predictive relationships between the biological and chemical measures of surface water quality obtained through the NAWQA program and quantitative measures of the structure (invertebrate-based indices) and function (nitrogen removal capacity) of wetlands. Furthermore, the two measures of wetland quality will be analyzed for wetlands of different sizes and landscape positions relative to surface waters; the results will be integrated with spatial data on the extent and position of wetlands within the selected watersheds to yield predictive relationships between landscape structure within a watershed and downstream water quality. These results will be of use to a variety of different groups. First, the results will be directly usable by land, water and watershed managers, in both the governmental and private sectors, seeking to protect and manage both wetlands and surface waters. For example, three current controversies in the Rahway River watershed (one of the proposed study areas) involve applications to destroy forested wetlands (one, to construct a sports complex, the other to construct a housing/commercial development) and a request for

state funds to restore wetlands on a previously filled portion of the floodplain. Local and state officials are seeking scientific information on both the function of urban wetlands, and the connection of these wetlands to riverine water quality, in trying to resolve these situations, but the necessary data do not exist. Wetland protection and restoration in urban/suburban regions has taken on an extreme urgency, and is a high priority for government agencies from the federal to the municipal levels, as well as for land-management NGOs; our discussions with land managers in all these sectors indicate that the results will be immediately useful and highly valued by them. Second, the data will be useful to scientists trying to understand the linkage between terrestrial land-use and water quality, as models currently rely simply on total areal extent of wetlands, rather than specific placement, size and internal characteristics of wetlands within a basin. Third, there is an extraordinary lack of information about the functions and qualities of wetlands in urban landscapes; the data will thus provide wetland scientists with important data on a class of wetlands that are not well understood but which are critical for the management of water resources in urban environments. As over half the population of the US now lives in urban/suburban regions, the data will be widely useful. Fourth, the data will complement and extend the NAWQA data, thus improving the usefulness of this extensive research effort. Thus, the results will be directly useful to managers, but also useful to a wide variety of scientists studying the determinants of surface water quality. Progress to date:
Delays were experienced in locating study areas for the project, because of the necessity of matching sites with suitable wetland soils and vegetation adjacent to low-order streams (capable of being sampled without a boat), in watersheds with data from the NAWQA system, with suitable access and permission to work. After lengthy examination of a large number of sites, fifteen sites were selected for the study, and permission received from the owner of the property for access and ability to sample. Although the original project design called for sites of different sizes and positions relative to the stream, it proved impossible to location sufficient sites of each type in each NAWQA watershed for which access and the combination of soils and stream conditions obtained. We therefore took the approach of using hydrogeomorphic classes to establish treatment groups. Five sites in each of three hydrogeomorphic classes were successfully located. Based on prior research by the PI, these hydrogeomorphic classes represent the dominant types of wetland found in this urban region. They are: (1) mineral flat wetlands – large wetlands located on glacial lake sediments, largely driven by precipitation; these sites were drained by small (2-3º order) streams; (2) mineral flat-riverine wetlands, also located on glacial lakebed sediments but also adjacent to higher-order rivers that provided overbank flooding that supplement precipitation as the dominant sources of hydrology; smaller streams within the wetland were selected for invertebrate sampling, and (3) riverine wetlands, adjacent to 4th-order and higher streams, for which overbank flow is the dominant source of water. In addition, four “control” sites were established to provide some comparison with the highly urbanized setting of the main sites. These sites were located either within the Great Swamp National Wildlife Refuge, a 5000-acre protected area within the heavily developed landscape of the rest of the project (mineral

flat site) or in the floodplain of the Millstone River within the Delaware-Raritan Canal State Park. Neither site is truly free of urban impact,but both have natural habitat, rather than urban developed land, immediately adjacent to the sampled riparian wetland and stream corridor.
Within each site, we have installed (1) an RDS well for continuous monitoring of water table levels, and (2) three piezometers arrayed along a transect perpendicular to the stream and crossing the study area for soil function. The piezometers have been monitored on a bi-weekly basis while water is present, and the recording wells are being downloaded regularly. The project was significantly affected by the drought of 2002, as both the wetlands and the adjacent stream corridors were dry for much of the growing season (and indeed the clayey soils were sufficiently hardened that samples could not be obtained). We are now monitoring pH, conductivity, nitrate concentrations (using a nitrate probe), and temperature of the water in the piezometers on each measurement date.
The stream work accomplished to date includes the following:
1. Quantitative sampling of the macro-invertebrate community, by microhabitat type, was conducted through a 200-meter reach. Collected organisms were identified to genus or species, with the assistance of local specialists. Repeat sampling of the streams was conducted in autumn 2003 and spring 2004. One was a multihabitat, semi-quantitative collection conducted with a D-Frame dipnet. This collection was conducted to look at community differences among stream microhabitats (coarse woody debris, bank vegetation, submerged macrophytes, coarse substrate, and smooth substrate). 24 microhabitats were sampled and over 1000 benthic macroinvertebrates were recovered. The second collection involved Hester-Dendy multiple plate samplers being deployed for six weeks for a quantitative (set area over set time) collection of benthic macroinvertebrates in the richest targeted microhabitat - coarse woody debris. Two samplers were deployed per site (24 total), with 14 samplers and 1200 invertebrates recovered. The Fall 03' sampling regime was repeated in the late spring 04' with 22 microhabitat samples and 22 Hester-Dendy samplers being recovered. .Final identifications are being completed.
2. Stream habitats have been quantitatively described (sediment texture, stream cross-sectional profiles at 10 m intervals through the study reach, sinuosity, diversity of microhabitats). During the 2003-2004(except for winter - January to March) the streams were monitored for water quality and chemistry properties, and selected microhabitats were studied for spatial and temporal stability. Water samples were taken at least once every 10 days during sampling times. Attrubites that were monitored include dissolved oxygen, temperature, salinity, organic reduction potential, conductivity, total suspended solids, organic solids, and nitrate concentration. Selected patches of coarse woody debris were monitored concurrent with water sampling.
3. A litter decomposition experiment was established to provide data on ecosystem function of these streams. Litter containers with a 3 mm mesh were prepared, containing two standard substrates in separate compartments (popsicle sticks, a standard wood

substrate, and Phragmites stems, a standard herbaceous plant m,aterial substrate). Approximately 500 litterbags were constructed and deployed in the streams; theywere retrieved at monthly intervals over the next six months to monitor decomposition rates.At each site, sequential incubations of cores have been conduction to measure nitrogen cycling processes, using the intact core technique developed by Tiedge and colleagues. Ten cores total were taken at each site during each sampling. Five cores were returned to the laboratory immediately for analysis (moisture content, bulk density, nitrate and ammonium concentration, and incubation for denitrification). The other five cores were returned to their holes and allowed to incubate for one month. At the end of the incubation period they were taken back to the laboratory for analysis. Over the course of the sampling period, approximately 1,400 samples of soil extracts and 2,800 samples of nitrous oxide gas were generated. Sample analysis is nearing completion. Basic soil properties (moisture, pH, organic matter content) are also determined for each sample.
4. All sites were equipped with an RDS automated recording well and three nests of piezometers, at 25 m intervals along a transect from the stream edge into the portion of the wetland used for the nitrogen sampling. Well data has been downloaded bimonthly, and the piezometers were measured on a bi-weekly basis during the growing season. Analysis of the hydrographs and determination of groundwater flow directions is continuing.
5. GIS analysis of each site for determination of land-use cover within the upstream watershed area will be completed as soon as the laboratory analyses are completed.

Water Quality Assessment for Newton and Mantua Creeks
Basic Information
Title: Water Quality Assessment for Newton and Mantua Creeks
Project Number: 2003NJ17B
Start Date: 3/1/2003
End Date: 3/1/2004
Funding Source: 104B
Congressional District: 1
Research Category: Water Quality
Focus Category: Water Quality, Non Point Pollution, Nitrate Contamination
Descriptors:watershed assessment, Mantua Creek, Newton Creek, USEPA, bacteria,chlorophyll, nitrate, phosphorus, fecal coliform, community outreach, watershededucation
Principal Investigators: Kauser Jahan, Patricia Mosto
Publication1. Jahan, K., J. Everett, D. Miller, J. Orlins, J. Hasse, K. Freeman, K. Russell, A. Oyetimein, and M.
Krzmarzyk (2004) Community Outreach for Watershed Protection Proceedings of WEF Watershed2004, Dearborn, MI.
2. Jahan, K., J. Everett, D. Miller, J. Orlins, J. Hasse, K. Freeman, K. Russell, A. Oyetimein, and M.Krzmarzyk (2003) Water Quality Assessment for a New Jersey Watershed Proceedings of the 35thAnnual Mid-Atlantic Industrial and Hazardous Waste Conference, Brooklyn, NY.
3. Jahan, K., J. Everett, D. Miller, J. Orlins, J. Hasse, K. Freeman, K. Russell, A. Oyetimein, and M.Krzmarzyk (2004) Community Outreach for Watershed Protection Annual Rowan University STEMPOSTER Symposium, April 2004.
4. Jahan, K., J. Everett, D. Miller, J. Orlins, J. Hasse, K. Freeman, K. Russell, A. Oyetimein, and M.Krzmarzyk (2004) Community Outreach for Watershed Protection REU POSTER Symposium, July 2004.

Water Quality Assessment for Newton and Mantua Creeks
Dr. Kauser Jahan, Associate Professor, Department of Civil and Environmental Engineering, College of Engineering, Rowan University, Glassboro, NJ 08028; Phone: 856-256-5323, Fax: 856-256-5242, email: [email protected] Dr. Patricia Mosto, Professor and Chair, Biology, Rowan University; email: [email protected] Student: Abayomi Oyetimein, Senior. Biology, Rowan University; email: [email protected] Problem Statement: Rowan University recently received funding from the USEPA for watershed assessment of two local creeks in the state. The project draws on two creeks focusing on nonpoint source pollution (NPS) in watershed management area (WMA) 18. This lower Delaware River WMA encompasses 11 watersheds. Both of the selected projects are in close proximity to the main Glassboro campus and Camden Campus of Rowan University. One project in the Boroughs of Glassboro and Pitman, New Jersey focuses on the Chestnut Branch of Mantua Creek. This creek is of environmental importance because it is the headwaters for Alcyon Lake in Pitman, New Jersey, and flows adjacent to the nearby LiPari Landfill. The other, in Waterfront South in the City of Camden, New Jersey, will center on working with the City of Camden to identify potential nonpoint sources around Newton Creek and develop a community outreach program for community residents. The site is illustrated in Figure 1. Figure 1- WMA 18 with the select creeks for the USEPA study
Newton Creek
Rowan Camden Campus
Waterfront South
Chestnut Branch of Mantua Creek
Main Rowan University Campus

Both projects seek to improve water quality in the watersheds through collaborative partnerships between Rowan University, municipalities on the stream, and local K-12 schools. Tasks include watershed characterization through hydrologic and water quality assessment. The outreach activities include faculty and student presentations on nonpoint source pollution, their impact on human health and the environment, and the prevention options. The final deliverables include community workshops, school (K-12) workshops and an interactive CD-ROM for local government planners, environmental specialists, developers, and citizens. Such information is powerful in the decision making process and will serve as an asset to the City of Camden and the Boroughs of Glassboro and Pitman. To accomplish these tasks and link them together with a geospatial component, we have assembled a multidisciplinary team including civil and environmental engineers and social science professionals with experience in environmental science, geospatial technologies and community outreach activities. Current funding includes support for one graduate student and two undergraduate students. This proposal requested funding for another undergraduate student to help in biological assessment (specifically bacteria enumeration, nutrient and chlorophyll concentrations) of the two creeks. These parameters were absent in the EPA proposal but their measurement allowed the water quality assessment to be more extensive and detailed. Project Description: The current state of the Newton Creek and Chestnut Creek watershed is being assessed through both qualitative and quantitative means. Geomorphologic features of the riparian corridor has been documented, and stormwater facilities have been cataloged. Physical conditions of the stream and tributaries are being documented using a standardized stream assessment protocol. The stream assessment identifies areas with stream bank erosion, headcutting, and bed degradation. In addition, the adjacent riparian areas are being documented, including vegetative canopy, land use, and presence or absence of buffer zones adjacent to the stream corridor. During the stream assessments, investigators also identify potential sources of NPS and trash. Water quality assessment includes physical, chemical and biological (through support from this funding) parameter monitoring. The major water quality parameters monitored are presented in Table 1.
Table 1: Water Quality Parameters
Parameters to be Monitored through USEPA Funding Parameters Funded by this Proposal
pH Suspended Solids (Total and Dissolved)
Bacteria (Fecal Coliform Counts)
Temperature Conductivity Chlorophyll Dissolved Oxygen Organics (TOC, BOD, COD) Nitrogen (Nitrate) Turbidity Metals (Cu, Zn, Cr, Pb, As) Phosphorus (Total, Ortho) Methodology: All parameters were monitored according to Standard Methods. Chlorophyll a was measured using the method of Mosto et al., (1995, 1988). Results: Data obtained for nitrate, phosphate, chlorophyll a and fecal coliforms is presented in Figure 2. The data analyzed indicated that both water bodies are being impacted by nonpoint source pollution. This was concluded due to high nitrate and phosphate concentrations and also high counts of two bacteria groups, coliforms and fecal streptococci. The nitrate and phosphate concentrations also explain the profuse plankton growth that was observed at certain sites.
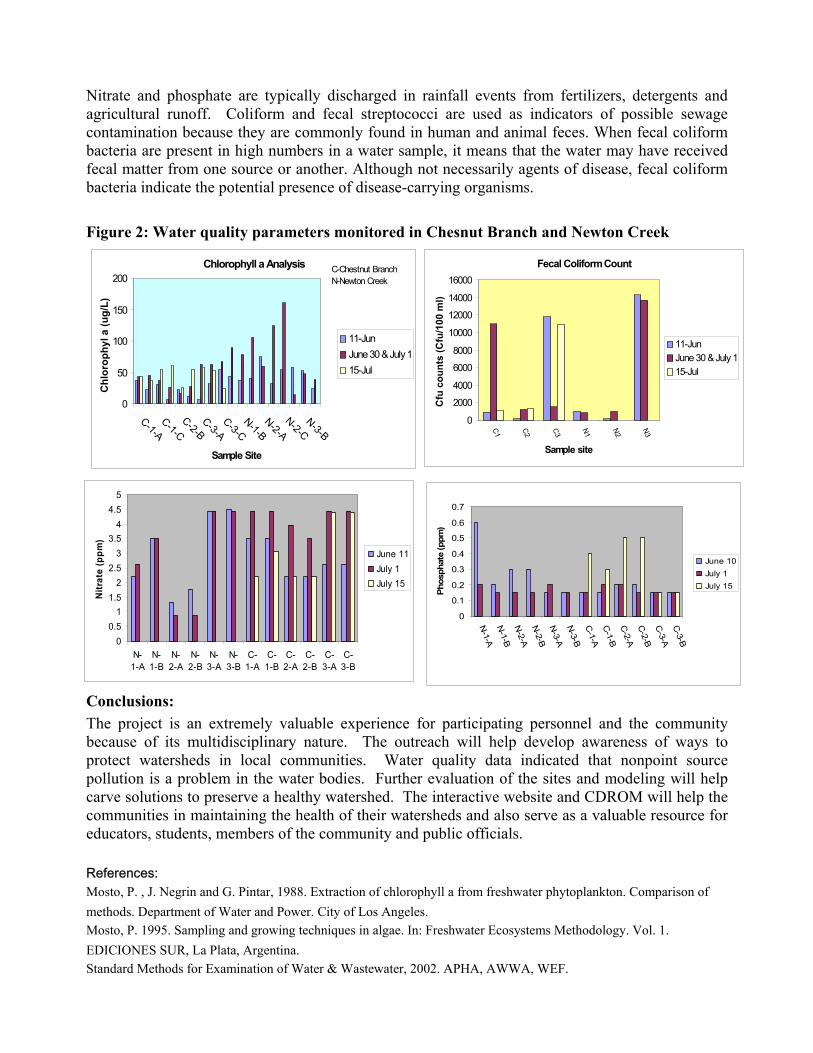
Nitrate and phosphate are typically discharged in rainfall events from fertilizers, detergents and agricultural runoff. Coliform and fecal streptococci are used as indicators of possible sewage contamination because they are commonly found in human and animal feces. When fecal coliform bacteria are present in high numbers in a water sample, it means that the water may have received fecal matter from one source or another. Although not necessarily agents of disease, fecal coliform bacteria indicate the potential presence of disease-carrying organisms. Figure 2: Water quality parameters monitored in Chesnut Branch and Newton Creek
Chlorophyll a Analysis
0
50
100
150
200
C-1-AC-1-C
C-2-BC-3-A
C-3-CN-1-B
N-2-AN-2-C
N-3-B
Sample Site
Chl
orop
hyl a
(ug/
L)
11-JunJune 30 & July 115-Jul
C-Chestnut BranchN-Newton Creek
Fecal Coliform Count
0
2000
4000
6000
8000
10000
12000
14000
16000
C1 C2 C3 N1 N2 N3
Sample siteC
fu c
ount
s (C
fu/1
00 m
l)
11-JunJune 30 & July 115-Jul
00.5
11.5
22.5
33.5
44.5
5
N-1-A
N-1-B
N-2-A
N-2-B
N-3-A
N-3-B
C-1-A
C-1-B
C-2-A
C-2-B
C-3-A
C-3-B
Nitr
ate
(ppm
)
June 11July 1July 15
0
0.1
0.2
0.3
0.4
0.5
0.6
0.7
N-1-A
N-1-B
N-2-A
N-2-B
N-3-A
N-3-B
C-1-A
C-1-B
C-2-A
C-2-B
C-3-A
C-3-B
Phos
phat
e (p
pm)
June 10July 1July 15
Conclusions: The project is an extremely valuable experience for participating personnel and the community because of its multidisciplinary nature. The outreach will help develop awareness of ways to protect watersheds in local communities. Water quality data indicated that nonpoint source pollution is a problem in the water bodies. Further evaluation of the sites and modeling will help carve solutions to preserve a healthy watershed. The interactive website and CDROM will help the communities in maintaining the health of their watersheds and also serve as a valuable resource for educators, students, members of the community and public officials. References: Mosto, P. , J. Negrin and G. Pintar, 1988. Extraction of chlorophyll a from freshwater phytoplankton. Comparison of methods. Department of Water and Power. City of Los Angeles. Mosto, P. 1995. Sampling and growing techniques in algae. In: Freshwater Ecosystems Methodology. Vol. 1. EDICIONES SUR, La Plata, Argentina. Standard Methods for Examination of Water & Wastewater, 2002. APHA, AWWA, WEF.

Information Transfer Program

Urban Watershed Management: Increasing Public
Basic Information
Title: Urban Watershed Management: Increasing Public
Project Number: 2003NJ50B
Start Date: 1/1/1997
End Date: 1/1/1997
Funding Source: 104B
Congressional District: 8
Research Category: Not Applicable
Focus Category: Education, Water Quality, Non Point Pollution
Descriptors: watershed management, urban water quality, nonpoint source pollution, K-12educators, watershed education
Principal Investigators: Richard R. Pardi, David Stern, Karen Swanson
Publication1. Pardi, R., M. Sebetich and K. Swanson, 2004, Urban Watershed Studies An Off-campus Site in
Northern New Jersey, Journal of Geoscience Education, accepted for publication May, 2004 2. Pardi R., M. Sebetich and K. Swanson 2003, San Diego, A Center for Urban Watershed Studies
Oldham Pond, Northern New Jersey, AWRA Annual Conference, November, 2003, abstract. 3. Pardi, R., New Jersey Watershed Management Area #4 Newsletter, two articles on various watershed
issues.
DOCUMENT 2: Project Report Project Information: Urban Watershed Management: Increasing Public “Ownership” of Watershed Resources Dr. Richard R. Pardi – Principal Investigator Problem and Research Objectives: In urban environments such as most of the state of New Jersey, water resources are the subject of increasing concern, both in terms of human impacts on water quality and as the consequence of increasing demand for potable water supply. The drought of two summers’ ago served to emphasize how fragile a position we are in with respect to our water resources. While the identification and control of specific, local sources of pollution remains and will likely continue to remain a priority, it has become increasingly apparent that non-point source pollution and impacts of both the quality and quantity of water are equally important. The control of non-point source pollution has posed a serious challenge not only because the source, transport and fate of broadly dispersed pollutants is not well understood, but also because the solution clearly involves more than simply the establishment of standards and the enforcement of regulations. It is also clear that one aspect of the solution to non-point source pollution will be the education of the public, including public officials. We proposed to demonstrate that the most effective way to increase public participation in watershed protection is to increase public “ownership” of watershed resources. This “ownership” would be obtained by the involvement of college, grade and high school students in the collection, analysis and evaluation of watershed data, directly related to current watershed issues. Local decision makers listen more intently to students than they do to professional scientists. As stated earlier, the success enjoyed with the cleanup of the nation’s rivers by the reduction in point source pollution has not been met by comparable reductions in the reduction of non-point source pollution. That non-point source pollution consists mainly of nutrients from animal waste and fertilizers, pesticides from suburban lawns and golf courses, floatables from the urban environment, and bacteria and viruses from wildlife and pets. The solution to the control of these pollutants has been elusive and the problems faced are similar to those surrounding the issue of stream restoration as discussed by Riley (1998). Riley discusses several strategies for generating community interest and political support in urban/suburban areas. Some of those strategies – water festivals, lectures, workshops, etc. – have already been tried here and have generally failed to generate a high level of community interest or positive response from municipal government.

Numerous authors have documented the difficulty of rousing adult members of a community to take action on environmental issues, even when there is interest in the issues (Owens, 1993). It has been suggested, however, that one possible way to increase adult interest in environmental issues and participation in environmental activities is to get their children involved first; the children then involve their parents (Riley, 1998). However, there is little information in the literature concerning research done to investigate this claim. The proposed project described below is intended as a way to do that. Methodology - We had proposed to establish a center at William Paterson University’s new facility at Oldham Pond in North Haledon, New Jersey which will be dedicated to the study of urban watersheds and to the dissemination of information and tools useful to those who seek to solve issues of water quality and quantity in urban watersheds. To accomplish this phase of the project we had proposed to:
• Provide a technical resource base for educational activities at William Paterson University and for surrounding K-12 educators involved in water-related educational activities. This resource base would consist both of equipment (primarily field water quality measurement equipment) and personnel (primarily faculty and students from William Paterson University). • Establish an accessible computer database of GIS and other water resources data for Watersheds 3, 4 and 6 that would contain any and all available data collected during the planning process currently going on for these watersheds. This computer facility would be designed to provide interactive tools for data management and exploration. • Provide for continuous personnel support of the database and other center activities at Oldham Pond. • Hold the first of what is hoped will be a continuing series of conferences in which anyone working on urban water quality issues could participate. These conferences would be structured to encourage the participation of professional and students, including grade and high school students working on watershed related topics.
Long term goals for William Paterson University’s Oldham Pond Research and Laboratory facility include its development into a regional center (focused on Northern New Jersey) for the study of water resources and management. The drought conditions of two year’s ago in the State highlight the limits of the water resources available in Northern New Jersey. In addition, there has been a decade’s old pattern of abandoning smaller drinking water reservoirs and wells as they have become contaminated. These developments highlight the need to further develop our understanding, protection, and restoration of our watersheds.

The development of the Oldham Pond Research and Laboratory facility was planned to occur in stages (based in part on the availability of funding support). The first stage was to focus on establishing a capability to study the environment and ecology of Oldham Pond and its watersheds with the latest techniques. Oldham Pond and its watershed represent an urbanized system that is typically found in the developed areas of Northeastern New Jersey. Implementation of research at this facility should be applicable to similar areas in Northeastern New Jersey. The focus of these studies will be to utilize the latest monitoring equipment to train students and assemble data to improve our understanding of how urbanization and programs to restore watersheds (i.e., Non point Source Best Management Practices) impact water resources. Principal Findings and Significance – This report is interim, including activities initiated over the past three months. Due to delays in the initiation of the grant from Rutgers University, in renovations at the Oldham Pond facility at William Paterson University and in the extent and type of funds available, alterations were made in the planning and scheduling of the project.
• Availability of the Oldham Pond Field Station – Renovations on the facilities at Oldham Pond were completed in August of 2003. Funding for the building renovations was raised by William Paterson University and the University’s Alumni Foundation. Equipment that had been ordered earlier in the year with funds from the New Jersey Education Leasing Fund Bond Act was installed at the Field Station beginning in September 2003 and has continued up to the present. The facility space is shared by the Alumni Foundation which occupies the top floor of the building with the Field Station occupying the lower level.
• Initiation and Extent of Funding - Because funding was only made available early in 2004 and because the amount of funding was significantly reduced, we found it necessary to substantially modify our schedule and goals for the project. The narrative below will detail how that schedule was modified.
Once funding became “officially” available we immediately began to formalize our informal contacts with local K-12 schools. Several meetings were held with teachers and administrators of Hawthorne, Glen Rock and Ridgewood school systems. The goal of these meetings, which continue to the present, was to ascertain the needs and interest of K-12 educators and the most efficient linkage between this project and their requirements. It was found, for example, that the best match between watershed issues and K-12 curriculum goals lay in the curriculum of the 4th grade and club activities in the High Schools.

After a number of meetings with K-12 teachers from Glen Rock, for example, two actions were taken:
• In conjunction with the New Jersey Community Water Watch (Ms. Kathy Quillinan had been assigned to William Paterson University by NJCWW for the 2003/2004 academic year), a series of classroom visits was made beginning in March 2004 during which Ms. Quillinan and William Paterson Water Watch volunteers made classroom presentations on watershed issues to grade-school children.
• After agreeing that “hands-on” experiences would ideally compliment classroom activities, we planned a field activity as a “shakedown” run for future field activities that would involve observations around and in a local stream – Diamond Brook in Glen Rock, New Jersey. This stream runs very close to several local grade schools, is perennial and is easily accessible from several locations including the local Glen Rock Arboretum. Volunteers linked to the Arboretum and the Glen Rock Environmental Commission were eager to participate in the field exercise. The field exercise is described in detail in the attached Appendices A & B and lessons learned are discussed below.
• Arrangements are in progress with other area schools to conduct such field exercises in the Fall of 2004.
Current Project Activities Highlighted below are our current watershed activities related to this project:
• Although contacts with individual schools and teachers have proven to be effective and will continue, we decided that contact with several K-12 teachers at one time would be more effective in getting the word out to local schools. A 3-day workshop on Watershed Education will, therefore, be held at Oldham Pond on July 6, 7, and 8th. Drs. Michael Sebetich and Steven Vail of the William Paterson Biology Department and myself will conduct the field/laboratory workshop. The overall topics for each day will be 1. Macro-invertebrate sampling for stream water quality; 2. Chemical and physical measurements of stream water quality; and 3. Invasive species control and stream bank restoration. This grant and a grant to the William Paterson College of Education will partially support that workshop which has been coordinated by the University’s School of Continuing Education and Distance Learning
• Graduate and undergraduate student aids have begun to set up a web site that will be maintained on servers at William Paterson

and will serve as a repository for reporting on watershed activities and data collection.
• The weather station at Oldham Pond has been set up and is in operation except for a final link to a web site. This should be completed by the end of the summer and will add another dimension to our use of the Pond as a focus for watershed studies.
• Graduate and undergraduate student aids are compiling a manual of lesson plans for use by teachers that will be tested during the July workshop.
Future Project Plans In the future we plan to:
• Continue and expand our contacts with local schools and offer to assist them with field activities similar to that reported in Appendix A. However, it is clear that the size of the groups that can be handled at this grade level will have to be reduced. We will also further explore contacts with high school ecology and environmental clubs and “Kids to Kids” programs as another avenue of broadcasting watershed activities.
• Along with the New Jersey Community Water Watch staff we plan to continue classroom activities and field activities such as River Cleanups.
• The use of Oldham Pond as a resource for undergraduate education will continue through workshops and classes held at the laboratory. These workshops and laboratories have included undergraduate majors and non-majors, independent study students, and graduate students.
Literature Cited:
Riley, Ann L., 1998, Restoring streams in cities: a guide for planners, policy makers, and citizens, Washington, D.C., Island Press.
Owens, Owen D., 1993, Living waters: how to save your local stream, New
Brunswick, N.J., Rutgers University Press. Migel, J. Michael, 1974, The stream conservation handbook. Edited by J.
Michael Migel. Introd. by Nathaniel P. Reed, New York, Crown Publishers. Gore, James A, ed., 1985, The Restoration of rivers and streams: theories and
experience. Boston, Butterworth Publishers.

Appendix A. – Summary Report on first Field Activity prepared by William Paterson University Student Aid.
Appendix B – email received from Glen Rock teacher.

Figure 1. Dr. Pardi, of William Paterson University faculty showing 4th graders how to collect macro-invertebrates
WATERSHED STUDIES FIELD DAY AT THE ARBORETUM IN GLEN ROCK, NJ
Introduction
We contacted Glen Rock Schools, N.J. and after several discussions and meetings
we arranged a field trip with 2- 4th grade classes as test run for future field trips. Ecology
is a component of the 4th grade curriculum. A field trip was scheduled for an afternoon in
May. Students walked on a rainy day from their school to the Arboretum. Overall, the
field group consisted of:
• Two classes of 4th graders ( 46 students)

• Two teachers
• Four volunteer parents
• Two members of the Glen Rock Environmental Commission
• Two faculty members from WPUNJ
• Two WPUNJ students
• One AmeriCorp volunteer from NJ Community Watch
The AmeriCorp volunteer and some WPUNJ students had previously given the 4th grade
a presentation on watershed issues at their school. The goal of this initial exercise was to
evaluate the impact various activities would have on the students and to get an idea of the
logistical requirements of such field
exercises.

Figure 2. Dr. Sebetich, of William Paterson University faculty explaining the importance
of invertebrates in lakes and streams.
Figure 3. Dr. Pardi and students of Byrd School collecting invertebrate samples in the
Diamond Brook.
Goals of Activity- Aquatic and field ecology were the areas of interest; the day’s
program consisted of students from Byrd School, Glen Rock, NJ. The purpose was to
teach 4th graders about the importance of water quality and different kinds of
invertebrates that inhabit the Arboretum’s water. This program was a hands –on
approach for children to take part in aquatic ecology research. The water testing was

conducted with chemicals and meters to determine water temperature, pH, and nitrogen.
The invertebrate sampling was conducted by collecting samples and identifying them
with the use of a field identification chart. Invertebrate population can be used to
determine how polluted a stream, lake or river is an addition to invertebrates. There were
also other species such as frogs, fish and turtles that could be identified. Plants and
animals within the Arboretum were used as part of the day’s activities
Figure 4. The student’s interaction with nature in the Arboretum.
Study Area-
The area of study was Diamond Brook within the Arboretum in Glen Rock,
Bergen County, New Jersey. Glen Rock is a prime example of suburban sprawl, and is a
microcosm for the entire region. Located on Doremus Avenue, the Arboretum is a

wetland forest with many types of vegetation. There is a spring fed pond that flows into
Diamond Brook which then empties into the Passaic River about 3 miles down stream.
The borough of Glen Rock purchased the land on Doremus Avenue in 1954; it became a
municipal park in 1959, and is a division of the Glen Rock Park system.
Figure 5. The collecting of samples using a Surber samplers with Dr. Sebetich
Field Experience-
The program was conducted on May 19, 2004. The 46 students were divided into 4
groups, which were then rotated though each of the four field activities listed below.
• Micro invertebrate sampling and identification, stream ecology
• Water Quality
• Vegetation Identification and ecosystem

• Wildlife identification and ecosystem
The section of the Diamond Brook on the western end of the Arboretum and the pond
that is located in the center of the wetland forest were used for the study. The water
testing was conducted by collecting water samples in test tubes and adding different
chemicals to determine the levels of bacteria or nitrogen. The students were shown how
meters and colorimetric test could be used to determine temperature, pH and other
variables on the water samples. The students were then asked to perform the tests
themselves and the results were recorded.
Figure 6. Invertebrate samples collected in the Arboretum.
The collecting of the invertebrates was conducted by the use of a Surber sampler, sifters
and cups filled with water that were used as holding tanks. The Surber sampler was

placed in the water, preferably near riffles, because of the higher concentrations of
invertebrates, around and under the rock formations. The Surber samplers were emptied
into sifters to conduct the search for any organisms. If any, they were placed in the
watercups and identified by the I.D. chart with picture characteristics and key for
invertebrates
.
Figure 7. Dr. Pardi explaining how to determine of water quality
Summary Evaluation-
The field trip was educational, interesting and fun for the children. The lessons
learned were: The group size (46 students) was too large to handle in the field
even with seven adults working with four groups and six teachers and parents
looking on. The following changes in the field protocols should be made to

increase the children’s learning on how a Watershed works.
• Only one class with teacher at a time
• No more than 10 students per group
• One Instructor, one aid and one parent per group
• At least some of the Students should be supplied with boots
• Students should be asked to take field notes and recorded
In addition, booklets should be given to the students on the subject matter as a follow-up
to classroom presentation and teachers should follow up in the classroom on what the
students learned on the field trip(see follow up e-mail attached. The children should be
encouraged to go home and teach their parents the dangers of pollution with the
knowledge and materials they gained.

Appendix B – email received from Glen Rock teacher Thank you all!! The letter from Kkristin Libretto, teacher of fourth grade at Byrd School says it so well. It was a nEXCITING day and definitely a memorable one for all. You participation made it so special and is appreciated more than you can know. Thanks again and again. carol. ----- Original Message ----- From: Libretto, Kristin Sent: Thursday, May 20, 2004 6:25 PM To: '[email protected]' Subject: THANK YOU!!!! Dear Carol, Thank you so much for yesterday! The students were still brimming over with enthusiasm this morning, when we sat and talked about all the things we observed and learned yesterday. This kind of first hand knowledge just can't be beat -- I know that long after they are grown, they will remember that damp afternoon in May when they petted a bullfrong, saw a bluegill guarding its nest, found a crayfish not much more than an inch long, found out that nature had a way of soothing that awful poison ivy itch, why skunk cabbage and shadbush got their names, and other similar memories. They are making their own thank-you's but I couldn't let today end without conveying my own. I hope you'll let Dr. Pardi know that we are grateful, too, to him and his associates for teaching us about gauging the health of the water in this kind of habitat. Glen Rock is certainly fortunate to have such a jewel as the Arboretum, but I know that without the efforts of you and your compatriots, it would not be the very special place it is today. You are indeed priceless. How can we ever thank you? Sincerely, Kristin LiBretto

NJWRRI Information Transfer Activities
Basic Information
Title: NJWRRI Information Transfer Activities
Project Number: 2003NJ18B
Start Date: 3/1/2003
End Date: 3/1/2004
Funding Source: 104B
Congressional District: 6
Research Category: Social Sciences
Focus Category: Education, Management and Planning, None
Descriptors: New Jersey Flows, Hackensack Meadowlands, TMDL, Watershed Management,water education, undergraduate research
Principal Investigators: Joan G. Ehrenfeld, Jeannine A. Der Bedrosian
Publication

New Jersey Water Resources Research Institute Information Transfer Activities (a) Administrative Assistant The University continues to support a half-time administrative assistant for the program. Ms. Jeannine der Bedrosian, has a broad-based background in water science (water chemistry, aquatic biology), and a strong personal interest in and commitment to water resource protection. She has considerable experience in organizing community-based stream monitoring programs, and is actively involved with the watershed management planning process. Her time is spent approximately 75% on information transfer activities and 25% on program and research administration. (b) Internet Services Our website continues to be located at: http://njwrri.rutgers.edu/ Its purpose is to 1) describe the activities of the WRRI, including dissemination of requests for proposals and descriptions of research projects funded by the institute, 2) summarize grants funded by NJWRRI at the undergraduate, graduate and senior researcher levels, 3) provide links to a variety of other water-related organizations, including governmental agencies, non-profit watershed organizations, and sources of information about water, and 4) provide a search capability for visitor to the site to locate and identify expertise on particular water issues. Plans are to upgrade this website this year to archive all issues of our newsletter, “New Jersey Flows,” and to provide additional information about water resources research and issues in New Jersey. ( c) Newsletter Publication and dissemination of our newsletter, titled “New Jersey Flows,” continues with expanded content; the most recent issue contained 12 pages. The newsletter now reaches nearly 2,000 readers within the water community of New Jersey, ranging from water professionals, government employees, environmental consultants, watershed and other nonprofit members, planning officials, environmental commissions, water purveyors, elected representatives, and other interested readers. It informs them about current water resource issues, and also illustrates the importance of research in finding solutions to problems. The newsletter carries several regular columns in alternating issues, including (1) an update on water-related research activities at the NJ DEP Division of Science and Research, (2) an update on water-related research activities at the USGS – Trenton District Office, (3) an article by the State Climatologist on notable aspects of recent weather, as it affects water resources, (4) an article describing one of the watershed management units of the state or a watershed association, or an affiliated group, written by a member of the planning staff for that unit (our goal is to acquaint readers with the diversity of watersheds present in the state, and the challenges and accomplishments of the related groups), and (5) one or more brief articles by the Principle Investigators of recently-completed projects, describing the research results in terms suitable for a lay audience. For example, the Winter, 2003 issue contained a lengthy article on the new Volunteer Monitoring effort in New Jersey by NJDEP Watershed Management representatives, “From Drought to Deluge,” by the state climatologist, an article on pollutant trading opportunities by the Water Resources Agricultural Extension agent, and a summary of water resources engineering education and research. It highlighted the Passaic River watershed and those involved with the work there, summarized current legislation related to water resources, and featured the results of an undergraduate, a graduate and a senior research grants funded by NJWRRI. Other newsletter issues explore one issue in some depth, with articles solicited from a variety of sources (depending on the topic). For example, the Summer, 2003 issue focused on “The

Hackensack Meadowlands, an Ecological Paradox,” and summarized a vast array of research on this special area, particularly featuring researchers from EPA Region II, the Meadowlands Environmental Research Institute (MERI) , U.S. Fish and Wildlife Service, NJDEP Division of Science, Research and Technology, and NJWRRI grant-funded research on invasive species in the Meadowlands. The upcoming issue will be devoted to the topic of the new Stormwater management regulations promulgated in New Jersey, with various perspectives from stakeholders around the state. These regulations have provoked a considerable amount of public controversy. The issue will contain articles from NJDEP representatives, a builders’ association, academic representatives, watershed representatives, environmental consultants, and researchers. (d) Conferences Due to state cuts in funding at the university level, there are no current plans for lead sponsorship of a major conference. However in May, 2003 NJWRRI did sponsor a state-wide conference titled “WATERSHED MANAGEMENT AND THE UNIVERSITY: A working conference for higher education institutions, watershed managers and other watershed stakeholders.” The conference explored the role that academic institutions can take in helping develop watershed management programs with public and not-for-profit community groups. The overarching questions which framed the conference were: 1) How do colleges and universities use their local watersheds as a source of material for research and teaching? 2) How do colleges and universities use their own campus as a watershed to study, develop and implement Best Management Practices (BMPs) for stormwater runoff, impervious cover, recharge patterns, and pollution abatement? 3) What are the universities and colleges of New Jersey doing to integrate real-life watershed concerns, either on campus or in their local watershed, into research and teaching? 4) How can the higher education institutions and the watershed professionals work together? Speakers from 5 universities and colleges around the country came to share their experiences in setting up such programs, and speakers from eight institutions in New Jersey described their efforts to develop such programs. Over 100 people attended, representing 27 academic institutions, many watershed organizations and government agencies. Larry Baier, NJDEP Director, Department of Watershed Management, was the keynote speaker. NJWRRI co-sponsored the Hackensack Meadowlands Symposium, a scientific symposium focusing on the Hackensack Meadowlands, together with the New Jersey Meadowlands Commission, and MERI on October 9 – 10, 2003 This institute also co-sponsored “Using Science to Protect Wetlands: Making Science Available to All,” a wetlands symposium also sponsored by Friends for the Hamilton - Trenton - Bordentown Marsh; Stony Brook-Millstone Watershed Association; Delaware River Keeper and Rider University.
(e) State council participation
This year marked the establishment of the New Jersey Water Monitoring Coordinating Council (NJWMCC). NJWRRI joined together with members representing NJDEP, USGS, the Delaware River Basin Commission, EPA Region 2, the Marine Sciences Consortium, the Interstate Environmental Commission, the Pinelands Commission, the Natural Resources Conservation Service, the Meadowlands Environmental Research Institute, and other regional bodies. The focus of this interagency coordinating body is to serve as a statewide collaborative council to help achieve effective collection, interpretation, and dissemination of New Jersey water

monitoring information. The Council will address the full range of aquatic resources, including ground and surface waters, freshwater, estuarine, and marine environments, and associated watershed resources in the State. This council will also coordinate with the National Water Monitoring Council.
(f) Undergraduate research
With the strong support of the Advisory Council, the New Jersey Institute has devoted funding to undergraduate research internships each year of the evaluation period. These internships are intended to entice undergraduates to consider careers in water resources research by involving them in research projects that make them excited about continuing in this area. Faculty are invited to submit brief proposals outlining a project that an undergraduate can undertake. The undergraduate is expected to at the least produce a report and a submission for our website; students are strongly encouraged to also report their work at regional scientific meetings. In some cases, the work has been incorporated in peer-reviewed publications. On the advice of USGS, we have started to report such internships as research projects. While the intent of this program is educational, in the sense of involving students in water-related research as a first experience, such projects have resulted in research products (presentations and publications) and even prizes. This year’s undergraduate research, “Water Quality Assessment for Newton and Mantua Creeks,” is reported in the research program section of this annual report, and it is notable that results of this research have already been presented at four conferences and symposiums. (g) Public information NJWRRI continues to disseminate information about publications, meetings, conferences, regulatory developments, and other important water-related events statewide throughout the year.

Student SupportStudent Support
Category Section 104Base Grant
Section 104RCGP Award
NIWR-USGS Internship
Supplemental Awards Total
Undergraduate 2 0 0 0 2
Masters 3 0 0 0 3
Ph.D. 7 0 0 0 7
Post-Doc. 0 0 0 0 0
Total 12 0 0 0 12
Notable Awards and AchievementsUrban Watershed Management: Increasing Public Ownership of Watershed Resources, by Dr. Richard R.Pardi Principal Investigator: To date the project has been noted in area newspapers such as the BergenRecord and local weekly papers such as the Ridgewood Times and activities of students have beenhighlighted in William Paterson publications such as the Alumni Magazine.
Pilot Study on the Use of Hydrogen Release Compounds for PCE Enhanced Biodegradation in FracturedRock Aquifers, Ken Y. Lee: 1. Third place poster award (Ph.D. level). Competitive sorptioncharacteristics of polycyclic aromatic hydrocarbon (PAH) compounds, New Jersey Water EnvironmentAssociation Annual Conference, Atlantic City NJ, May 2003, H. El-Khoury, R. Hadidi, J. Ke, J. J-Y. Lee,J. Solakian, and K. Y. Lee. 2. First place poster award (BS level). The effect of temperature on cosolventpartitioning in two-phase NAPL-water systems, New Jersey Water Environment Association AnnualConference, Atlantic City NJ, May 2003, J. Mellett and K. Y. Lee.
Invited Presentation. Litvin, S.Y., Watershed Research in the Undergraduate Curriculum. Invitedpresentation, Watershed Management and the University Conference, May 29, 2003, New Jersey WaterResources Research Institute, Rutgers University, New Brunswick, NJ.
Invited presentation. Orlins, J., Miller, D., Hasse, J., Everett, J., Jahan, K. (2003). Watershed AssessmentThrough Undergraduate Research , Volunteer Monitoring Summit, November 7-8, New JerseyDepartment of Environmental Protection, Division of Watershed Management
Invited Presentation: Jahan, K. (2004) NPEs in Sewage Sludge, NJWEA Annual Conference, AtlanticCity, NJ.
Johanna Kline and Mike Kim (2003) Autotrophic Dentrification using Hydrogen Oxygen Bacteria. 2ndPrize, NJAWWA Conference, Atlantic City, NJ, April 2003. (An outgrowth of "Occurrence ofNonylphenolethoxylate (NPE) Surfactants" NJWRRI funded grant from Jahan, 2000)

Kline, Johanna (2003) Modeling Autotrophic Denitrification Kinetics , Best Paper Award, NationalEngineers Week, Delaware Valley Engineers Council. (An outgrowth of "Occurrence ofNonylphenolethoxylate (NPE) Surfactants" NJWRRI funded grant from Jahan, 2000)
Publications from Prior Projects1. 1998NJ108B ("Anaerobic pathways of PAH degradation in New Jersey Coastal Plain Aquifers") -
Articles in Refereed Scientific Journals - Lewandowski, Gordon and Mortimer, Georgene. Estimationof Anaerobic Biodegradation Rate Constants at MGP Sites. Journal of Groundwater, 2004. Acceptedfor publication for May/June 2004.
2. 1999NJ03 ("Habitat and nutritional value of the invasive marsh plant Phragmites australis forestuarine animals, as compared with that of Spartina alterniflora") - Articles in Refereed ScientificJournals - Weis, J.S. and P. Weis 2003. Is the Invasion of the Common Reed, Phragmites australis,Into Tidal Marshes of the Eastern US an Ecological Disaster? Marine Pollution Bulletin 46: 816-820.
3. 2000NJ00-04 ("Laboratory Scale Model of the Fate and Transport of Methyl tert-Butyl Ether(MTBE) in Groundwater Systems") - Dissertations - Modeling Source Area Diffusivity of Methyl tertiary−Butyl Ether (MTBE) in Groundwater Systems" RU PhD Thesis 2003.
4. 2000NJ00-05 ("NJ Pinelands Native Fish Biology: Parasites as Biological Tags") - Book Chapters -Sukhdeo, M.V.K. and Hernandez, A.D. (submitted) Food web patterns and the parasites perspective.In: Parasitism and Ecosystems (Eds. F. Thomas, J.F. Guegan, and F. Renaud). Oxford UniversityPress.
5. 2001NJ1361B ("Pilot Study on the Use of Hydrogen Release Compounds for PCE EnhancedBiodegradation in Fractured Rock Aquifers") - Articles in Refereed Scientific Journals - EE, K. Y., J.J-Y. LEE, J. KHINAST, J. R. STENCEL, AND M. LAVID, Photochemical remediation of PCE:Reactor design, construction, and preliminary results, Journal of Environmental Engineering, ASCE,2003
6. 2001NJ1361B ("Pilot Study on the Use of Hydrogen Release Compounds for PCE EnhancedBiodegradation in Fractured Rock Aquifers") - Articles in Refereed Scientific Journals - Lee, K.Y,J.-Y. Lee, and J. Khinast, Photochemical destruction of PCE and TCE from the exhaust of anair-stripper, submitted, Soil and Sediment Contamination, 2004.
7. 2001NJ1361B ("Pilot Study on the Use of Hydrogen Release Compounds for PCE EnhancedBiodegradation in Fractured Rock Aquifers") - Articles in Refereed Scientific Journals - LEE, K. Y.,K. KOSTARELOS, AND D. E. FENNELL, Modeling the transport of dissolved contaminantsoriginating from a NAPL source containing PAH compounds in groundwater, tentatively accepted,Journal of Environmental Engineering and Science, 2004.
8. 2001NJ1361B ("Pilot Study on the Use of Hydrogen Release Compounds for PCE EnhancedBiodegradation in Fractured Rock Aquifers") - Articles in Refereed Scientific Journals - Lee, K. Y,Modeling long-term transport of contaminants resulting from dissolution of a coal tar pool insaturated porous media, in press, Journal of Environmental Engineering, ASCE, 2004.
9. 2001NJ1361B ("Pilot Study on the Use of Hydrogen Release Compounds for PCE EnhancedBiodegradation in Fractured Rock Aquifers") - Articles in Refereed Scientific Journals - LEE, K. Y.AND C. A. PETERS, UNIFAC modeling of cosolvent phase partitioning in NAPL-water systems,Journal of Environmental Engineering, ASCE, 130(4), 478-483, 2004
10. 2001NJ1361B ("Pilot Study on the Use of Hydrogen Release Compounds for PCE EnhancedBiodegradation in Fractured Rock Aquifers") - Articles in Refereed Scientific Journals - LEE, K. Y.,

J. J-Y. LEE, J. KHINAST, J. R. STENCEL, AND M. LAVID, Photochemical remediation of PCE:Reactor design, construction, and preliminary results, Journal of Environmental Engineering, ASCE,130(1), 2004.
11. 2001NJ1181B ("Vapor phase UV Destruction of organic contaminants") - Conference Proceedings -LEE, K. Y., J. KHINAST, J. J-Y. LEE, AND J. R. STENCEL, Design and construction of a field-scalephoto-chemical remediation reactor,Thirty-Third Mid-Atantic Industrial and Hazardous WasteConference, edited by N. Assaf-Anid, 256-263, Riverdale, NY, 2001.
12. 2002NJ4B ("CONTINUOUS, ON-LINE MONITORING OF HALOACETIC ACIDS IN WATERUSING ANALYTICAL MEMBRANE EXTRACTION ") - Articles in Refereed Scientific Journals - Kou,Dawen; Xiaoyan Wang, and Somenath Mitra, 2003, Supported Liquid Membrane Micro-Extraction(SLMME) with HPLC Detection for Monitoring Trace Haloacetic Acids in Water, Analytical Chemistry,In Review.
13. 2002NJ4B ("CONTINUOUS, ON-LINE MONITORING OF HALOACETIC ACIDS IN WATERUSING ANALYTICAL MEMBRANE EXTRACTION ") - Book Chapters - Kou, Dawen; SomenathMitra, 2003, Extraction of Semi-volatile Organic Compounds from Solid Matrices, in S. Mitra (ed),Sample Preparation Techniques in Analytical Chemistry, New York: John Wiley &Sons, In print.
14. 2002NJ4B ("CONTINUOUS, ON-LINE MONITORING OF HALOACETIC ACIDS IN WATERUSING ANALYTICAL MEMBRANE EXTRACTION ") - Book Chapters - Slack, Gregory; NicholasSnow, and Dawen Kou, 2003, Extraction of Volatile Organic Compounds from Solids and Liquids, in S.Mitra (ed) Sample Preparation Techniques in Analytical Chemistry, New York: John Wiley &Sons, Inprint.
15. 2002NJ4B ("CONTINUOUS, ON-LINE MONITORING OF HALOACETIC ACIDS IN WATERUSING ANALYTICAL MEMBRANE EXTRACTION ") - Conference Proceedings - Wang, Xiaoyan;Dawen Kou, Edmund J. Bishop, and Somenath Mitra, 2003, Supported Liquid Membrane Micro−Extraction (SLMME) for the Determination of Trace Organic Acids, presented at the 27thInternational Symposium on Capillary Chromatography, Las Vegas, NV.
16. 2002NJ4B ("CONTINUOUS, ON-LINE MONITORING OF HALOACETIC ACIDS IN WATERUSING ANALYTICAL MEMBRANE EXTRACTION ") - Conference Proceedings - Somsamak, P. ,Richnow, H.H., and Häggblom, M.M. (2004) Carbon isotope fractionation during anaerobic MTBEdegradation Abstract Q354, American Society for Microbiology 104rd General Meeting, NewOrleans,LA, May 23-27,2004.
17. 2002NJ4B ("CONTINUOUS, ON-LINE MONITORING OF HALOACETIC ACIDS IN WATERUSING ANALYTICAL MEMBRANE EXTRACTION ") - Conference Proceedings - Somsamak, P. andHäggblom, M.M. (2003) Anaerobic degradation of methyl t-butyl ether (MTBE) under methanogenicconditions Abstract Q39, American Society for Microbiology 103rd General Meeting, Washington, DC,May 18-22,2003.
18. 2002NJ5B ("Destruction of Volatile Organic Compounds Using the Photo-Chemical RemediationReactor") - Articles in Refereed Scientific Journals - LEE, K. Y., J. J-Y. LEE, J. KHINAST, J. R.STENCEL, AND M. LAVID, Photochemical remediation of PCE: Reactor design, construction, andpreliminary results, Journal of Environmental Engineering, ASCE, 130(1), 2004.
19. 2002NJ5B ("Destruction of Volatile Organic Compounds Using the Photo-Chemical RemediationReactor") - Conference Proceedings - Lee, J. J-Y., K. Y. Lee, and J. R. Stencel, 2002, Destruction ofvapor-phase PCE using a novel photo-chemical remediation reactor, Thirty-Fourth Mid-Atlantic Industrialand Hazardous Waste Conference, edited by M. M. Häggblom, D. E. Fennell, and K. Y. Lee, 137, NewBrunswick, NJ.
20. 2002NJ5B ("Destruction of Volatile Organic Compounds Using the Photo-Chemical Remediation
Reactor") - Articles in Refereed Scientific Journals - Lee, K.Y, J.-Y. Lee, and J. Khinast, Photochemicaldestruction of PCE and TCE from the exhaust of an air-stripper, submitted, Soil and SedimentContamination, 2004
21. 2002NJ5B ("Destruction of Volatile Organic Compounds Using the Photo-Chemical RemediationReactor") - Articles in Refereed Scientific Journals - Lee, K. Y, Modeling long-term transport ofcontaminants resulting from dissolution of a coal tar pool in saturated porous media, in press, Journal ofEnvironmental Engineering, ASCE, 2004.
22. 2002NJ5B ("Destruction of Volatile Organic Compounds Using the Photo-Chemical RemediationReactor") - Articles in Refereed Scientific Journals - Lee, K. Y., J. J-Y. Lee, J. Khinast, J. R. Stencel, andM. Lavid, 2003, Photochemical remediation of PCE: Reactor design, construction, and preliminary results,in press, Journal of Environmental Engineering, ASCE.
23. 2002NJ5B ("Destruction of Volatile Organic Compounds Using the Photo-Chemical RemediationReactor") - Articles in Refereed Scientific Journals - LEE, K. Y. AND C. A. PETERS, UNIFAC modelingof cosolvent phase partitioning in NAPL-water systems, Journal of Environmental Engineering, ASCE,130(4), 478-483, 2004.
24. 2002NJ1B ("Effects of the Biopollutant, Phragmites australis, On the Nutritional Status (BiochemicalCondition) of Juvenile Weakfish, New Directions Incorporating Otolith Chemical Signature Analysis") -Other Publications - Van Nostrand, D., C.A. Hatfield, and M. Bakacs. "Regeneration of woody plantspecies within riparian zones of headwater streams whose watersheds vary by dominant land cover."Rutgers Scholar 2003.
25. 2002NJ1B ("Effects of the Biopollutant, Phragmites australis, On the Nutritional Status (BiochemicalCondition) of Juvenile Weakfish, New Directions Incorporating Otolith Chemical Signature Analysis") -Articles in Refereed Scientific Journals - Weinstein, M.P., J.R. Keough, G.R. Gutenspergen and S.Y.Litvin. 2003. Preface. Phragmites australis: A sheep in wolfs clothing? Estuaries 26 (2B):397.
26. 2002NJ1B ("Effects of the Biopollutant, Phragmites australis, On the Nutritional Status (BiochemicalCondition) of Juvenile Weakfish, New Directions Incorporating Otolith Chemical Signature Analysis") -Articles in Refereed Scientific Journals - Litvin, S.Y. and M.P. Weinstein. 2003. Life history strategies ofestuarine nekton: the role of marsh macrophytes, microphytobenthos and phytoplankton in the trophicspectrum. Estuaries 26 (B): 553-653.
27. 2002NJ1B ("Effects of the Biopollutant, Phragmites australis, On the Nutritional Status (BiochemicalCondition) of Juvenile Weakfish, New Directions Incorporating Otolith Chemical Signature Analysis") -Articles in Refereed Scientific Journals - Litvin, S.Y., and M.P. Weinstein. 2004. Marine transients andthe coastal conveyor belt: nutrient flow from primary producers to juvenile weakfish (Cynoscion regalis).Can. J. Fish. Aquat. Sci.
28. 2002NJ1B ("Effects of the Biopollutant, Phragmites australis, On the Nutritional Status (BiochemicalCondition) of Juvenile Weakfish, New Directions Incorporating Otolith Chemical Signature Analysis") -Articles in Refereed Scientific Journals - Weinstein, M.P., S.Y. Litvin and V.G. Guida. 2004.Consideration of habitat linkages, estuarine landscapes and the trophic spectrum in wetland restorationdesign. J. Coast. Res., in press.
29. 2000NJ10B ("Occurrence of Nonylphenolethoxylate (NPE) Surfactants and their Metabolites in NewJersey Rivers and Wastewater Treatment Plants") - Other Publications - Jahan, K. (2004) NPEs in SewageSludge, NJWEA Annual Conference, Atlantic City, NJ.