new lessons from an old strategy: import substitution ... · definitions of the terms “import...
TRANSCRIPT

EconWorld Working Paper Series No:2015-002
doi: 10.22440/EconWorld.WP.2015.002
Research Article
1
New Lessons from an Old Strategy:
Import Substitution, Productivity and Competitiveness
Yilmaz Kilicaslan 1 and Ilhom Temurov
2
Abstract
This paper examines the relation between import substitution, labour productivity and
industrial competitiveness. More specifically this paper tests if the import substitution
enhances both labour productivity and competitiveness in Korean and Turkish manufacturing
industries. The data used in the analysis are obtained from UNIDO Industrial Demand Supply
(2013) and UNIDO Industrial Statistics (2013) databases and cover the period of 1981-2001.
Our results show that Turkish economy has really left import substitution after 1980.
However, we found significant share of import substitution in total production in professional
and scientific equipment, transportation equipment, electrical machinery, miscellaneous
petroleum products, industrial chemicals industries and petroleum refineries in Korea
especially in the 1990s. The results based on unbalanced dynamic panel data estimations
showed that import substitution did not enhance labour productivity in manufacturing
industry of both Korea and Turkey. However, we found that import substitution affects
industrial competitiveness positively in both Korea and Turkey. Apart from the positive
impact of import substitution on competitive-ness, we also found in this study that while
Korean manufacturing industry competitiveness is closely associated with labour
productivity, competitiveness of Turkish manufacturing industry depends on the factors such
as exchange rates, wage differentials rather than labour productivity.
Keywords: productivity, competitiveness, import substitution, manufacturing, Turkey, Korea.
JEL Codes : L60, O12, O25, O47
1Corresponding Author, Faculty of Economics, Anadolu University, Eskisehir, Turkey,
[email protected] 2Department of Economics, Anadolu University, Eskisehir, Turkey, [email protected]

New Lessons from an Old Strategy: Kilicaslan and Temurov
2
1. Introduction
In spite of the fact that the import substitution is not a new strategy and was widely used after
WWII especially in developing countries, industrial productivity and competitiveness are still
quite important topics in both developed and developing economics. This study, there-fore,
focuses on the relation between import substitution, labour productivity and industrial
competitiveness. More specifically this paper tests if import substitution enhances both labour
productivity and competitiveness in Korean and Turkish manufacturing industries.
The data used in the analysis are obtained from UNIDO Industrial Demand Supply
(2013) and UNIDO Industrial Statistics (2013) databases and cover the period of 1981-2001.
The results based on unbalanced dynamic panel data models estimations show that import
substitution does not enhanced productivity in manufacturing industries both in Korea and
Turkey. However, the results depict that import substitution effects positively industrial
competitiveness in these two countries between the years 1981 and 2001. While industrial
competitiveness is an increasing function of both labour productivity and import substitution
in Korean manufacturing, there doesn’t seem to be significant impact of productivity on
competitive-ness in Turkish manufacturing. Competitiveness of Turkish manufacturing
industry is closely related with exchange rates rather than productivity.
The paper is organised as follows: In the next section we discuss theoretical background
of relation between import substitution, productivity and industrial competitiveness. In section
three we analyse the evolution of labour productivity Korean and Turkish manufacturing
industries and make some basic comparisons. In section IV, the relations of import
substitution, productivity and competitiveness in Korean and Turkish manufacturing
examined descriptively. In the section five we present and discuss the estimated econometric
models. Finally, we conclude in the last section.
2. Theoretical aspects of import substitution and industrial competitiveness
Definitions of the terms “import substitution”, “protection” and “promotion” – date back to
the debates on developing-country trade policies in the second half of nineteenth century. The
general aim was to build an economy that was flexible and diversified enough to overcome
crises, create real and continuous growth opportunities, and generate welfare for the
population.
Since the second half of nineteenth century, when the terminology of import
substitution (IS) appears, there has been a wide range of literature defining IS differently.
According to Diaz-Alejandro (1975), IS takes place when the import share of the total supply
of a specific good shrinks relative to that of domestic production, either because of new tariffs
levied on imports of that product, or because of devaluation which raises import prices or for
other reasons.
IS based on protection is “likely to induce foreign firms to set up local production
facilities to satisfy the demand previously satisfied by exports from their home country, rather
than to create a domestically owned and operated industry capable of competing successfully
with its foreign rivals” (Johnson, 1965). This definition indeed refers to import-competing
industry. Although there seems to be no direct relation between import competing and import
substituting industries, import competing is the first step to begin to substitute imported
goods.
In this paper, we define “import substitution” as replacing of imports of some
commodities by domestic production. This may bring about two main positive impacts to the
national economy: one is stabilization of trade balance and international activities by

EconWorld Working Paper Series No: 2015-002
3
decreasing imports. The second is the growth in overall production, value added and
competitiveness by building production facilities inside the country (Bruton, 1985).
In implementing a development strategy, one of the main aims would be building a
strong competitive production structure. As it mentioned by Bruton, one of the advantages of
IS development strategy is enhancing industrial competitiveness. However, the
implementation of such strategy should be made in short period of time. According to Balassa
(1971), the IS strategy makes possible to attain high rates of economic growth during the
period of "easy" IS when imports of nondurable consumer goods and the intermediate goods
used in their manufacturing were replaced by domestic production in the Republic of China
(Taiwan) and Korea. These two countries started out with IS in nondurable consumer goods
and their in-puts, and they had replaced virtually all such imports in a short period of time,
instead of concentrating on IS in intermediate products, machinery and durable consumer
goods. They then switched to export-oriented development strategy with established and
competitive industries.
When production of intermediates based on available natural resources is developed,
such products may reach international competitiveness at an earlier stage if access to low-cost
natural resources and a potential for economies of scale exist. IS development type may then
be the easiest way to establish a number of industries rapidly and to achieve a relatively high
degree of industrialization and competitiveness (Teitel S. and E. T. Francisco, 1986).
IS strategy implementation does not refer to a simple operation in which certain items
are withdrawn from the import basket or their volume reduced, and to be replaced by domes-
tic substitutes. To make IS strategy implementation more effective, production must be
increased not only in the industry finally processing the substituting good, but also in its
supplier industry and in their suppliers industries.
3. Labour productivity and import substitution in Korean and Turkish
manufacturing industries
In this section of the paper we analyse the trends of labour productivity measured as value
added per employee in current USD and the impact of IS. Figure 1 depicts that among all
industries tobacco and petroleum refineries are the industries with the highest labour
productivity in Korean manufacturing. In Turkish manufacturing industry, on the other hand,
petroleum refineries have the highest labour productivity rate (see Figure 2). It seems that
labour productivity increased significantly in every industry of both countries in the second
period. Average growth of labour productivity in Korean and Turkish manufacturing
industries are about 472.5% and 241.9%, respectively. Labour productivity in Korean
manufacturing had grown almost two times faster than Turkish manufacturing. The figure
implies that in the late 1990s Korean industry is about 1.5 times more productive than that of
Turkish.
Looking to the similarity between Korean and Turkish manufacturing industries as it
mentioned above petroleum refineries industry in both countries has highest rate of
productivity. Moreover the top 10 industries with respect to volume of labour productivity in
both countries seem to be similar. 7 of top 10 industries identical in both countries: Tobacco,
petroleum refineries, beverages, industrial chemicals, misc. petrol and coal, other chemicals
and glass production.
We also observed the similarity between these two countries with respect to the
growth rates. 6 of top 10 fast growing industries in both countries are identical: rubber,
electrical machinery, transport equipment, other chemicals, glass products and machinery.
Moreover rubber and electrical machinery is at the top of the industries with respect to growth
rate in both countries. Among the fast growing industries, both in Korea and Turkey, we see
the dominance of high and medium tech industries. Among top 10 fast growing industries, 7

New Lessons from an Old Strategy: Kilicaslan and Temurov
4
Figure 1: Labour productivity in Korean manufacturing industries, constant prices,
1981-2001 (ten years average).
Source: Author calculation based on UNIDO-ISDB (2008)
Figure 2: Labour productivity in Turkish manufacturing industries, constant prices,
1981-2001 (ten years average).
Source: Author calculation based on UNIDO-ISDB (2008)

EconWorld Working Paper Series No: 2015-002
5
in Korean and 8 in Turkish manufacturing are high and medium tech and industries. In sum,
the descriptive analysis shows that both Korean and Turkish manufacturing industries have
similar structures yet the growth rates of labour productivity are being different.
In measuring IS, we use the methodology developed originally by Chenery (1960) and
adopted by Lewis and Soligo (1965) and Desai (1969). Consider the basic identify:
𝑃𝑖,𝑡 +𝑀𝑖,𝑡 = 𝐷𝑖,𝑡 + 𝑋𝑖,𝑡 (1)
Where P, M, D, and X are domestic production, imports, final domestic demand
(including intermediate demand and inventory accumulation), and exports of industry i at time
t respectively.
Equation (1) may be written in difference form as follows:
∆𝑃𝑖,𝑡 + ∆𝑀𝑖,𝑡 = ∆𝐷𝑖,𝑡 + ∆𝑋𝑖,𝑡 (2)
If total supply (S) in the economy is equal to the sum of domestic production (P) and
imports (M), then equation (2) becomes:
∆𝑆𝑖,𝑡 = ∆𝐷𝑖,𝑡 + ∆𝐸𝑖,𝑡 (3)
Let 𝑠𝑖,𝑡𝑏𝑎𝑠𝑒 =𝑃𝑖,𝑡𝑏𝑎𝑠𝑒𝑆𝑖,𝑡𝑏𝑎𝑠𝑒
be the share of domestic production in total supply of industry i at
the base year.
The change in the production of the industry i at time t may be decomposed into three
parts:
∆𝑃𝑖,𝑡 = 𝑠𝑖,𝑡𝑏𝑎𝑠𝑒∆𝐷𝑖,𝑡 + 𝑠𝑖,𝑡𝑏𝑎𝑠𝑒∆𝑋𝑖,𝑡 + (𝑠𝑖,𝑡 − 𝑠𝑖,𝑡𝑏𝑎𝑠𝑒)∆𝑆𝑖,𝑡 (4)
In this is the decomposition; the first term on the right hand side of the equation is the
contribution of change in total demand, holding the import share constant. The second term is
the contribution of the change in exports again assuming that the import share constant. The
last term is the contribution of import substitution to the change in domestic output.
Figure 3 and 4 present the share of IS in total domestic production in Korea and Turkey
respectively. For Turkish manufacturing, the figure depicts that IS is observed in first period
in the four of 28 industries. In the first period, 0.3% of 7.5 percentage point growth in
fabricated metals was IS. In the same period, non-ferrous metals, iron and steel, and
petroleum refineries grown at 14.4%, 15.3%, and 5.3% with 0.6%, 1.1%, 0.6% IS
respectively.
The picture changed dramatically for these industries in the 1990s and the IS turned to
negative. The figure depicts that there are five industries showing IS in second period but the
numbers are negligible. Only tobacco industry has significant share of IS with 2% during
second period.
We found weak evidence of IS in Korean manufacturing in the 1980s: three out of 28
industries. The highest IS was observed in food industry where share of IS was 0.7% in 8.7%
total industry’s growth. The picture, however, is quite different for Korean manufacturing in
the second period: IS was observed in 11 industries in Korean manufacturing. We found that
one third of 9.4 percentage point growth in proff&scien. equip industry was dues IS. The
share of IS in 10.5% growth in the transp. equip. growth was 0.6%. The share of IS in
electrical machinery was found to be larger: 1.6% in 5.2% growth. Finally, the contribution
of IS to the average growth of 8.6% in industrial chemicals was 1%. Other industries
experienced IS in Korean manufacturing during second period were machinery, petroleum
refineries, misc. petrol, iron and steel, paper production, rubber, and tobacco.
When the technological structure of import substituting industries in Turkish
manufacturing is considered, we observe that import-substituting industries are mostly
dominated by low-tech industries. However, in Korean manufacturing, 6 out of 11 import
substituting industries are medium-high tech.

New Lessons from an Old Strategy: Kilicaslan and Temurov
6
Figure 3: Share of IS in total domestic production, Korea, 1981-2001, (10 year averages)
Source: Author calculation based on UNIDO-ISDB (2008)
Figure 4: Share of IS in total domestic production, Turkey, 1981-2001, (10 year
averages)
Source: Author calculation based on UNIDO-ISDB (2008)

EconWorld Working Paper Series No: 2015-002
7
In sum, the findings on IS imply that while IS was observed in low productivity
industries in Turkey, IS took place mostly in higher productivity industries in Korean
manufacturing. Among the import substituting industries in Korean manufacturing, 7 are in
the top ten industries with respect to the labour productivity, and 8 of them are in top 10 with
respect to growth rate.
4. Competitiveness in Korean and Turkish manufacturing
This section of the paper is devoted to give a general view on the evolution of
competitiveness in Korean and Turkish manufacturing during the period under study.
Competitiveness is measured as exports (X) divided by imports (M). This is said to be a basic
index because it does not consider the volume of trade.
Our findings, in general, show that competitiveness decreased in most industries of the
two countries in 1990s (see figure 5 and 6). Most of the Turkish manufacturing industries had
slightly higher competitiveness ratio than that of Korean in the first period. The second,
however, the picture changed due to the sharp decrease in competitiveness of Turkish
manufacturing industries. In the first period, 14 out of 28 Turkish manufacturing industries
had competitiveness index above 1, i.e. export was exceeding import, while Korean had 17
industries out of 28. For the second period, this number reduced to 11 for Turkish and 13 for
Korean manufacturing industries. In the second period, we see a sharp decrease in the
competitiveness of top 10 competitive industries of Turkish manufacturing, except wearing
apparels. Similar decrease is observed in Korean manufacturing, except footwear. Finally,
only one industry, wearing apparels, had competitiveness ratio above 5 Turkish
manufacturing, while this ratio was 4 in Korean manufacturing.
With respect to the technological structure both in Korean and Turkish manufacturing
low-tech industries seem to be more competitive. Seven industries among the top 10
competitive industries in Korea were low-tech industries. For Turkish manufacturing, the
picture is almost the same: 9 of the top 10 competitive industries were low-tech industries.
Based on our descriptive statistics we can conclude that in both Korean and Turkish
manufacturing, the relation between IS and competitiveness had almost been negligible. Our
reasoning based on the finding that only 1 import substituting industry in Korean
manufacturing is among top 10 competitive industries. The outcome is the same for Turkey:
only 1 import substituting industry among the top 10 competitive industries.
The picture of the relationship between competitiveness and labour productivity in both
countries is the same as the relation between IS and competitiveness. In Korean
manufacturing, only 3 in the top 10 industries with respect to the labour productivity is among
top 10 competitive industries, while there is only one industry within this category in Turkish
manufacturing industry.
5. Impact of import substitution on industrial competitiveness and labour
productivity
5.1. Data and models
The empirical analysis is based on UNIDO industrial statistics database (2013) and covers the
period 1981-2001. All monetary variables are in constant US Dollars. In order to test the
impact of IS on labour productivity we used a productivity equation augmented to account for
the impact of IS on labour productivity: 𝐿𝑃𝑖,𝑡 = 𝛽0 + 𝛽1𝐿𝑃𝑖,𝑡−1 + 𝛽2𝐶𝐴𝑃𝐼𝑁𝑇𝑖,𝑡 + 𝛽3𝐼𝑆𝑆𝑖,𝑡 + 𝛽4𝑊𝐴𝐺𝐸𝐷𝐼𝐹𝐹𝑖,𝑡 + 𝛽5𝐸𝑋𝑅𝐴𝑇𝐸𝑡 + 𝜇𝑡 + 𝜀𝑖,𝑡 (1)
In order to explore the impact of the import substitution industrial competitiveness, we
use a standard linear equation augmented to account for the impact of the import substitution
and other control variables:

New Lessons from an Old Strategy: Kilicaslan and Temurov
8
Figure 5: Competitiveness of Korean and Turkish Manufacturing Industries, 1981-2001
(ten year averages)
Source: Author calculation based on UNIDO-ISDB (2008)
Figure 6: Competitiveness of Korean and Turkish Manufacturing Industries, 1981-2001
(ten year averages)
Source: Author calculation based on UNIDO-ISDB (2008)
EconWorld Working Paper Series No: 2015-002
9
𝐶𝑖,𝑡 = 𝛽0 + 𝛽1𝐶𝑖,𝑡−1 + 𝛽2𝐿𝑃𝑖,𝑡 + 𝛽3𝐼𝑆𝑆𝑖,𝑡 + 𝛽4𝑊𝐴𝐺𝐸𝐷𝐼𝐹𝐹𝑖,𝑡 + 𝛽5𝐸𝑋𝑅𝐴𝑇𝐸𝑡 + 𝜇𝑡 + 𝜀𝑖,𝑡 (2)
In equation (1) and (2), LP, CAPINT, ISS, WAGEDIFF and EXRATE are labour
productivity, capital intensity, import substitution, wage differential and official exchange rate
variables respectively. i and t denote industry and time period, and μt control for time. Finally
ɛi,t is the usual error term.
Labour productivity (LP) is measured as the logarithm of manufacturing value added
per employee at constant prices.
Capital intensity (CAPINT) is the logarithm of real manufacturing capital stock per
employee.
ISS measured as share of import substitution3 in total domestic production. The
coefficient of import substitution in competitiveness model is expected to be positive.
WAGEDIFF is the wage difference of Korean and Turkish manufacturing industries
from World manufacturing industries, measured as wages of Korean and Turkish
manufacturing industries divided by World manufacturing industries4.
Competitiveness (C) measured as (Export - Import) divided by (Export + Import).
EXRATE is the official exchange rate of the country and measured as USD per Korean
Won and Turkish Lira respectively.
Finally, in order to account for partial adjustment in labor productivity and competitive-
ness, we estimated the dynamic model. The coefficient of the lagged value of the dependent
variables LPi,t-1 and Ci,t-1 measures the speed of adjustment and is expected to be positive
and less than one.
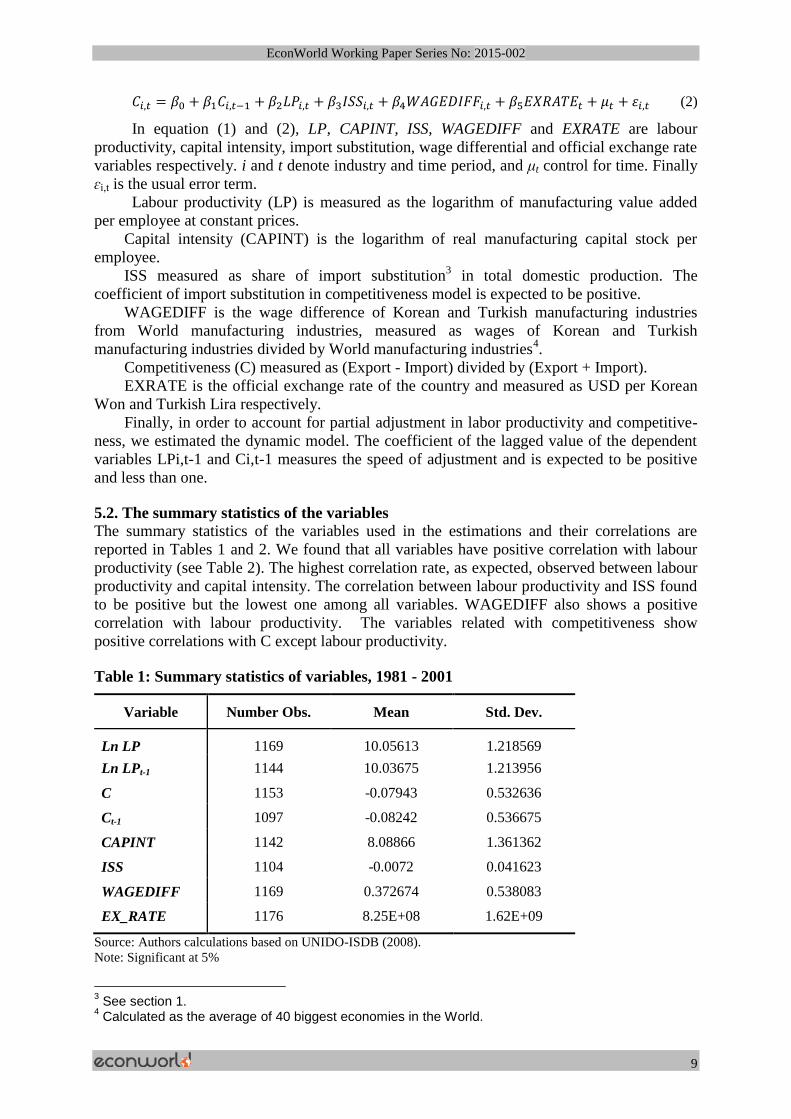
5.2. The summary statistics of the variables
The summary statistics of the variables used in the estimations and their correlations are
reported in Tables 1 and 2. We found that all variables have positive correlation with labour
productivity (see Table 2). The highest correlation rate, as expected, observed between labour
productivity and capital intensity. The correlation between labour productivity and ISS found
to be positive but the lowest one among all variables. WAGEDIFF also shows a positive
correlation with labour productivity. The variables related with competitiveness show
positive correlations with C except labour productivity.
Table 1: Summary statistics of variables, 1981 - 2001
Variable Number Obs. Mean Std. Dev.
Ln LP 1169 10.05613 1.218569
Ln LPt-1 1144 10.03675 1.213956
C 1153 -0.07943 0.532636
Ct-1 1097 -0.08242 0.536675
CAPINT 1142 8.08866 1.361362
ISS 1104 -0.0072 0.041623
WAGEDIFF 1169 0.372674 0.538083
EX_RATE 1176 8.25E+08 1.62E+09
Source: Authors calculations based on UNIDO-ISDB (2008).
Note: Significant at 5%
3 See section 1.
4 Calculated as the average of 40 biggest economies in the World.

New Lessons from an Old Strategy: Kilicaslan and Temurov
10
Table 2: Pair wise correlations, 1981 - 2001
Variable Ln LP Ln LPt-1 C Ct-1 CAPINT ISS WAGEDIFF EX_RATE
Ln LP 1
Ln LPt-1 0.815 1
C -0.149 -0.141 1
Ct-1 -0.159 -0.162 0.937 1
CAPINT 0.805 0.635 -0.140 -0.152 1
ISS 0.004 0.022 0.150 0.040 0.024 1
WAGEDIFF 0.253 0.137 0.224 0.217 0.221 0.006 1
EX_RATE 0.173 0.071 0.090 0.084 0.329 0.053 0.161 1
Source: Authors calculations based on UNIDO-ISDB (2008).
Note: Significant at 5%
Correlation between C and WAGEDIFF found to be positive which inconsistent with
the literature that higher wages related with lower competitiveness of industry. Finally, our
results show that ISS, EX_RATE, WAGEDIFF and CAPINT have positive correlation among
each other.
5.3. Estimation results
Using fixed-effects model in estimation of the equations (1) and (2) may lead to inconsistent
estimation of the coefficients due to existence of lagged dependent variable in these two
equations. We, therefore, use the one-step Generalized Methods of Moments (GMM)
estimation method proposed by Arrellano and Bond (1991) to explore the relations between
import substitution, productivity and competitiveness in this research. This method is suitable
for this type of dynamic equations and takes into account of the endogeneity problem.
The estimation results are reported in Tables 3 – 6. Although estimation results are to
some extent sensitive to the econometric methodology used, they are generally plausible and
robust. We used several combinations of control variables to estimate the effect of IS on
labour productivity. The main results on the effect of IS on labour productivity may be
summarized as follows (see tables 3-4.):
The capital intensity, CAPINT, has a positive effect on labour productivity for both
Korean and Turkish manufacturing industries. The estimated value of long-run elasticity of
capital in Korean manufacturing is reasonable in low tech (between 0.16–0.27) and medium-
high tech (between 0.29–0.36) industries. The coefficient of CAPINT is found to be between
0.13–0.16 in low tech and between 0.18–0.25 in medium-high tech industries of Turkish
manufacturing. Thus in Korean manufacturing, the elasticity of labour productivity to
CAPINT is slightly higher in both low and high tech industries than Turkish manufacturing.
The adjustment of labour productivity (lagged labour productivity) found to be
positive and less than 1, as expected. The coefficient of the lagged labour productivity
variable is higher in Korean manufacturing than in Turkish.
There is a statistically significant and positive relationship between labour
productivity and WAGEDIFF in low and medium tech industries of Korean manufacturing.
The impact of WAGEDIFF on labour productivity is also positive in Turkish manufacturing
but not statistically significant in low tech industries. This coefficient was fond to be positive
and significant in medium-high tech industries. This implies that cross-industry wage
differences helps to enhance labour productivity in medium-high tech industries in Turkish
manufacturing.

EconWorld Working Paper Series No: 2015-002
11
Table 3: Determinants of labour productivity for Korea and Turkey in low tech industries, 1981-01. (Difference GMM (Arellano-Bond)
model, the dependent variable is the labour productivity)
KOREA TURKEY
VARIABLES Model A Model B Model C Model D Model A Model B Model C Model D
Ln LPt-1 0.557** 0.613** 0.537** 0.489** 0.460** 0.461** 0.372** 0.368**
[0.072] [0.078] [0.052] [0.038] [0.074] [0.077] [0.070] [0.063]
CAPINT 0.258** 0.270** 0.173** 0.164** 0.158** 0.159** 0.133** 0.131**
[0.050] [0.052] [0.048] [0.049] [0.027] [0.027] [0.027] [0.028]
ISS -2.373** -2.520** -0.718** -0.609* -0.727* -0.715* -0.617* -0.631*
[0.638] [0.627] [0.258] [0.270] [0.322] [0.312] [0.292] [0.305]
WAGEDIFF 0.086* 0.075** 0.024 0.063
[0.042] [0.022] [0.127] [0.137]
EX_RATE -0.001** -0.001** -0.536** -0.544**
[0.000] [0.000] [0.174] [0.171]
Constant 0.020** 0.011 0.059** 0.067** 0.039** 0.039** 0.064** 0.064**
[0.007] [0.007] [0.011] [0.010] [0.009] [0.009] [0.010] [0.010]
# of obs. 326 326 326 326 326 326 326 326
# of industries 18 18 18 18 18 18 18 18
F-Stat 362.9 371.3 352.0 372.2 37.94 35.42 42.38 40.17
A – B1 -3.287 -3.277 -2.804 -2.728 -3.343 -3.390 -3.424 -3.339
A – B2 -2.383 -2.483 -0.640 -0.948 0.819 0.842 0.775 0.711
Notes: Regression includes time dummies. Robust standard errors in brackets.***significant at 10%; * significant at 5% ** significance at 1%
A-B1: Arellano-Bond test that average auto covariance in residuals of order 1 is 0.
A-B2: Arellano-Bond test that average auto covariance in residuals of order 2 is 0.

New Lessons from an Old Strategy: Kilicaslan and Temurov
12
Table 4: Determinants of labour productivity for Korea and Turkey in medium-high tech industries, 1981-01. (Difference GMM
(Arellano-Bond) model, the dependent variable is the labour productivity)
KOREA TURKEY
VARIABLES Model A Model B Model C Model D Model A Model B Model C Model D
Ln LPt-1 0.438** 0.518** 0.478** 0.426**
0.463** 0.523** 0.430** 0.328**
[0.067] [0.069] [0.068] [0.062] [0.049] [0.033] [0.049] [0.066]
CAPINT 0.354** 0.359** 0.292** 0.304** 0.223** 0.247** 0.217** 0.177**
[0.049] [0.052] [0.050] [0.051] [0.057] [0.059] [0.052] [0.049]
ISS -1.505** -1.737** -1.115** -1.103** -0.699** -0.616* -0.483* -0.551**
[0.162] [0.148] [0.185] [0.187] [0.221] [0.250] [0.233] [0.195]
WAGEDIFF 0.299* 0.245* 2.266*** 2.707*
[0.118] [0.120] [1.178] [1.150]
EX_RATE -0.001** -0.001** -0.528** -0.675**
[0.000] [0.000] [0.196] [0.192]
Constant 0.026** 0.016*** 0.049** 0.048** 0.035** 0.034** 0.064** 0.073**
[0.008] [0.009] [0.016] [0.012] [0.008] [0.009] [0.007] [0.008]
# of obs. 190 190 190 190 190 190 190 190
# of industries 10 10 10 10 10 10 10 10
F-Stat 519.2 292.6 299.7 410.1 100.8 90.18 66.64 89.96
A – B1 -2.746 -2.721 -2.731 -2.778 -2.970 -2.863 -2.894 -2.916
A – B2 -0.0121 -0.0353 -0.832 -0.859 1.713 2.104 2.098 1.051
Notes: Regression includes time dummies. Robust standard errors in brackets.***significant at 10%; * significant at 5% ** significance at 1%
A-B1: Arellano-Bond test that average auto covariance in residuals of order 1 is 0.
A-B2: Arellano-Bond test that average auto covariance in residuals of order 2 is 0.

EconWorld Working Paper Series No: 2015-002
13
Table 5: Determinants of competitiveness for Korea in low tech industries, 1981-01. (Difference GMM (Arellano-Bond) model, the
dependent variable is the competitiveness index)
VARIABLES Model A Model B Model C Model D Model E Model F Model G Model H
Ct-1 0.816** 0.816** 0.820** 0.824** 0.850** 0.843** 0.845** 0.849**
[0.076] [0.078] [0.064] [0.065] [0.054] [0.053] [0.055] [0.054]
ISS 1.366* 1.364* 1.541* 1.619* 2.064* 2.019** 2.028** 2.064**
[0.679] [0.680] [0.682] [0.697] [0.797] [0.767] [0.775] [0.794]
Ln LP 0.088** 0.094**
-0.038 -0.022
[0.032] [0.022]
[0.040] [0.028]
WAGEDIFF 0.006
0.033**
0.019
-0.001
[0.014]
[0.010]
[0.024]
[0.018]
EX_RATE 0.001** 0.001** 0.001** 0.001**
[0.000] [0.000] [0.000] [0.000]
Constant -0.026** -0.027** -0.010** -0.008* -0.000 0.004 0.002 -0.000
[0.006] [0.005] [0.003] [0.004] [0.002] [0.004] [0.003] [0.002]
Observations 324 324 324 324 324 324 324 324
Number of industries 18 18 18 18 18 18 18 18
F-Stat 106.8 105.7 412.0 264.3 163.1 258.4 178.7 206.5
A – B1 -1.753 -1.753 -1.757 -1.758 -1.816 -1.812 -1.812 -1.816
A – B2 -1.223 -1.231 -1.055 -1.032 -1.248 -1.149 -1.161 -1.252
Notes: Robust standard errors in brackets. *** significant at 10%; * significant at 5%; ** significance at 1%
Regression includes time dummies
A-B1: Arellano-Bond test that average auto covariance in residuals of order 1 is 0.
A-B2: Arellano-Bond test that average auto covariance in residuals of order 2 is 0.
New Lessons from an Old Strategy: Kilicaslan and Temurov
14
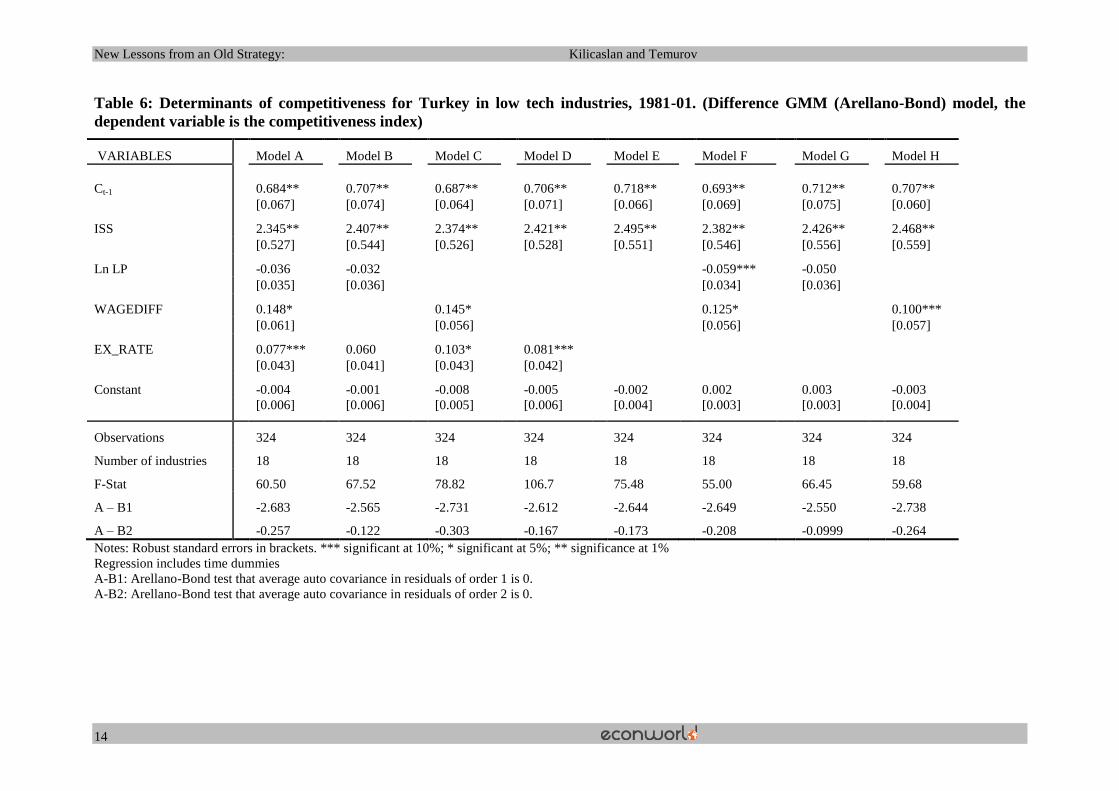
Table 6: Determinants of competitiveness for Turkey in low tech industries, 1981-01. (Difference GMM (Arellano-Bond) model, the
dependent variable is the competitiveness index)
VARIABLES Model A Model B Model C Model D Model E Model F Model G Model H
Ct-1 0.684** 0.707** 0.687** 0.706** 0.718** 0.693** 0.712** 0.707**
[0.067] [0.074] [0.064] [0.071] [0.066] [0.069] [0.075] [0.060]
ISS 2.345** 2.407** 2.374** 2.421** 2.495** 2.382** 2.426** 2.468**
[0.527] [0.544] [0.526] [0.528] [0.551] [0.546] [0.556] [0.559]
Ln LP -0.036 -0.032
-0.059*** -0.050
[0.035] [0.036]
[0.034] [0.036]
WAGEDIFF 0.148*
0.145*
0.125*
0.100***
[0.061]
[0.056]
[0.056]
[0.057]
EX_RATE 0.077*** 0.060 0.103* 0.081***
[0.043] [0.041] [0.043] [0.042]
Constant -0.004 -0.001 -0.008 -0.005 -0.002 0.002 0.003 -0.003
[0.006] [0.006] [0.005] [0.006] [0.004] [0.003] [0.003] [0.004]
Observations 324 324 324 324 324 324 324 324
Number of industries 18 18 18 18 18 18 18 18
F-Stat 60.50 67.52 78.82 106.7 75.48 55.00 66.45 59.68
A – B1 -2.683 -2.565 -2.731 -2.612 -2.644 -2.649 -2.550 -2.738
A – B2 -0.257 -0.122 -0.303 -0.167 -0.173 -0.208 -0.0999 -0.264
Notes: Robust standard errors in brackets. *** significant at 10%; * significant at 5%; ** significance at 1%
Regression includes time dummies
A-B1: Arellano-Bond test that average auto covariance in residuals of order 1 is 0.
A-B2: Arellano-Bond test that average auto covariance in residuals of order 2 is 0.

EconWorld Working Paper Series No: 2015-002
15
Table 7: Determinants of competitiveness for Korea in medium-high tech industries, 1981-01. (Difference GMM (Arellano-Bond) model,
the dependent variable is the competitiveness index)
VARIABLES Model A Model B Model C Model D Model E Model F Model G Model H
Ct-1 0.779** 0.791** 0.833** 0.818** 0.840** 0.840** 0.829** 0.835**
[0.059] [0.058] [0.067] [0.064] [0.059] [0.059] [0.063] [0.067]
ISS 1.036** 1.052** 1.309** 1.131** 1.171** 1.255** 1.309** 1.261**
[0.285] [0.274] [0.265] [0.269] [0.267] [0.256] [0.266] [0.258]
Ln LP 0.114** 0.119** 0.033*
0.031***
[0.026] [0.025] [0.016]
[0.016]
WAGEDIFF 0.026
-0.010 0.051**
0.017
[0.037]
[0.030] [0.016]
[0.022]
EX_RATE 0.001** 0.001**
0.001* 0.001***
[0.000] [0.000]
[0.000] [0.000]
Constant -0.025** -0.025** -0.001 0.001 0.003 0.004 -0.001 0.004
[0.007] [0.007] [0.003] [0.004] [0.004] [0.003] [0.002] [0.002]
Observations 190 190 190 190 190 190 190 190
Number of industries 10 10 10 10 10 10 10 10
F-Stat 146.1 204.8 347.8 187.5 143.9 122.6 225.0 411.5
A – B1 -2.171 -2.190 -2.282 -2.254 -2.252 -2.265 -2.271 -2.291
A – B2 1.250 1.253 0.800 1.066 1.086 0.877 0.756 0.845
Notes: Robust standard errors in brackets. *** significant at 10%; * significant at 5%; ** significance at 1%
Regression includes time dummies
A-B1: Arellano-Bond test that average auto covariance in residuals of order 1 is 0.
A-B2: Arellano-Bond test that average auto covariance in residuals of order 2 is 0.

New Lessons from an Old Strategy: Kilicaslan and Temurov
16
Table 8: Determinants of competitiveness for Turkey in medium-high tech industries, 1981-01. (Difference GMM (Arellano-Bond)
model, the dependent variable is the competitiveness index)
VARIABLES Model A Model B Model C Model D Model E Model F Model G Model H
Ct-1 0.433** 0.437** 0.491** 0.466** 0.464** 0.498** 0.496** 0.497**
[0.127] [0.119] [0.102] [0.095] [0.086] [0.081] [0.091] [0.091]
ISS 0.472** 0.460** 0.583** 0.472** 0.465** 0.589** 0.572** 0.582**
[0.152] [0.158] [0.156] [0.149] [0.152] [0.174] [0.160] [0.161]
Ln LP 0.089 0.058 0.011
-0.015
[0.072] [0.075] [0.054]
[0.054]
WAGEDIFF -0.700**
-0.639** -0.408
-0.583*
[0.253]
[0.187] [0.269]
[0.234]
EX_RATE 0.207* 0.201*
0.137** 0.144**
[0.088] [0.094]
[0.052] [0.045]
Constant -0.013 -0.011 0.004 0.000 -0.002 0.003 0.005 0.005*
[0.012] [0.013] [0.007] [0.003] [0.002] [0.002] [0.007] [0.003]
Observations 190 190 190 190 190 190 190 190
Number of industries 10 10 10 10 10 10 10 10
F-Stat 20.63 25.92 15.22 19.68 25.71 21.58 20.32 13.70
A – B1 -1.852 -1.865 -1.672 -1.696 -1.710 -1.648 -1.674 -1.630
A – B2 1.036 1.005 0.979 0.984 0.968 0.955 0.951 0.972
Notes: Robust standard errors in brackets. *** significant at 10%; * significant at 5%; ** significance at 1%
Regression includes time dummies
A-B1: Arellano-Bond test that average auto covariance in residuals of order 1 is 0.
A-B2: Arellano-Bond test that average auto covariance in residuals of order 2 is 0.

EconWorld Working Paper Series No: 2015-002
17
We found that there is a negative and statistically significant relation between import
substitution, ISS, and labour productivity in both Korean and Turkish manufacturing
industries. This implies that import substitution, in fact, does not help to increase in labour
productivity in manufacturing industry.
The results show that exchange rates are negatively associated with labour
productivity in low and medium-high technology intensive industries of Korean and Turkish
manufacturing industry.
The findings on the relation between industrial competitiveness and imports
substitution and the other control variables may be summarized as follows (see table 5-8.):
There is statistically significant and positive relation between industrial competiveness
and ISS in Korean and Turkish manufacturing for both low and medium-high tech industries.
This implies that import substitution enhances competitiveness of an industry.
The findings on the relation between labour productivity and competitiveness show
differences in these two economies: while labour productivity has a positive and significant
impact on industrial competitiveness in Korean low and medium-high tech manufacturing
industries, it has negative impact in low tech industries of Turkish manufacturing. Thus,
according to our findings, the significant impact of labour productivity on industrial
competitiveness observed in Korean manufacturing. It seems that in Turkey competitiveness
of an industry de-pends on the factors other than productivity.
The relationship between industrial competiveness and WAGEDIFF in two different
technology intensive industries of Korea turned out to be insignificant in most of the
estimated models. This means that competitiveness of Korean manufacturing industry may
not depend on low wages. In Turkey, on the other hand, while the relation between
competitiveness and WAGEDIFF is found to be positive in low tech industries, the relation
found to be insignificant in medium-high-tech industries. These finding may imply that
competitiveness in medium-high tech manufacturing industries in Turkey does not depend on
wage difference. The finding on the relation between competitiveness and wage differentials
may also be misleading due to possible correlation between LP and wages, because high
productivity sectors pay higher wages.
Finally, the estimation results show that exchange rate is a significant determinant of
competitiveness in both countries. We found positive and significant coefficient of exchange
rates in both low and medium-high tech industries of Korea and Turkey.
6. Conclusions
This paper examines the impact of import substitution on industrial competitiveness and
labour productivity in Korean and Turkish manufacturing industries.
Our findings show that Turkey has really left import substitution after 1980s. We found
some degree of import substitution in 3-4 industries out of 28 manufacturing industries.
However the shares of import substitution in these industries is found to be quite small except
tobacco industry. The findings on import substation in Korean manufacturing are not different
than Turkey especially in the 1980s. We found weak evidence of IS in three out of 28
industries in Korea in 1980s.
The picture, however, is quite different for in the 1990s: we found evidence of import
substitution in 11 industries of Korean manufacturing. We found significant share of import
substitution in total production of professional and scientific equipment, transportation
equipment, electrical machinery, miscellaneous petroleum products, industrial chemicals
industries and petroleum refineries.
Our dynamic panel data estimation results showed that import substitution did not
enhance labour productivity in manufacturing industry of both Korea and Turkey in1980s and

New Lessons from an Old Strategy: Kilicaslan and Temurov
18
1990s. On the other hand, we found that import substitution affects industrial competitiveness
positively in both Korea and Turkey. Furthermore, the impact of import substitution holds
both in low and medium-high technology intensive industries.
Apart from the positive impact of import substitution on competitiveness, we also found
in this study that while Korean manufacturing industry competitiveness is closely associated
with labour productivity, competitiveness of Turkish manufacturing industry depends on the
other factors such as exchange rates, wage differentials rather than labour productivity.
The findings of this study allow us drive a few important policy proposals for Turkish
manufacturing industry: Although this study finds no association between labour productivity
and import substitution, it confirms that import substitution enhances industrial
competitiveness. Therefore, conditional and transitory support of domestic production of
some medium and high technology intensive products being imported may affect both
manufacturing competitiveness and foreign trade balance of Turkey positively. In other
words, while promoting manufacturing exports on the one hand, production of medium and
high technology intensive capital goods domestically should be promoted. This will
contribute the growth of Turkish economy in a sustainable and healthy way.
References
Anne O. Krueger "Trade Policy and Economic Development: How we Learn", NBER Working Paper
Series, working paper 5896, January 1997.
Bauman R. and Ana Maria P.F. (2006) "Import Substitution in Brazil between 1995-2000 in Cepal
review", University of Sao Paulo Economics, University de Sao Paulo Press.
Bela Balassa "Industrial Policies in Taiwan and Korea", Weltwirtschaftliches Archiv (1971), pp. 55-
77 doi:10.1007/BF02696631
Chenery, H.B. (1960) "Patterns of Industrial Growth", American Economic Review, Sept. 1960, pp.
624-654.
Claudio Sapelli "The Political Economics of Import Substitution Industrialization: Some Reflections
on the Political Economics of Liberalization, the Role of External Shocks and of Donor
Agencies", Department of Political Science, Tulane University, October 2002.
Desai, Padma (1969) Alternative Measures of Import Substitution, Oxford Economic Papers, New
Series, Vol. 21, No. 3 (Nov.), pp. 312-324
Diego Puga and Anthony J. Venables "Agglomeration and Economic Development: Import
Substitution vs. Trade Liberalization", The Economic Journal, 109 (April), 292-311.
doi:10.1111/1468-0297.00433
Diaz-Alejandro, C.F. (1975) "Trade, Policies and Economic Development", International Trade and
Finance: Frontiers for Research, Cambridge, Cambridge University Press.
Douglas A. Irwin "Did Import Substitution Promote Growth in the Late Nineteenth Century?" NBER
Working Paper Series, working paper 8751, February 2002 www.nber.org/papers/w875
Desai P. (1969) "Alternative Measures of Import Substitution", Oxford Economic Papers, vol. 21,
No. 3, Oxford, Oxford University Press. doi:10.1093/oxfordjournals.oep.a041131

EconWorld Working Paper Series No: 2015-002
19
Fane George "Consistent Measures of Import Substitution", Oxford Economic Papers, July 1973, pp.
251-261.
Guillaumont P. "More on Consistent Measures of Import Substitution", Political Economics Review,
1978, pp. 165-181.
Harry G. Johnson (1965) "Tariffs and Economic Development, Some Theoretical Issues", Journal of
Development Studies, vol. i. No. 1 p. 25
Henry J. Bruton (1985) "Import Substitution" Williams College, Handbook of Development
Economics, # 121, 1601-1644.
Henry J. Bruton "A Reconsideration of Import Substitution", Journal of Economic Literature, Vol.
36, No. 2. (Jun., 1998), pp. 903-936.
Hong Liang A. "Thesis on the Rationales of Import Substitution Industrialization Strategy",
November 1993, www.dissertation.com
Kılıçaslan, Y., and E. Taymaz (2004), "Structural Change, Productivity and Competitiveness in
MENA Countries", ERF 11th Annual Conference, Beirut, December 14-16.
Kılıçaslan, Y., and L. Erdoğan (2012), "Industry Orientation, Exporting and Productivity", Modern
Economy Journal, vol, 3,pp, 81-90, January 2012.
Kılıçaslan Y. "Industrial Structure and Labour Markets: a Study on Productivity and Growth", June
2005, www.etd.lib.metu.edu.tr
Kılıçaslan Y. and E. Taymaz "Labour Market Institutions and Industrial Performance: an
Evolutionary Study", Journal of Evolution Economics, May 2008, pp. 477–492
doi:10.1007/s00191-008-0098-4
M. Teresa Costa-Campi and Elisabet Viladecans-Marsal "The District Effect and the
Competitiveness of Manufacturing Companies in Local Productive Systems", Urban Studies,
vol. 36, No. 12, pp. 2085-2098, 1999. doi:10.1080/0042098992557
Morley, Samuel A. and Gordon W. Smith "On the Measurement of Import Substitution", American
Economic Review, Sept. 1970.
Morley, Samuel A. and Gordon W. Smith "Import Substitution and Foreign Investment in Brazil",
Oxford Economics Papers, Mar. 1971. doi:10.1093/oxfordjournals.oep.a041179
Pierre-Richard Agenor "Competitiveness and External Trade Performance of the French
Manufacturing Industry", Weltwirtschaftliches Archiv 1997, Vol. 133 No: 1, pp. 103-132.
doi:10.1007/BF02707679
Paolo G., Paola M., Gennaro Z. "The Dynamics of International Competitiveness: First Results from
an Analysis at the Industry Level, Università di Roma "La Sapienza", March 1996.
Premachandra ATHUKORALAGE "Import Substitution, Structural Transformation and
Import Dependence – A Case Study of Shri Lanka", Handbook of Development Economics, #
119, 120-142.
Simón Teitel and Francisco E. Thoumi "From Import Substitution to Exports: The Manufacturing
Exports Experience of Argentina and Brazil", Economic Development and Cultural Change,
Vol. 34, No. 3, Growth Reform, and Adjustment: Latin America's Trade and Macroeconomic
Policies in the 1970s and 1980s (Apr.,1986), pp. 455-490

New Lessons from an Old Strategy: Kilicaslan and Temurov
20
S. R. Lewis Jr. and R. Soligo "Growth and Structural Changes in Pakistan's Manufacturing Industriy,
1954 to 1964", Pakistan Development Review, spring 1965, pp. 94-139.
Timothy J. Bartik Economic Development Strategies, Upjohn Institute Staff Working Paper, January
1995, 95-33
Wendy C., Andrew G., John Van Reenen "Export Market Performance of OECD Countries: an
empirical examination of the role of cost competitiveness", The Institute For Fiscal Studies,
Working Paper Series No. W99/21.