new nursing home quality composite score, quality ... · new nursing home quality composite score,...
TRANSCRIPT
New Nursing Home Quality Composite Score, Quality Improvement and QAPI
Frank Barber, MBA, MHA, RHIAQuality Improvement Consultant
TMF Health Quality Institute

Objectives Define the National Nursing Home Quality
Care Collaborative (NNHQCC) Quality Composite Measure Score (CS)
Identify the relationship between the CS, the Minimum Data Set (MDS) and the Quality Measures (QMs)
Understand how to use the Composite Score for Quality Improvement (QI)
Jumpstart Element 3 of QAPI 2
About the TMF QIN-QIOTMF Health Quality Institute has partnered with the Arkansas Foundation for Medical Care, Primaris in Missouri and the Quality Improvement Professional Organization, Inc. in Puerto Rico to form the TMF Quality Innovation Network Quality Improvement Organization (TMF QIN-QIO), under contract with the Centers for Medicare & Medicaid Services (CMS). The TMF QIN-QIO works with providers across all care settings to provide quality improvement services in the states of Arkansas, Missouri, Oklahoma and Texas, and the territory of Puerto Rico.
3
QIN-QIO Key Roles Champion local-level, results-oriented change
Facilitate learning and action networks (LAN)
Teach and advise as technical experts
Provide integrated communications across provider types and health care segments
4


Goals for this Five-Year Project Ending 2019
Achieve a score of six or less on the National Nursing Home Quality Composite Measure Score
Increase mobility of long-stay residents*
Decrease antipsychotic medication use
Decrease healthcare-associated infections and other healthcare-acquired conditions
Decrease potentially avoidable hospitalizations
6
QMs and the New Nursing Home Quality
Composite Score
7
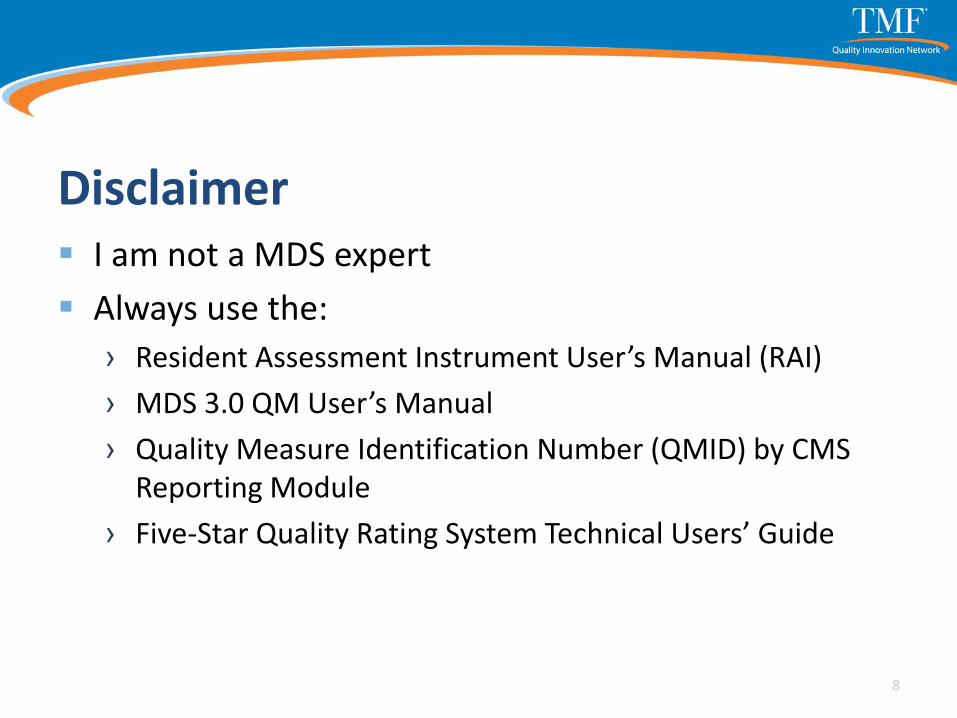
Disclaimer I am not a MDS expert
Always use the:
› Resident Assessment Instrument User’s Manual (RAI)
› MDS 3.0 QM User’s Manual
› Quality Measure Identification Number (QMID) by CMS Reporting Module
› Five-Star Quality Rating System Technical Users’ Guide
8
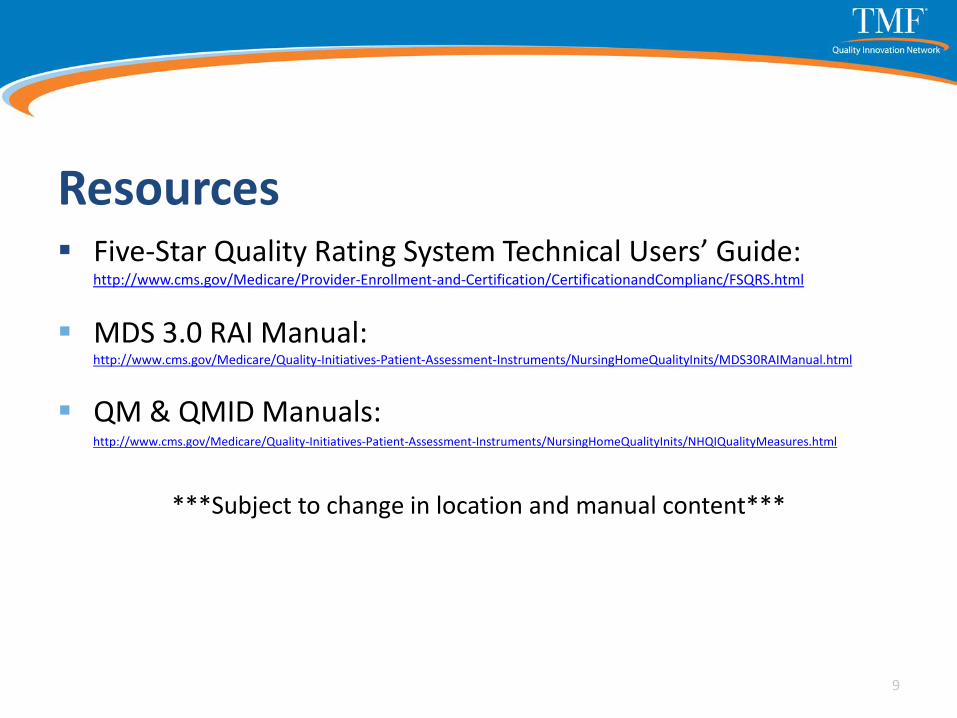
Resources Five-Star Quality Rating System Technical Users’ Guide:
http://www.cms.gov/Medicare/Provider-Enrollment-and-Certification/CertificationandComplianc/FSQRS.html
MDS 3.0 RAI Manual:http://www.cms.gov/Medicare/Quality-Initiatives-Patient-Assessment-Instruments/NursingHomeQualityInits/MDS30RAIManual.html
QM & QMID Manuals:http://www.cms.gov/Medicare/Quality-Initiatives-Patient-Assessment-Instruments/NursingHomeQualityInits/NHQIQualityMeasures.html
***Subject to change in location and manual content***
9

Texas MDS Program StaffMDS Automation and QIES CoordinatorFor assistance with MDS reporting schedule, data file submission, Texas-specific requirements, validation reports, data correction, QIES access, CASPER Reports, QM Reports and data requests:
Brian JohnsonEmail: [email protected]: 512-438-2396Fax: 512-438-4285 (shared fax – call first)
10

Texas MDS Program StaffMDS Clinical CoordinatorFor assistance with the MDS RAI Manual, specific MDS sections or items, RUGs, CAAs, RAPs, care plans and Swing Bed MDS:
Cheryl Shiffer, BSN, RN, RAC-CTEmail: [email protected]: 210-619-8010Fax: 210-871-6484 (shared fax – call first)
11
Data = a Person
12
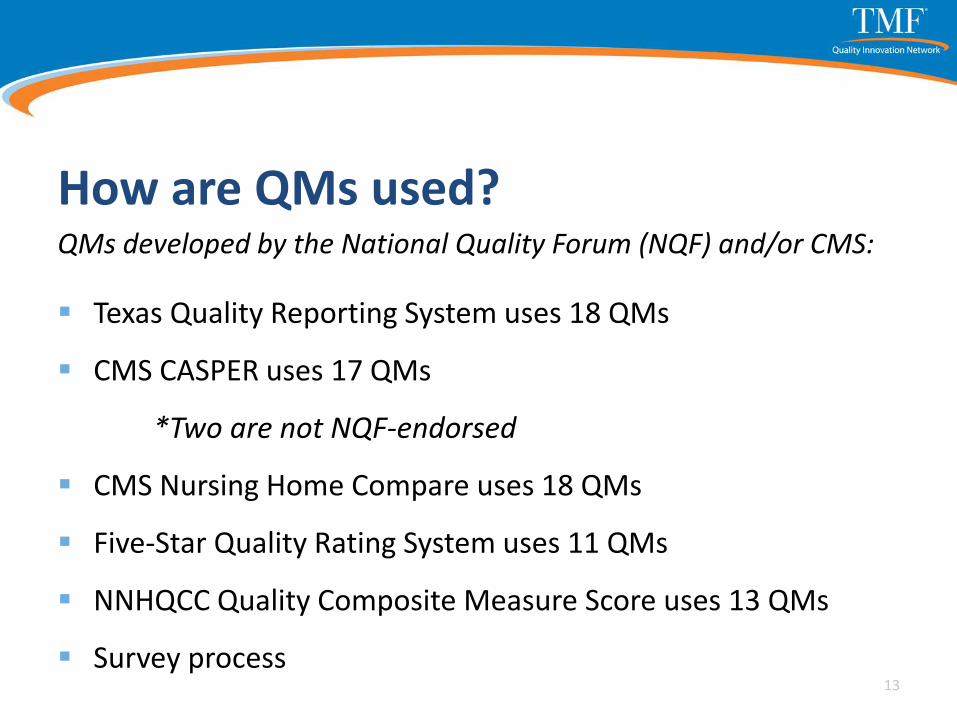
How are QMs used?QMs developed by the National Quality Forum (NQF) and/or CMS:
Texas Quality Reporting System uses 18 QMs
CMS CASPER uses 17 QMs
*Two are not NQF-endorsed
CMS Nursing Home Compare uses 18 QMs
Five-Star Quality Rating System uses 11 QMs
NNHQCC Quality Composite Measure Score uses 13 QMs
Survey process13
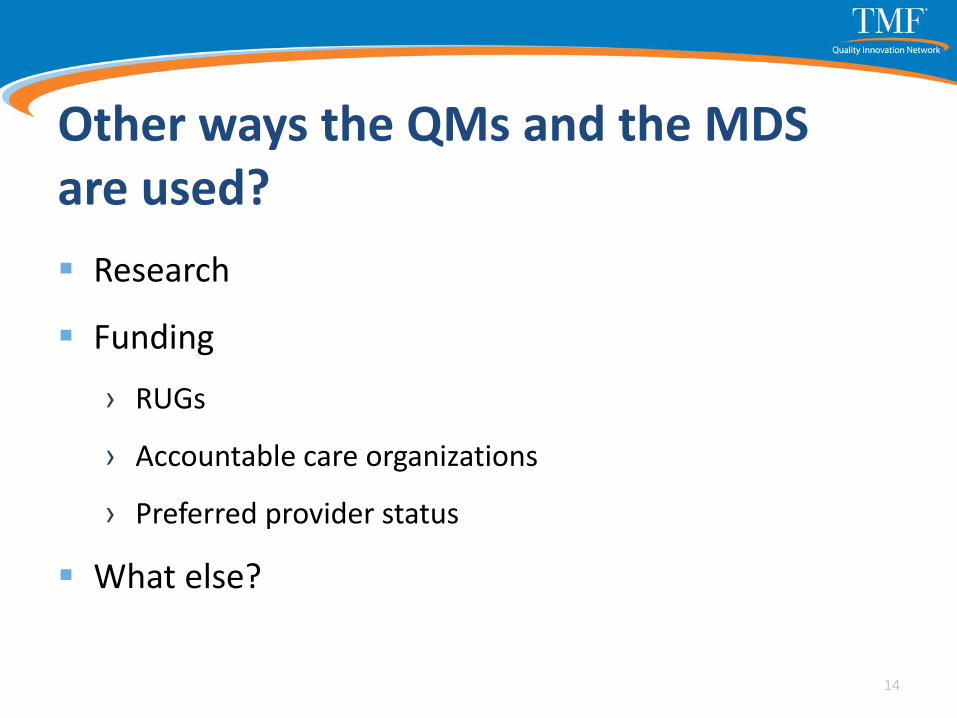
Other ways the QMs and the MDS are used?
Research
Funding
› RUGs
› Accountable care organizations
› Preferred provider status
What else?
14

Five-Star Quality Rating System Long-Stay Residents:
Percent of residents whose need for help with activities of daily living has increased
Percent of high risk residents with pressure ulcers (sores)
Percent of residents who have/had a catheter inserted and left in their bladder
Percent of residents who were physically restrained
Percent of residents with a urinary tract infection
Percent of residents who self-report moderate to severe pain
Percent of residents experiencing one or more falls with major injury
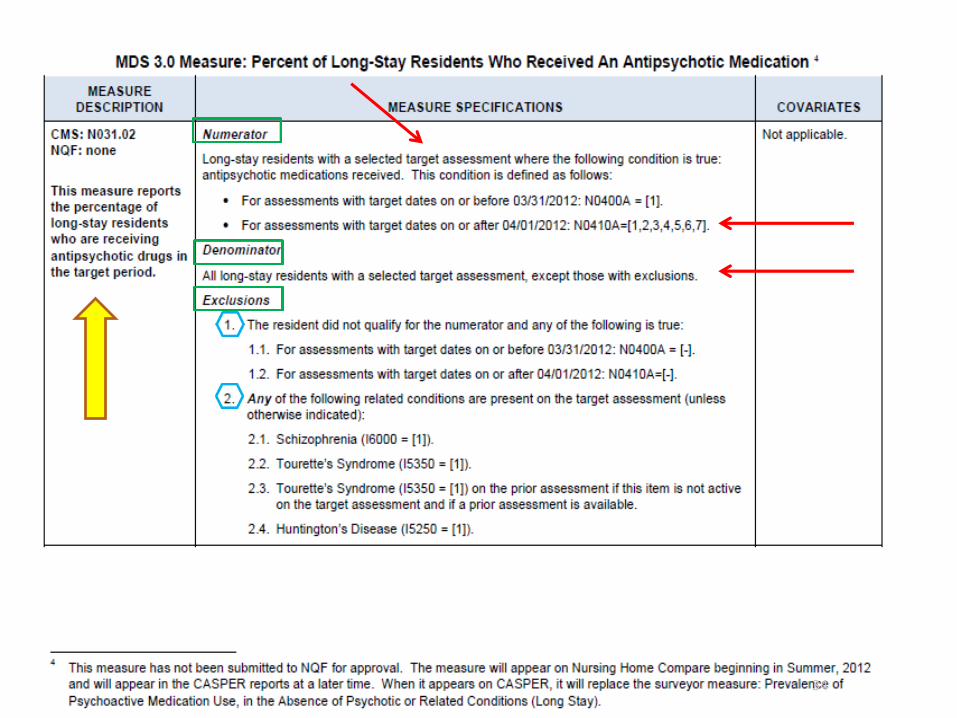
Percent of residents who received an antipsychotic medication
Short-stay residents:
Percent of residents with pressure ulcers (sores) that are new or worsened
Percent of residents who self-report moderate to severe pain
Percent of residents who newly received an antipsychotic medication
CMS Five-Star Quality Rating System: Technical Users’ Guide February 2015 15
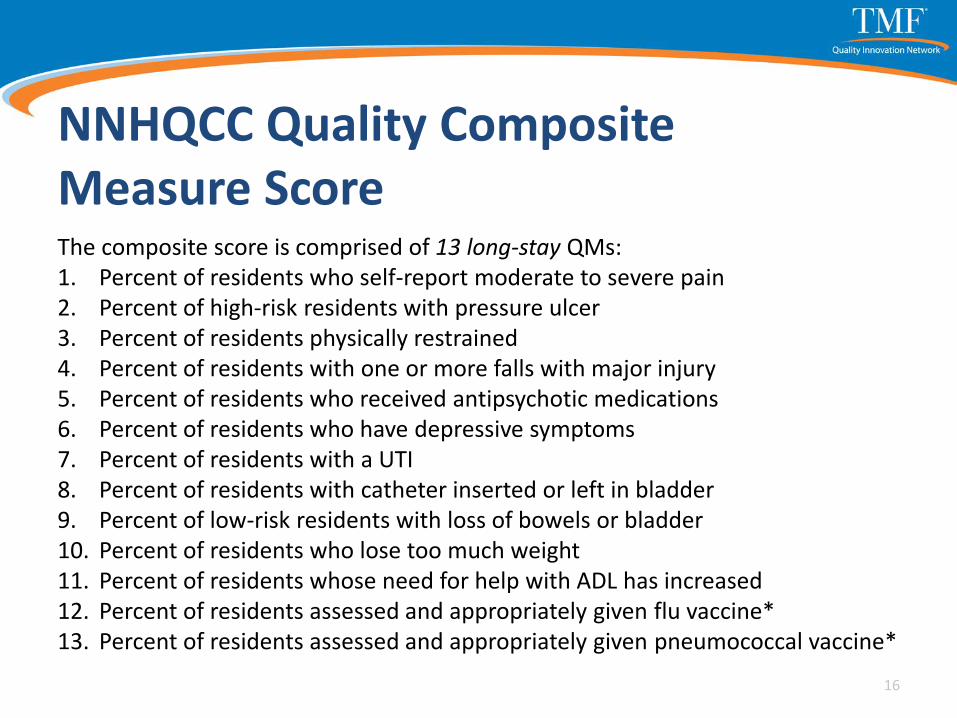
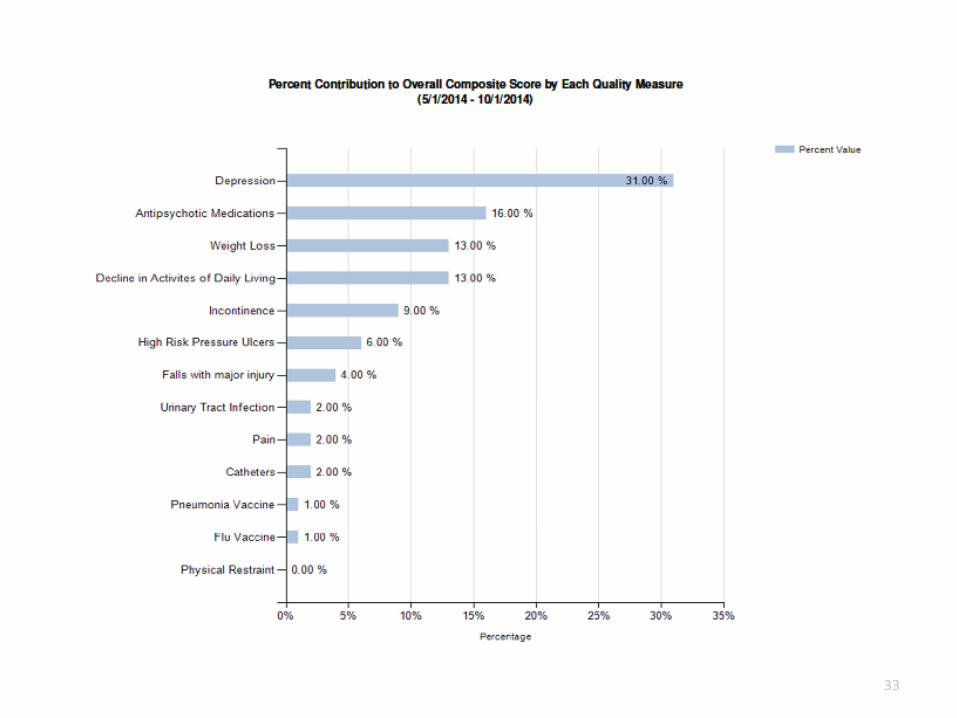
NNHQCC Quality Composite Measure ScoreThe composite score is comprised of 13 long-stay QMs: 1. Percent of residents who self-report moderate to severe pain 2. Percent of high-risk residents with pressure ulcer 3. Percent of residents physically restrained 4. Percent of residents with one or more falls with major injury 5. Percent of residents who received antipsychotic medications 6. Percent of residents who have depressive symptoms 7. Percent of residents with a UTI 8. Percent of residents with catheter inserted or left in bladder 9. Percent of low-risk residents with loss of bowels or bladder 10. Percent of residents who lose too much weight 11. Percent of residents whose need for help with ADL has increased 12. Percent of residents assessed and appropriately given flu vaccine*13. Percent of residents assessed and appropriately given pneumococcal vaccine*
16
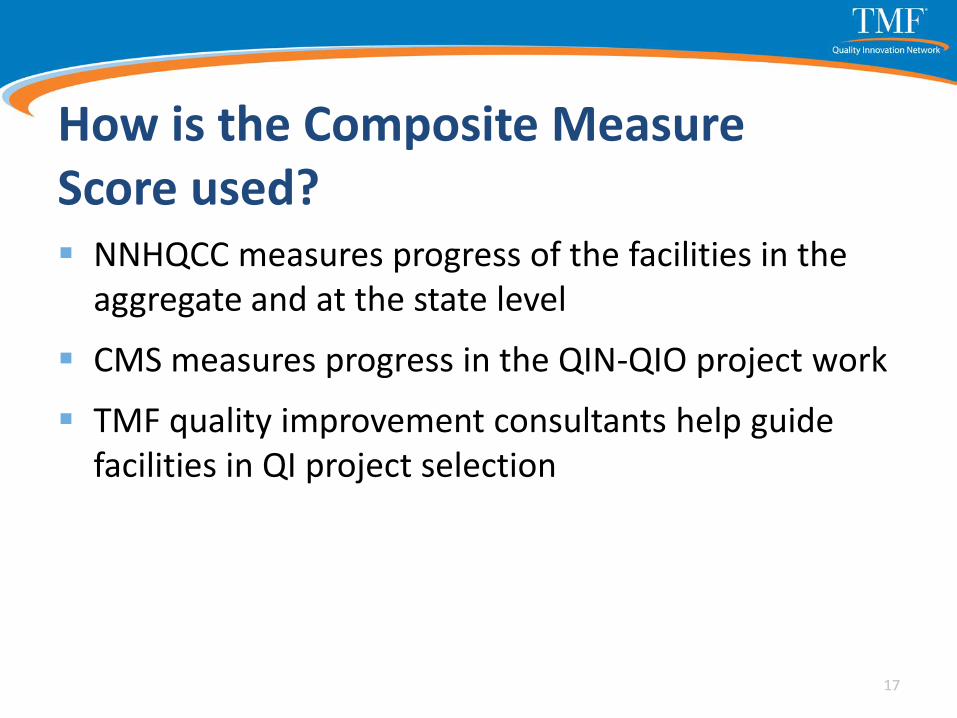
How is the Composite Measure Score used? NNHQCC measures progress of the facilities in the
aggregate and at the state level
CMS measures progress in the QIN-QIO project work
TMF quality improvement consultants help guide facilities in QI project selection
1717
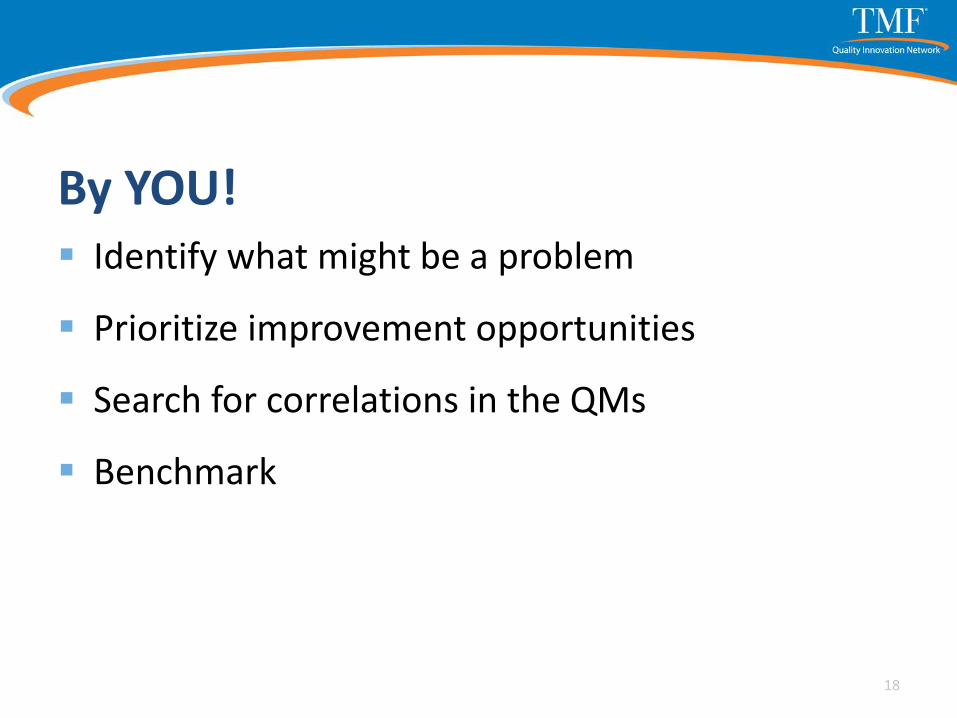
By YOU! Identify what might be a problem
Prioritize improvement opportunities
Search for correlations in the QMs
Benchmark
18
Benefits of the Composite Score It paints a more complete picture of the facility
Uses only long-stay measures, which usually account for the largest portion of the nursing home population
Participating facilities have new comparison groups
19

Benefits of the Composite ScoreThese QMs were selected as they represent connected processes as well as being influenced by larger systems within the nursing home.
20
‘Opportunity Model’ ConceptEach QM numerator (residents who triggered) is a potential “missed opportunity” to deliver good care.
For example:
Who wants to be in pain?
No one – therefore not managing someone’s pain is our missed opportunity to deliver great care.
21

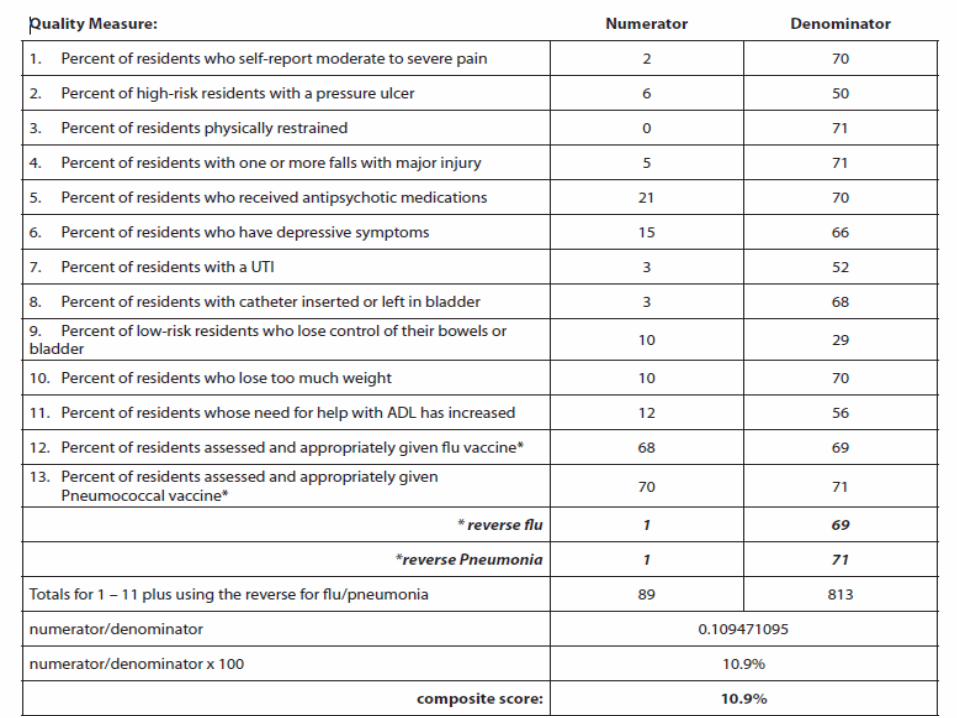
Calculating the Composite Score• Sum the 13 measure numerators to obtain
the composite numerator
• Sum the 13 measure denominators to obtain the composite denominator
• Divide the composite numerator by the composite denominator
• Multiply by 100
2222
23
24
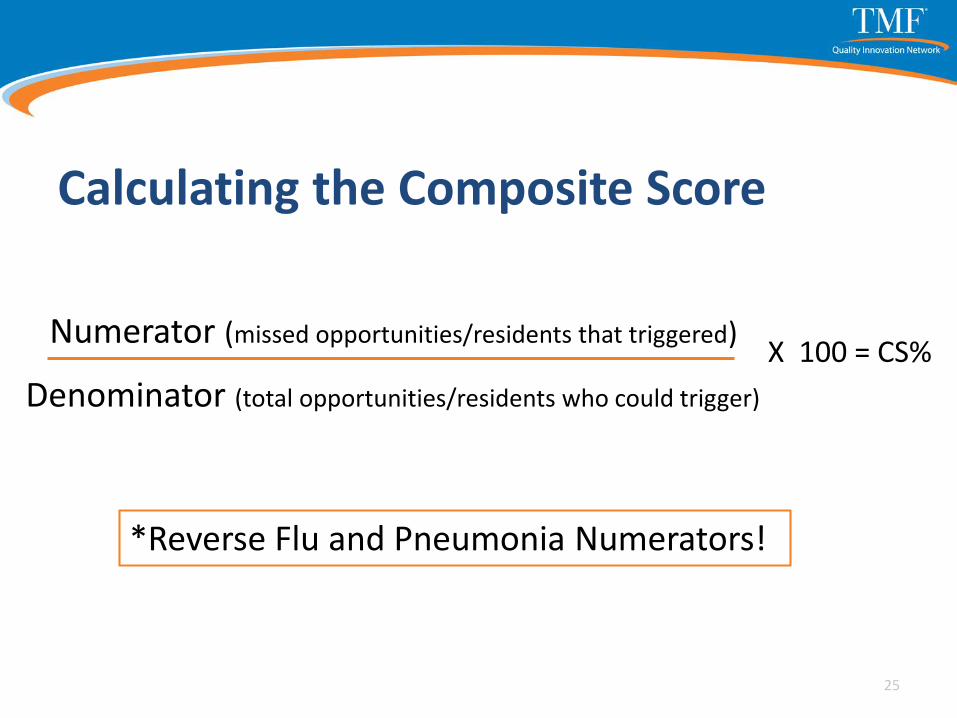
Calculating the Composite Score
Numerator (missed opportunities/residents that triggered)
Denominator (total opportunities/residents who could trigger)
X 100 = CS%
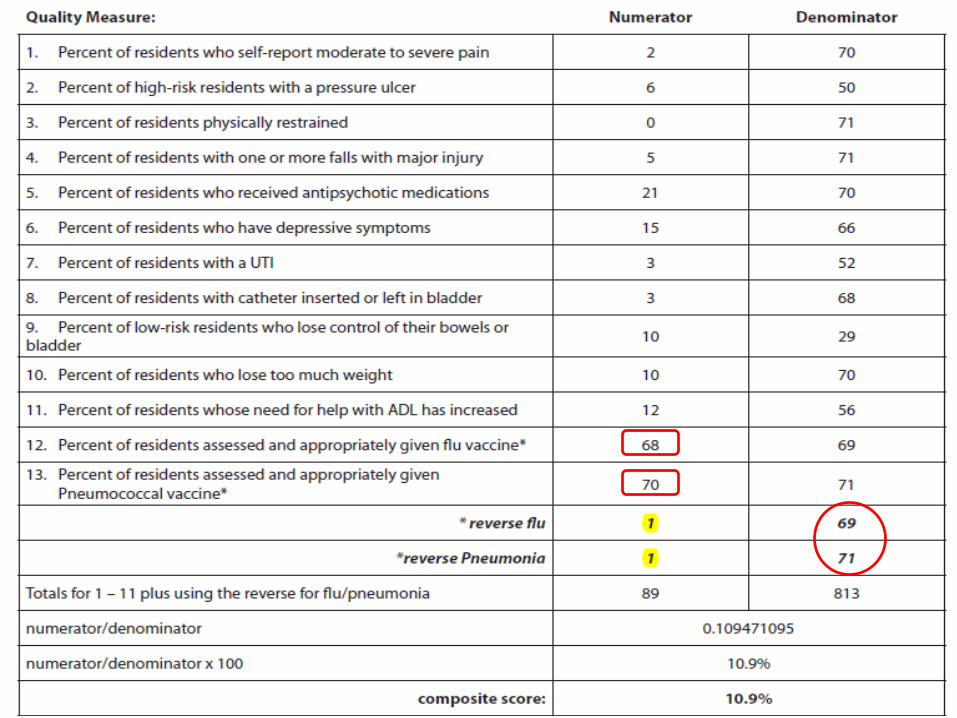
*Reverse Flu and Pneumonia Numerators!
25
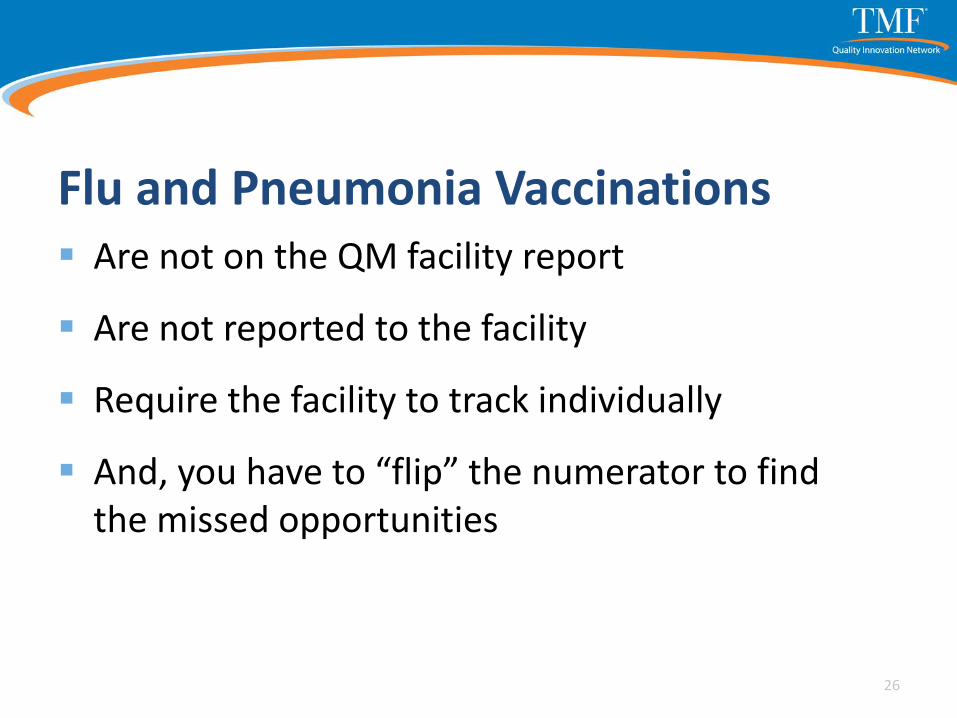
Flu and Pneumonia Vaccinations Are not on the QM facility report
Are not reported to the facility
Require the facility to track individually
And, you have to “flip” the numerator to find the missed opportunities
26
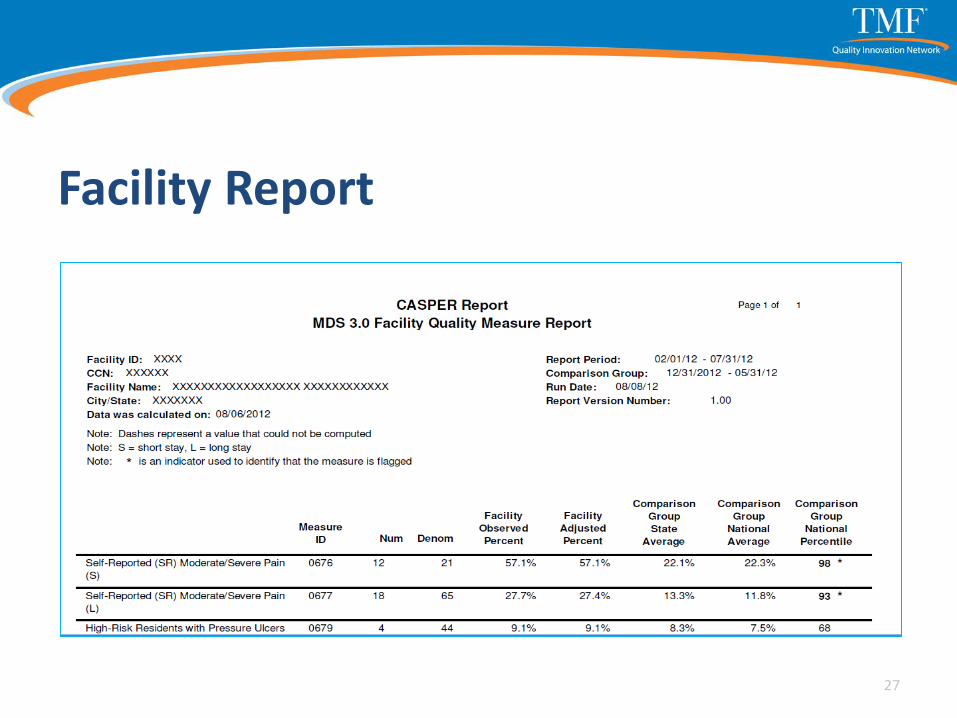
Facility Report
27


29

Composite Score Facility Report
30
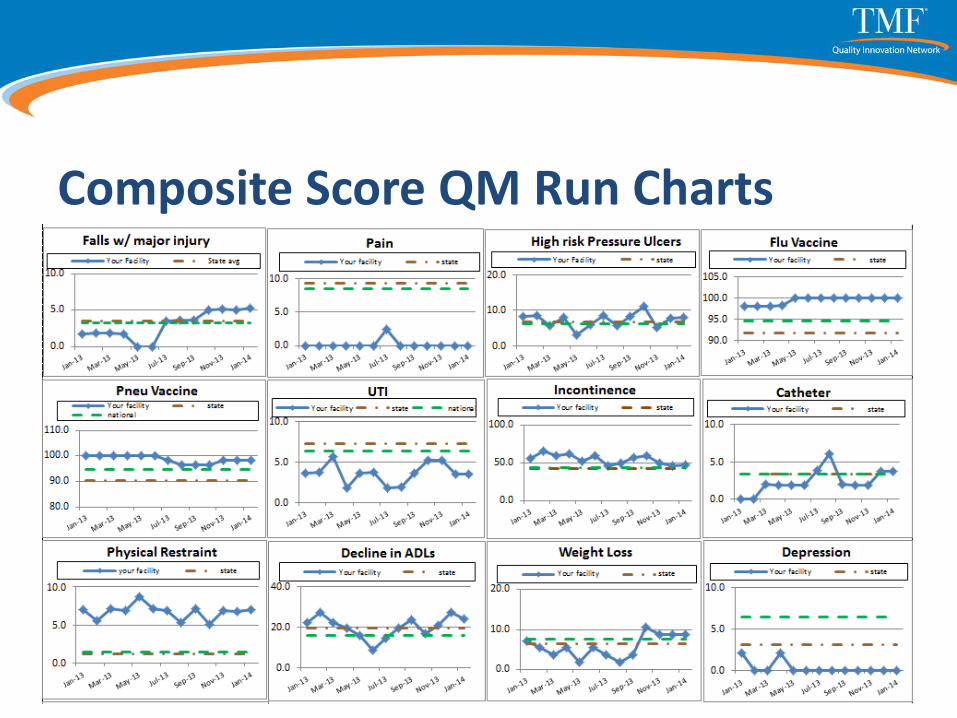
Composite Score QM Run Charts
31

Individual Run Charts
32
33
34
QAPI Element 3Feedback, Data Systems and Monitoring
35

Element 3: Feedback, Data Systems and Monitoring Use systems to monitor care and services, drawing data
from multiple sources.
Use feedback systems to actively incorporate input from staff, residents, families and others as appropriate.
Use performance indicators to monitor a wide range of care processes and outcomes, and review findings against benchmarks and/or targets that the facility has established for performance.
Use tracking, investigating and monitoring of adverse events that must be investigated every time they occur, and implement action plans to prevent recurrences.
36
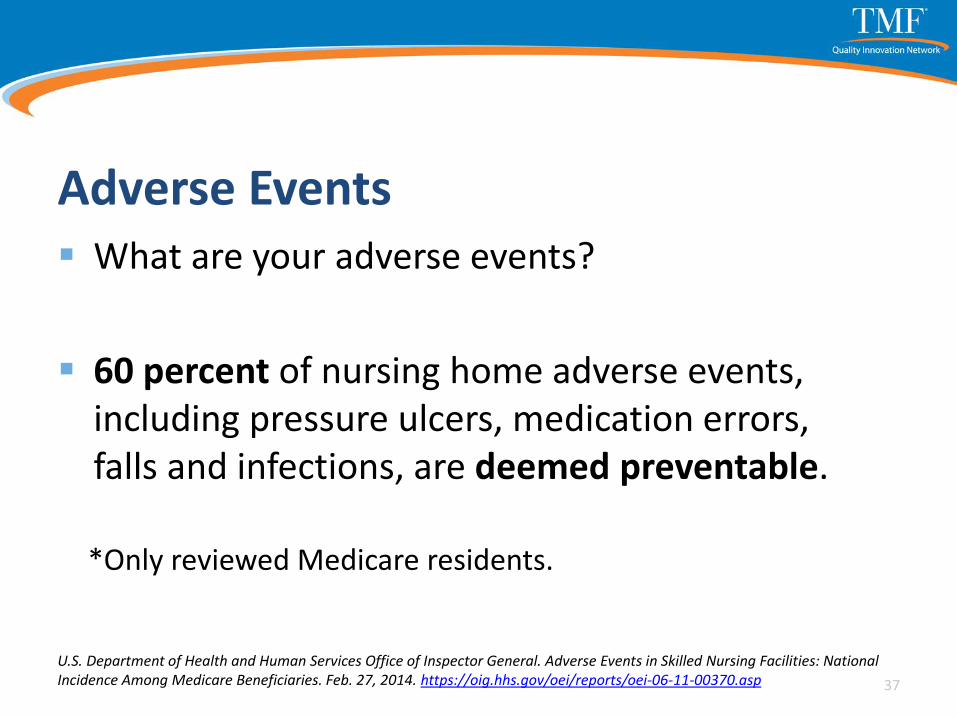
Adverse Events What are your adverse events?
60 percent of nursing home adverse events, including pressure ulcers, medication errors, falls and infections, are deemed preventable.
*Only reviewed Medicare residents.
U.S. Department of Health and Human Services Office of Inspector General. Adverse Events in Skilled Nursing Facilities: NationalIncidence Among Medicare Beneficiaries. Feb. 27, 2014. https://oig.hhs.gov/oei/reports/oei-06-11-00370.asp 37

Modified Version of the NCC MERP Index for Categorizing Errors Used in the OIG Study of Adverse Events in SNFs
Level Description Category
EHarm occurred that caused temporary harm that required
intervention.
Temporary
Harm Event
F
Harm occurred that prolonged the SNF stay and led to a
transfer to a different SNF or other post-acute facility and/or
hospitalization (i.e., admission to a hospital observation unit,
an emergency department, or inpatient care).
GHarm occurred that contributed to or resulted in permanent
resident harm.
HHarm occurred that required intervention to sustain the
resident’s life.
IHarm occurred that may have contributed to or resulted in
resident death.
Adverse Event
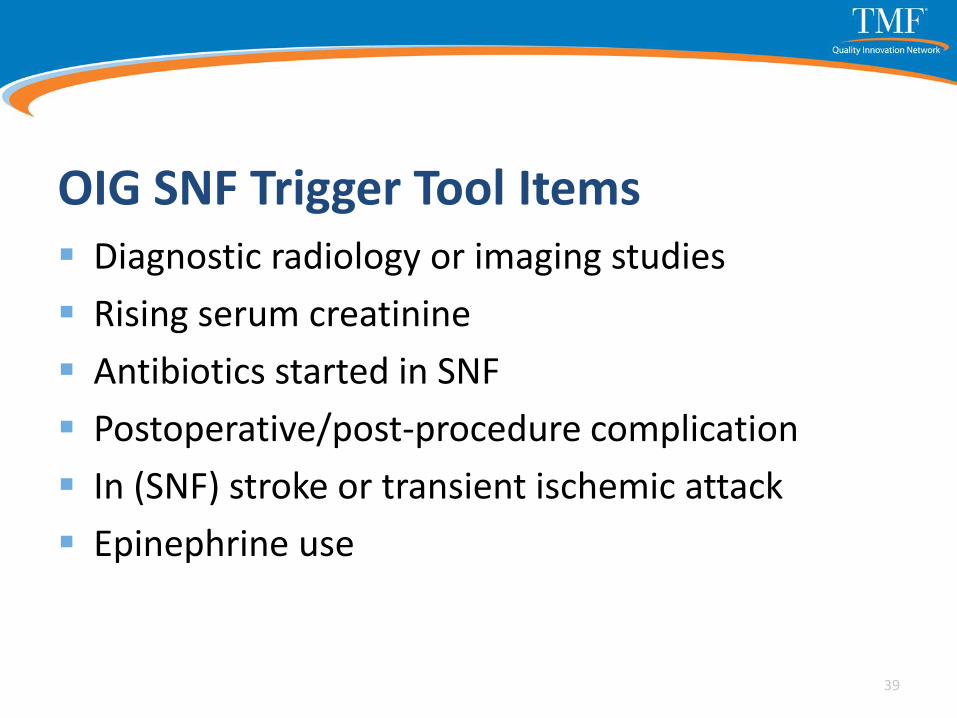
OIG SNF Trigger Tool Items Diagnostic radiology or imaging studies
Rising serum creatinine
Antibiotics started in SNF
Postoperative/post-procedure complication
In (SNF) stroke or transient ischemic attack
Epinephrine use
39

OIG SNF Trigger Tool Items Increasing pain medication needs
Significant Change in Status Assessment in MDS
New onset diarrhea
New onset of incontinence
Family complaint
Call to physician or family members
40
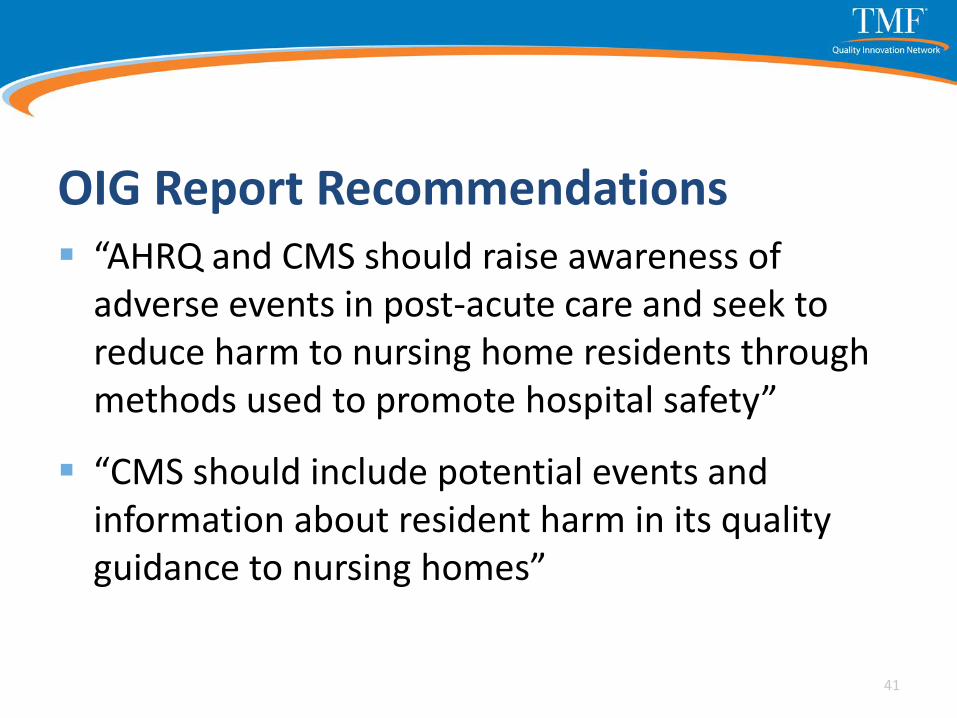
OIG Report Recommendations “AHRQ and CMS should raise awareness of
adverse events in post-acute care and seek to reduce harm to nursing home residents through methods used to promote hospital safety”
“CMS should include potential events and information about resident harm in its quality guidance to nursing homes”
41
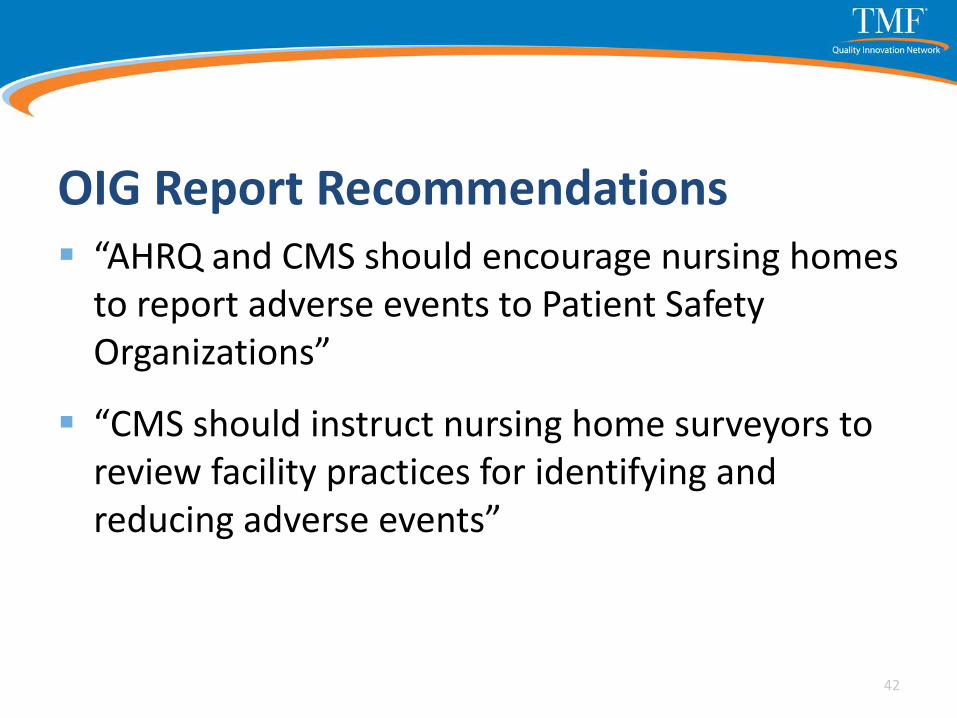
OIG Report Recommendations “AHRQ and CMS should encourage nursing homes
to report adverse events to Patient Safety Organizations”
“CMS should instruct nursing home surveyors to review facility practices for identifying and reducing adverse events”
42
Jump-Starting Element 3
So much data…
…So little time
43
Jump-Starting Element 3 What is most important to you?
What is costing you (and the resident) the most:
› Time
› Talent
› Dollars
› Pain and suffering
44
Jump-Starting Element 3What do you do that is:
High volume
Problem prone
High cost
High risk
Low volume
45
Jump-Starting Element 3Don’t forget non-clinical issues:
Turnover
Paying bills
Emergency prep/drills
Maintenance work requests
Vendors
46
Develop a Strategy for Collecting and Using QAPI Data Set performance targets and identify
performance benchmarks
› performance targets = goals
› performance benchmarks = industry bests
47

Develop a Strategy for Collecting and Using QAPI Data Set performance targets and identify
performance benchmarks
Identify what performance metrics will be monitored (your organization's activities and performance)
Identify who and how data will be collected, analyzed and used
48
Develop a Strategy for Collecting and Using QAPI Data Develop a process for organizing and interpreting
data
› Graphs
› Charts
› Sharing with teams
› Transparency
49
Potential QAPI Data Sources QMs and Composite Score
New mobility measure
24-hour report
Interact 3.0 Tools (SBAR Communication Form, Stop and Watch)
AHCA LTC Trend Tracker
Survey history and prep reports
50

Potential QAPI Data Sources Readmission reports
Staff error and near-miss reports
Non-clinical reports
› Turnover
› Satisfaction surveys
› Visitor and vendor reports
› Family/resident complaints/comments
51

QAPI Data Measure Specifications Define the population measured
Who’s in the numerator
Who’s in the denominator
Who’s excluded
Timeframe for data collection
What is the source data (e.g. MDS)
Use the QM manual as an example52
Element 3Use tracking, investigating and monitoring of adverse events that must be investigated every time they occur, and action plans are implemented to prevent recurrences.
53
Think Deep and Wide Not just for this one resident
Not just for this adverse event
What warning signs did we miss/catch
What can we learn
How do we push the learning forward
54
Where to Start?
55
Identify Gaps and QI Opportunities Conduct gap analyses to identify areas for
improvement
Gap analysis is a strategic planning tool to help you understand:
› where you are
› where you want to be, and
› how you’re going to get there
56
Identify Gaps and QI Opportunities Determine who will review data and how often
Identify how the data will be used to improve the organization
Select areas in need of improvement to monitor based on established threshold compared to organization performance
57
Data Considerations Integrity: Veterans Affairs medical appointment
wait-time targets and ill-structured incentives
Measurement is useless unless you find ways to improve
Data can help you make better decisions and take smarter actions
Users need data in a format that they can use
58
What’s Your Vision? What data do you need to help you achieve
that vision?
Your mission?
59

Questions?
60

Contact
Frank Barber, MBA, MHA, RHIA
Quality Improvement Consultant
TMF Health Quality Institute
512-565-0711
http://TMFQIN.org
61
This material was prepared by TMF Health Quality Institute, the Medicare Quality Innovation Network Quality Improvement Organization, under contract with the Centers for Medicare & Medicaid Services (CMS), an agency of the U.S. Department of Health and Human Services. The contents do not necessarily reflect CMS policy. 11SOW-QINQIO-C2-15-58