new trends in tracking research output, collaboration and
TRANSCRIPT
Purdue UniversityPurdue e-Pubs
Proceedings of the IATUL Conferences 2013 IATUL Proceedings
New trends in tracking research output,collaboration and performanceMelissa BadenhorstWorldwide Information Services, [email protected]
Philip J. PurnellThomson Reuters
This document has been made available through Purdue e-Pubs, a service of the Purdue University Libraries. Please contact [email protected] foradditional information.
Melissa Badenhorst and Philip J. Purnell, "New trends in tracking research output, collaboration and performance." Proceedings of theIATUL Conferences. Paper 38.http://docs.lib.purdue.edu/iatul/2013/papers/38
brought to you by COREView metadata, citation and similar papers at core.ac.uk
provided by Purdue E-Pubs
New trends in tracking research output, collaboration and performance
PHILIP J PURNELL 1
AND MELISSA BADENHORST 2
1Thomson Reuters, Provenza 398, Barcelona, Spain
2WorldWide Information Services, South Africa
Abstract
The unprecedented volume of research output combined with fierce competition for
grant funding and the implications of successful awards has emphasised the
importance of careful analysis of research data. Especially in today’s economic climate,
strategists and policy makers are under pressure to show the impact of funded
research and to justify their decisions by demonstrating the return on investment of
specific projects, researchers and their institutions. This requires a significant objective
component to research evaluation using a variety of selected indicators and
comparisons against national, regional or global benchmarks. This paper will take a
practical approach using case studies to give an insight into the opportunities and
challenges regarding the monitoring of research trends, collaboration networks and
resolving issues surrounding author ambiguity.
Introduction
The challenges faced by the research community are multiple and complex. Some of
these are not new but they are becoming more prominent. More numerous and better
trained and equipped researchers are competing for funding grants that are struggling
to keep pace. Funders of research are anxious to demonstrate high performance to
groups such as prospective students, academic and research staff, collaborators and
investors. Most research institutions now have public relations personnel, take out
advertisements, publish journals and run recruitment events and community outreach
programmes. These groups require a variety of statistics to support their message and
the more objective the better. Citations to published work are widely accepted as an
indication of the influence of that research and citation analysis has become one of the
key methods used to evaluate research.
It is important to note that the result of any statistical analysis is limited by the quality of
the data used to conduct the evaluation. It is therefore imperative to use papers and
citations that are of comparable value in order to maximise the reliability of any
comparison. Thomson Reuters’ Web of Science (formerly ISI) has been subject to
consistent editorial policy over 40 years applying a stringent selection data designed to
focus on the most relevant and influential research published in each field of research.
All the journals indexed in the Web of Science have met the common minimum
standard described by a series of evaluation criteria. Regardless where the journal
originates from whether it's open source or from different regional territories, once a
journal is selected to be indexed, every subsequent edition of that journal will be
indexed including every single paper, every author and every address affiliation, thus
ensuring consistent, reliable and quality data appropriate for use in citation analysis.
In evaluating the citation impact of an individual paper there are many factors that
influence the results including the year the paper was published, the document type of
the paper, the subject area and the journal in which it was published. In order to level
the playing field and compare papers from different researchers or departments, these
variables should be normalised. For each published paper, it is possible to calculate an
expected (mean) citation value based on its document type, publication year and
subject category (or even journal). Then, for each published item, the actual Times
Cited may be compared with its expected rate.
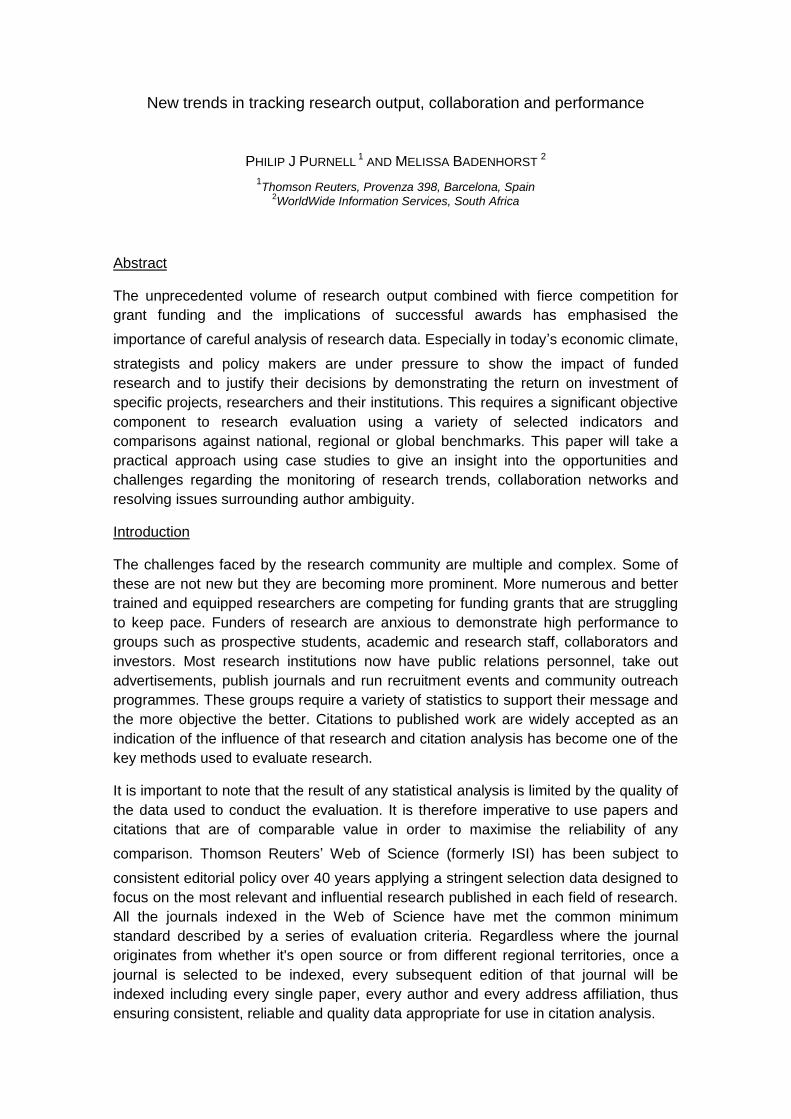
In the example below the paper has received 50 citations which instinctively might
sound how but if it is high then it is useful to know how high. The second column shows
the Journal Expected Citations is 5.94 which is the average citation rate for all papers
published in the same journal, publication year and of the same document type. The
Journal Actual/Expected Citations is therefore 50 / 5.94 = 8.42 i.e. this paper has been
cited 8.42 times the average article published in this journal in 2001.
Comparing the paper within the wider subject category using the corresponding
indicators shows the Category Expected Citations to be 8.64 which is the average
citation rate for all papers of this document type in the same subject category and
publication year. The Category Actual/Expected Citations shows that this paper has
been cited 5.79 times the average article published in the subject category Veterinary
Sciences in 2001.
The fact that the citation counts of individual Web of Science papers can be normalised
in this way, means that they are compared with global benchmarks reflecting the
citation behaviour specific to the characteristics of certain fields, ages and document
types.
Table 1. Normalised citation indicators for an individual article
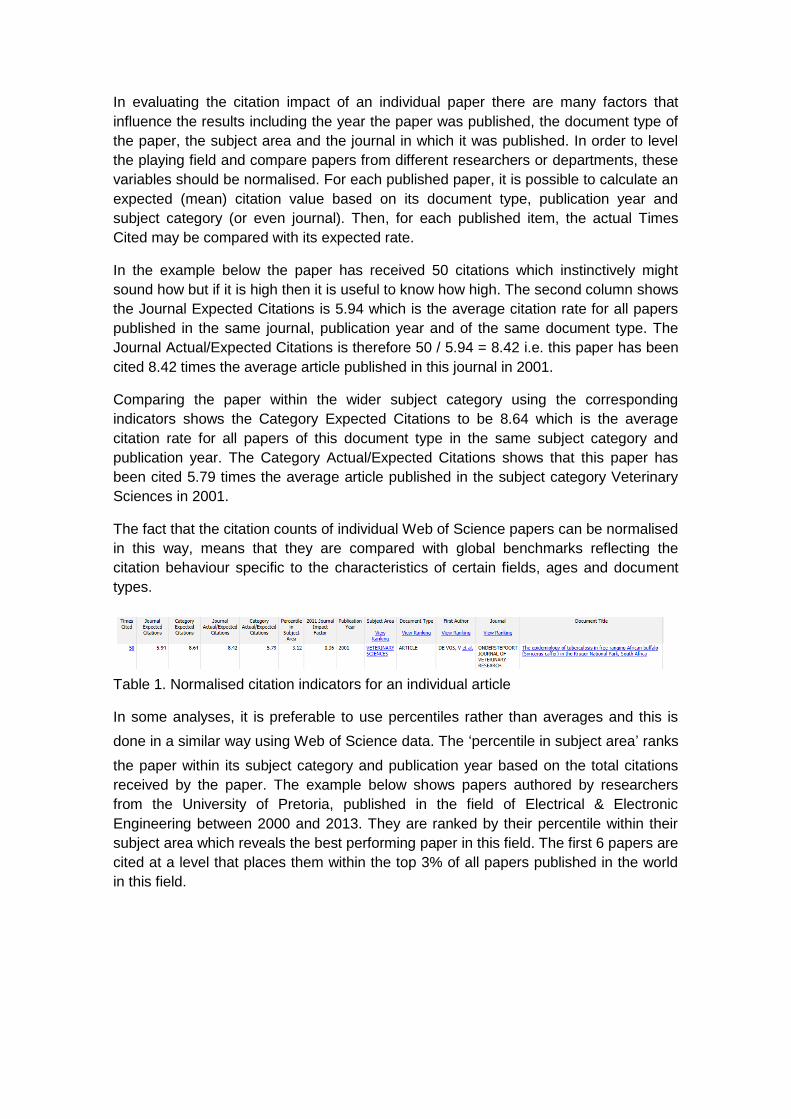
In some analyses, it is preferable to use percentiles rather than averages and this is
done in a similar way using Web of Science data. The ‘percentile in subject area’ ranks
the paper within its subject category and publication year based on the total citations
received by the paper. The example below shows papers authored by researchers
from the University of Pretoria, published in the field of Electrical & Electronic
Engineering between 2000 and 2013. They are ranked by their percentile within their
subject area which reveals the best performing paper in this field. The first 6 papers are
cited at a level that places them within the top 3% of all papers published in the world
in this field.
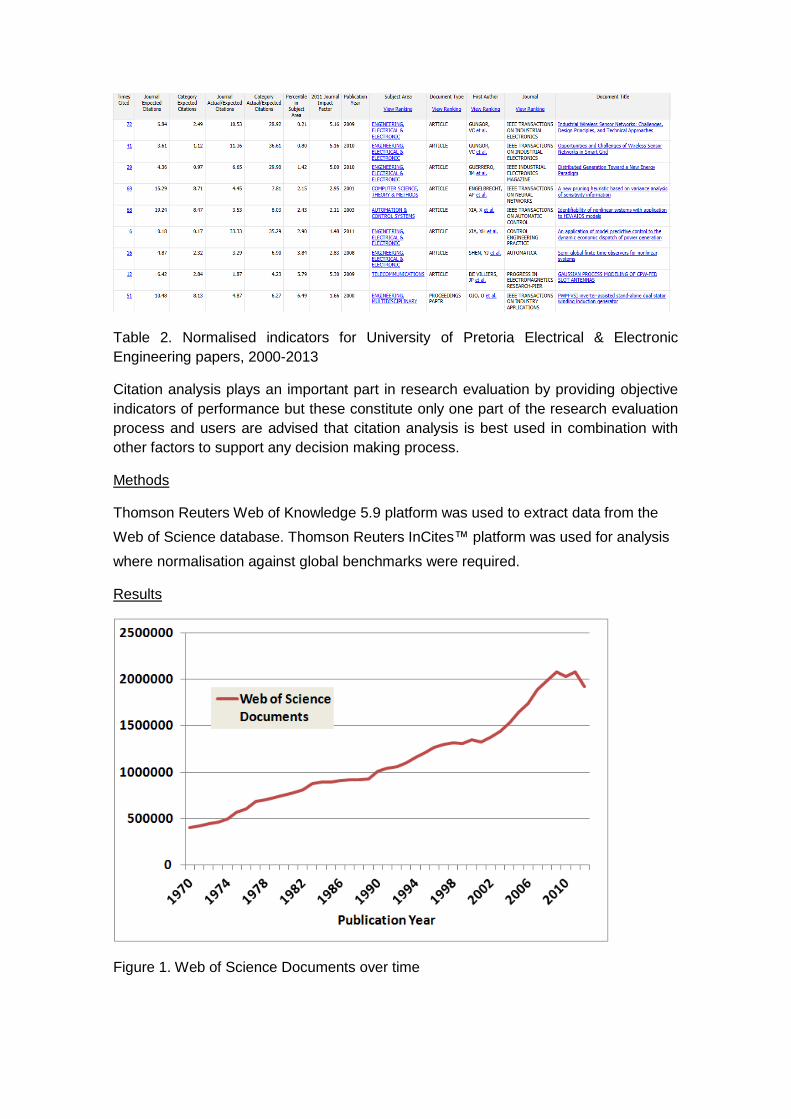
Table 2. Normalised indicators for University of Pretoria Electrical & Electronic
Engineering papers, 2000-2013
Citation analysis plays an important part in research evaluation by providing objective
indicators of performance but these constitute only one part of the research evaluation
process and users are advised that citation analysis is best used in combination with
other factors to support any decision making process.
Methods
Thomson Reuters Web of Knowledge 5.9 platform was used to extract data from the
Web of Science database. Thomson Reuters InCites™ platform was used for analysis
where normalisation against global benchmarks were required.
Results
Figure 1. Web of Science Documents over time
This graph shows the number of documents indexed in Web of Science since 1970. In
the year 1970 there were 405,434 records indexed whereas since 2009, more than 2
million records have been indexed each year, almost a five-fold increase.
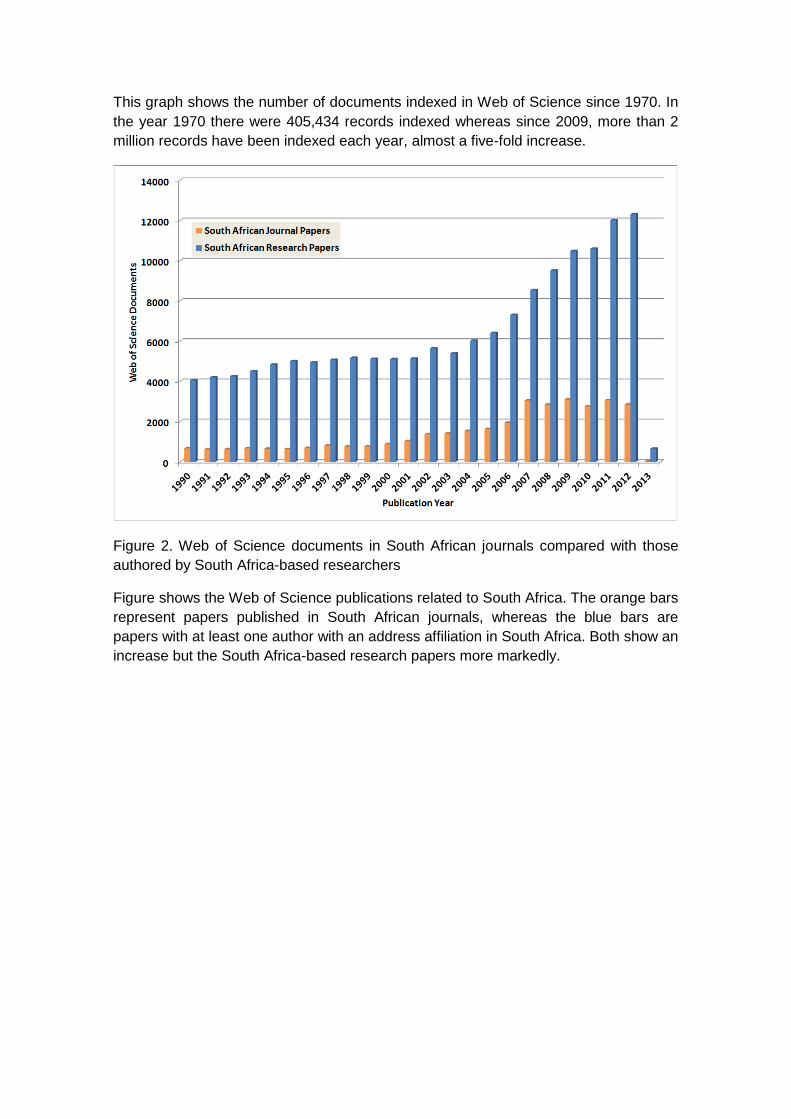
Figure 2. Web of Science documents in South African journals compared with those
authored by South Africa-based researchers
Figure shows the Web of Science publications related to South Africa. The orange bars
represent papers published in South African journals, whereas the blue bars are
papers with at least one author with an address affiliation in South Africa. Both show an
increase but the South Africa-based research papers more markedly.
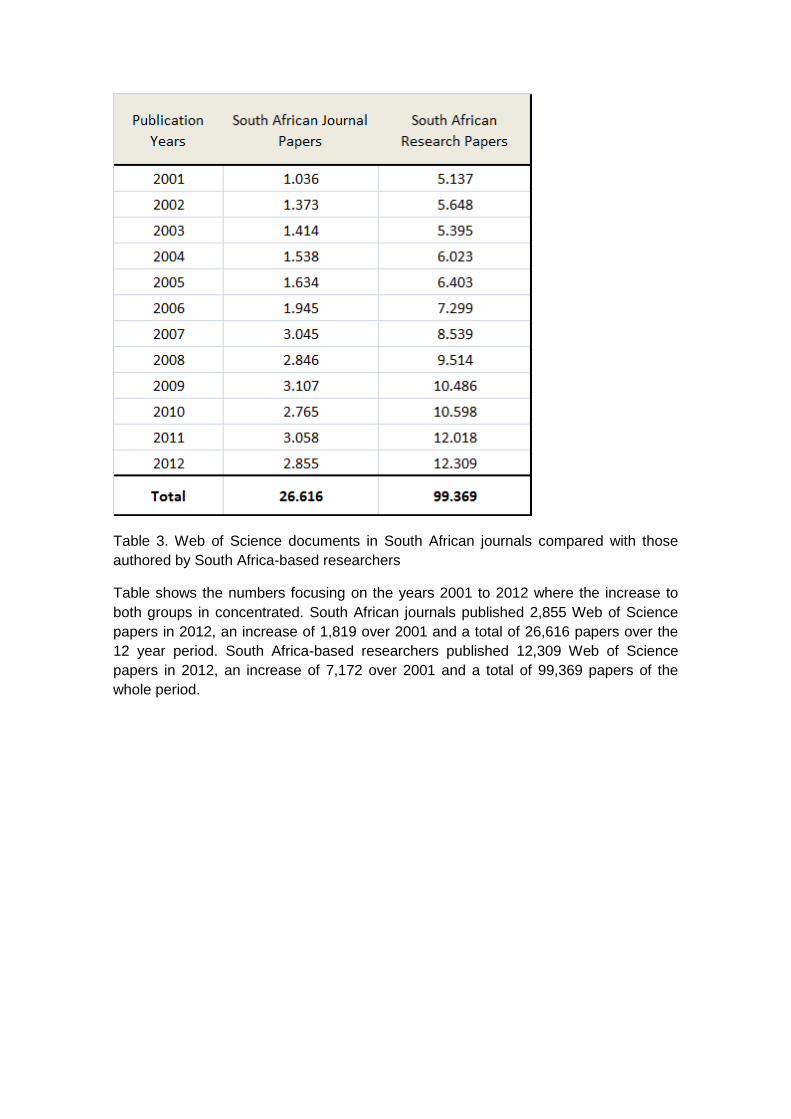
Table 3. Web of Science documents in South African journals compared with those
authored by South Africa-based researchers
Table shows the numbers focusing on the years 2001 to 2012 where the increase to
both groups in concentrated. South African journals published 2,855 Web of Science
papers in 2012, an increase of 1,819 over 2001 and a total of 26,616 papers over the
12 year period. South Africa-based researchers published 12,309 Web of Science
papers in 2012, an increase of 7,172 over 2001 and a total of 99,369 papers of the
whole period.
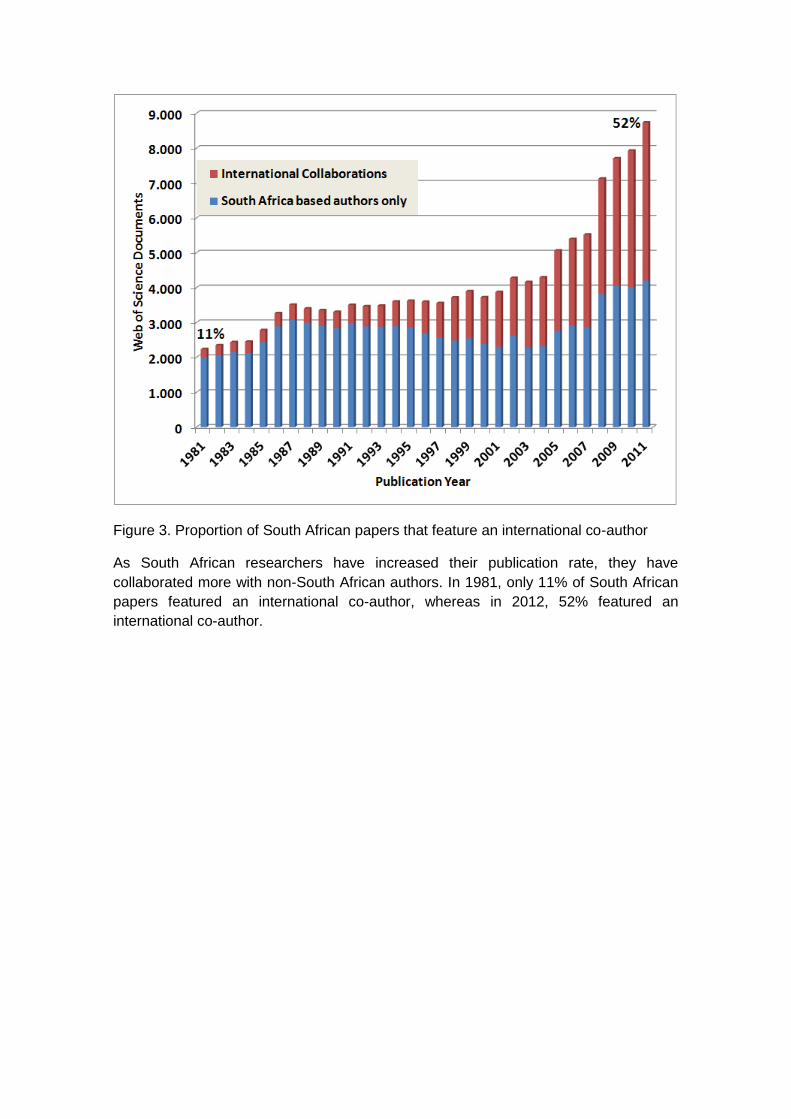
Figure 3. Proportion of South African papers that feature an international co-author
As South African researchers have increased their publication rate, they have
collaborated more with non-South African authors. In 1981, only 11% of South African
papers featured an international co-author, whereas in 2012, 52% featured an
international co-author.
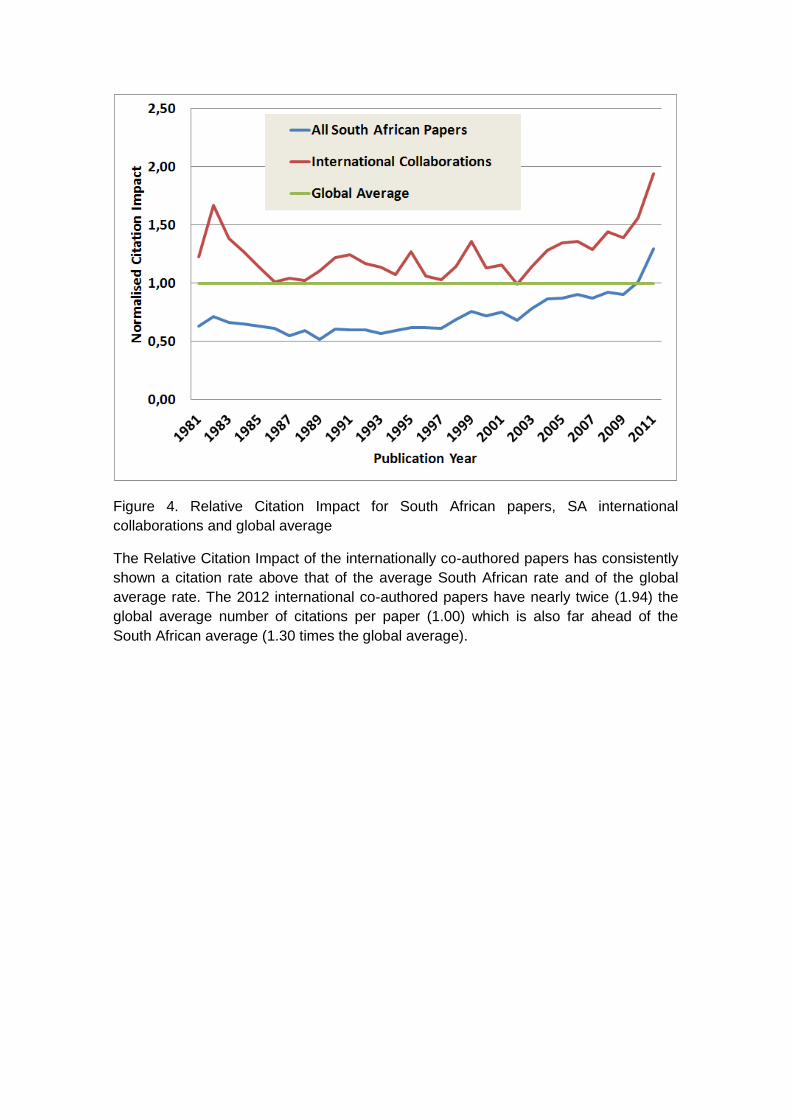
Figure 4. Relative Citation Impact for South African papers, SA international
collaborations and global average
The Relative Citation Impact of the internationally co-authored papers has consistently
shown a citation rate above that of the average South African rate and of the global
average rate. The 2012 international co-authored papers have nearly twice (1.94) the
global average number of citations per paper (1.00) which is also far ahead of the
South African average (1.30 times the global average).
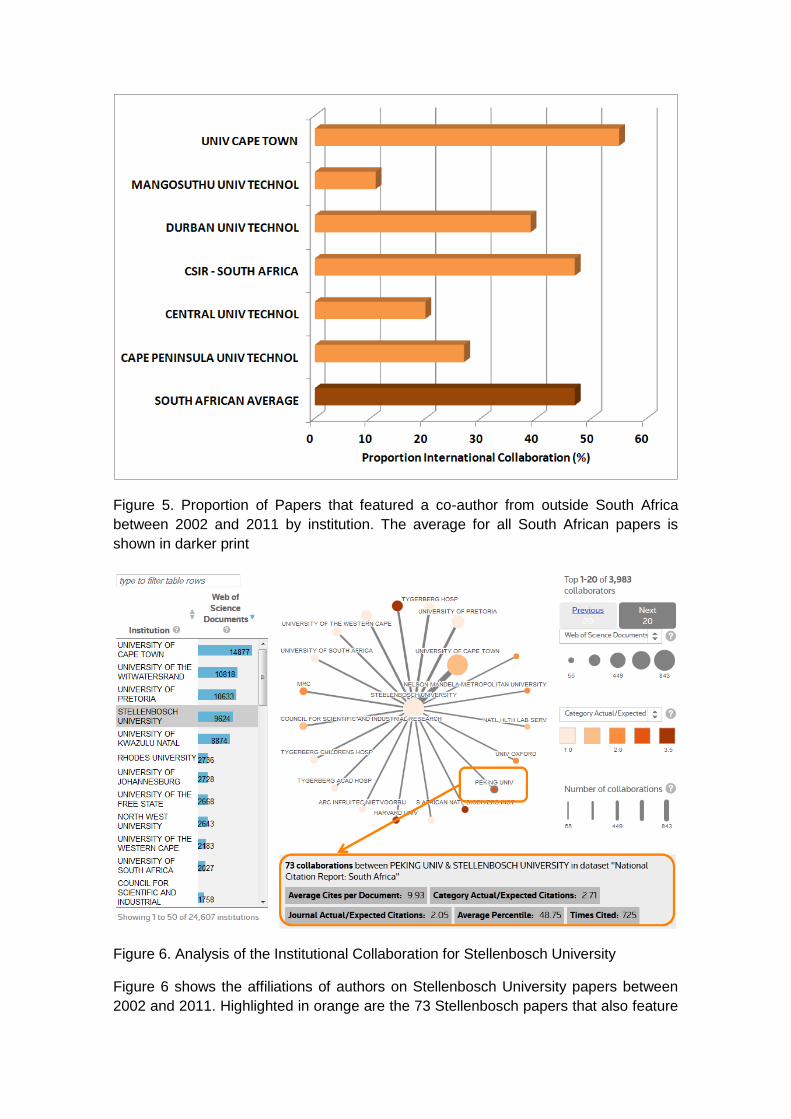
Figure 5. Proportion of Papers that featured a co-author from outside South Africa
between 2002 and 2011 by institution. The average for all South African papers is
shown in darker print
Figure 6. Analysis of the Institutional Collaboration for Stellenbosch University
Figure 6 shows the affiliations of authors on Stellenbosch University papers between
2002 and 2011. Highlighted in orange are the 73 Stellenbosch papers that also feature
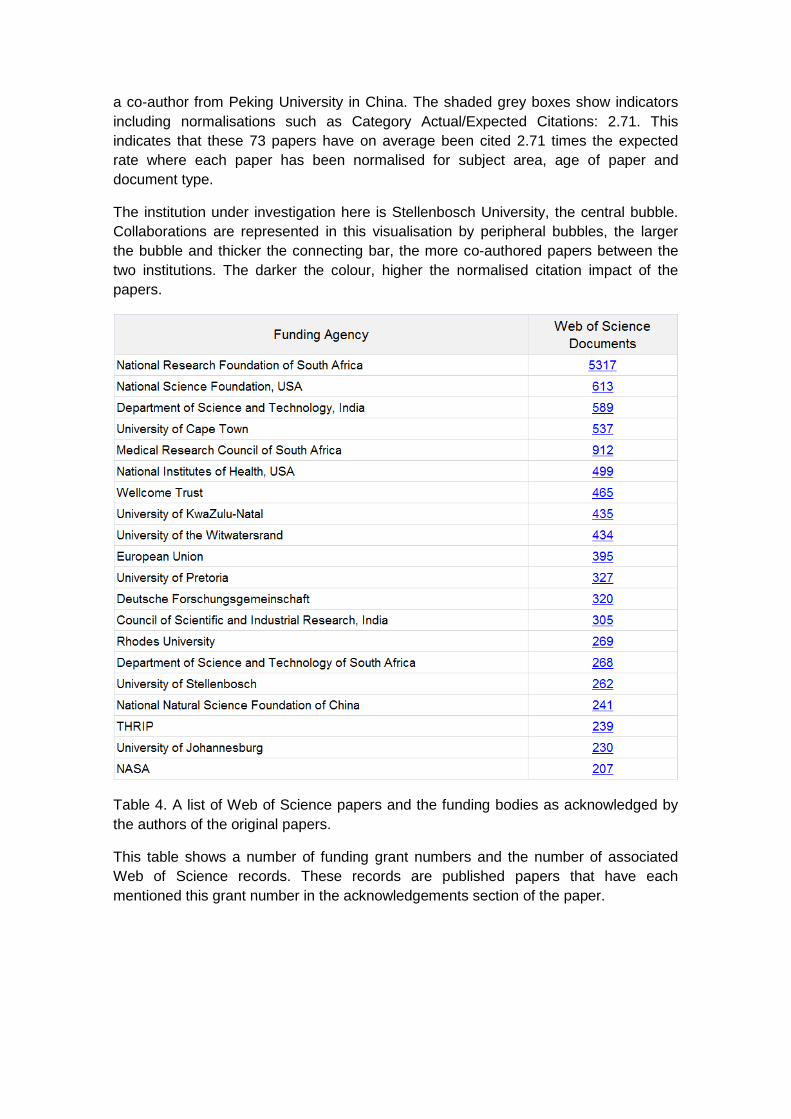
a co-author from Peking University in China. The shaded grey boxes show indicators
including normalisations such as Category Actual/Expected Citations: 2.71. This
indicates that these 73 papers have on average been cited 2.71 times the expected
rate where each paper has been normalised for subject area, age of paper and
document type.
The institution under investigation here is Stellenbosch University, the central bubble.
Collaborations are represented in this visualisation by peripheral bubbles, the larger
the bubble and thicker the connecting bar, the more co-authored papers between the
two institutions. The darker the colour, higher the normalised citation impact of the
papers.
Table 4. A list of Web of Science papers and the funding bodies as acknowledged by
the authors of the original papers.
This table shows a number of funding grant numbers and the number of associated
Web of Science records. These records are published papers that have each
mentioned this grant number in the acknowledgements section of the paper.
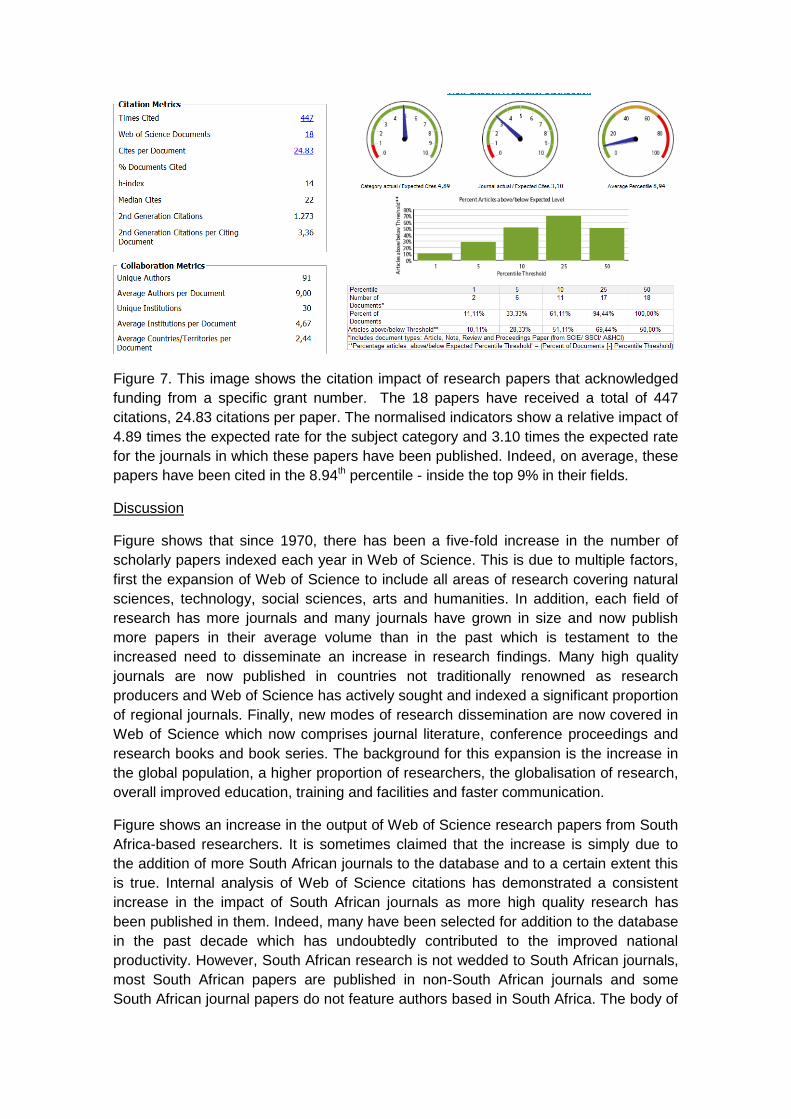
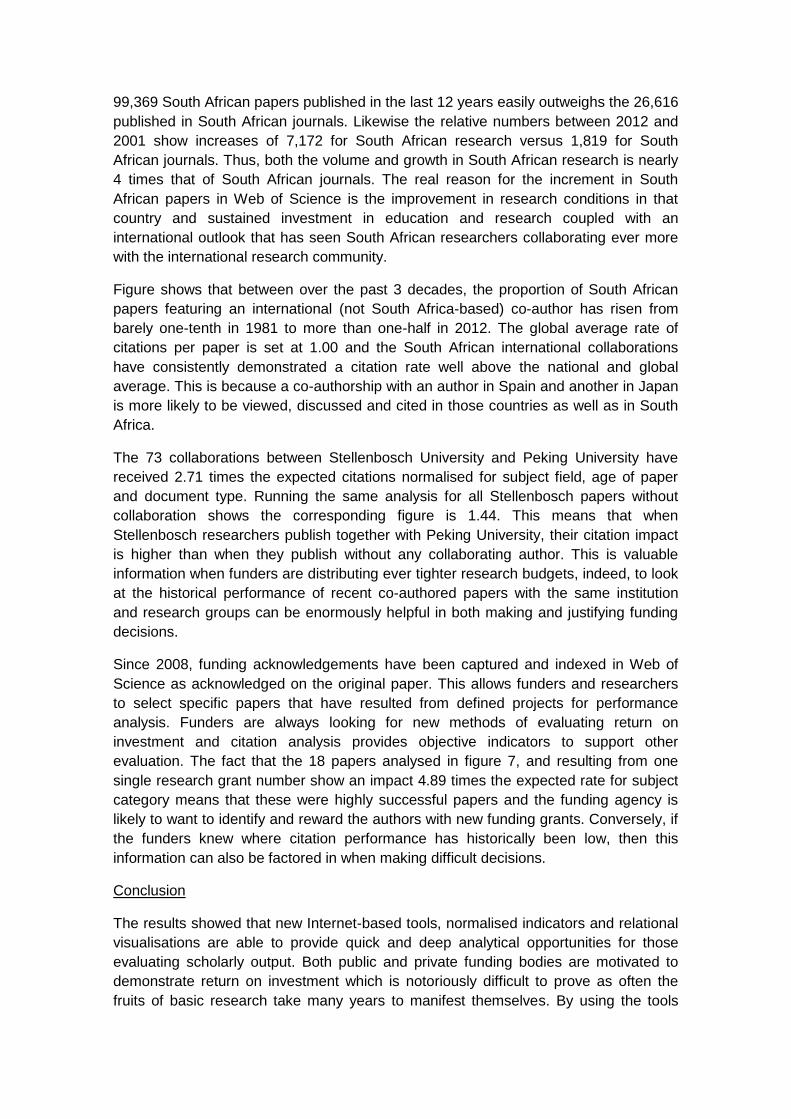
Figure 7. This image shows the citation impact of research papers that acknowledged
funding from a specific grant number. The 18 papers have received a total of 447
citations, 24.83 citations per paper. The normalised indicators show a relative impact of
4.89 times the expected rate for the subject category and 3.10 times the expected rate
for the journals in which these papers have been published. Indeed, on average, these
papers have been cited in the 8.94th percentile - inside the top 9% in their fields.
Discussion
Figure shows that since 1970, there has been a five-fold increase in the number of
scholarly papers indexed each year in Web of Science. This is due to multiple factors,
first the expansion of Web of Science to include all areas of research covering natural
sciences, technology, social sciences, arts and humanities. In addition, each field of
research has more journals and many journals have grown in size and now publish
more papers in their average volume than in the past which is testament to the
increased need to disseminate an increase in research findings. Many high quality
journals are now published in countries not traditionally renowned as research
producers and Web of Science has actively sought and indexed a significant proportion
of regional journals. Finally, new modes of research dissemination are now covered in
Web of Science which now comprises journal literature, conference proceedings and
research books and book series. The background for this expansion is the increase in
the global population, a higher proportion of researchers, the globalisation of research,
overall improved education, training and facilities and faster communication.
Figure shows an increase in the output of Web of Science research papers from South
Africa-based researchers. It is sometimes claimed that the increase is simply due to
the addition of more South African journals to the database and to a certain extent this
is true. Internal analysis of Web of Science citations has demonstrated a consistent
increase in the impact of South African journals as more high quality research has
been published in them. Indeed, many have been selected for addition to the database
in the past decade which has undoubtedly contributed to the improved national
productivity. However, South African research is not wedded to South African journals,
most South African papers are published in non-South African journals and some
South African journal papers do not feature authors based in South Africa. The body of
99,369 South African papers published in the last 12 years easily outweighs the 26,616
published in South African journals. Likewise the relative numbers between 2012 and
2001 show increases of 7,172 for South African research versus 1,819 for South
African journals. Thus, both the volume and growth in South African research is nearly
4 times that of South African journals. The real reason for the increment in South
African papers in Web of Science is the improvement in research conditions in that
country and sustained investment in education and research coupled with an
international outlook that has seen South African researchers collaborating ever more
with the international research community.
Figure shows that between over the past 3 decades, the proportion of South African
papers featuring an international (not South Africa-based) co-author has risen from
barely one-tenth in 1981 to more than one-half in 2012. The global average rate of
citations per paper is set at 1.00 and the South African international collaborations
have consistently demonstrated a citation rate well above the national and global
average. This is because a co-authorship with an author in Spain and another in Japan
is more likely to be viewed, discussed and cited in those countries as well as in South
Africa.
The 73 collaborations between Stellenbosch University and Peking University have
received 2.71 times the expected citations normalised for subject field, age of paper
and document type. Running the same analysis for all Stellenbosch papers without
collaboration shows the corresponding figure is 1.44. This means that when
Stellenbosch researchers publish together with Peking University, their citation impact
is higher than when they publish without any collaborating author. This is valuable
information when funders are distributing ever tighter research budgets, indeed, to look
at the historical performance of recent co-authored papers with the same institution
and research groups can be enormously helpful in both making and justifying funding
decisions.
Since 2008, funding acknowledgements have been captured and indexed in Web of
Science as acknowledged on the original paper. This allows funders and researchers
to select specific papers that have resulted from defined projects for performance
analysis. Funders are always looking for new methods of evaluating return on
investment and citation analysis provides objective indicators to support other
evaluation. The fact that the 18 papers analysed in figure 7, and resulting from one
single research grant number show an impact 4.89 times the expected rate for subject
category means that these were highly successful papers and the funding agency is
likely to want to identify and reward the authors with new funding grants. Conversely, if
the funders knew where citation performance has historically been low, then this
information can also be factored in when making difficult decisions.
Conclusion
The results showed that new Internet-based tools, normalised indicators and relational
visualisations are able to provide quick and deep analytical opportunities for those
evaluating scholarly output. Both public and private funding bodies are motivated to
demonstrate return on investment which is notoriously difficult to prove as often the
fruits of basic research take many years to manifest themselves. By using the tools
presented here, funders, scientometricians and others can gain an insight into the
output and performance of academic publications over a range of aggregations
including but not limited to researchers, projects, departments, journals, institutions and
countries. The next step is to link to performance of academic publications with other
outputs such as patents and products and then to outcomes in society.
References
1. InCites™, Thomson Reuters (2013). Report Created:Feb, 2013 Data
Processed Dec 17, 2012 Data Source: Web of Science ®