new vision of engineering economy course (vision) module 3 lecture 7 cairo, 17 july 2005
TRANSCRIPT

NEW VISION OF ENGINEERING ECONOMY
COURSE (VISION)
MODULE 3
LECTURE 7 Cairo, 17 July 2005

JULY 2005 TEI OF PIRAEUS 2
Case Studies - 2
Objective: • Application of the NPV and IRR method• Evaluation of a hydro-power station• Effect of environmental parameters on
an energy investment implementation• Comparative assessment of a nuclear
and a RES-based power station

JULY 2005 TEI OF PIRAEUS 3
Problem Statement
(1)What?
Where?
Why?
How big?
in Greece
a small hydro power
plant
(scale economy,funding)
for a private investment

JULY 2005 TEI OF PIRAEUS 4
Problem Statement (2)

JULY 2005 TEI OF PIRAEUS 5
Initial CostREDUCED COST OF SMALL HYDRO POWER STATIONS
0
500
1000
1500
2000
2500
3000
3500
4000
4500
0 25 50 75 100 125 150
HYDRO-TURBINE HEAD (m)
Red
uced
Cos
t (E
uro/
kW)
50kW500kW1000kW5000kW10000kWLocal Market MiniLocal Market MicroLocal Market Small

JULY 2005 TEI OF PIRAEUS 6
Annual RevenuesAnnual Energy Yield Tsimovo Station
0
10000
20000
30000
40000
50000
60000
70000
80000
1962 1963 1964 1965 1966 1967 1968 1969 1970 1971 1972 1973 1974 1975 1976 1977 1978 1979 1980
Year
Ene
rgy
(MW
h)

JULY 2005 TEI OF PIRAEUS 7
Viability Analysis-IRR Prediction(1)
Small Hydro Power Station Viability Analysis (IRR=10.0%)
-1
-0,5
0
0,5
1
1,5
2
0 2 4 6 8 10 12 14 16 18 20
Years of Operation
NP
V
Initial Capital
Fixed M&O Cost
Variable M&O Cost
Tax Impact
Investment Revenues
Residual Value
Net Present Value

JULY 2005 TEI OF PIRAEUS 8
Viability Analysis-IRR Prediction(2)
Small Hydro Power Station Viability Analysis (IRR=21.12%)
-0,8
-0,6
-0,4
-0,2
0,0
0,2
0,4
0,6
0,8
1,0
0 2 4 6 8 10 12 14 16 18 20
Years of Operation
NP
V
Initial Capital
Fixed M&O Cost
Variable M&O Cost
Tax Impact
Investment Revenues
Residual Value
Net Present Value

JULY 2005 TEI OF PIRAEUS 9
Initial Cost Impact on IRRTsimovo Small Hydro Power Station
(υ=50%, γ=40%, No=10MW,Tax Incl.)
0%
5%
10%
15%
20%
25%
30%
35%
1000 1250 1500 1750 2000
Specific Initial Cost (Euro/kW)
IRR
n=10 years
n=15 years

JULY 2005 TEI OF PIRAEUS 10
State Subsidization Impact on IRR
Tsimovo Small Hydro Power Station (υ=50%, No=10MW,Tax Incl.)
0%
5%
10%
15%
20%
25%
0 5 10 15 20 25
Years of Operation
IRR
γ=40%
γ=20%
γ=0%
γ=0%
γ=0%, No Tax-10

JULY 2005 TEI OF PIRAEUS 11
Effect of Environmental Parameters
on the Possibility of an Energy Investment
Implementation

JULY 2005 TEI OF PIRAEUS 12
Session Objective
• to Demonstrate the Environmental Impact of the Operation of Power Plants
• to Present the Social and Environmental Cost of Energy

JULY 2005 TEI OF PIRAEUS 13
Are New Power Plants Necessary ?
• The worldwide Rate of Energy Demand Increases by 4% per annum.
• The Increase is Driven by the Developing Countries and the USA.
• The Central/Northern European Countries have Almost Stabilized their Demand.
• In the Mediterranean Region this Rate Ranges Between 3-10%.

JULY 2005 TEI OF PIRAEUS 14
We Need New Power Plants in order to:
• Cover the Increased Energy Consumption
• Meet the Increased Peak Demand• Replace Old Power Plants• Exploit New Sources of Energy

JULY 2005 TEI OF PIRAEUS 15
Why do we care about Environmental Impact Assessment ?
• The Energy Plants have Major Environmental Impacts
• Public Reaction to an Investment can Cancel its Realization
• Strict / Complicated Environmental Legislation
• Pollution Control Leads to Savings in Energy and Materials through better Management
• Environmentally Friendly Projects are a Potential Subsidization Source

JULY 2005 TEI OF PIRAEUS 16
Environmental Indicators
Sectors of theEnvironmental Impact Assessment:
• Natural Resources Exploitation
• Pollution
• Environmental Hazards or Disturbance

JULY 2005 TEI OF PIRAEUS 17
Natural Resources ExploitationRenewable Energy SourcesPrecipitationsSolar RadiationWindBiomass Waves
Non Renewable Energy SourcesOilCoalNatural GasNuclear Fuels

JULY 2005 TEI OF PIRAEUS 18
Pollution
Air Pollutants Emissions that cause:
• Global Warming• Ozone Layer Depletion• Aquatic and Soil Acidification• Aquatic and Soil Eutrofication• Hazards to Humans and Ecosystems
Health

JULY 2005 TEI OF PIRAEUS 19
Environmental Hazards / Disturbance
• Land usage for Buildings or Roads• Noise• Smell• Radiation

JULY 2005 TEI OF PIRAEUS 20
External Cost of Energy• Social Cost
Public Health
• Environmental CostRestoration of Natural Ecosystems
Exploitation of Natural Resources
• State SubsidiesFuel Subsidies
Auditing & Control of Environmental Parameters
JULY 2005 TEI OF PIRAEUS 21
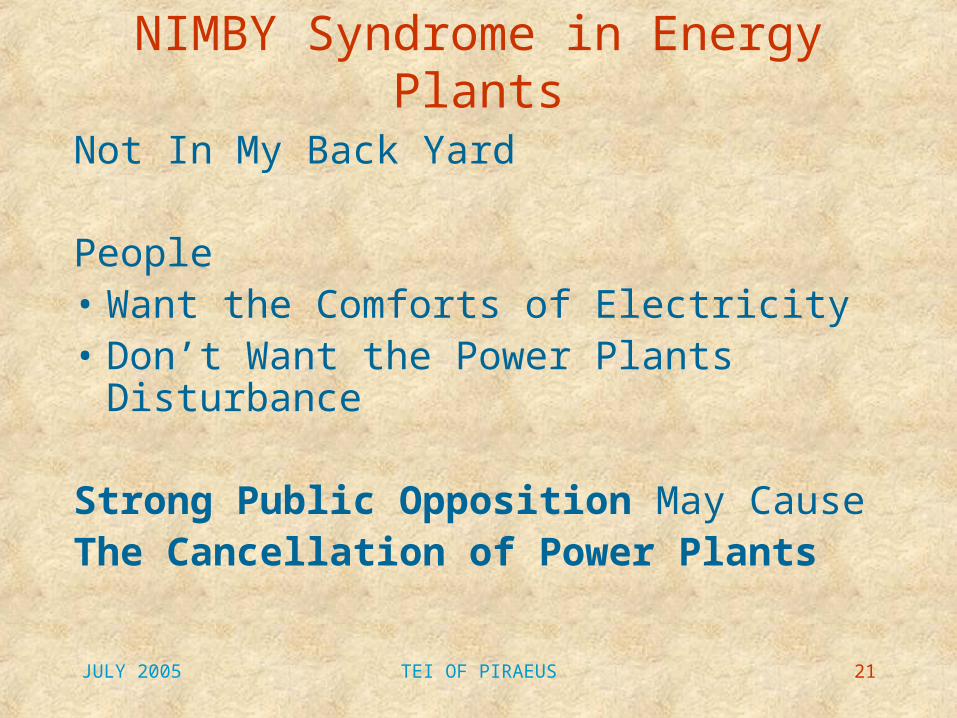
NIMBY Syndrome in Energy Plants
Not In My Back Yard
People • Want the Comforts of Electricity• Don’t Want the Power Plants
Disturbance
Strong Public Opposition May Cause
The Cancellation of Power Plants

JULY 2005 TEI OF PIRAEUS 22
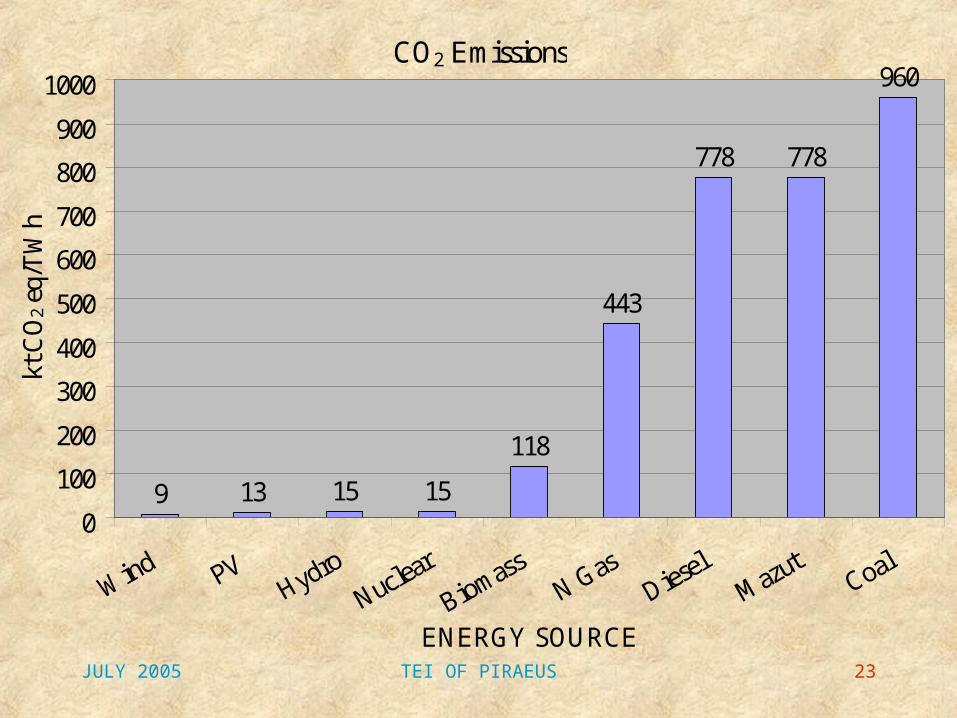
Quantitative Approach
Basic Figures Presenting Mean Values for Comparison Purposes
• Carbon Dioxide CO2
• Sulfur Dioxide SO2
• Nitrogen Oxides NOX
• Land Use
JULY 2005 TEI OF PIRAEUS 23
CO2 Emissions
9 13 15 15
118
443
778 778
960
0
100
200
300
400
500
600
700
800
900
1000
ENERGY SOURCE
kt C
O2 e
q/T
Wh

JULY 2005 TEI OF PIRAEUS 24
SO2 Emissions
3 7 24 26 69 3141285
5274
8013
0100020003000400050006000700080009000
ENERGY SOURCE
t SO
2/TW
h

JULY 2005 TEI OF PIRAEUS 25
ΝΟx Emissions
6 10 30 55
1748 21142897
5543
12371
0
2000
4000
6000
8000
10000
12000
14000
ENERGY SOURCES
t NO
x/T
Wh

JULY 2005 TEI OF PIRAEUS 26
Land Use
0,5 445
72
152
533
0
100
200
300
400
500
600
Nuclear Coal PV Wind Hydro Biomass
ENERGY SOURCE
Lan
d U
se k
m2 /T
Wh

JULY 2005 TEI OF PIRAEUS 27
Comparative Assessment of a Nuclear and a RES-based
Power Station
Case Study : Wind vs Nuclear Power Station
in the Aegean Sea Region

JULY 2005 TEI OF PIRAEUS 28
Problem Description
• Greece and Turkey are Both Fast Developing, Mediterranean countries.
• Annual Electricity Demand Growth is 4% and 10% respectively for Greece and Turkey.
• Both Countries Have to Control their Air Emissions in order to Comply to the EU Directives.
• Nuclear and RES are the possible solutions

JULY 2005 TEI OF PIRAEUS 29
Energy Consumption per Capita Time Evolution
0
0,5
1
1,5
2
2,5
3
3,5
1980 1982 1984 1986 1988 1990 1992 1994 1996 1998 2000Year
Toe
per C
apita
Greece
Turkey

JULY 2005 TEI OF PIRAEUS 30
Why RES in the Aegean Region?
• Reliable Solar Potential even in Winter• Excellent Wind Potential• High Enthalpy Geothermal fields• Decentralized Energy Generation• Independence of Imported Fuels• Significant EU Subsidization

JULY 2005 TEI OF PIRAEUS 31
Factors Against RES
• Low Energy Density (W/m2) Leads to Extended Land Use
• Seasonal and Diurnal Variation of Energy Availability Makes Imperative the Use of Large-Scaled Energy Storage Systems
• High Initial Investment Cost

JULY 2005 TEI OF PIRAEUS 32
Why Nuclear Energy ?
• Reliable Electricity Supply without Time Variation
• Relatively Low Operational Cost• High Energy Density Leads to
Limited Land Use (fuel mines excluded)

JULY 2005 TEI OF PIRAEUS 33
Factors Against Nuclear Energy
• High Initial Investment Cost (financing constraints)
• No Safe Method of Nuclear Waste Disposal• Enormous Heat Waste to the Nearby
Environment• Technology Dependence for Developing
Countries• Wide Range of Negative Consequences in
Case of Major Accidents

JULY 2005 TEI OF PIRAEUS 34
Economic Cost Comparison
11
1
11
1
1
1
)(
i
e
i
e
i
eE
FCIICc
n
o
noo
1i1
g1
1i1
g1
i1
g1ICmFC
n
on
)/( yearkWh8760NCFE oo

JULY 2005 TEI OF PIRAEUS 35
Wind Energy vs Nuclear Power Production Cost
0
0,02
0,04
0,06
0,08
0,1
0,12
0,14
4 5 6 7 8 9 10Wind Speed (m/s)
Ener
gy C
ost (
Euro
/kW
h)
Max Value
Average Value
Min Value
Nuclear Min Cost
Nuclear Max Cost

JULY 2005 TEI OF PIRAEUS 36
Social Cost Comparison
NUCLEAR ENERGY• Accident Risk Cost
Possibility ranges Between
1 / 2000 – 20000 operational years
Total distraction of the Natural Environment in a very wide Distance
• Normal Operation CostMinor Radiation Releases
Not Safe Final Disposition of Nuclear Waste

JULY 2005 TEI OF PIRAEUS 37
Social Cost Comparison
WIND ENERGY• Noise Emissions• Long Distance Visual Impact• Extensive Land Use• Bird Mortality

JULY 2005 TEI OF PIRAEUS 38
Energy Production Cost (Social-Environmental Cost Included)
0
20
40
60
80
100
120
140
160
Fossil Fuel Nuclear Power Wind Energy Solar Energy
Energy Source
Euro
/Mw
h
max Value
Min Value

JULY 2005 TEI OF PIRAEUS 39
ConclusionsRES and NUCLEAR are Potential Solutions to: •meet Energy Demands •Control Greenhouse Gas Emissions
The Analysis made Clear that Wind Energy is Preferable:
•Environmental-Wise •Economically-Wise (under Conditions)