new vision on development of nuclear energy generation of
TRANSCRIPT

New vision on development of nuclear energy generation of Ukraine
Oleg Godun
Head of Safety Analysis and Fuel Management Department
NATIONAL NUCLEAR ENERGY GENERATING COMPANY “ENERGOATOM”
SCIENTIFIC AND TECHNICAL CENTER
Ukraine, Kiev
INPRO Dialogue Forum on Roadmaps for a Transition to Globally Sustainable Nuclear Energy System
IAEA Headquarters, Vienna, Austria 20–23 October 2015

2
RIVNE NPP
• Installed capacity - 2 835 МW
•2 Units WWER-440
•2 Units WWER-1000
KHMELNITSKY NPP
• Installed capacity - 2 000 MW
•2 Units WWER-1000
•2 Units
SOURTH-UKRAINE NPP
•Installed capacity - 3 000 MW
•3 Units WWER-1000
ZAPORIZHZHYA NPP
• Installed capacity - 6 000 MW
•6 Units WWER-1000
Nuclear energy as part of a national energy mix

Structure of electricity generation Structure of installed capacity
Hydro 10,1%
NPPs 48,7%
Thermal 41,2%
NPPs 50,2%
Thermal 37,4%
Hydro 12,4%
Structure of output to electricity market
Hydro 10,9% NPPs 26,1%
Thermal 63,0%
3
Nuclear energy as part of a national energy mix

ZAPORIZHZHYA №3 WWER-1000/320
ZAPORIZHZHYA №4 WWER-1000/320 ZAPORIZHZHYA WWER-1000/320
Khmelnitsky №1 WWER-1000/320
Rivne №3 WWER -1000/320
ZAPORIZHZHYA №6 WWER-1000/320
Khmelnitsky №2 WWER-1000/320
Rivne №4 WWER -1000/320
South-Ukraine №3 WWER-1000/320
ZAPORIZHZHYA №1 WWER-1000/320 shut down - 23.12.2015
ZAPORIZHZHYA №2 WWER-1000/320 shut down - 19.02.2016
Rivne NPP №1 WWER-440/213 shut down - 2030
South-Ukraine №1 WWER-1000/302 shut down - 2023
Rivne NPP №2 WWER-440/213 shut down - 2031
Under realization (3 Units)
Realized
(3 Units)
Life time will be completed
to 2020 (6 Units)
4
South-Ukraine №2 WWER-1000/338 shut down – 12.05.2015
Life time will be completed
after 2020 (3 Units)
In near time (9 Units)
15 Units
Nuclear energy as part of a national energy mix Life time extension

Name Type Capacity, MWe Operational Replacement to
2035 (plan)
Khmelnitsky
NPP WWER 1000 1987
WWER 1000 2004
Rivne NPP WWER 402 1980 2031
WWER 417 1981
WWER 1000 1986
WWER 1000 2004
South Ukraine
NPP WWER 1000 1982
2032
WWER 1000 1985 2035
WWER 1000 1989
Zaporizhzhya
NPP WWER 1000 1984 2034
WWER 1000 1985 2035
WWER 1000 1986
WWER 1000 1987
WWER 1000 1989
WWER 1000 1995
Total 13819
Nuclear energy as part of a national energy mix Life time extension
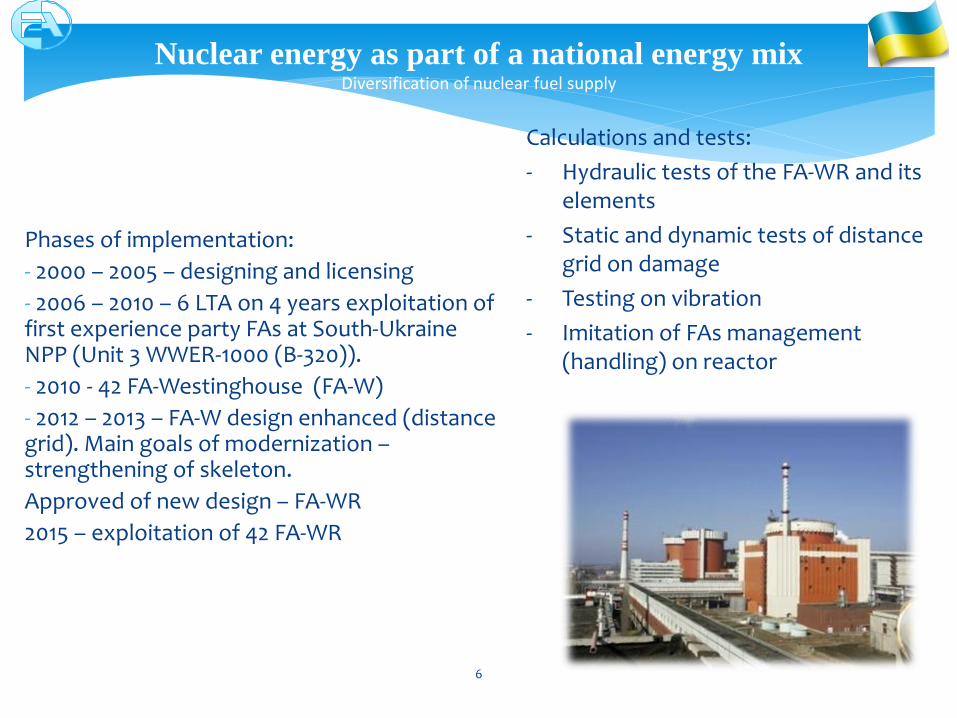
Phases of implementation:
- 2000 – 2005 – designing and licensing
- 2006 – 2010 – 6 LTA on 4 years exploitation of first experience party FAs at South-Ukraine NPP (Unit 3 WWER-1000 (B-320)).
- 2010 - 42 FA-Westinghouse (FA-W)
- 2012 – 2013 – FA-W design enhanced (distance grid). Main goals of modernization – strengthening of skeleton.
Approved of new design – FA-WR
2015 – exploitation of 42 FA-WR
6
Calculations and tests:
- Hydraulic tests of the FA-WR and its elements
- Static and dynamic tests of distance grid on damage
- Testing on vibration
- Imitation of FAs management (handling) on reactor
Nuclear energy as part of a national energy mix Diversification of nuclear fuel supply
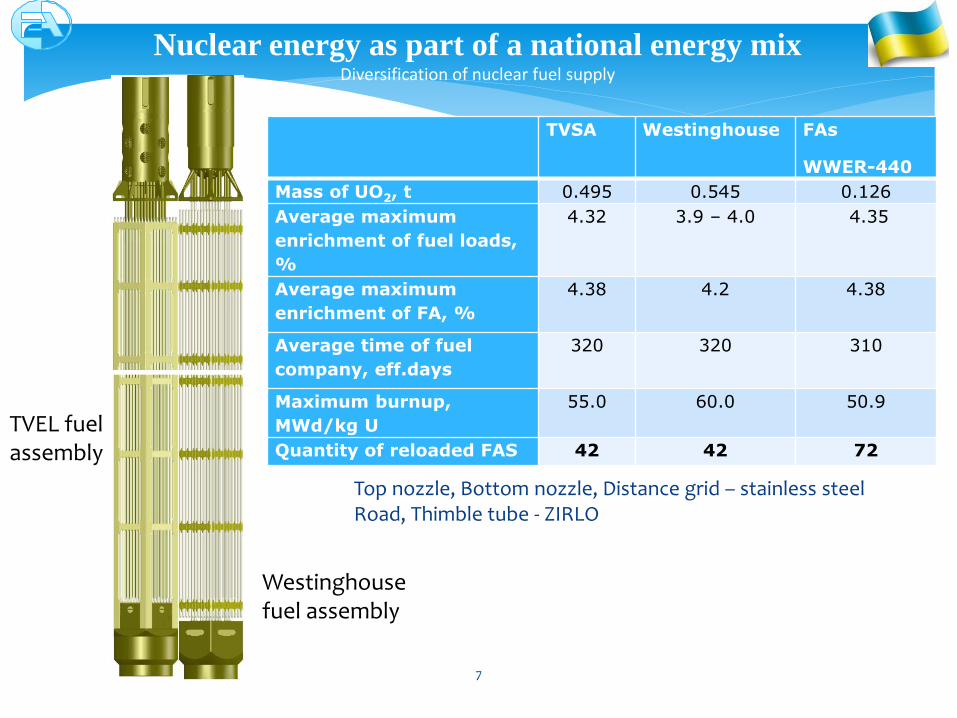
Top nozzle, Bottom nozzle, Distance grid – stainless steel Road, Thimble tube - ZIRLO
7
Westinghouse fuel assembly
TVEL fuel assembly
Nuclear energy as part of a national energy mix Diversification of nuclear fuel supply
TVSA Westinghouse FAs
WWER-440
Mass of UO2, t 0.495 0.545 0.126
Average maximum
enrichment of fuel loads,
%
4.32 3.9 – 4.0 4.35
Average maximum
enrichment of FA, %
4.38 4.2 4.38
Average time of fuel
company, eff.days
320 320 310
Maximum burnup,
MWd/kg U
55.0 60.0 50.9
Quantity of reloaded FAS 42 42 72

~ 2200 – 2400 tU ~ 2200 – 2400 tU ~ 1,5 – 1,8 mln SWU ~ 540 – 560 FAs WWER-1000 ~ 130 – 140 FAs WWER-440
~ 300 mln $ ~ 30 mln $ ~ 230 mln $ ~ 150 mln $
Total ~ 700 mln $ annual
43%
3% 37%
17%
Uranium mining and milling
Conversion Enrichment Fabrication
UF6
U3O8 F
Front-end
8
Nuclear energy as part of a national energy mix Nuclear fuel cost

Spent nuclear fuel VVER-1000 of Rivne NPP, South-Ukraine NPP and Khmelnitsky NPP (6 Units, annual - 107 tHM ) is sent for long term storage and reprocessing (before 2025) to RF. Reprocessing waste will be sent back to Ukraine. South-Ukraine NPP (1 Unit) FAs-W storage in reactor pool (reprocessing in AREVA is under consideration - 2020).
Spent nuclear fuel VVER-1000 of Zaporizhzhya NPP is being stored in dry SNF storage facility at the site of Zaporizhzhya NPP. Capacity – 380 casks. 50 years storage.
Spent nuclear fuel VVER-440 of Rivne NPP is sent for the reprocessing to RF (annual - 14.4 tHM). RAW will be obtained since 2017.
A centralized Dry SNF storage facility for spent nuclear fuel of WWER type reactors is under construction in the Chernobyl exclusion zone. The commissioning of CSNFDSF is scheduled in end of 2017. Since end of 2016 – not shipping SNF. The design capacity is 16 529 spent nuclear fuel assemblies (480 casks HI-STORM), including 12 010 spent nuclear fuel assemblies of WWER-1000 and 4 519 spent nuclear fuel assemblies of WWER-440. Time storage – 100 years.
Waste management. Waste treatment (evaporation of liquid RAW, sorting and compaction of solid RAW) is performed on-site. Facilities on deep reprocessing of RAW is under deployment. In future RAW may be transported to the “Vector” for the storage.
Nuclear energy as part of a national energy mix Spent nuclear fuel management

ZNPP SU NPP KhNPP RNPP
FP FP
FP
FP
SF storage facility at
ZNPP
On-site fuel pools (FP)
Long-term storage
(“wait and see”)
CSNFDSF: Storage period – 100 years 12 010 SFAs WWER-1000 4 519 SFAs WWER-440
SF reprocessing
Decision-making:
SF final disposal ?
2 511 SFAs WWER-1000 1 105 SFAs WWER-440
Start-up complex:
Storage period 50 years
9 120 SFAs Annual loading capacity: 504 SFAs WWER-1000 and 192 SFAs WWER-440
SE NNEGC “Energoatom”
Technological cooling and
reprocessing of SF at
enterprises of the Russian Federation
Nuclear energy as part of a national energy mix Spent nuclear fuel management

0
2 000
4 000
6 000
1990 1995 2000 2005 2010 2015
SN
F WWER-1000
WWER-440
Total annual SNF accumulation – 246.4 tHM (232 tHM of WWER-1000 and 14.4 tHM of WWER-440).
0
100
200
300
400
500
600
FAs
tHM
Year Quantity FAs
Annual tHM
1996 564 231,8 1997 450 186,6 1998 564 233,3 1999 330 136,6 2000 408 165,3 2001 264 108,6 2002 342 137,7 2003 144 57,9 2004 186 76,2 2005 132 54,2 2006 204 82,2 2007 324 130,3 2008 204 82,8 2009 0 0 2010 132 53,1 2011 144 57,9 2012 204 82,1 2013 288 117,1 2014 300 122,5 2015 300 130,5 2016 300 130,5 2017 300 130,5
Nuclear energy as part of a national energy mix Spent nuclear fuel management

Energy Strategy of Ukraine up to 2030 (approved in 2006, first strategy)
Updated Strategy of Ukraine up to 2030 (2013) – old and legal strategy
Energy Strategy of Ukraine up to 2035 (White book of Energy policy) (approve was announced up to 15 July 2015. not approved)
New energy strategy of Ukraine: safety, energy efficiency, competition
(under consideration)
Nuclear energy scenario and strategy

Goals Energy sufficiency to 2035 (in case of natural gas mining realization, energy safe technology development and deep energy resource diversification) no more then 30% from one supplier energy intensity decreasing from 0,35 to 0,12 t o.е./$1000
Gas gas consumption decreasing from 34,8% in 2012 to 28% in 2025 (2013 – 50 billn m3, 40 billn m3 in 2015) 40 billn m3/year = 20 billn m3/year DOMESTIC + 20 billn m3/year IMPORT (5 billn m3/year RF + 15 billn m3/year from Slovak, Poland, Hungary) Coal 5% share decreasing in 2020 comparison to 2012 due to increase renewable and nuclear. Renewable From 2% to 5.2% increasing share in 2020 and to 20% in 2035 due to decreasing of gas and coal consumption Nuclear nuclear generation is the basis of energy structure 46 – 50% share in electricity generation with load factor 78% diversification of nuclear fuel supply for 3 Units (3*42 Westinghouse FAs annual reloading) construction of 2 new nuclear units on Khmelnitsky NPP fuel fabrication plant Centralize of Dry Storage Facility new nuclear units after 2030 according to requirements of IAEA and Euroatom connect to ENTSO-E
Nuclear energy scenario and strategy

Energy intension of Ukraine
(Key World Energy Statistics 2013, МЕА) Consumption of initial resource in 2012 and 2020, %
Electricity generation in 2012 and 2020, %
Nuclear energy scenario and strategy

Comparison of scenarios of different strategies
Strategy 2006 Update Strategy 2013 Update Strategy
2015
New Scenario
2006 2030 base
2030 min
2030 base
2030 high
2030 2030
GDP, billion.$ 83
257
306
390
518
356.7
-
Total electricity installed
capacity, GW
52
88.5 56,7 65,5 73,8
66.8
-
Part of NPPs in total installed
capacity, %
26 33.3 28 27 25.4 27 27
Part of NPPs in total
electr.generation, %
47.9 52.1 50 48.8 46.3 50 50
Total electr.generation,
billion kWh
185.2 420.1 234 272 304 276,3 245
Total installed capacity
NPPS, GW
13.8 29.5 15,8 17,8 18,8 18.0 15.8
Life time extension, years 15 20
Electricity generation by NPPs in
2006
88.8
NPPs electricity generation
scenarios in 2030, billion kWh
219.0 118 133 141 126,0 122,0
Nuclear energy scenario and strategy

Electricity demand prognosis to 2100, billn kWh
Population prognosis UNO, mln people
0
1000
2000
3000
4000
5000
6000
7000
1990 2000 2010 2020 2030 2040 2050 2060 2070 2080 2090 2100
Ukraine
non-OECDEurope/Eurasia
OECD Europe
Relative electricity demand, kWh
Nuclear energy scenario and strategy

2015 2017
SNF shipping to RF up to
2016
ZNPP_SNFDSF (time storage to 2051)
2025 2035 2050
Long term storage
CSNFDSF
FP return
Storage
Disposal
Burn in HWR
Life time
extension
SNF GD
Reprosessing
NPPs
2018 2020 2040 2100
Reprocessing
Nuclear energy scenario and strategy
Disposal

NFC element
Cost
Natural uranium capacity (deposit)
500 000 tHM
Conversion
10 USD/kg
Enrichment 130 USD/SWU
Fabrication
300 USD/kgHM - LWR 1500 USD/kgHM MOX 200 USD/kgHM – ReU HWR
Reprocessing 2 000 USD/kgHM
Dry storage 300 USD/kgHM UOX - LWR, MOX – LWR, ReU
Geological disposal
1000 USD/kgHM
Capital cost 5000 USD/kWe - LWR 4500 USD/kWe – HWR
Nuclear energy scenario and strategy
Type of NPP: LWR 1000-1200 MW, HWR – 730 MW NPPs life time LWR: 20 years extension – old, 60 years – new NPPs life time HWR: 30 years Number of reloaded FAs LWR: 42 (4 years fuel cycle) Dry storage VVER-1000 (380 casks). No expanded. Time storage – 50 years CDSF LWR since 2018 (480 casks). Can be expanded Geological disposal: after 2035 No differences between TVSA and FAs Westinghouse

Open Nuclear Fuel Cycles max base min

Open Nuclear Fuel Cycle and GD max base min

Partially Closed Open Nuclear Fuel Cycle and ReU max base min

1. The results are preliminary (trends).
2. Up to 2040:
- 120 TWh for all NFC scenarios electricity production from nuclear power plants will exceed
- until 2025 – build Khmelnitsky Unit 3-4 (type LWR-1000, 2 GW)
- between 2030 and 2040 for a 50% share must be commissioned 11 GWe of new units;
- will be accumulated SNF 8 000 tHM (6 000 tHM must be removed in CSNFDSF)
- CSNFDSF-2 commissioned
- in the case of reprocessing since 2025 the 1 GW HWR is rational for build up to 2030. 20 tHM of Pu have been accumulated
- in the case of geological disposal - since to 2035 will need GD capacity of 4 000 tHM
Nuclear Fuel Cycles Trends

3. In the period from 2040 by 2060
- For all the nuclear fuel cycle production of electricity from nuclear power plants will be 90 TWh
- 2 GWe LWR and 1 GWe HWR will be commissioned
- the accumulation of spent nuclear fuel - up to 13 000 tHM (3876 tHM – Z_SNFDSF)
- in the case of reprocessing since 2025 (100 tHM/y) all SNF which was shipped on RF shall be reprocessed. have been accumulated:
- 100 tHM of Pu
- 500 tHM of FP
- in the case of geological disposal - since to 2035 will need GD capacity of 8 000 tHM
(4 000 tHM – Z_SNFDSF)
4. Up to 2100
- 25 000 tHM accumulated
- in the case of reprocessing - capacity RP 200 tHM/y, 200 tHM Pu, 1000 tHM – FP, 3 GWe commissioned (2 HWR, 1 LWR)
- in the case of geological disposal - 15 000 tHM in GD
Nuclear Fuel Cycles Trends

25
Element of
NFC
Direction of collaboration Old status New status
Front end Mining and milling 30% Ukr – 70% RF 30% Ukr – 70% (RF+Fr)
Conversion, enrichment RF RF+Fr
U-fuel assemblies fabrication (design,
fabrication plant)
RF RF + Westinghouse
Implementation of new design of FAs RF RF + Westinghouse
Requirements
RF + Ukr Ukr (RF)
Operation of
Nuclear
Reactor
Reactors RF (RF) – Westinghouse – Fr +
other
Life time extension RF Ukr - (RF) – Westinghouse –
Fr
Supply of main equipment RF + Ukr Ukr (RF) + other
Enhanced of fuel management
(economics of NFC, FAs reliability)
RF + Ukr RF + Ukr + Westinghouse
Scientific support of nuclear units
operation (nuclear safety analysis,
licensing)
RF + Ukr Ukr (RF) + other
Requirements
RF + Ukr Ukr (RF)
Back end
Long term storage USA + Fr USA + Fr
Reprocessing RF RF + Fr
Scientific support RF + Ukr RF + Fr + Westinghouse
Requirements RF + Ukr RF + Ukr
Nuclear Fuel Cycles Trends

26
Thank you for the attention!