new workers’ compensation legislation: expected ...€¦ · new workers’ compensation...
TRANSCRIPT

New Workers’ Compensation Legislation: Expected Pharmaceutical Cost
Savings
Leslie Wilson, Ph.D. Associate Adjunct Professor Health Policy and Economics University of California, San Francisco Departments of Pharmacy and Medicine Matthew Gitlin, Pharm.D. University of California, San Francisco School of Pharmacy Corresponding Author: Leslie Wilson, Ph.D. Associate Adjunct Professor Health Policy and Economics University of California, San Francisco Box 0613, Suite 420M 3333 California St. Tel: 415-502-5092, Fax: 415-502-0792, email: [email protected] Running Title: California’s New Pharmacy Fee Schedule This work was partially supported by a contract with the California Division of Workers’ Compensation and with data from CWCI.
1

Abstract
Background California Workers’ Compensation (WC) system costs are under review.
With recently approved California State Assembly Bill (AB) 749 and Senate Bill (SB)
228, an assessment of proposed pharmaceutical cost savings is needed.
Methods A large workers’ compensation database provided by the California Workers’
Compensation Institute (CWCI) and Medi-Cal pharmacy costs obtained from the State
Drug Utilization Project are utilized to compare frequency, costs and savings to Workers’
Compensation in 2002 with the new pharmacy legislation.
Results Compared to the former California Workers’ Compensation fee schedule, the
newly implemented 100% Medi-Cal fee schedule will result in savings of 29.5% with a
potential total pharmacy cost savings of $125 million. Further statistical analysis
demonstrated that a large variability in savings across drugs could not be controlled with
this drug pricing system.
Conclusions Despite the large savings in pharmaceuticals, inconsistencies between the
two pharmaceutical payment systems could lead to negative incentives and uncertainty
for long-term savings. Proposed alternative pricing systems could be considered.
However pain management implemented along with other cost containment strategies
could more effectively reduce overall drug spending in the workers’ compensation
system.
Key Words
Workers’ Compensation, California, Pharmacy, Fee Schedule, Medicaid (Medi-Cal),
Costs, Pain Medication, Drugs
2

Introduction
California is the largest workers’ compensation (WC) system in the U.S.
covering 14.7 million workers and ~20% of the U.S. market [Blay et al., 2000] .
[Williams et al., 2003] The Workers’ Compensation Insurance Rating Bureau (WCIRB),
which transacts all workers’ compensation insurance in California estimates that benefit
costs rose from $9.5 billion in 1995 to $25 billion in 2002. [WCIRB, 2003]. Rising costs
in the California Workers’ Compensation system may have been due to deregulation of
the insurance market, and a lack of legislative reforms to control costs and monitor
benefits [Miller, 2002]. To resolve some of the complexities of the system, the Margolin-
Bill Greene Workers’ Compensation Reform Act of 1989 was passed followed in 1995
by Senate Bill (SB) 30 which deregulated workers’ compensation rates. An internal
government study suggested that SB 30 deregulation was associated with many insurers
charging premiums that were 7-15% below cost to employers resulting in the liquidation
of at least twenty-five workers’ compensation insurance carriers, and placing the cost
burden on the State Compensation Insurance Fund (State Fund or SCIF) [California
Department of Insurance, 2003; Institute of Governmental Studies, 2004]. State Fund
currently handles over 50% of the California Workers’ Compensation market and writes
54% of all new policies [California Department of Insurance, 2003]. Although there
were system wide decreases in claim volume, these savings were somewhat offset by the
rising number of permanent disability cases and increasing medical costs, including
pharmacy expenses, all contributing to system wide increases in premium costs
[Neumark, 2005].
Pharmacy expenses alone in California Workers’ Compensation have risen 243%,
from $86.4 million in 1997 to $296.6 million in 2002 compared to only a 127% rise in
3

national drug spending [Braden et al., 1998; Smith et al., 2005; WCIRB, 2003]. One
reason for the high pharmacy costs according to an internal government study might be
the California Workers’ Compensation pharmacy fee schedule that was one of the most
generous workers’ compensation fee schedules in the United States [Neuhauser et al.,
2000].
Legislative Pharmacy Reforms
In February, 2002 and July, 2003 Assembly Bill (AB) 749 and Senate Bill (SB)
228 were passed in California to help contain some of the rising costs in the California
Workers’ Compensation system [Calderon, 2002; Alarcón, 2003]. State Assembly Bill
(AB) 749 required that the Administrative Director of the Division of Workers’
Compensation adopt a pharmacy fee schedule by July 1, 2003 that required generic
substitution when available, and, a single dispensing fee for brand and generic
medications, without limiting access to pharmacy services [Calderon, 2002]. In July
2003 California Senate Bill (SB) 228 required the Official Pharmaceutical Fee Schedule
to be based on a 100% of the Medi-Cal fee schedule rather than the former formulae
[Alarcón, 2003]. In order to implement AB 228 the Division of Workers’ Compensation
posted a Medi-Cal calculator on the Division of Workers’ Compensation website
triggered by each medication’s National Drug Code.
(www.dir.ca.gov/dwc/pharmfeesched/pfs.asp).
Objective
We determined the economic impact of the legislative reforms on pharmaceuticals
by recalculating the payment for selected medications under the Medi-Cal 2002
allowances. More specifically we substituted Medi-Cal amounts paid in 2002, for the
4

total workers’ compensation drug amounts paid in 2002 (prior to the legislation) for
selected medications. In this way we modeled expected savings.
Materials and Methods
Pharmaceutical Fee Schedule Equations
The former pharmaceutical fee schedule was a two-part equation comprising a
medication fee based on the Average Wholesale Price (AWP), which is a price set by the
manufacturer for pharmaceutical products, and a dispensing fee. The AWP is provided
by pharmaceutical manufacturers and published by multiple sources including First Data
Bank and Red Book [First DataBank, 2004; Cohen, 2002]. Most state workers’
compensation systems pay in the range of 90% of AWP with the exception of
Washington State (77% of AWP) and Hawaii and Idaho (102% of AWP) [Neuhauser et
al., 2000]. The dispensing fee, usually a percentage of AWP or a set rate per
prescription, is provided as compensation to the pharmacy for administrative costs related
to repackaging and claims processing, and the dispensing fee is generally higher for
workers’ compensation prescriptions then other health plans. Listed below are the
equations used to calculate payment of pharmaceuticals for both the previous system and
the newly legislated system.
The California Fee Schedule (pre-2004):
1) Generic drugs: (AWP x 1.4) + $7.50 (Dispensing Fee)
2) Brand name drugs: (AWP x 1.1) + $4.00 (Dispensing Fee)
The Medi-Cal fee schedule provides reimbursement at the lower of several calculations.
For example, the lower of:
1) Maximum Allowable Ingredient Cost (MAIC; usually calculated as a multiple of
the lowest published price) + $4.05 (Dispensing Fee) – $0.50 or
5
2) Federal Upper Limit (FUL; a negotiated value used only for generics with high
utilization) + $4.05 (Dispensing Fee) - $0.50 or
3) Estimated Acquisition Cost (EAC; usually equal to AWP * 0.90) + $4.05
(Dispensing Fee) - $0.50 (As of September 1, 2004; EAC= AWP*0.83)
4) Usual and Customary Charges
Because each drug’s Medi-Cal cost can be recalculated monthly and is based partly on
the availability of rates from contract negotiations, the rates are calculated with a
computer program and we also used the published paid rates by NDC rather than
calculating our own rates.
Study Sample
We used a sample of workers’ compensation prescription claims collected from
the California Workers’ Compensation Institute (CWCI), a private, nonprofit
organization of workers’ compensation insurers who collect claims data from their
members. For this study we selected only pain and pain related medications, which
comprise 38.9% of total CWCI member prescriptions and 52.5% of the total CWCI
workers’ compensation pharmacy payments. Selected pain and pain related medications
were categorized into the standard therapeutic classes for cost analysis (Figure I)
[Katzung, 2001].
Each drug is also categorized by National Drug Code (NDC), an 11-digit code
established by the Food and Drug Administration (FDA) that identifies a specific
medication by strength, quantity provided, generic or brand, as well as the origin of the
medication (manufacturer or repackager). The CWCI data also include the billed
amount, paid amount, drug NDC and name dispensed.
6

To compare these costs to an alternative pricing system, Medi-Cal costs during
2002 were obtained from the State Drug Utilization Project [Center for Medicare &
Medicaid Services, 2003]. The Medi-Cal NDCs are broken down quarterly by total
number of prescriptions, total number of units sold (pills dispensed) and total costs paid.
To ensure consistent data, the 4th quarter payment was used for each NDC provided or for
the previous quarter if the 4th quarter data was not available.
Cost Analysis
All NDCs listed in the Red Book from the selected medication list (Figure 1) that
were available were extracted from the CWCI data set. Medi-Cal’s AWP source is First
Data Bank, but this was not available to us and the Red Book AWP is comparable. This
resulted in 1,315 workers’ compensation NDCs and their total costs, which provided the
sample for comparison with the Medi-Cal system. We used the amount paid, the total
number of prescriptions and the assumption that payments were based on the 2002
pharmaceutical fee schedule to create a formula to calculate the average pills per
prescription. We then calculated average annual cost per pill and per prescription as well
as total annual costs paid by NDC in 2002. After that we repriced the 2002 workers’
compensation pharmacy costs for each NDC using Medi-Cal prices paid in 2002 per pill
for the same NDC to determine any potential changes in costs.
We then calculated the differences in total annual workers’ compensation cost
between the old and new pharmacy fee schedules by NDC, by drug name, by therapeutic
class, for all brand or, all generics, and for all the selected drugs together. We did not
identify substitutions from brand to generic in the old and new pricing systems, because
we were unable to determine the extent of this substitution from the data. In addition,
we calculated the total expected savings to the whole system by projecting to the total
7

workers’ compensation market from that data represented by both our drug selection and
our database. Finally we conducted a linear regression analysis to determine which
factors best predict savings from the old to the new pricing systems.
Results
Non-Comparability of Pricing Systems
Our major early finding was that there was no comparable NDC price provided
under the Medi-Cal system for 60% of our selected California Workers’ Compensation
NDCs. The Division of Workers’ Compensation also note this payment problem. Since,
the old pharmaceutical fee schedule formulae provided the maximum reasonable
allowance for NDCs with no equivalent Medi-Cal price we realized that there were no
reform savings for at least 60% of the NDCs. Therefore, in the first substitution, we used
the former fee schedule formulae for any NDC that lacked Medi-Cal prices (Medi-Cal +
Old CA WC)1. Anticipating that alternative substitution methods might be recommended
in the future to increase savings, we also used one additional substitution method for the
non-Medi-Cal priced NDCs. The second method substituted an alternative price of
AWP-10% for NDCs with no Medi-Cal price, because this is the formulae most
frequently used by other state’s workers’ compensation systems for pharmacy
reimbursements (Medi-Cal + AWP-10%). In addition we re-priced at AWP-10% for all
the NDCs instead of using the Medi-Cal fee schedule to see how a more transparent
method of reimbursement would compare with the newly implemented legislation (AWP-
10%).
Expected Savings
1 Note: Effective September 1, 2004 Medi-Cal reimbursement will be Average Wholesale Price * 0.83 (dispensing fee not included)
8

Based on 2002 workers’ compensation utilization and costs, and substituting for
each NDC Medi-Cal costs when available, or with the old fee schedule allowances when
Medi-Cal prices were unavailable, savings from our sample were $11,495,098 for pain
and pain related drugs alone, a 29.5% cost reduction. The number of pain related
prescriptions in our sample was 461,425 out of 1,186,621 total California Workers’
Compensation pharmacy prescriptions claims in our CWCI sample. The total billed
amount for all drugs and supplies was $94,482,689 and the total paid was $74,199,281.
Using CWCI pain data that represents 13.7% of all workers’ compensation pharmacy
payments in California, we inflated our total CWCI pain medication costs by 86.3% in
order to estimate total workers’ compensation costs for all those insured. Since the
CWCI data excludes self-insured employers, we used the WCIRB estimate for 2002 that
the self-insured comprise 30% of the total workers’ compensation costs and multiplied
our CWCI inflated total costs by their suggested factor of 1.49 [Baker et al., 2002;
CHSWC, 2003]. In this way we estimated our savings calculated from the WCIRB
($423.9 million) total 2002 California workers’ compensation payment to pharmacies of
[CHSWC, 2003]. Assuming that the 29.5% cost savings we found for pain and pain
related drugs extends to all drugs, then one could expect a savings of $125 million to the
whole workers’ compensation system in 2002.
Savings with Alternative Substitution Method and Pricing System
Because of the non-comparability between Medi-Cal and Workers’ Compensation
NDCs, we also calculated cost savings using an alternative substitution method. First, for
those NDC drugs with no Medi-Cal price we substituted a price of AWP-10% and found
that the pain and pain related drugs of the new system compared with the old system
saved 33.8%, $21 million more in savings than the current substitution method being
9

used (Table I). If one paid for drugs using a different pricing system such as a straight
calculation of AWP- 10% then savings were 29.20% or $124 million to the total workers’
compensation system. This is almost the same as the expected savings using the current
system ($1 million less saved) but would be a much easier system to use. However, in
the long term, there may be much less control by legislators over the AWP than over the
Medi-Cal pricing, so this similarity in savings might not be sustained over the years.
Savings by Therapeutic Class
By therapeutic class, savings ranged from 21-47% using the current new
pricing system with anxiolytics/sleep aids accounting for the largest percentage of
savings and skeletal muscle relaxants/anticonvulsants the least. These savings differed
by pricing system as can be seen in Table I. Comparing the current and AWP-10%
substitution systems, larger percentages of savings are found mainly with the skeletal
muscle relaxants/anticonvulsants (9% greater savings) and the NSAIDS (6% greater
savings). The other drug classes showed similar savings percentages. The AWP-10%
pricing system compared with the current new Medi-Cal system show very different
savings percentages by therapeutic class. For example the AWP-10% system has a 14%
lower savings for anxiolytics/sleep aids, an 8% lower savings for narcotics/analgesics (C-
III or greater) while other drug classes primarily had slightly higher percentages of
savings. Therefore actual savings with different pricing mechanisms will depend on
particular drug characteristics.
Savings by Drug
We found substantial variation in cost savings depending on the characteristics of
the drug itself. Therefore we calculated expected percent savings for each NDC by drug
(Table II). For example, the greatest savings was for alprazolam (79%), which had
10

complete Medi-Cal substitution and low FUL prices. The second highest savings (42%)
was from sertraline, available at that time as a brand only drug. Savings from five other
drugs ranged from 38-39% and included tizanidine, venlafaxine and fluoxetine, zolpidem
and lansoprazole.
Nabumetone produced the least cost reductions by drug of any of the pain and
pain related medications with savings of 4% (Table II). It also rarely had an NDC that
was substitutable with a Medi-Cal price. Propoxyphene, available as generic, but with no
FUL price produced the second lowest cost reductions with savings of 4.5%. Also
providing low cost savings are naproxen (20%) and carisoprodol (15%), both with a FUL
Medi-Cal price and greater than 95% generic use by number of prescriptions. However,
neither of the drugs that produced the highest nor lowest expected savings by drug had
the highest volume of use within that drug group so they didn’t affect the overall savings
greatly.
Costs and Savings by Prescription
For pain and pain related prescriptions overall the average payment per
prescription was $85.31 (S.D.=$194.94) using the old pharmacy fee schedule prices, and
$65.54 (S.D.= $146.44) for the current Medi-Cal + WC fee schedule prices. Average
payment was a similar $62.50 (S.D.= $107.79) if using straight AWP-10% instead and a
much lower $55.95 (S.D.= $139.51) when using the Medi-Cal system and AWP-10%
substitution system. Our average payment per prescription with the new legislation and
our alternative methods save about $20 per prescription.
Pain and Pain Related Drug Costs
Pain and pain related drugs made up the majority of costs for a total of $39
million dollars paid in our sample (Table II). NSAIDS account for the most costs ($9.6
11

million or 18.5%) but only 12% of the prescriptions, while CIII or greater narcotics
account for the largest number of prescriptions (14%) and only 10% of the costs. The
high costs of both brand and generic oxycodone and fentanyl account for much of the
difference between costs and prescriptions found in the C-II Narcotics, while the low
costs of brand and generic hydrocodone account for the larger number of prescriptions
compared with costs in the C-III Narcotics. Celebrex and Vioxx, available at that time as
brand only, accounted for the highest total costs of the NSAIDS ($3.4 million and $3.0
million respectively), but with Vioxx withdrawn from the market in October 2004, the
cost dynamics will likely change as there is more use of other NSAIDs.
FUL Related Savings
Medi-Cal specified, and very low FUL prices for certain generic drugs, which
have especially high utilization could lead to large reductions when applied to the
workers’ compensation drugs. However, we found that there are only 4 drugs that have
FUL prices in our pain and pain related drug sample and we already demonstrated that
FUL prices are seen in drugs with both large and small cost savings. Since an FUL is
given to all the NDCs of a generic drug but only those NDCs used by Medi-Cal are
posted and substituted with the new pricing system, we look at the effects of FUL pricing
while controlling for non-substitutability. The savings for cyclobenzaprine, naproxen, and
alprazolam all with FUL prices were large (82-89%) and the other drug, carisoprodol,
had lower savings (44%). In addition, these four drugs account for a total of $8.8 million
in the old payment system out of $27.5 million total current estimated pain drug
payments (32%), with only a 20% overall savings when accounting for both substitutable
and non-substitutable NDCs. Therefore Medi-Cal FUL prices do provide large savings
12

but some of these drugs lack an equivalent Medi-Cal NDC price, so they do not have a
large effect on overall savings to the workers’ compensation medication payments.
Costs and Savings of Brand and Generic Drugs
We compared costs and savings separately for brand and generic drugs overall to
see if they had different effects. The savings for brand name medications were greater
(33-36%) than generic medications (16-32%) depending on the substitution method used
(Figure II). A straight AWP-10% system used to price workers’ compensation drugs
results in the highest savings (36%) for branded drugs, but the lowest savings (16%) for
generic drugs. The alternate substitution system (Medi-Cal + AWP-10%) provides the
highest savings for generic drugs (32%). Therefore it appears that the Medi-Cal system
is responsible for much of the generic savings.
Eleven of the twenty-three medications studied have generic alternatives.
However, brand only drugs represent 36% of the total pain prescriptions and 43% of the
pain and pain related pharmacy payments. All brand drug use together represents the
majority of the total pain payments at 65%, and only 45% of the total pain prescriptions
for our study sample.
Statistical Analysis
In summary, we found that there isn’t a consistent pattern of variation in savings
that can be found when looking at each drug factor alone, with more complex patterns
likely predictive of cost savings when using the new Medi-Cal pricing system. To check
this we conducted a linear regression analysis to determine the main predictor of cost
savings by NDC. Since savings were not normally distributed we also examined the log
of savings, which were normally distributed. Seven dummy variables including FUL
price, brand only, substitutability, repackager, and whether the drug was on the market
13

for less than 7 years, 7-15 years, or more than 15 years were used. Removing zeros for
non-substitutable NDCs we significantly (p<0.0001) predicted 8% of log savings with
brand only, FUL price and greater than 15 years on the market showing increased cost
savings (Adjure-square=0.0829). When we included the zero savings due to non-
substitutability, we predicted only 5% of the cost savings with brand only and
substitutability significantly (p<0.0001) predicting the savings (non-substitutability
predicting lower savings, and branded drugs predictive of higher savings) (Adj. R-square
= 0.0496).
Discussion
The new 100% Medi-Cal pharmaceutical payment schedule mandated by SB 228
cannot be used for at least 60% of the NDCs currently being used by the workers’
compensation system. There are many specific drug choices depending on which
manufacturer, package size, and dose are selected by the prescriber. This selection can
be based on the needs of a particular patient, which suppliers the pharmacy gets the best
price from, or other factors. However, as it exists now, for any drug for which a Medi-
Cal NDC is not used and therefore has no price, the prior pharmacy fee schedule is used
in our calculation and, limiting the savings from the new system.
All payment systems create incentives for maximizing payments. The current
Medi-Cal + old WC system may encourage the selection of drugs which are not NDCs
used by Medi-Cal so that pharmacies can be paid at higher reimbursement rates. When
using the straight AWP-10% pricing system, however, since there is little control over the
AWP, savings could diminish over time if manufacturers inflated AWP prices. For
example, between 1998 and 1999, AWP prices increased by 12.8%, and when evaluated
on a monthly basis, AWP unit price increased over 25% [Neuhauser et al., 2000].
14

However, the workers’ compensation system could also respond by increasing the
mandated reduction from AWP and keep prices both fair and better controlled. For
example, if a straight AWP-10% system were used, the reductions off AWP could be tied
to the Medi-Cal system and its percent reductions. In the rush to make policy changes,
the full implications of the 100% Medi-Cal choice were not fully anticipated by the
legislators.
Despite this difficulty with implementation, the savings to the pharmacy bill that
can be expected (29.5%) are fairly high. This is especially important since studies
demonstrate that pharmacy costs are rising annually [WCIRB, 2003]. However, given
that pharmacy payments are 7% -9% of total Medical Expenditures in the 2002 California
Workers’ Compensation system and only 1.5% of the total workers’ compensation costs
overall, these changes save only 0.005% to the whole $25 billion WC system in 2002
[CHSWC, 2003; WCIRB, 2004; Bellusci, 2002]. While pharmacy savings will have
some effect on the ability to decrease premiums for California businesses, the
contribution is expected to be no more than 0.1% [Wilson et al., 2005].
The cost per prescription ($65) with the new pricing system is now comparable to
that of other health plans. For example, others have reported an average cost per
prescription of $63 over all types of drugs and the California HealthCare Foundation in
2001 reported Medi-Cal costs per prescription averaged $66.40. [Hays, 2004; California
HealthCare Foundation 2002]. Another publication looking at group health pharmacy
expenses, estimates that in 1999 the average retail cost per prescription in California was
$41.10, ($47.58 in 2002 prices if inflated 5% per year) but for the newer prescriptions
this estimate is higher, $97.56 for Prozac 200 mg for depression, and $91.91 for a
prescription for Celebrex 200mg for chronic pain [Bymark et al., 2001]. The California
15

Workers’ Compensation costs, however may not be comparable to other health plans
average costs as their drug utility pattern differs from other groups. It is unclear how
these price differences will affect demand for drugs in the workers’ compensation
system, but this should be examined in future studies.
We found that there are large variations in savings depending on certain drug
characteristics such as brand vs. generic, availability of generics, availability of FUL
prices, shared NDC with Medi-Cal and workers’ compensation systems and others.
Although high previous use of branded drugs usually accounts for the greatest percentage
savings, no single factor accounts for all the variation, indicating that the pattern is more
complex, involving a combination of these factors.
Another interesting source of variability in savings was from the frequent use of
repackager NDCs in workers’ compensation. This was most notable when determining
which pain related NDCs weren’t comparable between the California Workers’
Compensation and Medi-Cal system. Repackagers are rarely or never covered under the
Medi-Cal system, but used by workers’ compensation prescribers. However, the
proportion of each drugs costs attributed to repackagers in this study is minimal, ranging
from 0.01% to 20%, since most repackaged drug prescriptions are for small quantities.
Exceptions include generic cyclobenzaprine (67.51%), generic nabumetone (69.78%),
generic carisoprodol (70.35%), generic naproxen (76.66%), generic propoxyphene
(98.09%), and gabapentin, a brand only medication (100%). Therefore, although most
repackaged drugs have no Medi-Cal price and are therefore priced by the old workers’
compensation fee schedule, it is difficult to tell from these data alone whether the practice
will save costs by reducing waste, or “games the system” by requiring high prices. Some
of this frequent use of repackagers may result from pharmacies limiting their liability for
16

longer prescriptions that have not yet been authorized by the workers’ compensation
system for payment. Repackaging practices warrant further examination to determine
their effects on the system.
Attention should always be paid to maintaining patient access to needed
medications and pharmacies when making policy changes which affect drug costs as is
required in the AB 749 legislation. An earlier internal study conducted by the CHSWC
concluded that access to pharmacies servicing workers’ compensation patients would not
be largely affected [Neuhauser et al., 2000]. Access to medications themselves might not
be affected because the current pharmacy legislation substitutes the former California
pharmacy fee schedule for any non-equivalent NDCs thus allowing workers’
compensation patients the freedom of a non-formulary based prescription benefit.
However if lower payments cause small pharmacies to close, pharmacy access may
decrease.
Our study has several limitations that should be noted. A full estimate of
pharmacy savings due to all parts of SB228 was not made in this study due to the
limitations of our sample. First, we used CWCI data, which is a sample of drug use in
workers’ compensation, not all drug use. However, we think these drugs and these data
are representative of the whole system and what we can expect. Secondly, we selected
only pain and pain related drugs, which are the majority of workers’ compensation drugs
and are representative of the types of drugs that are used by injured workers. However
other drugs may have different patterns of utilization and cost savings.
Another limitation is that we used 2002 drug data (the most recent data available
at the time). Some of the drugs that were only available as brands in 2002 now have
generics available so savings could differ in future years. Eleven of the twenty-three pain
17

related drugs were only sold as brand name products in 2002 with four new medications
(tramadol and omeprazole in 2002, tizanidine and paroxetine in 2003) approved for
generic use since that time [US Food and Drug Administration, 2004]. In addition, as of
September 1, 2004, Medi-Cal pharmacy costs were further reduced to a rate of
AWP*0.83 instead of AWP* 0.90 so actual savings now may be greater than predicted.
We recommend a follow-up study using actual data since the legislation has been
implemented, to determine the full savings more accurately.
Finally, savings due to generic substitution were not considered in this study
since we confined our analysis to examining only the savings due to the change in
payment method. The CHSWC proposed that if generic substitution could increase from
83% in 2000 to 93%, as expected, pharmaceutical costs could be reduced an additional
2.5%, a savings of $10.5 million [Neuhauser et al., 2000].
In conclusion, we demonstrate significant pharmaceutical savings with the new
100% Medi-Cal payment method ($125 million). We also examined an alternative
substitution method based on a combination of Medi-Cal and AWP-10%, which would
provide an additional 4.3% savings (or a total of $146 million savings) compared to the
pharmacy fee scheduled currently adopted by California workers’ compensation system.
Also a more transparent fee schedule based on AWP-10% only provides essentially the
same savings as the existing system for consideration (with only $1 million less saved).
The study suggests that the current payment method provides an avenue for selection of
drugs by NDC not used by Medi-Cal to maximize payments. This practice could reduce
future savings to the system and requires further monitoring. We also demonstrate the
variability of savings depending on multiple characteristics of the drug and its market
characteristics, demonstrating the complexity of controlling drug spending using only
18
drug pricing systems. This legislation is a good start towards controlling pharmacy
costs. However, more pharmacy cost reductions can probably be obtained by making
changes in patterns of prescribing of pain and other medications than by changing drug
pricing alone [Wilson Leslie 2004]. This can be accomplished either by offering pain
guidelines, or using consulting pharmacists or others who specialize in pain treatment to
guide complex pain cases [Dworkin et al., 2003; Harden et al., 2003; Bannwarth, 1999;
Cole, 2004].
19
References
Alarcón. 2003. SB 228 Workers' Compensation. Senate Bill No. 228. Chapter 639. Filed October 1, 2003. Sacramento, California. p 1-56.
Baker C, Swezey CL, Gomberg J, Stromberg K. 2002. California Commission on Health and Safety and Workers' Compensation (CHSWC): 2001-2002 Annual Report San Francisco, CA: Commission on Health and Safety and Workers' Compensation. p 1-145.
Bannwarth B. 1999. Risk-benefit assessment of opioids in chronic noncancer pain. Drug Saf 21: 283-296.
Bellusci DM. 2002. Cost Evaluation of Assembly Bill 749 as enacted San Francisco, CA: Workers' Compensation Insurance Rating Bureau of California. p 1-38.
Blay N, Smitline N, Swedlow Alex. 2000. The integration movement in California's Workers' Compensation market. J Ambul Care Manage 23(3): 57-69.
Braden BR, Cowan CA, Lazenby HC, Martin AB, McDonnell PA, Sensenig AL, Stiller JM, Whittle LS, Donham CS, Long AM, Stewart MW. 1998. National Health Expenditures. Health Care Financ Rev 20(1):83-89.
Bymark L, Waite K. 2001. Advance PCS data, prescription drug use and expenditures in California: Key trends and drivers: California HealthCare Foundation. p ASBN 1-929008-929049-X.
Calderon. 2002. AB 749 Assembly Bill - Chaptered Text: Workers compensation: administration and benefits. California Assembly. Chapter 6. Filed February 19, 2002. Sacramento, California. p 1-68.
California Department of Insurance's Communications Office Web page: General Information News Release.http://www.insurance.ca.gov/prs/prs2003/fs037-03. Accessed June 8, 2005.
California HealthCare Foundation 2002. The Medi-Cal Pharmacy Benefit. Fact Sheet No. 12. http://www.chcf.org/topics/medi-cal/index.cfm?itemID=20430&suppresslinks=true. Accessed June 27, 2005.
Center for Medicare and Medicaid Services. 2003. State Drug Utilization Data online. http://cms.hhs.gov/medicaid/drugs/drugs5.asp. Accessed September 10, 2003. Baltimore, Maryland.
Cohen HE. 2002. Drug Topics Red Book Monvale, N.J.: Thomson Medical Economics.
Cole EB. 2004. The Last Word: The state of pain management. FDA Consumer Magazine March-April: 1-2.
Commission on Health and Safety and Workers' Compensation. 2003. California Commission on Health and Safety and Workers' Compensation (CHSWC): 2002-2003
20
Annual Report San Francisco, CA: California State Department of Industrial Relations. p 1-196.
Dworkin RH, Backonja M, Rowbotham MC, Allen RR, Argoff CR. 2003. Advances in neuropathic pain: Diagnosis, mechanisms, and treatment recommendations. Arch Neurol 60: 1524-1534.
First DataBank. 2004. National Drug Data File Plus. http://www.firstdatabank.com/knowledge_bases/nddf_plus/. First DataBank, Inc.
Harden N, Cohen M. 2003. Neuropathic pain: From mechanisms to treatment strategies: Unmet needs in the management of neuropathic pain. J pain and Symptom Manage 25: S12-S17.
Hays D. 2004. Drug Costs Sicken WC Insurers. The National Underwriter Company National Underwriter, Property & Casualty/Risk & Benefits Management Edition. September 20, 2004 ed. News. p 40.
Institute of Governmental Studies (IGS). 2004. Workers' Compensation in California: Institute of Governmental Studies, University of California.
Katzung BG. 2001. Basic and Clinical Pharmacology. Lange Medical Books. McGraw-Hill. p 351-532. Miller C. 2002. Deciphering the Long-Awaited Workers’ Comp Reforms: CPER 153.
Neuhauser F, Swedlow A, Gardner LB, Edelstein E. 2000. Study of the Cost of Pharmaceuticals in Workers' Compensation San Francisco: Commission on Health and Safety and Workers' Compensation. p 1-26.
Neumark D. 2005. The workers' compensation crisis in California: a primer. California Economic Policy 1(1):1-17.
Smith C, Cowan C, Sensenig A, Catlin A. 2005. Health spending growth slows in 2003. Health Aff 24(1): 185-195.
US Food and Drug Administration. 2004. Drugs@FDA, Label and Approval History: Center for Drug Evaluation and Research (CDER) online. http://www.fda.gov/cder/. Accessed July 2004.
Williams CT, Reno VP, Burton JF. 2003. Workers' Compensation: Benefits, Coverage, and Costs, 2001. Washington, D.C.. National Academy of Social Insurance. Wilson Leslie. 2004. Pharmaceutical Care in the California Workers' Compensation Insurance System DWC Newsline: Division of Workers' Compensation.
Wilson L, Case CE, Douglas CA, Koo PJ, Louie C. 2005. Will the new California Workers' Compensation legislation fulfill its promise? Reactions of Insurers. Industrial and Labor Relations (ILR) Review.
21

22
Workers' Compensation Insurance Rating Bureau (WCIRB). 2003. WCIRB Preliminary Estimate of the Cost Impact of Assembly Bill 227 and Senate Bill 228 As Adopted by the Legislature September 12, 2003 San Francisco: Workers' Compensation Insurance Rating Bureau. p 1-10. Workers' Compensation Insurance Rating Bureau (WCIRB). 2004. 2003 California Workers' Compensation insured losses and expenses California: Workers' Compensation insurance rating bureau of California. p 1-35.

Figure I: Selected pain and pain-related medications included in analysis.
Pain and Pain
Related Medications
Therapeutic Classes
C-II Narcotics and Analgesics
C-III and Greater
Narcotics/ Analgesics
Skeletal
Muscle Relaxants/
Anticonvulsant
Anti-Ulcer Agents
Non-Steroidal Anti-
Inflammatory Agents
Anti- Depressants
Anxiolytics/ Sleep Aids (Proton Pump
Inhibitors)
Oxycodone Morphine Fentanyl
Hydrocodone Propoxyphene
Tramadol (NG)
CyclobenzaprineMetaxalone (NG)
Carisoprodol Tizanidine (NG)
Gabapentin (NG)
Generic Names1
Fluoxetine Naproxen
Venlafaxine (NG)Paroxetine (NG)
Omeprazole (NG)
Alprazolam Nabumetone Rofecoxib
(NG) Zolpidem (NG)
Setraline (NG) Lansoprazole (NG)
Celecoxib (NG)
1 Brand Names: oxycodone includes Oxycontin, Percocet, Percodan, Endodan, Endocet, Roxicet; morphine includes MS Contin, MSIR, Roxanol; Fentanyl includes Duragesic, Actiq, Sublimaze; propoxyphene includes Darvocet, Darvon; tramadol includes Ultram; hydrocodone includes Vicodin, Vicoprofen, Lortab, Lorcet, Norco, Hydrocet, Anexia; cyclobenzaprine includes Flexeril; metaxalone includes Skelaxin; tizanidine includes Zanaflex; carisoprodol includes SOMA; gabapentin includes Neurontin; venlafaxine includes Effexor; paroxetine includes Paxil; sertraline includes Zoloft; fluoxetine includes Prozac; omeprazole includes Prilosec; lansoprazole includes Prevacid; alprazolam includes Xanax; zolpidem includes Ambien; naproxen includes Naprosyn; celecoxib includes Celebrex; rofecoxib includes Vioxx; nabumetone includes Relafen 2NG= no generic available
23

24
Table I: Total Estimated Costs and Percent Savings by Therapeutic Class Using Substitution and Alternative Payment Methods
Workers’ CompensationPharmacy Fee Schedule
Costs
Workers’ Compensation Pharmacy Fee Schedule
Costs
From Former California Law
From
New California Law - (Medi-Cal and Former
California Fee Schedule)
Workers’ Compensation Pharmacy Fee Schedule
Costs
Alternative Method-
(Medi-Cal and Average Wholesale Price – 10%)
Workers’ Compensation Pharmacy Fee Schedule
Costs
Alternative Method- (Average Wholesale
Price – 10% Only) Total for Overall California WC System $423,869,000 $299,013,656 $280,429,898 $300,059,941
% Change From former CA WC 29.50% 33.83% 29.20% Total for All Pain-Related Medications $38,968,232 $27,473,130 $25,784,494 $27,589,404
% Change From former CA WC 29.50% 33.83% 29.20% Narcotics and Analgesics (C-II) Total Costs $6,891,236 $4,778,217 $4,770,463 $4,582,506% Change From former CA WC 30.66% 30.77% 33.43% Narcotics and Analgesics (C-III or greater) Total Costs $7,395,349 $5,080,332 $4,830,935 $5,688,611% Change From former CA WC 31.30% 34.68% 23.08% Skeletal Muscle Relaxants/ Anticonvulsants Total Costs $6,171,138 $4,883,156 $4,300,099 $4,810,783% Change From former CA WC 20.87% 30.32% 23.56% Antidepressants Total Costs $2,604,444 $1,612,589 $1,605,391 $1,676,306% Change From former CA WC 38.08% 38.36% 35.64% Anti-Ulcer Agents Total Costs $1,062,575 $695,205 $695,126 $678,711 % Change From former CA WC 34.57% 34.58% 36.13% Anxiolytics/Sleep Aids Total Costs $1,518,558 $803,756 $795,748 $1,021,591 % Change From former CA WC 47.07% 47.60% 32.73% Non Steroidal Anti-inflammatory Drugs Total Costs $13,324,930 $9,619,876 $8,786,732 $9,130,896% Change From former CA WC 27.81% 34.06% 28.79%

Table II: Prescription and cost utilization of pain & pain related medications1 in the California WC2 system. Percentages based on total CWCI3 pharmacy claims including prescription and costs, 2002.
Total CWCI Prescriptions
(% Of Total CWCI
Prescriptions)
Total CWCI Pharmacy Costs ($)
From
Former California Law
(% Of Total CWCI Pharmacy Costs)
Total CWCI Pharmacy Costs ($)
From
New California Law
(Medi-Cal and Former California
Fee Schedule)
Expected Savings ($)
New versus Former California Pharmacy
Fee Schedules
(% Reduction) Total for CWCI Pain & Pain Related Medications 461,425(38.89) 38,968,232(52.52) 27,473,134 11,495,098(29.50)
C-II Narcotics and Analgesics
Oxycodone 11,924(1.00) 4,436,543(5.98) 3,015,457 1,421,086(32.03) Morphine 2,604(0.22) 891,981(1.20) 647,453 244,527(27.41) Fentanyl 2,883(0.24) 1,562,711(2.11) 1,115,308 447,404(28.63) Totals 17,411(1.47) 6,891,236(9.29) 4,778,218 2,113,018(30.66) C-III or Greater Narcotics and Analgesics
Hydrocodone 127,715(10.76) 4,805,128(5.98) 3,083,817 1,721,311(35.82) Tramadol 25,628(2.16) 1,902,544(2.56) 1,339,985 562,559(29.57) Propoxyphene 17,887(1.51) 687,676(0.93) 656,531 31,144(4.53) Totals 171,230(14.43) 7,395,349(9.97) 5,080,333 2,315,016(31.30) Skeletal Muscle Relaxants/Anticonvulsants
Cyclobenzaprine 20,295(1.71) 811,576(1.09) 569,181 242,395(29.87) Metaxalone 6,955(0.59) 401,712(0.54) 293,271 108,440(26.99) Tizanidine 7,477(0.63) 724,218(0.98) 445,201 279,018(38.53) Carisoprodol 48,751(4.51) 4,210,217(5.67) 3,552,091 658,125(15.63) Gabapentin 2,63(0.02) 23,413(0.03) 23,414 0(0) Totals 83,741(7.06) 6,171,138(8.32) 4,883,157 1,287,980(20.87) Antidepressants Venlafaxine 4,759(0.40) 696,862(0.94) 422,996 273,867(39.30) Paroxetine 5,630(0.47) 678698(0.91) 455,293 223,405(32.92) Sertraline 4,859(0.41) 607,856(0.82) 352,136 255,719(42.07) Fluoxetine 3,506(0.30) 621,027(0.84) 382,165 238,863(38.46) Totals 18,754(1.58) 2,604,444(3.81) 1,612,589 991,855(38.08) Anti-Ulcer Agents Omeprazole 3,462(0.29) 664,266(0.90) 446,635 217,631(32.76) Lansoprazole 2,206(0.19) 398,308(0.54) 248,570 149,738(37.59) Totals 5,668(0.48) 1,062,575(1.43) 695,205 367,370(34.57) Anxiolytics/ Sleep Aids Alprazolam 6,093(0.51) 344,469(0.46) 73,464 271,005(78.67) Zolpidem 14492(1.22) 1,174,089(1.58) 730,291 443,797(37.80) Totals 20585(1.73) 1,518,558(2.05) 803,756 714,802(47.07) NSAIDS Naproxen 50,121(4.22) 3,432,055(4.63) 2,755,275 676,780(19.72) Celecoxib 43,789(3.69) 4,586,711(6.18) 2,984,120 1,602,591(34.94) Rofecoxib 44,971(3.79) 4,870,022(6.56) 3,444,455 1,425,567(29.27) Nabumetone 5,155(0.43) 454,495(0.61) 436,024 18,470(4.06) Totals 144,036(12.14) 13,324,930(17.96) 9,619,876 3,705,054(27.81)
1 Pain medications include a collection of brand name drugs and any acceptable generic equivalents. 2 WC: Workers’ Compensation 3 CWCI: California Workers’ Compensation Institute
25
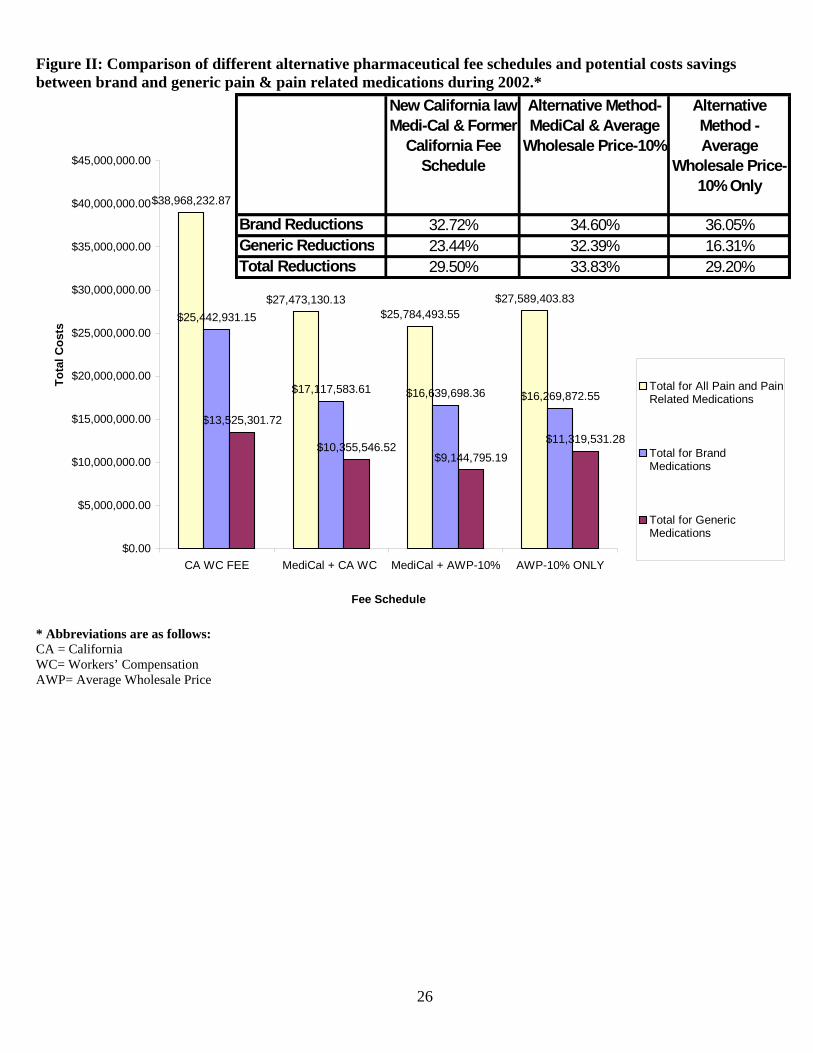
Figure II: Comparison of different alternative pharmaceutical fee schedules and potential costs savings between brand and generic pain & pain related medications during 2002.*
$38,968,232.87
$27,473,130.13$25,784,493.55
$27,589,403.83$25,442,931.15
$17,117,583.61 $16,639,698.36 $16,269,872.55
$13,525,301.72
$10,355,546.52$9,144,795.19
$11,319,531.28
$0.00
$5,000,000.00
$10,000,000.00
$15,000,000.00
$20,000,000.00
$25,000,000.00
$30,000,000.00
$35,000,000.00
$40,000,000.00
$45,000,000.00
CA WC FEE MediCal + CA WC MediCal + AWP-10% AWP-10% ONLY
Fee Schedule
Tota
l Cos
ts
Total for All Pain and PainRelated Medications
Total for BrandMedications
Total for GenericMedications
New California law Medi-Cal & Former
California Fee Schedule
Alternative Method- MediCal & Average
Wholesale Price-10%
Alternative Method - Average
Wholesale Price-10% Only
Brand Reductions 32.72% 34.60% 36.05%Generic Reductions 23.44% 32.39% 16.31%Total Reductions 29.50% 33.83% 29.20%
* Abbreviations are as follows: CA = California WC= Workers’ Compensation AWP= Average Wholesale Price
26