new york city oyster monitoring report: 2016–2017 · 2013), including in new york city. although...
TRANSCRIPT
New York City Oyster Monitoring Report: 2016–2017 A collaboration between The Nature Conservancy and Billion Oyster Project
By Mike McCann, Ph.D. | May 2018
About The Nature Conservancy The mission of The Nature Conservancy (TNC) is to conserve the lands and waters on which all life depends. The Nature Conservancy’s New York City Program protects and promotes nature and environmental solutions to restore natural systems and enhance the quality of life of all New Yorkers. We are committed to improving the City’s air, land and water, and we advance strategies that create a healthy, resilient and sustainable urban environment. About Billion Oyster Project Billion Oyster Project (BOP) is an effort to restore a sustainable oyster population to New York Harbor and to foster awareness, affinity and understanding of The Harbor by engaging New Yorkers directly in the work of restoring one billion oysters to this habitat. BOP collaborates with 100 middle and high schools throughout all five boroughs. At these schools, BOP works with teachers to provide authentic, place-based science and math lessons taught through the lens of oyster restoration. BOP has collected 800,000 pounds of shells from restaurants and planted more than 25 million oysters in New York Harbor. Acknowledgments These collaborative monitoring efforts led by TNC and BOP would not have been possible without the contributions of students, teachers, community partners, volunteers, BOP Research Assistant Technicians, BOP Ambassadors, summer fellows and many others who helped collect data or otherwise make the project possible. This document received technical input and review from Liz Burmester, Ph.D., Pete Malinowski and Katie Mosher of BOP and from Bryan DeAngelis, Moses Katkowski, Carl LoBue, Bo Lusk, Emily Maxwell, Sally McGee, Phil Silva, Ph.D. and Adam Starke of TNC. Recommended Citation McCann, Mike. 2018. New York City Oyster Monitoring Report: 2016–2017. The Nature Conservancy, New York, NY. Front Photo: Jonathan Grassi, The Nature Conservancy Back Photo: Jonathan Grassi, The Nature Conservancy

THE NATURE CONSERVANCY and BILLION OYSTER PROJECT | NYC Oyster Monitoring Report: 2016–2017
1
Letter from The Nature Conservancy’s New York City Program Director Dear Reader, Healthy living systems serve as critical infrastructure for cities, providing tangible benefits, habitat for wildlife and a sense of community for urban residents. Not only do they provide us with a cleaner, healthier, safer world, they can promote a sense of wonder when people connect to these amazing and complex systems. As the New York City Program Director for the Nature Conservancy, I’ve seen this connection happen many times. What initially most inspired me about restoring oysters in New York Harbor was asking a New York Harbor School student what he enjoyed about studying oysters, and hearing him reply enthusiastically: “seeing a seahorse.” While such enthralling experiences may be life-changing in themselves, the overall impact and potential of oyster restoration in New York’s magnificent Harbor remain unknown. But the possibilities are exciting, and someday, with dedicated and holistic investments, New Yorkers may enjoy a Harbor that is fishable and swimmable. With this vision in mind, two years ago The Nature Conservancy in New York embarked on a partnership with Billion Oyster Project. Our goal was to assess the results of oyster restoration and to better characterize dynamics in New York Harbor to help chart the course for overall efforts to improve the health of the Harbor. Endeavors like the Billion Oyster Project (BOP) offer myriad benefits to our Harbor and to those who use NYC's waterfronts and waterways. Yet for too long projects like these have not received the rigorous and systemic monitoring that they warrant. The Nature Conservancy in New York is proud to present a comprehensive assessment of BOP's restoration sites, produced through a close collaboration with BOP. The data and methods presented here can inform data-driven adaptive management, which is key to effectively implementing and accelerating restoration of natural systems and maximizing its benefits. Not only are we proud of this work based on its merits, we believe it can advance more comprehensive and consistent assessments of restoration efforts Harbor-wide and can be a model for other urban estuaries worldwide. While this report focuses on the ecological performance of oyster restoration, the benefits to the people who engage in the restoration also deserve a thorough review. There is much evidence that the act of participating in environmental restoration activities and connecting to nature generate many benefits. We are pleased to see multiple efforts underway to do just this, and look forward to a better understanding of the relationship between ecological restoration and the effects on those doing the restoration. Understanding this relationship will provide more opportunities to invest in the wellbeing of holistic socio-ecological systems. Efforts to restore our natural systems to benefit all New Yorkers and to inspire others globally are the legacy work of generations. Incremental steps to ensure that we are on the right path can help us get there faster. We are proud to present this work and to be an ongoing partner and advocate for a healthier, more equitable, more vibrant NYC. Sincerely,
Emily Nobel Maxwell The Nature Conservancy’s New York City Program Director

THE NATURE CONSERVANCY and BILLION OYSTER PROJECT | NYC Oyster Monitoring Report: 2016–2017
2
Table of Contents
Introduction ................................................................................................................................ 3
Summary of Main Findings......................................................................................................... 4
Site-by-Site Recommendations .................................................................................................. 6
Overview of Sites ....................................................................................................................... 8
Performance Metrics .................................................................................................................12
Assessing Performance at Each Site ........................................................................................13
Oyster Growth ...........................................................................................................................15
Oyster Survival ..........................................................................................................................18
Disease .....................................................................................................................................20
Condition Index .........................................................................................................................23
Reproductive Status ..................................................................................................................24
Point Water Quality Measurements ...........................................................................................25
Continuous Water Quality Measurements .................................................................................28
Food Availability ........................................................................................................................36
Dissolved Inorganic Nutrients ....................................................................................................39
Biodiversity ...............................................................................................................................43
References ...............................................................................................................................53

THE NATURE CONSERVANCY and BILLION OYSTER PROJECT | NYC Oyster Monitoring Report: 2016–2017
3
Introduction The Nature Conservancy’s New York City Program began its Healthy Harbor Project in 2016. This work advances our strategies of protecting and restoring estuarine resources and using nature and nature-based features to meet the biggest challenges faced by people and nature, particularly in cities. This technical report presents our summary and analysis of two years of monitoring data from oyster restoration sites throughout New York/New Jersey Harbor. The main findings of this report are presented succinctly in the Summary of Main Findings (p. 4). Site-by-Site Recommendations (p. 6) and Assessing Performance at Each Site (p. 13) provide detailed information about each restoration site. The remainder of the report summarizes the results of scientific monitoring for a technical audience. The Eastern oyster (Crassostrea virginica) is an ecosystem engineer that is integral to the health of estuarine ecosystems throughout the Atlantic and Gulf coasts of North America. Oysters are filter-feeding bivalves that consume plankton, thus increasing water clarity and removing excess nutrients that could lead to harmful algal blooms. With their hard shells and tendency to form reefs, oysters create three-dimensional structures that harbor and attract life, much like coral reefs. Globally, critical oyster reefs have been widely lost (zu Ermgassen et al. 2013), including in New York City. Although New York was known as “The Big Oyster” before it became “The Big Apple,” today's oyster populations are less than 0.01% what they once were. Poor wastewater sanitation, oyster disease, overharvesting and dredging for shipping channels all contributed to the collapse of New York City oyster beds by the 1920s. Since the turn of the 21st century, efforts have been underway to research and restore oysters to New York/New Jersey Harbor. These efforts represent a unique challenge of restoring a natural habitat to a highly urbanized estuary. Since 2014, Billion Oyster Project (BOP) has been working to restore oysters to New York Harbor. In 2016, The Nature Conservancy (TNC) partnered with BOP to add its scientific capacity to the restoration efforts. In 2016 and 2017, seven oyster restoration sites throughout New York Harbor were monitored by TNC and BOP for measures of oyster performance (e.g., growth, survival, reproduction) and factors that can affect oyster performance (e.g., disease, predators, water quality, phytoplankton). At two sites, efforts were made to document non-oyster species composition and abundance and to understand whether and how oyster restoration enhances biodiversity. These monitoring efforts are only the beginning, as several years are needed to judge the success of ecological restoration.

THE NATURE CONSERVANCY and BILLION OYSTER PROJECT | NYC Oyster Monitoring Report: 2016–2017
4
Summary of Main Findings Although a comprehensive evaluation of ecological restoration success requires a longer time frame (i.e., at least 3–6 years), we could assess some early performance metrics for oyster restoration activities at the seven sites in New York Harbor that were monitored in 2016 and 2017. Here are some of the main conclusions:
● Oyster Growth Is Promising: Oysters showed promising growth in the first year or two of restoration at most sites. Both rapid growth in the first year and continued increases in shell height in the second year were observed at most sites. In general, oysters at sites on the south shore of Staten Island (Great Kills Harbor and Lemon Creek) and Bush Terminal Park (in the Upper Bay) showed higher growth rates than those at sites off or adjacent to the East River (Brooklyn Bridge Park, Brooklyn Navy Yard, Governors Island EcoDock).
● No Recruitment Yet: A key element of long-term success in ecological restoration is a
self-sustaining population. For oysters, that means natural reproduction and recruitment must occur, maintaining restored oyster beds and reefs without continued human intervention. So far, at the seven restoration sites, there have been no major recruitment events.
● Some Signs of Maturity: Although all the restoration activities reported here are in
their early stages, there are signs at some sites of mature individuals that are capable of reproduction. In November 2017, both Bush Terminal Park and Great Kills Harbor had oysters that were in the final stage of spawning, when only residual gametes remain. Measurements of reproductive status should continue in 2018 and should target summer months, when ripe gonads are more likely to be found. As more sites mature, we hope that the odds of finding reproductively mature individuals will increase.
● Keep an Eye on Disease: In general, the prevalence and intensity of Dermo and
MSX, two major oyster pathogens, were low. Future disease testing should be carried out in 2018 with attention to Dermo at Brooklyn Navy Yard (which had nearly 50% prevalence in July 2017) and MSX at Governors Island EcoDock (which had 20% prevalence in November 2017). Disease diagnostics should target warmer months when disease loads typically peak. If disease appears to be a major threat to restored oysters, then the use of disease resistant strains could be explored.
● Low Oxygen Is Common: Water quality logging instruments at all sites reported low
oxygen events (below 4 mg/L dissolved oxygen) that are likely to stress or kill oysters. Brooklyn Navy Yard and Governors Island EcoDock were the worst offenders, with 73.9% and 93.7% of observations below 4 mg/L dissolved oxygen in June at Brooklyn Navy Yard and in July at Governors Island EcoDock, respectively. The degree to which these conditions negatively impact restored oysters is unknown, but monitoring efforts should continue in 2018.

THE NATURE CONSERVANCY and BILLION OYSTER PROJECT | NYC Oyster Monitoring Report: 2016–2017
5
● Biodiversity Changes Are Hard to Detect: Efforts to document biodiversity at Bush Terminal Park and Lemon Creek Lagoon via seining and trapping revealed a diverse assemblage of fish, crabs, shrimp and other organisms occupying these sites. At Bush Terminal Park, where oyster restoration was already underway, we did not detect enhanced species abundance or richness on or near restored oysters. This result may be due to the small scale of restoration activities at the site. The Lemon Creek Lagoon data constitute a baseline prior to oyster restoration. Efforts to document the community of organisms associated with oyster restoration should continue, as trends may emerge over the course of several years, particularly as restoration activities ramp up at these sites. The nonprofit organization NY/NJ Baykeeper is collecting similar data at two other restoration sites (Soundview in the Bronx River and Naval Weapons Station Earle in Raritan Bay), and Brooklyn Bridge Park Conservancy is collecting data at Brooklyn Bridge Park. Methods at these sites should be aligned so that results may be compared. Additional efforts to target reef residents that may not be collected via trapping or seining should also be explored in 2018.
● Adaptive Management Is the Name of the Game: Although oyster restoration and
research activities have been underway in NY/NJ Harbor for nearly two decades, best practices are still emerging and evolving. Restoration design, monitoring and practices should continue to remain dynamic. Evolving approaches to measuring oyster growth and survival at Bush Terminal represent case studies in adaptive management, as monitoring practice shifted on the basis of restoration results. The low growth and high mortality at Brooklyn Bridge Park due to oyster drills (Urosalpinx cinerea, a snail that is a predator of oysters) may represent a “failure” in one sense, but it is also an opportunity to test new restoration strategies. Rather than abandoning this site, in 2018 TNC and BOP will test the efficacy of different strategies for deterring predators. A spirit of adaptive management is necessary in this work, as we continue to learn how to learn and make data-informed decisions while refining our data collection protocols.
● New Sites Are New Opportunities for Learning: The seven sites described here
are only a few of the BOP sites that were in the water in 2016 and 2017. Other partners are working at Head of Bay in Jamaica Bay (New York City Department of Environmental Protection) and Tappan Zee Bridge in the Hudson River (Hudson River Foundation/University of New Hampshire). Several additional sites will be installed by BOP soon, including Bayswater Point State Park and Paerdegat Basin in Jamaica Bay, Soundview in the Bronx River, Living Breakwaters in Staten Island and Coney Island Creek in Brooklyn. These restoration sites present opportunities for future learning and will enable us to explore the potential for oyster restoration in other portions of NY/NJ Harbor.

THE NATURE CONSERVANCY and BILLION OYSTER PROJECT | NYC Oyster Monitoring Report: 2016–2017
6
Site-by-Site Recommendations Here are the proposed next steps at each site: Brooklyn Bridge Park Community Reef
● Install new oyster stock in 2018. ● Test the effect of oyster size class on predation rate. Can larger oysters resist predation
by oyster drills? ● Test the effect of placing copper anti-predation strips on a subset of the Community
Reefs to repel oyster drills. ● Analyze biodiversity (seining) data collected by Brooklyn Bridge Park Conservancy, and
compare these data with results from Bush Terminal Park and Lemon Creek Lagoon. ● Conduct chlorophyll sampling at least once each season in 2018.
Brooklyn Navy Yard Nursery
● Continue to monitor the SuperTrays that were installed in 2017, including disease testing to determine whether Dermo prevalence is higher in summer months.
● Redeploy HOBO water quality logger at Brooklyn Navy Yard in a location that is easier to access without a boat (e.g., off the bulkhead, rather than on the longline).
● Conduct chlorophyll sampling at least once each season in 2018. Bush Terminal Park Community Reef
● Continue monitoring Community Reef installed in 2016. ● Monitor for the presence and abundance of oyster drills on the Community Reef and
throughout both lagoons. ● Install additional Community Reefs and/or gabions (wire containers full of material, that
form a substrate for oysters) in 2018. ● Install bagged shell reef in 2018. ● Continue biodiversity study (seining and trapping) and pilot methods to measure reef
residents along with a valid reference (i.e., control) method. Governors Island EcoDock
● Continue monitoring, including disease testing to determine whether MSX prevalence is higher in summer months.
Great Kills Harbor
● Expand and continue monitoring. ● Ensure that SuperTray stacks are not on or near the bottom, to prevent colonization by
oyster drills. ● To prevent further infestation by the boring sponge (Cliona sp.) and to reduce fouling,
raise stacks out of the water periodically during summer months.

THE NATURE CONSERVANCY and BILLION OYSTER PROJECT | NYC Oyster Monitoring Report: 2016–2017
7
Lemon Creek Lagoon ● Install bagged shell reef, e-concrete disks and gabions in 2018. ● Continue biodiversity monitoring through seining and trapping. Consider ways to avoid
high macroalgae cover that typically occurs in July and August. ● Deploy water quality logger in 2018. ● Conduct chlorophyll sampling at least once each season in 2018.
Lemon Creek Nursery
● Replace spat on shell with larger oysters to prevent cementing into gear. Produce single oysters and/or install oysters at a larger size so they do not cement to the bag and OysterGro.

THE NATURE CONSERVANCY and BILLION OYSTER PROJECT | NYC Oyster Monitoring Report: 2016–2017
8
Overview of Sites Most of the sites described in this report were permitted and installed by BOP in 2016 or 2017. Both Brooklyn Navy Yard and Governors Island EcoDock are home to nurseries that hold many oysters. These sites were permitted and installed prior to 2016, and this document reports on a subset of oysters that were installed at each site in 2017 specifically for monitoring. As of the 2017 monitoring season, no oysters were restored to Lemon Creek Lagoon, but baseline data are reported here. High-level descriptions of the seven sites are included in Table 1, and locations of the sites are shown in Figure 1. Table 1. Restoration structures and installation details
Site Structure Install date Oyster source ± Size at install (shell height, mm)
Number oysters installed
Brooklyn Bridge Park Community Reef 8/2/2016 Muscongus Bay, ME 2 790,392
Brooklyn Navy Yard* Super Tray Nursery 4/10/2017 Muscongus Bay, ME 34.9 2750
Bush Terminal Park Community Reef 6/28/2016 Muscongus Bay, ME 2 969,452
Governors Island EcoDock* Super Tray Nursery 4/10/2017 Muscongus Bay, ME 29.5 7500
Great Kills Harbor Super Tray Nursery
8/23/2016 Muscongus Bay, ME 27.7 15,836
6/12/2017 Great Kills Harbor
(GKH) oyster garden broodstock
4.1 141,327
Lemon Creek Lagoon Bagged shell reef Not yet installed
Lemon Creek Nursery OysterGro Nursery 6/12/2017 GKH oyster garden broodstock 4.1 228,780
* Details for Brooklyn Navy Yard and Governors Island EcoDock only represent a fraction of the oysters at the sites.
± See text for complete explanation of oyster sources.
Restoration Structures
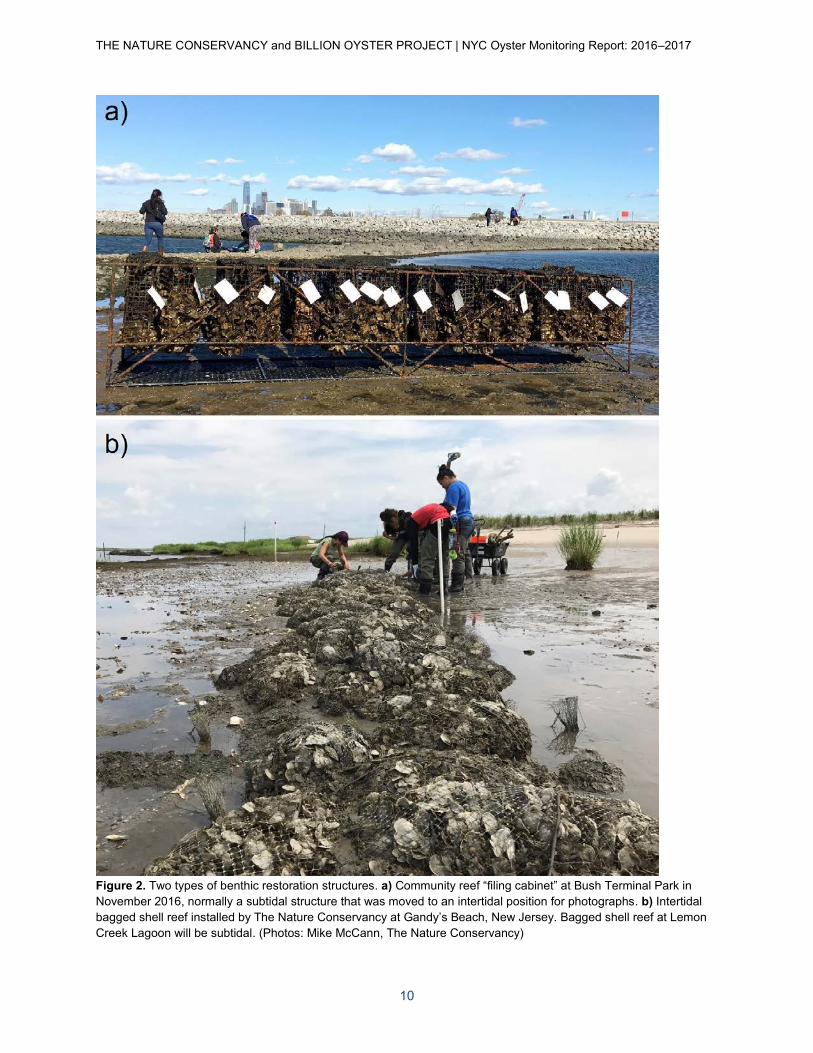
Due to the site conditions and goals at each site, different restoration approaches were used. All sites are subtidal or floating on the water surface. Community reefs are steel rebar structures that hold cages of oyster off the bottom (Fig. 2a). These structures allow the cages to be removed for monitoring above the water surface. The term “nursery” describes restoration sites where oysters are held off the bottom in floating or suspended structures, regardless of the size or age of the oysters. Nursery types include OysterGros (Fig. 3a) and Super Trays (Fig. 3b), both of which are used in commercial aquaculture. Lemon Creek Lagoon will be the home of a bagged shell reef, where mesh bags hold spat on shell directly on the bottom substrate (Fig. 2b). BOP will install bagged shell reefs at Bush Terminal Park and Bayswater State Park in Jamaica Bay in 2018.

THE NATURE CONSERVANCY and BILLION OYSTER PROJECT | NYC Oyster Monitoring Report: 2016–2017
9
Figure 1. The seven oyster restoration sites in New York/New Jersey Harbor described in this document. Oyster Sources
For these BOP restoration sites, spat on shell oysters were produced in two ways: 1) larvae were shipped from Muscongus Bay Aquaculture (Maine) and raised and settled onto recycled oyster shell in the BOP Hatchery on Governors Island, or 2) adult oysters that had been living in oyster gardens at Richmond County Yacht Club (Great Kills Harbor, Staten Island), were conditioned and spawned in the BOP Hatchery and then larvae were set on recycled oyster shell. The adult broodstock was originally from aquaculture sources (either Muscongus Bay, Maine or Fishers Island, New York).
THE NATURE CONSERVANCY and BILLION OYSTER PROJECT | NYC Oyster Monitoring Report: 2016–2017
10
Figure 2. Two types of benthic restoration structures. a) Community reef “filing cabinet” at Bush Terminal Park in November 2016, normally a subtidal structure that was moved to an intertidal position for photographs. b) Intertidal bagged shell reef installed by The Nature Conservancy at Gandy’s Beach, New Jersey. Bagged shell reef at Lemon Creek Lagoon will be subtidal. (Photos: Mike McCann, The Nature Conservancy)

THE NATURE CONSERVANCY and BILLION OYSTER PROJECT | NYC Oyster Monitoring Report: 2016–2017
11
Figure 3. Two types of floating or suspended restoration structures. a) Long-line of floating OysterGros at Billion Oyster Project’s Head of Bay (Jamaica Bay) site. A smaller array of OysterGros is in use at Lemon Creek. b) A stack of Super Trays, which are used at Brooklyn Navy Yard, Great Kills Harbor and Governors Island EcoDock. (Photos: Mike McCann, The Nature Conservancy) Sites Not Included
This document does not report on other BOP restoration sites, including Head of Bay (Jamaica Bay) and Tappan Zee Bridge (Hudson River), whose monitoring is led and reported on by other partners (New York City Department of Environmental Protection and Hudson River Foundation/University of New Hampshire, respectively). Several additional sites will be installed soon, pending permit approval, including Bayswater Point State Park and Paerdegat Basin in Jamaica Bay), Soundview in the Bronx River, Living Breakwaters in Staten Island, and Coney Island Creek in Brooklyn. There are no results to report for these sites yet.

THE NATURE CONSERVANCY and BILLION OYSTER PROJECT | NYC Oyster Monitoring Report: 2016–2017
12
Performance Metrics To assess the performance of oyster restoration at each site, several metrics were developed, focusing on oyster growth, survival, disease and reproduction. These metrics specify qualitative categories that essentially translate to “good,” “OK” and “poor” performance. These metrics do not assess whether the restoration activities are providing ecosystem benefits (e.g., biodiversity enhancement, water quality improvements). Not all metrics can be applied to every site, due to the type of installation, site conditions, age of restoration activity or other constraints. Some metrics are not relevant in the first 1 to 2 years of restoration. For example, the presence of more than one oyster size class would not be expected immediately at a site where juvenile oysters were installed. The eight performance metrics are described in Table 2. Table 2. Performance metrics developed for oysters at restoration sites
Metric Type Metric Explanation Caveats
Growth
1: Increase in shell height in first year as spat on shell
Young spat on shell oysters should increase their shell height rapidly in the first year of planting.
Not all restoration activities use spat on shell. In these cases, this success metric will not apply.
2: Continued increase in shell height after year 1
Growth rates typically slow down in year 2+, but oysters should continue to increase their shell height.
Does not apply to some new restoration sites.
3: Oysters “reefing” or cementing to each other or gear
As oysters increase in size, they should “reef” or cement to each other and gear.
In some cases, oysters will not cement because 1) they are handled to prevent cementing as dictated by the gear type, or 2) the site is a high-energy environment (i.e., lots of wave action or current).
Survival 4: Oyster density stabilized after initial mortality
As spat, oysters naturally have a high mortality rate. After this initial period, survival increases and density of oysters (i.e., number of oysters per clump or number of oysters per m2) should stabilize.
At some sites, as oysters transition from loose clumps to cemented or “reefed” density, measurements transition from “oysters per clump” to “oysters per m2.” This makes density comparisons over this period difficult.
Disease 5: Disease prevalence and intensity are low
Prevalence and intensity of oyster disease (Dermo, MSX) should be low.
Not done at all sites because 1) testing is costly, 2) disease loads are expected to be low in small/young (< 1 year old) oysters, and 3) disease testing requires sacrificing oysters (n = 30) at each sampling point.
Reproduction
6: Gonads conditioned Qualitative or quantitative assessments of gonad condition should show gonads that are ripe and ready to spawn.
Assessing gonad condition requires sacrificing oysters (n = 30) at each sampling point, so it may not be done at small restoration sites. Small or young oysters also will not have conditioned gonads.
7: Sex ratio near 50:50
Oysters switch sexes as they mature, typically from male to female. An even (50:50) sex ratio will increase the odds of successful reproduction.
See caveats for Performance Metric 5, related to disease testing.
8: Multiple size classes of oysters present
After 3 or more years, more than one size class of oysters should be present, representing successful reproduction.
Reproduction and recruitment are not expected in the first 1 to 2 years of restoration. Reproduction may occur at some sites, but they may be “source” sites that export larvae elsewhere.

THE NATURE CONSERVANCY and BILLION OYSTER PROJECT | NYC Oyster Monitoring Report: 2016–2017
13
Assessing Performance at Each Site The oyster performance metrics were applied to the six sites where oysters were installed in 2016 or 2017 (excluding Lemon Creek Lagoon, where oyster restoration had not yet occurred). At Great Kills Harbor, where oysters were installed in both 2016 and 2017, the two cohorts were evaluated separately. Table 3 provides a high-level overview of oyster performance at each site. As stated earlier, quantitative thresholds to categorize results have not been developed at this point, but an assessment equivalent to “good,” “OK” and “poor” performance is indicated on Table 3 as green, yellow, and red, respectively. Table 3. Oyster performance metrics for NY/NJ Harbor sites (continued on next page)
Growth Survival
Site
1: Increase in
shell height in
first year as spat
on shell
2: Continued
increase in shell
height after year 1
3: Oysters
"reefing" or
cementing to each
other or gear
4: Oyster density
stabilized after initial
mortality
Brooklyn Bridge Park Community Reef
Moderate 2 mm (8/2016)
22.3 mm (11/2016)
No 22.3 mm (11/2016) 22.1 mm (7/2017)
No Declining
32.7 oysters/clump (8/2016) 7.4 oysters/clump (11/2016) 2.6 oysters/clump (7/2017)
Brooklyn Navy Yard Nursery
NA (installed as 1+ yr)
Yes 29.5 mm (4/2017) 39.9 mm (7/2017)
56.2 (11/2017)
Light High-energy environment
Stable 5 oysters/clump (4/2017) 4 oysters/clump (7/2017)
Bush Terminal Park Community Reef
Rapid 2 mm (6/2016)
46.9 mm (11/2016)
Yes 46.9 mm (11/2016) 68.8 mm (9/2017)
Yes
NA (due to reefing, oyster density protocols were adapted in 2017, and
survival determination will occur in 2018)
Governors Island EcoDock
NA (installed as 1+ yr)
Yes 34.9 mm (4/2017) 48.5 mm (7/2017) 69.8 mm (11/2017)
Light High-energy environment
Stable 5.5 oysters/clump (4/2017) 4.8 oysters/clump (7/2017)
Great Kills Harbor Nursery – 2016
installation NA (installed as 1+ yr)
Yes 53.5 mm (11/2016) 92.2 mm (9/2017)
Yes However, oysters were maintained to prevent
cementing to gear.
Stable 5.3 oysters/clump (11/2016) 2.4 oysters/clump (8/2017) 1.9 oysters/clump (11/2017)
Great Kills Harbor Nursery – 2017
installation
Rapid 4.1 mm (6/2017)
33.5 mm (9/2017)
NA (installation is <1 year old)
Yes However, oysters were maintained to prevent
cementing to gear.
NA (oysters are <1 year old)
Lemon Creek Nursery Rapid
4.1 mm (6/2017) 36.6 mm (9/2017)
NA (installation is <1 year old)
Yes However, oysters were maintained to prevent
cementing to gear. NA (oysters are <1 year old)

THE NATURE CONSERVANCY and BILLION OYSTER PROJECT | NYC Oyster Monitoring Report: 2016–2017
14
Table 3. (continued from previous page)
Disease Reproduction
Site 5: Disease prevalence
and intensity is low
6: Oyster
gonads
conditioned 7: Sex ratio ~50:50
8: Multiple size
classes of
oysters present
Brooklyn Bridge Park Community Reef
NA (no large oysters present)
NA (gonad conditioning not
expected in small or young oysters)
NA (gonad conditioning not expected in small or young
oysters)
NA (not expected until 3+ years)
Brooklyn Navy Yard Nursery
Moderate Dermo prevalence: 47% Dermo intensity max: 2/5
(7/2017) Dermo prevalence: 0% MSX prevalence: 10%
(11/2017)
Not sampled during appropriate months
All Males Males: 100% Females: 0%
(n = 4, 11/2017) *small sample size
NA (not expected until 3+ years)
Bush Terminal Park Community Reef
Low Dermo prevalence: 3.3% MSX prevalence: 3.3%
(11/2017)
Not sampled during appropriate months
Mostly Males Males: 67%
Females: 33% (n = 6, 11/2017)
*small sample size
NA (not expected until 3+ years)
Governors Island EcoDock
Moderate Dermo prevalence: 6.6% MSX prevalence: 20%
(11/2017)
Not sampled during appropriate months
Mostly Males Males: 86%
Females: 14% (n = 7, 11/2017)
*small sample size
NA (not expected until 3+ years)
Great Kills Harbor Nursery – 2016
installation
Low Dermo prevalence: 13.3%
MSX prevalence: 0% (11/2017)
Not sampled during appropriate months
~50:50 Males: 54%
Females: 46% (n = 26, 11/2017)
NA (not expected until 3+ years)
Great Kills Harbor Nursery – 2017
installation
NA (<1 year old oysters not sampled)
NA (gonad conditioning not
expected in small or young oysters)
NA (gonad conditioning not expected in small or young
oysters)
NA (not expected until 3+ years)
Lemon Creek Nursery NA (<1 year old oysters not sampled)
NA (gonad conditioning not
expected in small or young oysters)
NA (gonad conditioning not expected in small or young
oysters)
NA (not expected until 3+ years)
The remainder of the document reports in greater detail on the data and analyses used to complete this assessment, as well as potential explanatory factors (e.g., water quality, food availability) and pilot efforts to measure the effect of oyster restoration on species composition and abundance.
THE NATURE CONSERVANCY and BILLION OYSTER PROJECT | NYC Oyster Monitoring Report: 2016–2017
15
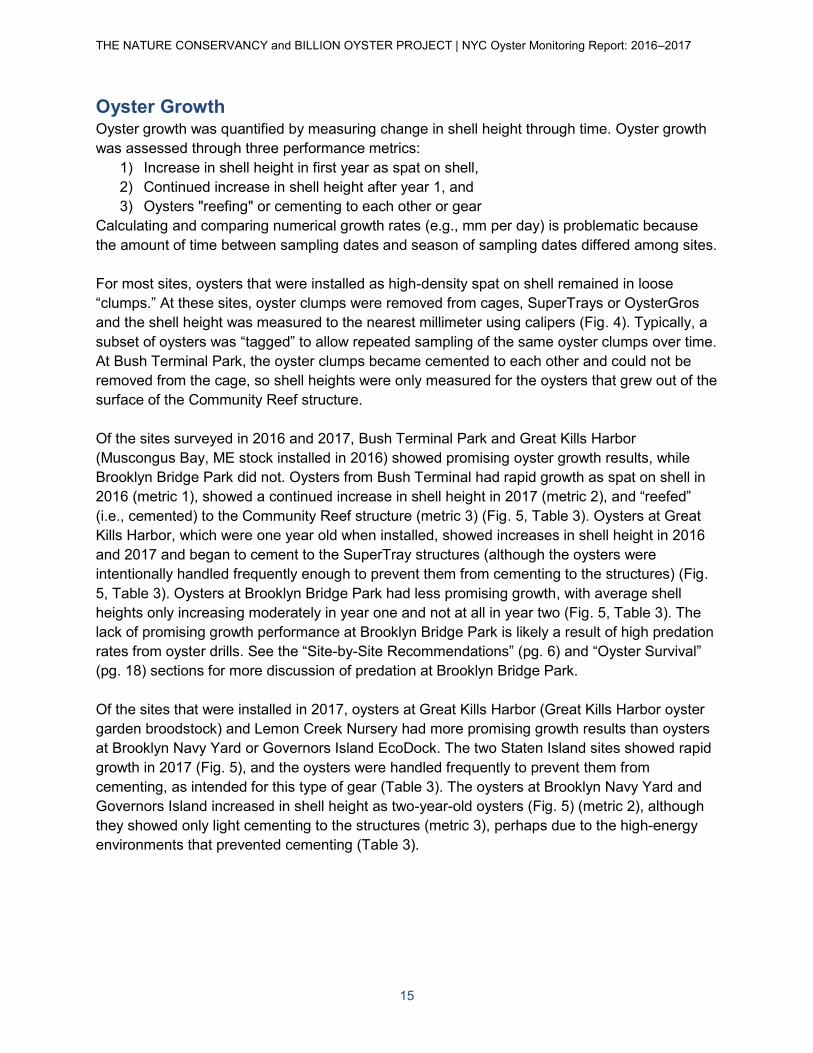
Oyster Growth Oyster growth was quantified by measuring change in shell height through time. Oyster growth was assessed through three performance metrics:
1) Increase in shell height in first year as spat on shell, 2) Continued increase in shell height after year 1, and 3) Oysters "reefing" or cementing to each other or gear
Calculating and comparing numerical growth rates (e.g., mm per day) is problematic because the amount of time between sampling dates and season of sampling dates differed among sites. For most sites, oysters that were installed as high-density spat on shell remained in loose “clumps.” At these sites, oyster clumps were removed from cages, SuperTrays or OysterGros and the shell height was measured to the nearest millimeter using calipers (Fig. 4). Typically, a subset of oysters was “tagged” to allow repeated sampling of the same oyster clumps over time. At Bush Terminal Park, the oyster clumps became cemented to each other and could not be removed from the cage, so shell heights were only measured for the oysters that grew out of the surface of the Community Reef structure. Of the sites surveyed in 2016 and 2017, Bush Terminal Park and Great Kills Harbor (Muscongus Bay, ME stock installed in 2016) showed promising oyster growth results, while Brooklyn Bridge Park did not. Oysters from Bush Terminal had rapid growth as spat on shell in 2016 (metric 1), showed a continued increase in shell height in 2017 (metric 2), and “reefed” (i.e., cemented) to the Community Reef structure (metric 3) (Fig. 5, Table 3). Oysters at Great Kills Harbor, which were one year old when installed, showed increases in shell height in 2016 and 2017 and began to cement to the SuperTray structures (although the oysters were intentionally handled frequently enough to prevent them from cementing to the structures) (Fig. 5, Table 3). Oysters at Brooklyn Bridge Park had less promising growth, with average shell heights only increasing moderately in year one and not at all in year two (Fig. 5, Table 3). The lack of promising growth performance at Brooklyn Bridge Park is likely a result of high predation rates from oyster drills. See the “Site-by-Site Recommendations” (pg. 6) and “Oyster Survival” (pg. 18) sections for more discussion of predation at Brooklyn Bridge Park. Of the sites that were installed in 2017, oysters at Great Kills Harbor (Great Kills Harbor oyster garden broodstock) and Lemon Creek Nursery had more promising growth results than oysters at Brooklyn Navy Yard or Governors Island EcoDock. The two Staten Island sites showed rapid growth in 2017 (Fig. 5), and the oysters were handled frequently to prevent them from cementing, as intended for this type of gear (Table 3). The oysters at Brooklyn Navy Yard and Governors Island increased in shell height as two-year-old oysters (Fig. 5) (metric 2), although they showed only light cementing to the structures (metric 3), perhaps due to the high-energy environments that prevented cementing (Table 3).

THE NATURE CONSERVANCY and BILLION OYSTER PROJECT | NYC Oyster Monitoring Report: 2016–2017
16
Figure 4. a) Billion Oyster Project Education Outreach Manager Robina Taliaferrow measuring shell heights of oysters growing in clumps at Lemon Creek Nursery. (Photo: Cheryl Bennett, The Nature Conservancy) b) Clump of oysters from Great Kills Harbor Nursery. The thin “fingernail” along the edge of the shell indicates recent, rapid growth. (Photo: Mike McCann, The Nature Conservancy)

THE NATURE CONSERVANCY and BILLION OYSTER PROJECT | NYC Oyster Monitoring Report: 2016–2017
17
Figure 5. Shell height (mm) of oysters at Brooklyn Bridge Park, Brooklyn Navy Yard, Bush Terminal Park, Governors Island EcoDock, Great Kills Harbor 2016 installation (MBSOS) and 2017 installation (GKSOS) and Lemon Creek Nursery. Error bars represent 95% confidence intervals.

THE NATURE CONSERVANCY and BILLION OYSTER PROJECT | NYC Oyster Monitoring Report: 2016–2017
18
Oyster Survival Oyster survival was quantified by measuring change in oyster density over time. In most cases, oyster density was measured as the number of oysters per clump, for oysters that started as spat on shell. This method works as long as oysters are not cemented to each other. To measure oyster growth, typically a subset of oysters was “tagged” to allow repeated sampling of the same oyster clumps over time. At Bush Terminal Park, the loose clumps of spat on shell quickly became cemented. Therefore, a quadrat-based method was used to measure the number of oysters per 0.1 m2 quadrat on the surface of the Community Reef cages. Unfortunately, these two methods do not yield data that may be directly compared. As in the case of oyster growth, it is problematic to calculate and compare numerical survival (or mortality) rates because the amount of time between sampling dates and season of sampling dates differed among sites. Also, survival rates depend on the starting density and oyster size. For example, among a clump of oysters that starts out as 40 spat with 2-mm shell height on a single shell, most of these oysters will not survive after two years. Rather than comparing numerical survival values, it is more logical to assess whether oysters reach stable densities after the initial period of mortality (Table 3, metric 4). Brooklyn Navy Yard, Governors Island EcoDock and Great Kills Harbor (Muscongus Bay, ME stock installed in 2016) all had stable oyster densities, whereas oysters at Brooklyn Bridge Park showed a rapid decline in 2016 and continued to decline in density in 2017 (Table 3, Fig. 6). Predatory oyster drills were likely responsible for the low oyster survival at Brooklyn Bridge Park. Although comprehensive oyster drill data were not collected at the site, in October 2016 an average of 45 oyster drills (SD = 14, n = 3) were found in each Community Reef cage. Oysters at both Great Kills Harbor (2017 installation) and Lemon Creek Nursery were less than one year old, so survival monitoring for these populations should continue in 2018. Unfortunately, because a different protocol was used to measure oyster density at Bush Terminal Park, results from 2016 and 2017 are not directly comparable, but data collected in 2018 will paint a better picture of survival at this site.

THE NATURE CONSERVANCY and BILLION OYSTER PROJECT | NYC Oyster Monitoring Report: 2016–2017
19
Figure 6. Oyster survival as number of live oysters per clump at Brooklyn Bridge Park, Brooklyn Navy Yard, Bush Terminal Park, Governors Island EcoDock, Great Kills Harbor 2016 installation (MBSOS) and 2017 installation (GKSOS) and Lemon Creek Nursery. Error bars represent 95% confidence intervals. At Bush Terminal Park, oyster density measurements had to be modified because the oysters showed impressive growth, making results not comparable.

THE NATURE CONSERVANCY and BILLION OYSTER PROJECT | NYC Oyster Monitoring Report: 2016–2017
20
Disease Dermo (Perkinsus marinus) and MSX (Haplosporidium nelsoni) are parasitic protozoan diseases that can infect oysters, with detrimental effects. In November 2017, oysters (n = 30) were collected from Brooklyn Navy Yard, Bush Terminal Park, Governors Island EcoDock and Great Kills Harbor (2016 installation) and sent to Dr. Bassem Allam at the Stony Brook University Marine Animal Disease Lab (SBU MADL) for disease diagnostics. Dermo diagnosis was made using FTM (fluid thioglycollate medium) on mantle and rectal tissues. MSX diagnosis was made using histopathology on formalin-fixed sections. SBU MADL also provided data on shell height, condition index, stage of gonad development, and sex ratio (see below). “Prevalence” refers to the percent of the population that tests positive for a given disease. “Intensity” refers to the degree that an individual oyster is infected with a given disease. Dermo intensity is reported on the Mackin scale from 0 to 5, with 5 being the highest intensity. MSX intensity is reported as “low,” “medium,” or “high.” In addition to the samples sent to SBU MADL in November 2017, Katie McFarland, Ph.D. (postdoc with Matt Hare at Cornell University) analyzed oysters from Brooklyn Navy Yard for prevalence and intensity of Dermo in July 2017. Dermo intensity scores from Cornell were rounded to the next highest value (0, 0.5, 1, 2, 3, 4, or 5) to align with scores reported by SBU MADL. Oysters from Brooklyn Bridge Park, Great Kills Harbor (2017 installation), and Lemon Creek Nursery were not sent for diagnostics because disease and gonad conditioning are not expected in small or young oysters. The shell height of oysters tested was on average above 55 mm (Fig. 7).
Figure 7. Shell height (mm) of oysters from Brooklyn Navy Yard (BNY), Bush Terminal Park (BTP), Governors Island EcoDock (GI), and Great Kills Harbor 2016 installation (GKH) (n = 30 oysters for November 2017, n = 19 for July 2017). Brooklyn Navy Yard oysters sampled in July 2017 were from Fishers Island (FI) and Muscongus Bay (MB) stocks. Error bars represent 95% confidence intervals.

THE NATURE CONSERVANCY and BILLION OYSTER PROJECT | NYC Oyster Monitoring Report: 2016–2017
21
Figure 8. MSX (Haplosporidium nelsoni) prevalence and intensity in oysters from Brooklyn Navy Yard (BNY), Bush Terminal Park (BTP), Governors Island EcoDock (GI), and Great Kills Harbor 2016 installation (GKH) in November 2017 (n = 30 oysters from each site). MSX prevalence and intensity in November 2017 was highest at the Governors Island EcoDock (20%) and lowest at Great Kills Harbor (0%) (Fig. 8). The moderate MSX prevalence at Governors Island EcoDock was surprising for this time of year, as disease prevalence typically peaks during summer months and should be low in November. A relatively high MSX prevalence in November may indicate that prevalence is even higher in the summer months. Dermo prevalence was highest at oysters in Brooklyn Navy Yard in July 2017. Dermo prevalence was 40% for oysters from Muscongus Bay, ME stock that had been at the Brooklyn Navy Yard since 2014 and 55.56% for oysters from Fisher Island, NY stock that had been at the Brooklyn Navy Yard since 2016 (Fig. 9). As expected, all sites had low Dermo prevalence when tested in November 2017, with Great Kills Harbor having the highest Dermo prevalence at 13.33%. Although Dermo prevalence was moderate at some sites, especially in July 2017, Dermo intensity was low at all sites, with no oysters scoring higher than 2 out of 5 on the Mackin scale. The oysters from Brooklyn Navy Yard tested in November 2017 (Muscongus Bay, ME stock at the site since 2017) were from a different stock than those tested in July, so the change in prevalence may reflect both seasonal changes and differences in disease susceptibility of the different stocks.

THE NATURE CONSERVANCY and BILLION OYSTER PROJECT | NYC Oyster Monitoring Report: 2016–2017
22
Figure 9. Dermo (Perkinsus marinus) prevalence and intensity in oysters from Brooklyn Navy Yard (BNY), Bush Terminal Park (BTP), Governors Island EcoDock (GI), and Great Kills Harbor 2016 installation (GKH) (n = 30 oysters for November 2017, n = 19 for July 2017). Brooklyn Navy Yard oysters sampled in July 2017 were from Fishers Island (FI) and Muscongus Bay (MB) stocks. Levinton et al. (2013) found Dermo prevalence well above 50% in oysters held in floating cages for two years in Raritan Bay (> 80%) and Jamaica Bay (> 70%) in September 2009. In that study, oysters held at Pier 40 (Lower Hudson River, off of Manhattan) had low Dermo prevalence in both 2008 and 2009 but high MSX prevalence (~70%) in 2008. The disease levels in the present study were lower than those reported by Levinton et al. (2013), but more testing should be conducted in the summer of 2018, to determine whether this difference is due to seasonal changes.

THE NATURE CONSERVANCY and BILLION OYSTER PROJECT | NYC Oyster Monitoring Report: 2016–2017
23
Condition Index The condition index of oysters from Brooklyn Navy Yard, Bush Terminal Park, Governors Island EcoDock, and Great Kills Harbor (2016 installation) was measured in November 2017. Condition index was calculated in this case as (dry meat weight / dry shell weight) x 100. Other condition indices for oysters exist and many are used in commercial production, with higher values indicating higher quality oysters (i.e., more internal body meat relative to shell). If condition index of the same stock is measured repeatedly over the course of a season, a sudden drop in condition index can indicate spawning or other events. These results provide a snapshot of condition index across sites. Among the four sites sampled in November 2017, Great Kills Harbor had the highest condition index (4.29, SD = 1.14) and Bush Terminal Park had the lowest (1.82, SD = 0.49) (Fig. 10). Evidently, although the oysters at Bush Terminal Park are increasing their shell height rapidly, they are relatively “thin” with small internal body meat, whereas oysters at Great Kills Harbor have both large shell heights and large internal body weights. These two sites represent very different restoration histories and conditions. Oysters at Great Kills Harbor were installed in 2017 as 1-year-old spat on shell in SuperTrays, whereas Bush Terminal Park oysters were 2-mm shell height spat on shell installed in Community Reef cages in 2016. The growth pattern of the Bush Terminal Park oysters resembles that of wild oyster reefs in other regions where oysters increase their shell height rapidly as a result of intraspecific competition for food.
Figure 10. Condition index of oysters from Brooklyn Navy Yard (BNY), Bush Terminal Park (BTP), Governors Island EcoDock (GI), and Great Kills Harbor 2016 installation (GKH) in November 2017 (n = 30 oysters from each site). Error bars represent 95% confidence intervals. Oyster cohort is listed above each site name, where MB = Muscongus Bay, Maine; SOS = spat on shell; and the eight digits represent the date the larvae were set on shell.

THE NATURE CONSERVANCY and BILLION OYSTER PROJECT | NYC Oyster Monitoring Report: 2016–2017
24
Reproductive Status The reproductive status and sex ratio of oysters from Brooklyn Navy Yard, Bush Terminal Park, Governors Island EcoDock, and Great Kills Harbor (2016 installation) were also measured in November 2017.
Figure 11. Stage of reproductive development of oysters from Brooklyn Navy Yard (BNY), Bush Terminal Park (BTP), Governors Island EcoDock (GI), and Great Kills Harbor 2016 installation (GKH) in November 2017 (n = 30 oysters from each site). I = inactive, no gonadal activity; S4 = only residual gametes remain, Undeter = undetermined, gonad tissue rudimentary or absent. Across all sites, all oysters showed either reproductive development stage Inactive (I), with no gonadal activity, or the final spawning stage (S4), in which only residual gametes remain. No oysters in the early stages of gametogenesis (G1, G2), development (D1, D2), ripeness (R), or spawning stages I-III (S1, S2, S3) were observed. This result is not surprising for November, as most spawning likely occurs during the summer months. A large number of oysters were scored as “Undetermined” (U), indicating that gonad tissue was rudimentary or absent from the histological sections. Among the sites, Great Kills Harbor had the highest percentage of oysters that showed some gonadal activity and were clearly identified by sex. At this site, only 13.3% of oysters were scored as Undetermined (Fig. 11). The sex ratio was near 50:50 and 10% of oysters were in spawning stage IV (S4), suggesting that spawning may have occurred at Great Kills Harbor. Bush Terminal Park was the only other site that included spawning stage IV (S4) oysters, although they represented a small fraction of the population (1/30 oysters). Finally, at Brooklyn Navy Yard only males were present, indicating that this stock faces a challenge to successful spawning.

THE NATURE CONSERVANCY and BILLION OYSTER PROJECT | NYC Oyster Monitoring Report: 2016–2017
25
Point Water Quality Measurements On several sampling dates, point water quality data was measured using a Horiba U-52 multiparameter instrument (Fig. 12). This instrument measures temperature, dissolved oxygen, salinity, pH, conductivity, turbidity and total dissolved solids. All samples were taken just below the water surface, adjacent to the restored oysters. Typically, at least three replicate samples taken at least 2 minutes apart were recorded on each sampling date. All sites except for Lemon Creek Lagoon were sampled at least three times during 2017. Because Lemon Creek Lagoon was sampled only once, it is difficult to draw conclusions about the water quality at that site. Figure 13 shows the average values for temperature, dissolved oxygen, salinity and pH, and Figure 14 shows the average values for conductivity, total dissolved solids and turbidity for all seven sites. According to the average water quality values shown in Figures 13 and 14, most of the sites appear to have suitable water quality for oyster restoration to occur (Theuerkauf & Lipcius 2016). All sites had average salinity values that were within suitable ranges for oysters. Average dissolved oxygen values appeared to be suitable at all sites (> 5 mg/L), but the continuous-time water quality results were less promising. Lemon Creek Nursery had a low average pH value (7.07, SD = 1.01), driven by samples taken in September and October 2017. Water samples were taken during very low tides when the oyster nursery was in contact with the anoxic sediment of the creek, driving pH values down. If these low pH values persist during other times of the year, they may pose a threat to oysters at this site (Brown & Hartwick 1988).
Figure 12. TNC Summer Fellow Cheryl Bennett using the Horiba U-52 to record water quality at the Lemon Creek Nursery in August 2017. (Photo: Robina Taliaferrow, Billion Oyster Project)

THE NATURE CONSERVANCY and BILLION OYSTER PROJECT | NYC Oyster Monitoring Report: 2016–2017
26
Figure 13. Average values of temperature, dissolved oxygen, salinity and pH in 2017 based on discrete point sampling for Brooklyn Bridge Park (BBP) (n = 4 sampling dates), Brooklyn Navy Yard (BNY) (n = 3), Bush Terminal Park (BTP) (n = 6), Governors Island (GI) EcoDock (n = 8), Great Kills Harbor (GKH) (n = 6), Lemon Creek (LC) Lagoon (n = 1) and Lemon Creek (LC) Nursery (n = 6). Error bars represent 95% confidence intervals.

THE NATURE CONSERVANCY and BILLION OYSTER PROJECT | NYC Oyster Monitoring Report: 2016–2017
27
Figure 14. Average values of conductivity, total dissolved solids and turbidity in 2017 based on discrete point sampling for Brooklyn Bridge Park (BBP) (n = 4 sampling dates), Brooklyn Navy Yard (BNY) (n = 3), Bush Terminal Park (BTP) (n = 6), Governors Island (GI) EcoDock (n = 8), Great Kills Harbor (GKH) (n = 6), Lemon Creek (LC) Lagoon (n = 1) and Lemon Creek (LC) Nursery (n = 6). Error bars represent 95% confidence intervals.

THE NATURE CONSERVANCY and BILLION OYSTER PROJECT | NYC Oyster Monitoring Report: 2016–2017
28
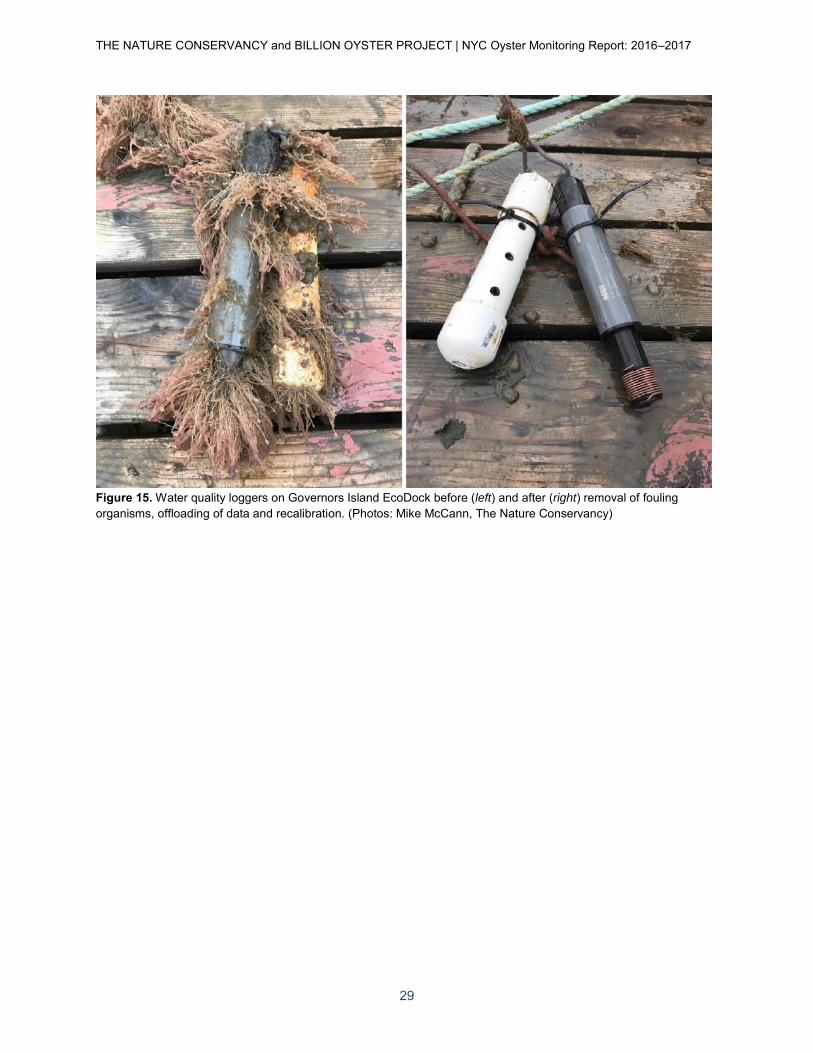
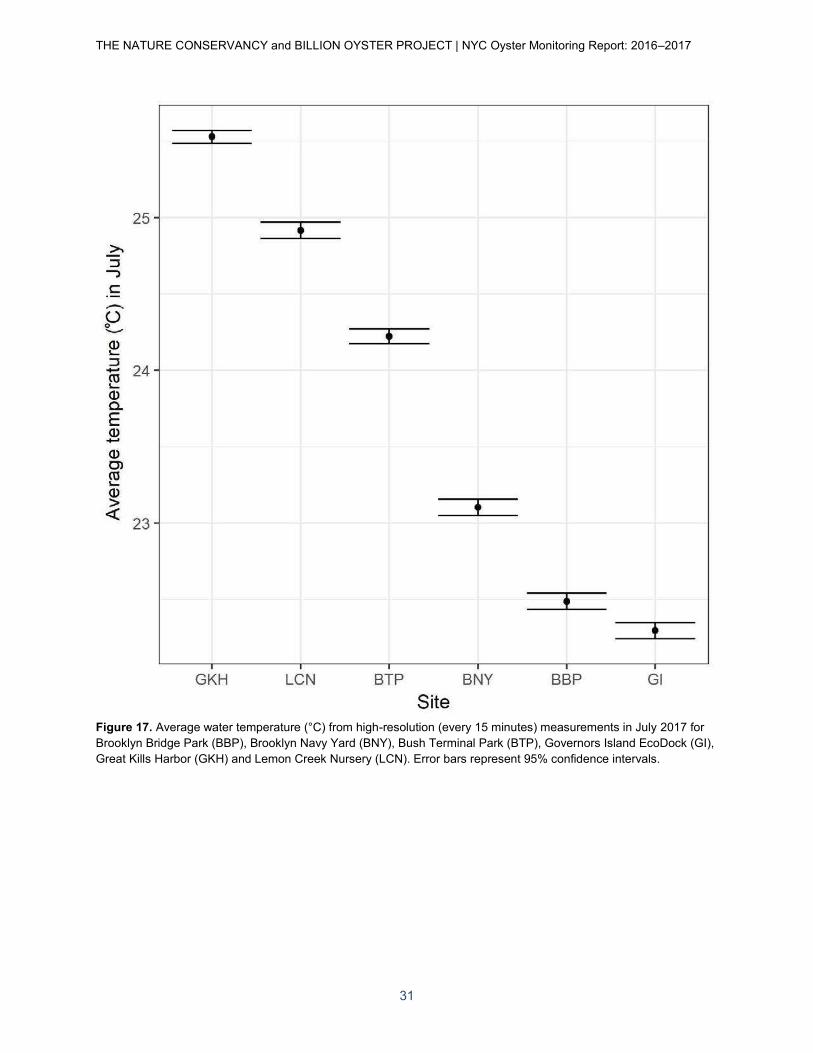
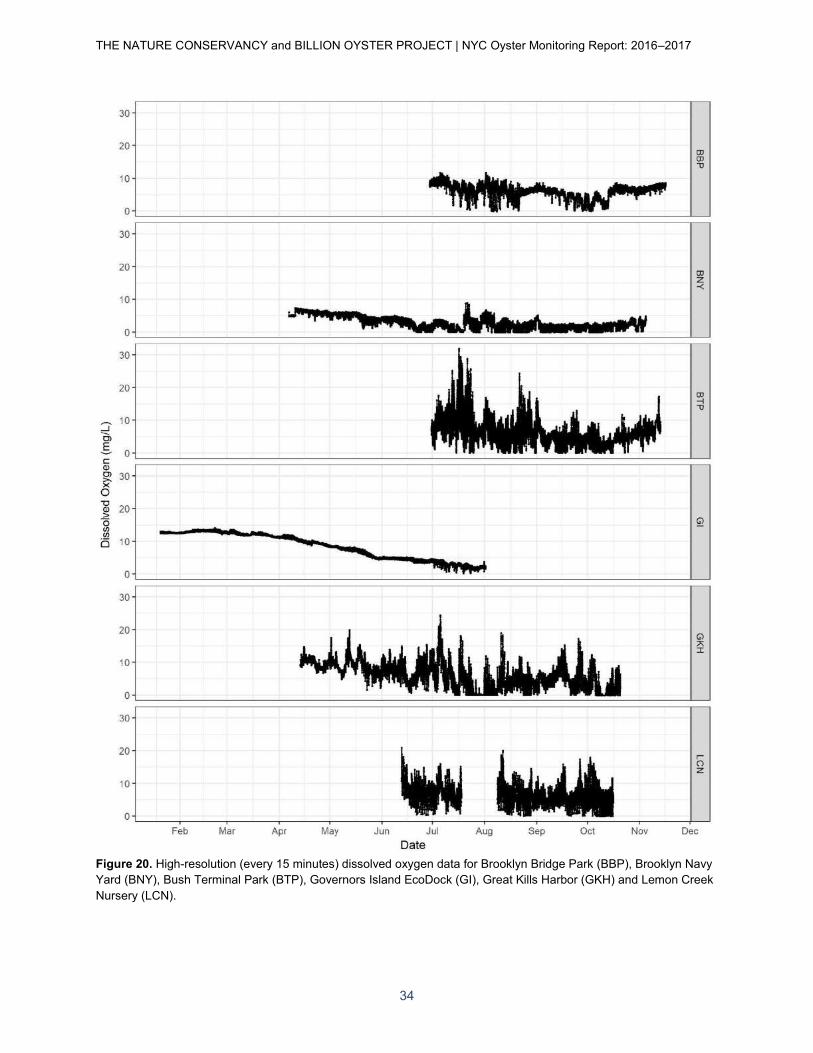
Continuous Water Quality Measurements Although average water quality conditions at a site are important for the success of an oyster restoration, extreme values are also important. For example, extreme low dissolved oxygen events may be more likely to occur in the middle of the night during the summer—an unlikely time for a researcher to be at the site with a water quality probe. Therefore, Onset HOBO water quality loggers (models U-24 and U-26) were deployed at Brooklyn Bridge Park, Brooklyn Navy Yard, Bush Terminal Park, Governors Island EcoDock, Great Kills Harbor and the Lemon Creek Nursery to collect high-resolution dissolved oxygen, salinity and temperature data every 15 minutes on a continuous basis. The loggers were visited several times in 2017 to remove fouling organisms, offload data, and recalibrate by taking an independent water quality measurement with a Horiba U-52 multiparameter instrument (Fig. 15). Onset HOBOware software was used to adjust the dissolved oxygen values on the basis of the salinity time series and to adjust for fouling. Due to differences in the deployment and maintenance schedule and quality assurance protocols, which required some time periods to be excluded, the data from the sites do not span exactly the same time periods. In general, sites closer to the Atlantic Ocean (Great Kills Harbor and Lemon Creek Nursery), and Bush Terminal Park, which is influenced by tides, had higher temperatures (Figs. 16, 17). All sites had an average annual salinity between 17 and 25 ppt, with higher average values at Staten Island sites (Great Kills Harbor and Lemon Creek Nursery), which are closer to the Atlantic Ocean, and at the Brooklyn Navy Yard (Fig. 18). Some sites appear to be more prone to fluctuations in salinity. Salinity at the Lemon Creek Nursery, which is at the mouth of Lemon Creek with freshwater inputs upstream, fell below 10 ppt and even 5 ppt on several occasions, mostly in June and July 2017 (Fig. 19). Brooklyn Navy Yard and Great Kills Harbor both appear to be susceptible to influxes of freshwater, presumably during and after rainfall events (Fig. 19). It is unclear whether low salinity events persist long enough to negatively impact oyster performance at these sites. One of the main findings from the water quality logger data was that all sites frequently have low oxygen events that may negatively impact oysters (Figs. 20, 21). Sustained periods of hypoxia (< 1 mg/L dissolved oxygen) can cause mass mortality of oysters (Lenihan & Peterson 1998). Pollack et al. (2012) use the frequency of low dissolved oxygen events (< 4 mg/L) to model oyster habitat suitability. Dissolved oxygen data were collected from all six sites in June and July 2017 (Fig. 21). Of these sites, Brooklyn Navy Yard and Governors Island EcoDock had the worst dissolved oxygen conditions, with 73.9% of observations in June at Brooklyn Navy Yard and 93.7% of observations at Governors Island EcoDock in July below 4 mg/L (Fig. 21). Brooklyn Bridge Park and Bush Terminal Park had the best dissolved oxygen conditions, with no observations below 4 mg/L in June and fewer than 10% of observations below 4 mg/L in July at both sites (Fig. 21).
THE NATURE CONSERVANCY and BILLION OYSTER PROJECT | NYC Oyster Monitoring Report: 2016–2017
29
Figure 15. Water quality loggers on Governors Island EcoDock before (left) and after (right) removal of fouling organisms, offloading of data and recalibration. (Photos: Mike McCann, The Nature Conservancy)

THE NATURE CONSERVANCY and BILLION OYSTER PROJECT | NYC Oyster Monitoring Report: 2016–2017
30
Figure 16. High-resolution (every 15 minutes) temperature data for Brooklyn Bridge Park (BBP), Brooklyn Navy Yard (BNY), Bush Terminal Park (BTP), Governors Island EcoDock (GI), Great Kills Harbor (GKH) and Lemon Creek Nursery (LCN).
THE NATURE CONSERVANCY and BILLION OYSTER PROJECT | NYC Oyster Monitoring Report: 2016–2017
31
Figure 17. Average water temperature (°C) from high-resolution (every 15 minutes) measurements in July 2017 for Brooklyn Bridge Park (BBP), Brooklyn Navy Yard (BNY), Bush Terminal Park (BTP), Governors Island EcoDock (GI), Great Kills Harbor (GKH) and Lemon Creek Nursery (LCN). Error bars represent 95% confidence intervals.

THE NATURE CONSERVANCY and BILLION OYSTER PROJECT | NYC Oyster Monitoring Report: 2016–2017
32
Figure 18. Average salinity (ppt) from high-resolution (every 15 minutes) measurements in 2017 for Brooklyn Bridge Park (BBP), Brooklyn Navy Yard (BNY), Bush Terminal Park (BTP), Governors Island EcoDock (GI), Great Kills Harbor (GKH) and Lemon Creek Nursery (LCN). Error bars represent 95% confidence intervals.

THE NATURE CONSERVANCY and BILLION OYSTER PROJECT | NYC Oyster Monitoring Report: 2016–2017
33
Figure 19. High-resolution (every 15 minutes) salinity data for Brooklyn Bridge Park (BBP), Brooklyn Navy Yard (BNY), Bush Terminal Park (BTP), Governors Island EcoDock (GI), Great Kills Harbor (GKH) and Lemon Creek Nursery (LCN).
THE NATURE CONSERVANCY and BILLION OYSTER PROJECT | NYC Oyster Monitoring Report: 2016–2017
34
Figure 20. High-resolution (every 15 minutes) dissolved oxygen data for Brooklyn Bridge Park (BBP), Brooklyn Navy Yard (BNY), Bush Terminal Park (BTP), Governors Island EcoDock (GI), Great Kills Harbor (GKH) and Lemon Creek Nursery (LCN).

THE NATURE CONSERVANCY and BILLION OYSTER PROJECT | NYC Oyster Monitoring Report: 2016–2017
35
Figure 21. Percent of high-resolution (every 15 minutes) dissolved oxygen measurements below 4 mg/L for Brooklyn Bridge Park (BBP), Brooklyn Navy Yard (BNY), Bush Terminal Park (BTP), Governors Island EcoDock (GI), Great Kills Harbor (GKH) and Lemon Creek Nursery (LCN) in June and July 2017.

THE NATURE CONSERVANCY and BILLION OYSTER PROJECT | NYC Oyster Monitoring Report: 2016–2017
36
Food Availability As filter feeders, oysters are influenced by the quantity and quality of phytoplankton. In order to assess food quantity at sites, the concentration of chlorophyll a (the main photosynthetic pigment in phytoplankton) was quantified in 2017. At all sites, a known volume of water was filtered on a 0.7-micron glass fiber filter to measure all available chlorophyll a. Additional samples were fractionated between 5 and 20 microns to measure the chlorophyll a that is likely available to oysters (Newell & Langdon 1996). Chlorophyll was extracted from the filters with 90% acetone and quantified via fluorometry with a Turner Designs AquaFluor handheld Fluorometer in the BOP Hatchery on Governors Island (Fig. 22). The chlorophyll a values were corrected via acidification to exclude phaeopigments. On each sampling date, at least three water samples for each filter size were analyzed to quantify variation. The number of sampling dates at each site was unequal, with some sites having one or more samples for almost every month of 2017 (e.g., Governors Island EcoDock), while data were taken on only a single date from Brooklyn Navy Yard. The three sites on Staten Island (Great Kills Harbor, Lemon Creek Lagoon and Lemon Creek Nursery) and Bush Terminal Park had the highest chlorophyll a values, while Brooklyn Bridge Park, Brooklyn Navy Yard, and Governors Island EcoDock, all which are on or near the East River, had lower values (Figs. 23, 24). Lemon Creek Lagoon had the highest average chlorophyll a concentration across all sampling dates (9.31 µg/L, SD = 4.78, between 5 and 20 µm). Brooklyn Navy Yard had the lowest chlorophyll a concentration (0.39 µg/L, SD = 0.02, between 5 and 20 µm), although this result comes from a single sampling date in November. These chlorophyll a results should be viewed as only part of the picture; phytoplankton quality, such as species identity and biochemical composition, may affect oysters as well as quantity.
Figure 22. Billion Oyster Project Research Assistant Technician J Robinson and TNC Summer Fellow Cheryl Bennett measuring chlorophyll a samples in the BOP Hatchery on Governors Island. (Photo: Mike McCann, The Nature Conservancy)

THE NATURE CONSERVANCY and BILLION OYSTER PROJECT | NYC Oyster Monitoring Report: 2016–2017
37
Figure 23. Chlorophyll a concentration for all particles > 0.7 µm and particles between 5 and 20 µm at Brooklyn Bridge Park, Brooklyn Navy Yard, Bush Terminal Park, Governors Island EcoDock, Great Kills Harbor, Lemon Creek Lagoon and Lemon Creek Nursery. Error bars represent 95% confidence intervals.

THE NATURE CONSERVANCY and BILLION OYSTER PROJECT | NYC Oyster Monitoring Report: 2016–2017
38
Figure 24. Average chlorophyll a concentration for particles between 5 and 20 µm in 2017 at Brooklyn Bridge Park (BBP), Brooklyn Navy Yard (BNY), Bush Terminal Park (BTP), Governors Island EcoDock (GI), Great Kills Harbor (GKH), Lemon Creek Lagoon (LCL) and Lemon Creek Nursery (LCN). Error bars represent 95% confidence intervals.

THE NATURE CONSERVANCY and BILLION OYSTER PROJECT | NYC Oyster Monitoring Report: 2016–2017
39
Dissolved Inorganic Nutrients In order to understand the baseline nutrient conditions at the restoration sites, dissolved inorganic nutrients were quantified from water samples collected in 2017. At least three replicate water samples on each sampling date were passed through 0.2-μm syringe filters (Fig. 25) and analyzed by the lab of Dr. Chester Zarnoch (Baruch College) to quantify phosphate (soluble reactive phosphorus) and three forms of nitrogen: nitrate (NO3
-), nitrite (NO2-) and ammonium
(NH4+). Samples were taken on at least two dates from all the sites except for Brooklyn Bridge
Park and Brooklyn Navy Yard. Results for soluble reactive phosphorus and all forms of dissolved inorganic nitrogen (the sum of nitrate, nitrite and ammonium values) are shown in Figures 26–28. Brooklyn Navy Yard and Governors Island EcoDock had some of the highest concentrations of both soluble reactive phosphorus and dissolved inorganic nitrogen, while Lemon Creek Lagoon had the lowest values. These samples were not collected to measure the effects of oyster restoration on nutrient cycling, but rather to provide a baseline understanding of differences in nutrient availability at the restoration sites. A study to quantify the ecosystem benefits of oyster restoration with regard to nutrient cycling would require a more targeted sampling effort, and previous efforts to quantify the effects of oyster restoration on nutrient cycling in NY/NJ Harbor have proven difficult (Hoellein & Zarnoch 2014). Further efforts to understand sediment nutrient levels should be undertaken in summer 2018 to understand the potential of oysters to enhance nitrogen removal via denitrification. At sites where oysters add either carbon or nitrogen to limited sediments, the denitrification rates may be enhanced by the oysters.
Figure 25. Billion Oyster Project Research Assistant Technician J Robinson and Scientist Liz Burmester using syringe filters to collect dissolved inorganic nutrient samples at Lemon Creek Lagoon in August 2017. (Photo: Cheryl Bennett, The Nature Conservancy)

THE NATURE CONSERVANCY and BILLION OYSTER PROJECT | NYC Oyster Monitoring Report: 2016–2017
40
Figure 26. Soluble reactive phosphorus concentration at Brooklyn Bridge Park, Brooklyn Navy Yard, Bush Terminal Park, Governors Island EcoDock, Great Kills Harbor, Lemon Creek Lagoon and Lemon Creek Nursery. Error bars represent 95% confidence intervals.

THE NATURE CONSERVANCY and BILLION OYSTER PROJECT | NYC Oyster Monitoring Report: 2016–2017
41
Figure 27. Dissolved inorganic nitrogen (the sum of nitrate, nitrate and ammonium) concentration at Brooklyn Bridge Park, Brooklyn Navy Yard, Bush Terminal Park, Governors Island EcoDock, Great Kills Harbor, Lemon Creek Lagoon and Lemon Creek Nursery. Error bars represent 95% confidence intervals.

THE NATURE CONSERVANCY and BILLION OYSTER PROJECT | NYC Oyster Monitoring Report: 2016–2017
42
Figure 28. Average soluble reactive phosphorus concentration and dissolved inorganic nitrogen (nitrate, nitrate and ammonium) in 2017 at Brooklyn Bridge Park (BBP), Brooklyn Navy Yard (BNY), Bush Terminal Park (BTP), Governors Island (GI) EcoDock, Great Kills Harbor (GKH), Lemon Creek Lagoon (LCL) and Lemon Creek Nursery (LCN). Error bars represent 95% confidence intervals.

THE NATURE CONSERVANCY and BILLION OYSTER PROJECT | NYC Oyster Monitoring Report: 2016–2017
43
Biodiversity Oyster beds and reefs increase the three-dimensional complexity of the bottom environment and typically support greater biodiversity than adjacent, non-structured habitat, such as muddy or sandy bottoms. Most of the research on biodiversity enhancement by oyster beds comes from other estuaries, such as Chesapeake Bay, the southeastern United States, and the Gulf of Mexico (Peterson et al. 2003, zu Ermgassen et al. 2016). The degree to which restored oysters enhance populations of fish, crabs and shrimp depends on biogeographic context, as different estuaries are home to different species. Therefore, a study was initiated in 2017 to understand the role of oyster restoration activities on species abundance and composition at Bush Terminal Park and Lemon Creek Lagoon. At Lemon Creek Lagoon, biodiversity data collected in 2017 will serve as a baseline for comparison after a bagged shell reef and other substrates are installed in 2018. Seining was conducted on July 3 and July 11, 2017. Trapping was conducted on July 3, July 11, August 3 and August 30, 2017. Seining was not conducted in August, because sea lettuce (Ulva sp.) cover was extremely high, preventing an efficient and humane sorting of the seine catch. Seining was conducted on the sandy/muddy substrate in the center of the lagoon, where the bagged shell reef will likely be installed in 2018 (Fig. 31a). Trapping was conducted directly on the sandy/muddy substrate in the center of the lagoon and in the macroalgae beds on the northern shore of the lagoon (Fig. 31a). At Bush Terminal Park, seining and trapping were conducted on June 30, July 12 and September 1, 2017. Seining was conducted with a 30-foot seine adjacent to the Community Reef (within 10 m) and on a reference site > 100 m away that had a similar sandy/muddy substrate (Figs. 29, 31b). Trapping was conducted with minnow traps directly on the Community Reef, on rocky/rip-rap (> 10 m) and on sandy/muddy substrate (> 10 m) (Figs. 30, 31b).

THE NATURE CONSERVANCY and BILLION OYSTER PROJECT | NYC Oyster Monitoring Report: 2016–2017
44
Figure 29. Billion Oyster Project Community Reefs Regional Manager Tanasia Swift and a New York Harbor School intern seining at Bush Terminal Park. (Photo: Mike Treglia, The Nature Conservancy)
Figure 30. Minnow traps prior to deployment at Bush Terminal Park. (Photo: Mike McCann, The Nature Conservancy)

THE NATURE CONSERVANCY and BILLION OYSTER PROJECT | NYC Oyster Monitoring Report: 2016–2017
45
Figure 31. Aerial images of sites for 2017 biodiversity study, indicating locations and substrates of seining and trapping: a) Lemon Creek Lagoon and b) Bush Terminal Park (modified from Google Maps).

THE NATURE CONSERVANCY and BILLION OYSTER PROJECT | NYC Oyster Monitoring Report: 2016–2017
46
Taxonomic Richness
Across all sampling dates, 19 taxa were observed at Bush Terminal Park and 22 taxa were observed at Lemon Creek Lagoon via seining and trapping. The following taxa were observed at Bush Terminal Park:
● Anchovy (Anchoa mitchili) ● American eel (Anguilla rostrata) ● Four-spined stickleback (Apeltes quadracus) ● unspecified Blenny or Goby (Blennioidei/Gobiidae) ● Blue crab (Callinectes sapidus) ● Sand shrimp (Crangon septemspinosa) ● unspecified Fundulus (Fundulus spp.) ● Mummichog (Fundulus heteroclitus) ● Striped killifish (Fundulus majalis) ● Atlantic silverside (Menidia menidia) ● Ctenophore (Mnemiopsis leidyi) ● Striped bass (Morone saxatilis) ● Toadfish (Opsanus tau) ● Grass shrimp (Palaemonetes spp.) ● Mud crab (Panopeus herbstii) ● Summer flounder (Paralichthys dentatus) ● Bluefish (Pomatomus saltarix) ● Winter flounder (Pseudopleuronectes americanus) ● Scup (Stenotomus chrysops)
The following taxa were observed at Lemon Creek Lagoon:
● Anchovy (Anchoa mitchili) ● American eel (Anguilla rostrata) ● Four-spined stickleback (Apeltes quadracus) ● unspecified Blenny or Goby (Blennioidei/Gobiidae) ● Blue crab (Callinectes sapidus) ● unspecified Herring (Clupeidae) ● Sand shrimp (Crangon septemspinosa) ● Sheepshead minnow (Cyprinodon variegatus) ● Mummichog (Fundulus heteroclitus) ● Striped killifish (Fundulus majalis) ● unspecified Fundulus (Fundulus spp.) ● Atlantic silverside (Menidia menidia) ● Ctenophore (Mnemiopsis leidyi) ● Striped bass (Morone saxatilis) ● Toadfish (Opsanus tau) ● Grass shrimp (Palaemonetes spp.) ● Mud crab (Panopeus herbstii) ● Summer flounder (Paralichthys dentatus)

THE NATURE CONSERVANCY and BILLION OYSTER PROJECT | NYC Oyster Monitoring Report: 2016–2017
47
● Bluefish (Pomatomus saltarix) ● Winter flounder (Pseudopleuronectes americanus) ● Scup (Stenotomus chrysops)
At both sites, seining collected a greater richness of taxa than did trapping. At Bush Terminal Park, seining yielded 15 taxa adjacent to the Community Reef, compared with 13 taxa from a similar sandy/muddy substrate > 100 m away (across all dates). However, taxonomic richness results from the two locations might not be directly comparable because seining effort was generally greater adjacent to the Community Reef. Across the entire 2017 season, the cumulative taxonomic richness measured by trapping was greatest on rocky rip-rap, followed by sandy/muddy substrate and then the Community Reef (5, 4, and 3 taxa, respectively), although the taxonomic richness on each habitat type varied on each of the three sampling dates. At Lemon Creek Lagoon, trapping yielded 6 taxa on algae and 5 on sand/mud substrate (across all dates). Seining only occurred on a single substrate (sandy/muddy bottom) at Lemon Creek Lagoon. Abundance
Both seining and trapping efforts were standardized to catch per unit effort (CPUE). In the case of seining, CPUE is expressed in terms of individuals caught per square meter seined (net length x distance net was swept). In the case of trapping, CPUE is expressed in terms of individuals caught per trap hour. At Bush Terminal Park, of the taxa caught by trapping, Grass shrimp (Palaemonetes spp.) and Ctenophore (Mnemiopsis leidyi) were among the most abundant. There were no strong patterns suggesting differences in abundance (CPUE) among habitat types (Community Reef, rip-rap, and sand/mud) (Fig. 32). Of the taxa caught by seining, Atlantic silverside (Menidia menidia) and Ctenophore (Mnemiopsis leidyi) were among the most abundant, followed by Blue crab (Callinectes sapidus), Grass shrimp (Palaemonetes spp.), Winter flounder (Pseudopleuronectes americanus) and others. There were no strong patterns suggesting differences in abundance (CPUE) between habitat types (adjacent to the Community Reef and a reference site with similar substrate) (Fig. 33). At Lemon Creek Lagoon, of the taxa caught by trapping, Mummichog (Fundulus heteroclitus), Grass shrimp (Palaemonetes spp.), Blue crab (Callinectes sapidus) and Ctenophore (Mnemiopsis leidyi) were among the most abundant (Fig. 34). Of the taxa caught by seining, Mummichog (Fundulus heteroclitus), Grass shrimp (Palaemonetes spp.) and Four-spined stickleback (Apeltes quadracus) were among the most abundant, followed by Striped killifish (Fundulus majalis), Blue crab (Callinectes sapidus), Atlantic silverside (Menidia menidia) and others (Fig. 35). A previous study in NY/NJ Harbor failed to detect an increased abundance of mobile fish and crustaceans on or near restored oysters, compared with reference sites (Peterson & Kulp 2012). In that study, the authors attributed this finding to the small scale of the oyster restoration (~50 m2), which may also be a factor in the results from Bush Terminal Park in the present study. In
THE NATURE CONSERVANCY and BILLION OYSTER PROJECT | NYC Oyster Monitoring Report: 2016–2017
48
Keyport Harbor, New Jersey, significant changes in species diversity were not detectable among a variety of oyster restoration structures (e.g., reef balls, reef blocks) and the same sites after the structures were removed, but species richness and abundance were typically greater on the restoration structures (Ravit et al. 2012). Biodiversity Conclusions
Efforts to document species composition and abundance at oyster restoration sites should continue in 2018. Seining and trapping are simple, flexible methods that appear to catch different suites of species. Additional methods should also be explored, such as video and methods to target reef residents. Trends of enhanced composition or abundance due to the presence of oysters may take several years to emerge and may not be detectable from small-scale restoration efforts. Larger oyster restoration projects that will be installed in NY/NJ Harbor in the future will represent new opportunities for quantifying the ecosystem service of biodiversity enhancement.

THE NATURE CONSERVANCY and BILLION OYSTER PROJECT | NYC Oyster Monitoring Report: 2016–2017
49
Figure 32. Catch per unit effort (CPUE, individuals caught per trap hour) of fishes, crabs and other taxa caught by minnow traps at Bush Terminal Park on the Community Reef, on rip-rap, and on sandy substrates. Data were combined from June 30, July 12 and September 1, 2017. Each data point represents a single trap-by-date combination. Black points indicate that a species was present, while red points indicate absence. Grey boxes indicate species absences across all dates. Common names of taxa are listed in the text. Images of organisms courtesy of the University of Maryland Integration & Application Network.

THE NATURE CONSERVANCY and BILLION OYSTER PROJECT | NYC Oyster Monitoring Report: 2016–2017
50
Figure 33. Catch per unit effort (CPUE, individuals caught per square meter seined) of fishes, crabs and other taxa caught by seining at Bush Terminal Park on adjacent to the Community Reef and a reference site of similar substrate > 100 m away. Data are combined from June 30, July 12 and September 1, 2017. Each data point represents a single seine haul-by-date combination. Black points indicate that a species was present, while red points indicate absence. Grey boxes indicate species absences across all dates. Common names of taxa are listed in the text. Images of organisms courtesy of the University of Maryland Integration & Application Network.

THE NATURE CONSERVANCY and BILLION OYSTER PROJECT | NYC Oyster Monitoring Report: 2016–2017
51
Figure 34. Catch per unit effort (CPUE, individuals caught per trap hour) of fishes, crabs and other taxa caught by minnow traps at Lemon Creek Lagoon on algae and sandy/muddy substrates. Data are combined from July 3, July 11, August 3 and August 30, 2017. Each data point represents a single trap-by-date combination. Black points indicate that a species was present, while red points indicate absence. Grey boxes indicate species absences across all dates. Common names of taxa are listed in the text. Images of organisms courtesy of the University of Maryland Integration & Application Network.

THE NATURE CONSERVANCY and BILLION OYSTER PROJECT | NYC Oyster Monitoring Report: 2016–2017
52
Figure 35. Catch per unit effort (CPUE, individuals caught per square meter seined) of fishes, crabs and other taxa caught by seining at Lemon Creek Lagoon on sandy/muddy substrates. Data are combined from July 3 and July 11, 2017. Each data point represents a single seine haul-by-date combination. Black points indicate that a species was present, while red points indicate absence. Grey boxes indicate species absences across all dates. Common names of taxa are listed in the text. Images of organisms courtesy of the University of Maryland Integration & Application Network.

THE NATURE CONSERVANCY and BILLION OYSTER PROJECT | NYC Oyster Monitoring Report: 2016–2017
53
References Brown, JR, EB Hartwick. 1988. A habitat suitability index model for suspended tray culture of the Pacific oyster,
Crassostrea gigas Thunberg. Aquaculture and Fisheries Management 19: 109–126. Hoellein, TJ, CB Zarnoch. 2014. Effect of Eastern Oysters (Crassostrea virginica) on sediment carbon and nitrogen
dynamics in an urban estuary. Ecological Applications 24: 271–286. Newell, RIE, CJ Langdon. 1996. Mechanisms and physiology of larval and adult feeding. In The Eastern Oyster
Crassostrea virginica, ed. VS Kennedy, RIE Newell, AF Eble. A Maryland Sea Grant Book: College Park, MD p. 185–229.
Lenihan, HS, CH Peterson. 1998. How habitat degradation through fishery disturbance enhances impacts of hypoxia
on oyster reefs. Ecological Applications 8: 128–140. Levinton, J, M Doall, B Allam. 2013. Growth and mortality patterns of the Eastern Oyster Crassostrea virginica in
impacted waters in coastal waters in New York, USA. Journal of Shellfish Research 32: 417–427. Peterson, B, R Kulp. 2012. Investigating ecological restoration: Enhancement of fisheries due to the presence of
oyster reefs in the Hudson River. Report to the Hudson River Foundation, New York, NY, 40 pp. Peterson, CH, JH Grabowski, SP Powers. 2003. Estimated enhancement of fish production resulting from restoring
oyster reef habitat: Quantitative valuation. Marine Ecology Progress Series 264: 249–264. Pollack, JB, A Cleveland, TA Palmer, AS Reisinger, PA Montagna. 2012. A restoration suitability index model for the
Eastern Oyster (Crassostrea virginica) in the Mission-Aransas Estuary, TX, USA. PLoS ONE 7: e40839. Ravit, B, M Comi, D Mans, C Lynn, F Steimle, S Walsh, R Miskewitz, S Quierolo. 2012. Eastern oysters (Crassostrea
virginica) in the Hudson-Raritan Estuary: Restoration research and shellfishery policy. Environmental Practice 14: 110–129.
Theuerkauf, SJ, RN Lipcius. 2016. Quantitative validation of a habitat suitability index for oyster restoration. Frontiers
in Marine Science 3: 64. zu Ermgassen, PSE, JH Grabowski, JR Gair, SP Powers. 2016. Quantifying fish and mobile invertebrate production
from a threatened nursery habitat. Journal of Applied Ecology 53: 596–606. zu Ermgassen, PSE, MD Spalding, B Blake, LD Coen, B Dumbauld, S Geiger, JH Grabowski, R Grizzle, M
Luckenbach, K McGraw, W Rodney, JL Ruesink, SP Powers, R Brumbaugh. 2013. Historical ecology with real numbers: Past and present extent and biomass of an imperilled estuarine habitat. Proceedings of the Royal Society B 279: 3393–3400.
