new york city’s roadmap to 80 x 50 - nyiso€¦ · new york city’s roadmap to 80x50, september...
TRANSCRIPT

1
NEW YORK CITY’SROADMAP TO 80 X 50
July 18, 2017

2
Sources and Magnitude of NYC’s GHG Emissions Sources and Magnitude of NYC’s GHG Emissions in 2015
Inventory of New York City Greenhouse Gas Emissions in 2015, April 2017

3
Co-BenefitsOur Growing, Thriving City
Our Just and Equitable City
Our Sustainable City
Our Resilient City
Air Quality
Job Development
Quality of Life
Access
Equity
Health and Well Being
Affordability
Resiliency
Innovation

44
Achieving 80 x 50 requires a transition to a cleaner electric grid
30% of citywide GHG emissions come from power plants that generate electricity within and outside the city
24 in-city plants serve NYC and are capable of meeting 80% of the city’s peak demand
On an annual basis the in-city plants provide ~50% of the electricity consumed in the city
NYC Electric Grid Fuel Mix
New York City’s Roadmap to 80x50, September 2016

55
Model Structure
Operating capacity
Commission/retire dates
Operating costs – VOM/FOM
Availability factors
Range of fuel types
Regional demand forecasts
Regional load shapes
Reserve margins
Wheeling costs
Transmission Characteristics
Emissions characteristics
GHG and emission caps
RPS policies
Environmental Policies
Capital cost (for new entries)
Regional flow limits
Fuel price forecasts
Demand
Fuel Supply
Generation Characteristics
Least cost dispatch and
planning
Generation additions by year
Generation retirements by year
Wholesale electricity prices
Reserve margins
Reserve margins
Transmission Characteristics
Emissions
Emission prices
Environmental Policies
Regional flows
Generation by fuel type by year
Demand
Fuel Supply
Generation Characteristics
Renewable Energy Generation
Inputs OutputsXpand

66
We modeled New York and surrounding regions to capture changes in generation capacities, imports, regional policies and emission profiles from City and imports. These regions include: New York, New England, PJM, Ontario and Quebec
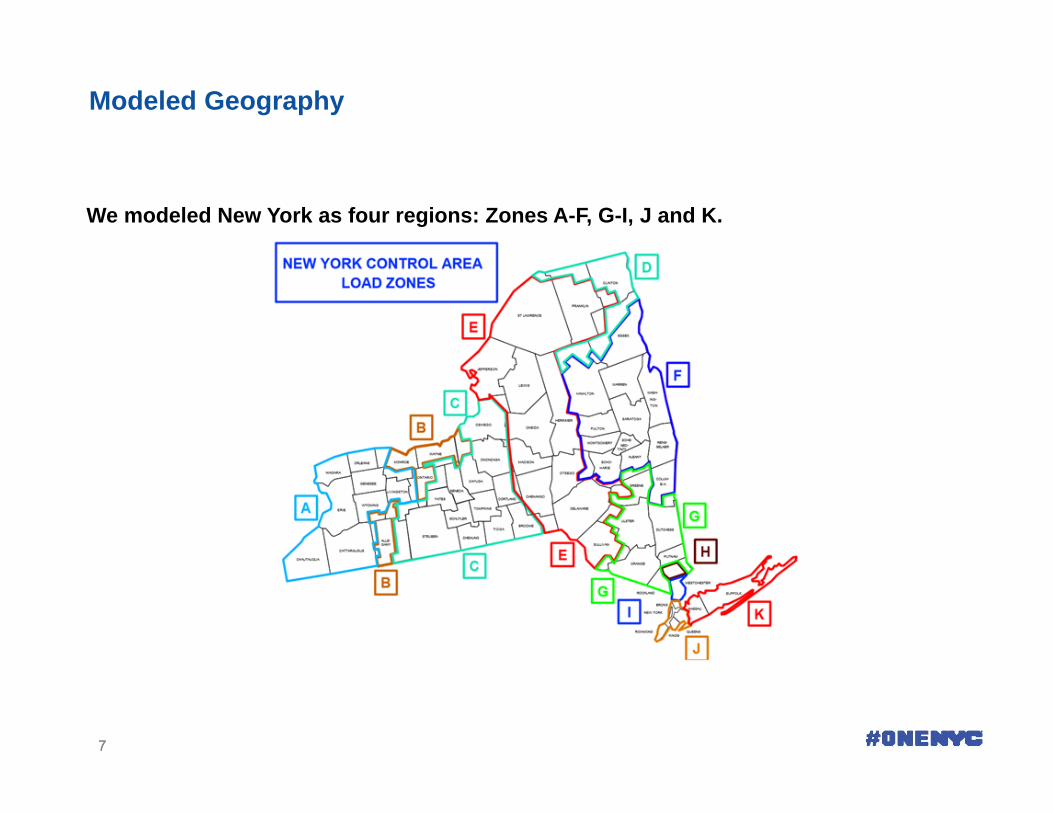
Modeled Geography
77
We modeled New York as four regions: Zones A-F, G-I, J and K.
Modeled Geography

88
Model uses a “pipes and bubbles” constraint to limit transfer between regions▪ All model runs include 1000 MW capacity AC Transmission project between NYISO A-F
and G-I (not shown, 2019 in-service date)
▪ Assumptions for increased transmission in Alternate Reference Cases: ▪ Additional capacity b/w Hydro Quebec and NYISO A-F▪ Additional capacity b/w NYISO G-I and J
Transfer Limits
NYISOA‐F
NYISOG‐I
NYISO J NYISO K
Hydro Quebec
PJMW
PJM E
NEISO
IESO 1,000
1,7901,600
1,850800800
5,075
3,599
1,450
1,050
600
800
4,450
1,999
2,000
1,000
290 235
500
1,975
0
660
758
7581,290
530PJM East to G‐K Constraint: 3,075
NEISO to NY and NY to NEISO Constraint: 1,600
NY to PJM Constraint: 2,225PJM to NY Constraint: 3,350
Zone K imports: 1,700
G‐I to J‐K imports: 5,050
99
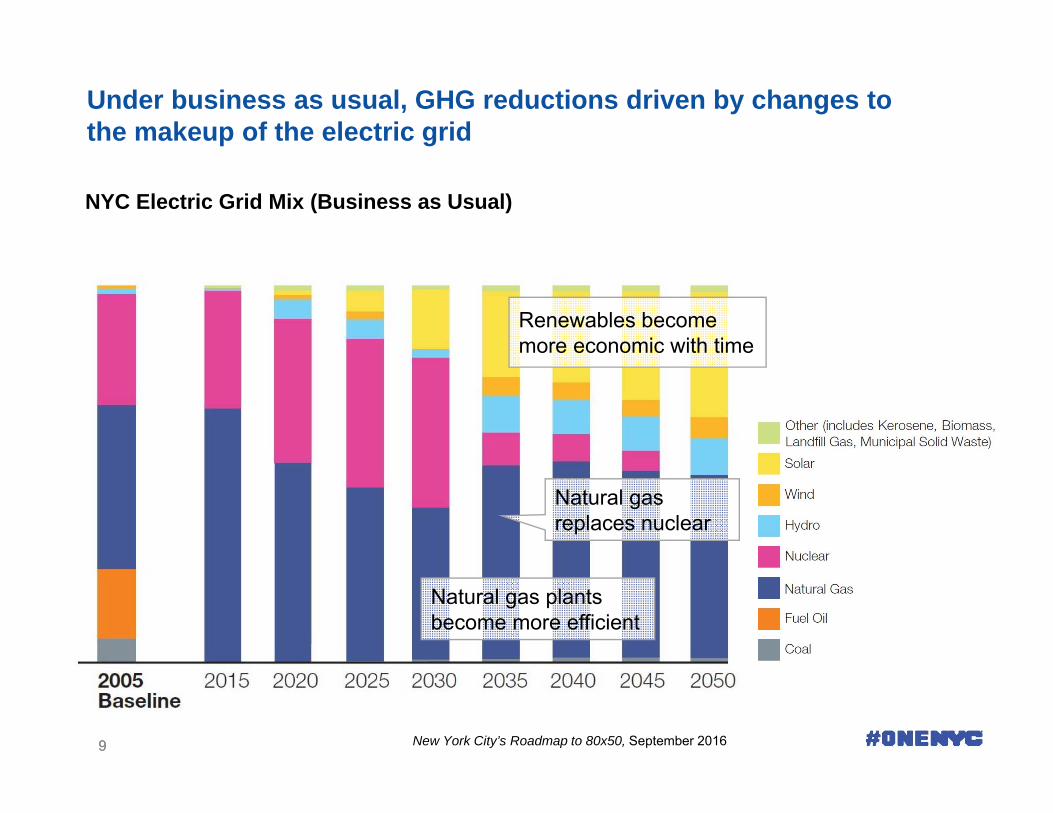
Under business as usual, GHG reductions driven by changes to the makeup of the electric grid
NYC Electric Grid Mix (Business as Usual)
Renewables become more economic with time
Natural gas replaces nuclear
Natural gas plants become more efficient
New York City’s Roadmap to 80x50, September 2016

1010
Electricity alternate reference cases
BAUCloser to 80 X 50
Further from 80 X 50
ReferenceHigh Carbon Intensity Grid
Low Carbon Intensity Grid
Strong EE Adoption
Early Nuclear Retirement
Generation CapacityAt Risk Nuclear RetirementWind Capital CostPV Capital Cost
Fuel PricesNatural Gas Prices
Demand ForecastEnergy GrowthPeak Growth
Regional Transmission CapacityNew Import TransmissionIn-State Transmission
Environmental PoliciesRGGIREV

1111
Other sectors will rely on a low-carbon grid to achieve 80 x 50
Future Carbon Intensity of the Electric Grid 2050 Electric Grid Fuel Mix by Scenario
Low carbon intensity grid
Key Low Carbon Intensity Grid Assumptions▪ New renewables are more economic than natural gas generation▪ Increased transmission within NYCA and between NYISO A-F and Canada▪ Indian Point remains active through 2050OSW was available but was not selected in any of the Alternate Reference Case runs
New York City’s Roadmap to 80x50, September 2016

1212
80 x 50 will require aggressive action across sectors
80x50 Path▪ Modified Low-Carbon Intensity Grid + 1000 MW hydro by 2020 + 1700 MW OSW by 2050 +
Deep Energy Retrofits (40-60% reductions) + 50-60% electrification of heating/hot water systems + 7 GW in-city solar PV
▪ 80x50 path relies upon a grid with >70% renewable content
▪ Requires significant increase in transmission capacity to Zone J
▪ Urgency driven by age of in-city generators and the lead-times associated with transmission projects
▪ Helps achieve GHG goals but also improves local air quality and public health as well as reliability/resiliency of power supply
New York City’s Roadmap to 80x50, September 2016

13
Anthony J. FioreDeputy Commissioner, Energy MgmtNYC Dept. of Citywide Administrative [email protected]
Benjamin MandelRenewable Energy Policy AdvisorNYC Mayor’s Office of [email protected]
Ke WeiSenior Policy Advisor for EnergyNYC Mayor’s Office of Recovery and [email protected]