new york science journal 2014;7(5) … · the use ahp in integrating bsc & td-abc to improve...
TRANSCRIPT

New York Science Journal 2014;7(5) http://www.sciencepub.net/newyork
http://www.sciencepub.net/newyork [email protected] 82
The Use AHP In Integrating BSC & Td-ABC To Improve The Performance Of Commercial Banks
Ahmed Abdel kader Ahmed
Accounting Department, Faculty of Commerce, Al-Azhar University, Egypt [email protected]
Abstract: Although, the BSC has been designed to provide a balanced picture of financial and non-financial perspectives, many companies don’t have realized the potential benefits of these relatively new measurement systems because they fail to correctly identify, analyze and act on the measurements time driven Activity Based Costing (TDABC) is important not only in the process of providing full and in time information which aim at serving both the customer and cost goals. On the other hand, Analytic Hierarchy Process (AHP) is a decision making method used for evaluating various criteria in order to choose the best one while determining critical success criteria. The aim is to create a modeling in order to integrate BSC with TDABC and AHP in order to correctly identify, analyze and act on the measurements and applied this to support process strategic financial &nonfinancial performance of Egyptian banks [Abdelkader, Ahmed. The Use AHP In Integrating Bsc & Td-ABC To Improve The Performance Of Commercial Banks. N Y Sci J 2014:7(5):82-96]. (ISSN: 1554-0200). http://www.sciencepub.net/newyork. 14 Keywords: Balanced Scorecard (BSC); TD-ABC; AHP approach, Performance of commercial banks 1. Introduction: 1.1. Study problem Banks and financial institutions have an important role in (the) progress and the economic development of every country. Currently, Banks are financial institutions which gather their assets from different sources and provide them to sectors requiring liquidity. Therefore, banks are vital arteries of every country. Competition, dynamic and complex found in the banking industry enables the bank to rethink about better ways to measure the performance. Competition within this sector, as well as customer awareness of different services offered by the banks, stimulates most banks and other financial institutions to adopt nonfinancial measures with financial measures in order to acquire competitive ability. Most banks and financial institutions are struggling to go further beyond the application of financial measures. Therefore nonfinancial measures arise as a result of limitations of financial performance measures and the increased prominence of intangible assets, (Niven, P.R (2006)[1]. The concept of Balanced Scorecard (BSC) came out of the perception that no single performance indicator can capture the full complexity of the performance of an organization (Amaratunga, D. Baldry, and Sarshar, M,, 2001)[2]. The BSC has been designed to provide a balanced picture of financial and non-financial perspectives by answering these questions: (a) how do we appear to our shareholders? (b) how do we appear to our customers? (c) what business process must we excel at ?; and (d) how will we sustain our ability to change and improve?.
Although there is an increase in the number of companies that have used the balance scorecard (BSC), which contains financial and nonfinancial performance measurements, few of them have realized the potential benefits of these relatively new measurement systems. This is because they fail to correctly identify, analyze and act on the measurements Otherwise, the scorecard permits a balance between short-term and long-term objectives, as well as between desired outcomes and their corresponding performance drives. So BSC is a multi-goal targeting model that focuses on the decision-making problems where multiple criteria are involved, and since each function of the firm usually comprises a large number of embedded activities that leads the performance drivers of the outcomes. In other words, financial and nonfinancial performance evaluation of banks is considered to be a kind of multi-criteria decision making problem. For such multi-criteria decision making problems, the appropriate assessment of the managerial priority preference among the criteria of performance will play a key role in the solution process. To assess manager's preference explicitly with a preference model, in the current literature, one of the most preferred approaches is the analytic hierarchy process (AHP), as suggested by Falkner and Benhajla [3], and Satty [4] The AHP is a structured method that is used to elicit preference opinion from decision makers, Its methodological procedure can be easily incorporated into multiple objective programming formulations with interactive solution process (see Saaty) [5,6]. The AHP approach involves decomposition of a complex

New York Science Journal 2014;7(5) http://www.sciencepub.net/newyork
http://www.sciencepub.net/newyork [email protected] 83
and unstructured problem into a set of components organized in a multi-level hierarchic form (see Saaty) [5]. A salient feature of the AHP is its ability to quantify decision makers' subjective judgments by assigning their corresponding numerical values based on the relative importance of the factors under consideration. A conclusion can be reached by synthesizing the judgments to determine the overall priorities of variables (see Saaty) [7].
On the other hand, (the) TDABC, just like the traditional ABC, is a costing system in which the sources of the company are used by the activities and activities are used by the cost (Gremco & Yves, L. G, 2007) [8]. In another source, it is defined as an improved version of traditional ABC which helps company estimate the source demand of each process, product and customer with the help of required time to fulfill the activities and the cost of capacity per unit time. However, it is stated in the study that the use of cost carrier only, that is ‘time‘, makes TDABC special system with respect to the traditional ABC (Gremco & Yves, L. G, 2007) [8]. For this reason, it is thought that although the general logic of both methods are the same, there are some significant differences in their functions. Using TDABC-based costing method provides important advantages for presenting performance measures and required critical success factors for all processes. So after integrating TDABC with BSC, companies are evaluated in a correct manner by four different views in terms of target and financial measures by taking the vision and the strategy into consideration. Short- and long-term targets of financial and nonfinancial measures can be seen equally by taking four different views into consideration (Kaplan & Norton 1996) [9] Thus, the problem of this study has emerged from the need to adopt a model to develop an integrated framework by merging the concepts of the BSC, AHP and TDABC in Egyptian banks to identify and rank the performance outcomes and their corresponding performance drivers to realize the potential benefits resulted from using their appropriate mixture. 1.2. Study Significance: The significance of this study stems from shedding the light on the benefits provided to the top management and the firm that would be multiple coming from the integration advantage of respective models. It is also feasible to identify the significant key performance indicators (KPI) of respective dimensions as well as to identify the outcomes of performance drivers or the alternatives of drivers for such indicators and applications. This to develop an integrated framework by merging the concepts of the BSC, AHP and TDABC in the Egyptian banks “Because of the intangible nature of the products and
services provided by banking institutions, one cannot measure the efficiency and competitiveness of banking products and services easily. Most available research works have focused on gauging the productivity and efficiency of banking industry by measuring the outputs, costs, and performance”, (Kosmidou, et al., 2006)[10] 1.3. Study objectives: Although the increased number of companies that have been using financial and nonfinancial performance measurements, few of them have realized the potential benefits of these new measurement systems relatively. This is because they fail to identify, and rank the outcomes and their corresponding performance drivers correctly. This study proposes to identify and rank the outcomes and their corresponding performance drivers in the Egyptian Banks, this study attempts to integrate the framework by merging these outcomes.This study aims at: 1. Attempting to integrate a model that
consolidates the time-driven activity-based costing (TD-ABC) with the balanced score-card (BSC)
2. Identifying the key performance indicators (KPI) of the outcomes and their associated performance drivers by using AHP method
1.4. Study Methodology The intellectual content of this study relies on the inductive methodology of some specialized accounting studies and researches, especially those studies and research that investigate the concepts of its BSC,TDABC and AHP.
This study also relies on the deductive methodology that is applied through a survey on a sample selected via judgmental method,where the researcher selects units to be sampled based on their knowledge and professional judgment. The study is based on primary data was collected by using questionnaire survey delivered to branch managers, vice branch manager of six central branch banks 2. Research Theoretical Framework And Literature Review This part covers the theoretical framework and literature review available on that subject. We start with the evolution of td-abc system. Next, we cover the BSC. and finally, we cover the AHP. 2.1. Time-Driven Activity-Based Costing TDABC is defined as a system which is developed in order to remove problems in implementing and updating the ABC method. Among the advantages of TDABC when they are compared to traditional ABC are easiness, low costs, installation and improvement, flexibility and system simplicity (Kaplan & Anderson, 2004)[11]. The TDABC model
New York Science Journal 2014;7(5) http://www.sciencepub.net/newyork
http://www.sciencepub.net/newyork [email protected] 84
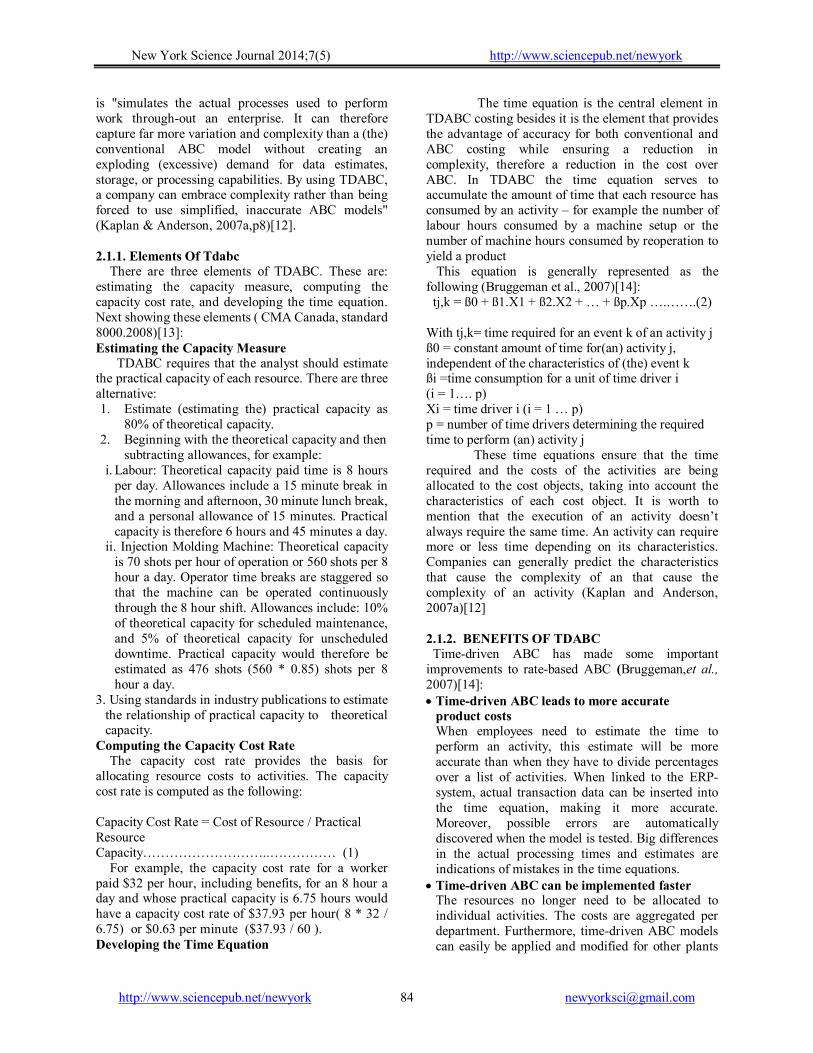
is "simulates the actual processes used to perform work through-out an enterprise. It can therefore capture far more variation and complexity than a (the) conventional ABC model without creating an exploding (excessive) demand for data estimates, storage, or processing capabilities. By using TDABC, a company can embrace complexity rather than being forced to use simplified, inaccurate ABC models" (Kaplan & Anderson, 2007a,p8)[12]. 2.1.1. Elements Of Tdabc There are three elements of TDABC. These are: estimating the capacity measure, computing the capacity cost rate, and developing the time equation. Next showing these elements ( CMA Canada, standard 8000.2008)[13]: Estimating the Capacity Measure TDABC requires that the analyst should estimate the practical capacity of each resource. There are three alternative: 1. Estimate (estimating the) practical capacity as
80% of theoretical capacity. 2. Beginning with the theoretical capacity and then
subtracting allowances, for example: i. Labour: Theoretical capacity paid time is 8 hours
per day. Allowances include a 15 minute break in the morning and afternoon, 30 minute lunch break, and a personal allowance of 15 minutes. Practical capacity is therefore 6 hours and 45 minutes a day.
ii. Injection Molding Machine: Theoretical capacity is 70 shots per hour of operation or 560 shots per 8 hour a day. Operator time breaks are staggered so that the machine can be operated continuously through the 8 hour shift. Allowances include: 10% of theoretical capacity for scheduled maintenance, and 5% of theoretical capacity for unscheduled downtime. Practical capacity would therefore be estimated as 476 shots (560 * 0.85) shots per 8 hour a day.
3. Using standards in industry publications to estimate the relationship of practical capacity to theoretical capacity.
Computing the Capacity Cost Rate The capacity cost rate provides the basis for allocating resource costs to activities. The capacity cost rate is computed as the following: Capacity Cost Rate = Cost of Resource / Practical Resource Capacity………………………..…………… (1) For example, the capacity cost rate for a worker paid $32 per hour, including benefits, for an 8 hour a day and whose practical capacity is 6.75 hours would have a capacity cost rate of $37.93 per hour( 8 * 32 / 6.75) or $0.63 per minute ($37.93 / 60 ). Developing the Time Equation
The time equation is the central element in TDABC costing besides it is the element that provides the advantage of accuracy for both conventional and ABC costing while ensuring a reduction in complexity, therefore a reduction in the cost over ABC. In TDABC the time equation serves to accumulate the amount of time that each resource has consumed by an activity – for example the number of labour hours consumed by a machine setup or the number of machine hours consumed by reoperation to yield a product This equation is generally represented as the following (Bruggeman et al., 2007)[14]: tj,k = ß0 + ß1.X1 + ß2.X2 + … + ßp.Xp ….…….(2) With tj,k= time required for an event k of an activity j ß0 = constant amount of time for(an) activity j, independent of the characteristics of (the) event k ßi =time consumption for a unit of time driver i (i = 1…. p) Xi = time driver i (i = 1 … p) p = number of time drivers determining the required time to perform (an) activity j
These time equations ensure that the time required and the costs of the activities are being allocated to the cost objects, taking into account the characteristics of each cost object. It is worth to mention that the execution of an activity doesn’t always require the same time. An activity can require more or less time depending on its characteristics. Companies can generally predict the characteristics that cause the complexity of an that cause the complexity of an activity (Kaplan and Anderson, 2007a)[12] 2.1.2. BENEFITS OF TDABC Time-driven ABC has made some important improvements to rate-based ABC (Bruggeman,et al., 2007)[14]: Time-driven ABC leads to more accurate
product costs When employees need to estimate the time to perform an activity, this estimate will be more accurate than when they have to divide percentages over a list of activities. When linked to the ERP-system, actual transaction data can be inserted into the time equation, making it more accurate. Moreover, possible errors are automatically discovered when the model is tested. Big differences in the actual processing times and estimates are indications of mistakes in the time equations.
Time-driven ABC can be implemented faster The resources no longer need to be allocated to individual activities. The costs are aggregated per department. Furthermore, time-driven ABC models can easily be applied and modified for other plants

New York Science Journal 2014;7(5) http://www.sciencepub.net/newyork
http://www.sciencepub.net/newyork [email protected] 85
and companies in the same industry, because the processes they use are similar
Time-driven ABC model can be easily altered The model can be updated and aligned with changed circumstances in a simple way. When new activities emerge within the company, it’s sufficient to define the activity and to capture the time equations. Time equations can also be altered easily to the changes occurred in the existing activities.
Time-driven ABC makes overcapacity visible Time-driven ABC works deals with practical capacity. In this way, the percentage of this capacity that is actually used can be checked easily. While the costs of unused capacity are not included in costs calculations.
Time-driven ABC provides information on the efficiency of business processes The time equations demonstrate which characteristics of an activity may require consume a lot of time. Hence, time-driven ABC becomes a tool for the improvement of the efficiency of business processes
Time-driven ABC makes simulations possible For instance, “what-if” analysis can indicate what the impact of,for example, more efficient processes i.e. less time needed and other characteristics of the activity will be.
Time-driven ABC has predictive value When circumstances change, time equations
enable a more accurate estimation of the impact it can have on an organization to occur in terms of both cost and time. Management can predict easily.what the impact of certain decisions on the committed capacity will be. Moreover, they have the ability to predict which amount of their unused capacity can be used for new initiatives.
Time-driven ABC allows enterprise-wide systems Time-driven ABC can be easily integrated and linked in the monthly, enterprise-wide profitability reports and the ERP-system.
Time-driven ABC provides a faste under standing in profitability
By linking time-driven ABC to the ERP-system, profitability reports on customers, products … can be generated directly after the closure of the period. Profitability reports on customers, products …. (etc) can be generated directly after the closure of the period by linking (the) time-driven ABC to with the ERP-system. Time-driven ABC creates information to
negotiate with trading partners Time-driven ABC provides understanding in the actual costs and profitability of processes and cost objects. Complex processes can be identified and reported easily. Hence, negotiations with customers
and suppliers can be based on more sustainable grounds. 2.2. BALANCED SCORECARD In the nineties of the last century, Kaplan and Norton led a research study of a dozen companies exploring new methods of performance measurement (Niven, 2002, p 11)[15]. This study stem from the a growing belief that the financial measures of performance were ineffective for the modern enterprise since the financial perspectives are criticized as they have been focused on short-term basis, directed to the past, do not support the strategic implementation , do not compromise the realities of business world, are not being related to most divisions of the company and cause the company to be divided into sections (Otley, 1999)[16]. Search study Kaplan and Norton about the new method to measure the performance resulted in the idea that the Scorecard features the performance measures capturing activities from throughout the organization-customer issues, internal business processes, employee activities, and of course shareholder concerns. This approach functions as an action plan that establishes the base for performing the strategy expressed with in terms of critical success factors. The BSC method classifies the vision and strategy of the company in four perspectives in which financial and non financial measures are used ( Kaplan & Norton, 1992; Veen-Dirks & Wijn, 2002 )[17-18].
Financial perspective. Customer perspective. Internal Business Process perspective
Learning and Developing perspective. The following is a description of the BSC perspectives based on Kaplan and Norton Financial perspective: convey the economic consequences for the actions already taken by the organization, and focus on the profitability related measures on which the shareholders verify the profitability of their investment. Therefore, the managers are required to generate measures according to this prospective, that answer the following question: “how should we appear to our shareholders?" Kaplan and Norton acknowledged the need for traditional financial data. The accurate and timely financial data are necessary for the efficient and smooth direction of the organization. The provision of the right and timely financial data for the right person in the organization helps much in the process of making the right decision in the right moment. According to this perspective, the most common performance measures incorporated are:ROI, Cash Flow,Net Operating Income, Revenue Growth, etc. Customer Perspective: This perspective provides a view on how customers perceive the organization. The

New York Science Journal 2014;7(5) http://www.sciencepub.net/newyork
http://www.sciencepub.net/newyork [email protected] 86
customer perspective should be considered as the central element of any business strategy that provide the unique mixture of products, price, relationship, and image that the company offers to its customers. In this perspective the organization should demonstrate how it differentiates itself from the competitors by retaining, attracting, and sustaining the relationships with its targeted customers. Therefore, managers are required to generate measures to answer the following question: "how should we appear to our customers in order to achieve our mission?" Typical measures used according to this perspective are: customer satisfaction, customer complaints, customer loss/winning, sales from new product, etc. Internal Business Processes Perspective: Internal business processes provide the organization with the means by which performance expectations may be accomplished. This perspective refers to the internal business processes of the organization and, therefore, managers are required to provide measures that answer the following question: " what business processes must we excel at in order to satisfy our customers and shareholders?"The central theme of this perspective is the results of the internal business processes which lead to financial success and satisfied customers. Typically the measures of this perspective are based on producing goods and services in the most efficient and effective methods. The measures commonly used for this perspective are: cost of quality, cost of non-conformance, process innovation, time savings etc. Learning and Growth Perspective: According to this perspective, managers must identify measures to answer the following question: "how will we sustain our ability to change and improve in order to achieve our vision?" Actually, this perspective is related to the employees of the organization, and it measures the extent to which the organization exerts efforts to provide its employees with opportunities to grow and learn in their domain. Kaplan and Norton acknowledged that the learning and growth measures are the most difficult to select; therefore they suggested the following measures as examples: employee empowerment, employee motivation, employee capabilities, and information systems capabilities. The aspects of the measures that will be used in the evaluation of performance are mentioned below (Niven, 2002)[15]
To be related to strategy To be expressed in numbers To be attainable and obtainable To be understandable To be comparable To be related
To have a general definition In BSC method, there has to be a strong relation between the chosen performance measures and strategy of the company (Otley, 1999)[16]. The ability to transform strategic aims into performance is accepted to be the most important part of BSC and distinguishes it from other methods (Otley, 1999; McAdam & Walker, 2003) [16,19]. Now. the balanced scorecard Considered a technique used in the strategic management to translate an organization’s mission and strategy in four perspectives in which financial and nonfinancial scales are used. BSC becomes a strong method for planning, developing and transforming the strategy 2.3. INTEGRATE BSC & TD-ABC Using TDABC based costing method provides important advantages for presenting performance measures and required critical success factors for all processes. So after integrating TDABC with BSC, companies are evaluated by four different views in a correct way with the target and financial measures by taking the vision and the strategy of into consideration. Short and long term targets financial and nonfinancial measures can be seen equally by taking four different views into consideration (Kaplan & Norton 1996) [9].
In fact, what is stated about the relationship between the ABC system and the BSC approach can be stated or repeated here because the TDABC is merely a development to the ABC system in order to make it easier to work and understandable by different users, at the end they are considered to be costing systems. However, the results here, in case of the TDABC, are expected to be better and smoother than those in case of the ABC system. This is because of the advantage the TDABC enjoys, e.g. the ease of application and perception. The integration between BSC and ABC is based on the work of of many authors as the following: (1) Matthew and Miller (1988)[20] considered ABC and BSC as decision tools. The integration of ABC and BSC provides enterprises with tools to make decision more efficiently. How are BSC and ABC integrated? It starts with ABC. which offers a better cost benefit analysis, according to the strategies aspects, than the traditional accounting method. Enterprises can seek case of higher profitability and improve the efficiency of strategy development. After developing the strategy, the firm sets performance goal based on BSC, supervises the enterprise on every activity and measures the efficiency. Meanwhile, because ABC offers better cost and resource consumption information, it helps the enterprises improve the exactness of performance measurements.
New York Science Journal 2014;7(5) http://www.sciencepub.net/newyork
http://www.sciencepub.net/newyork [email protected] 87
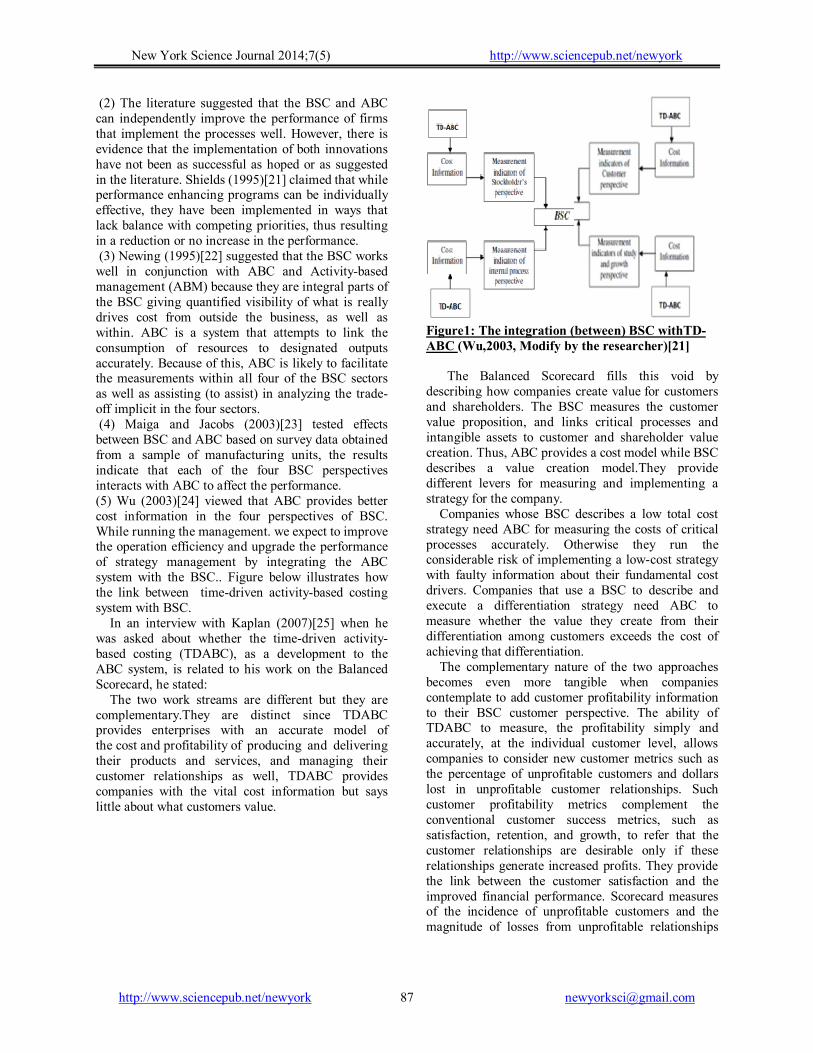
(2) The literature suggested that the BSC and ABC can independently improve the performance of firms that implement the processes well. However, there is evidence that the implementation of both innovations have not been as successful as hoped or as suggested in the literature. Shields (1995)[21] claimed that while performance enhancing programs can be individually effective, they have been implemented in ways that lack balance with competing priorities, thus resulting in a reduction or no increase in the performance. (3) Newing (1995)[22] suggested that the BSC works well in conjunction with ABC and Activity-based management (ABM) because they are integral parts of the BSC giving quantified visibility of what is really drives cost from outside the business, as well as within. ABC is a system that attempts to link the consumption of resources to designated outputs accurately. Because of this, ABC is likely to facilitate the measurements within all four of the BSC sectors as well as assisting (to assist) in analyzing the trade-off implicit in the four sectors. (4) Maiga and Jacobs (2003)[23] tested effects between BSC and ABC based on survey data obtained from a sample of manufacturing units, the results indicate that each of the four BSC perspectives interacts with ABC to affect the performance. (5) Wu (2003)[24] viewed that ABC provides better cost information in the four perspectives of BSC. While running the management. we expect to improve the operation efficiency and upgrade the performance of strategy management by integrating the ABC system with the BSC.. Figure below illustrates how the link between time-driven activity-based costing system with BSC. In an interview with Kaplan (2007)[25] when he was asked about whether the time-driven activity-based costing (TDABC), as a development to the ABC system, is related to his work on the Balanced Scorecard, he stated: The two work streams are different but they are complementary.They are distinct since TDABC provides enterprises with an accurate model of the cost and profitability of producing and delivering their products and services, and managing their customer relationships as well, TDABC provides companies with the vital cost information but says little about what customers value.
Figure1: The integration (between) BSC withTD-ABC (Wu,2003, Modify by the researcher)[21] The Balanced Scorecard fills this void by describing how companies create value for customers and shareholders. The BSC measures the customer value proposition, and links critical processes and intangible assets to customer and shareholder value creation. Thus, ABC provides a cost model while BSC describes a value creation model.They provide different levers for measuring and implementing a strategy for the company. Companies whose BSC describes a low total cost strategy need ABC for measuring the costs of critical processes accurately. Otherwise they run the considerable risk of implementing a low-cost strategy with faulty information about their fundamental cost drivers. Companies that use a BSC to describe and execute a differentiation strategy need ABC to measure whether the value they create from their differentiation among customers exceeds the cost of achieving that differentiation. The complementary nature of the two approaches becomes even more tangible when companies contemplate to add customer profitability information to their BSC customer perspective. The ability of TDABC to measure, the profitability simply and accurately, at the individual customer level, allows companies to consider new customer metrics such as the percentage of unprofitable customers and dollars lost in unprofitable customer relationships. Such customer profitability metrics complement the conventional customer success metrics, such as satisfaction, retention, and growth, to refer that the customer relationships are desirable only if these relationships generate increased profits. They provide the link between the customer satisfaction and the improved financial performance. Scorecard measures of the incidence of unprofitable customers and the magnitude of losses from unprofitable relationships

New York Science Journal 2014;7(5) http://www.sciencepub.net/newyork
http://www.sciencepub.net/newyork [email protected] 88
focus the organization on managing customers for profits and not just for sales. 3. The Analytic Hierarchy Process ( AHP ) AHP (is) reliable and easy to use for decision making jobs and that is why it has been the most commonly used and the most popular among experts and practitioners. Expert Choice is the software for supporting the AHP that is entirely based on its mathematical basis and the most commonly used one. 3.1. Conceptual Framewowk For AHP AHP has been developed by Saaty in the period between 1977:1990 (Vagglas,k.,2007,p.6)[26], which is defined as " a method of building indicators using pair-wise comparison that relies on expert opinion and decision-makers within the limits of a specified scale" ( Saaty,2008, p. 83 )[27] AHP is based on the following four principles (Saaty, 1994)[28]: 1. Decomposition: The first principle of AHP decomposition is a process in which a more complex problem is divided into several sub problems in a hierarchic order and which provide understanding and evaluating of such complex problems more easily. It means establishing the decision hierarchy. The main target is located on top of the decision hierarchy. One lower level is formed by the criteria that affect the quality of decisions. If these criteria have characteristics that affect the main target, then the new levels might be added to that hierarchy. Whilst the decision alternatives are located at the bottom of that hierarchy. 2. Comparative judgments or dual comparisons: Dual comparison term means comparing two factors/criteria with each other based on the judgment of decision maker. Dual comparisons are designed for establishing the priority distribution of decision criteria and alternatives. In other words, the employees are compared dually with each other within the hierarchy, in order to determine their relative importance according to the higher level of the employee. 3. If the determined level of hierarchy contains n employee(s) to compare n (n-1)/2, a number of dual comparisons should be made. These comparisons are designed in the form of matrices. Upon making dual criticisms, when a decision maker is asked how important is A criteria when compared to B, he uses 1-9 points choice scale shown in table 1.The effectiveness of this scale is determined after several technical comparisons with other scales and practices in different fields.It is necessary to arrange face to face questionnaire and to take people’s ideas about dual comparisons while using AHM. Even though such persons are not specialists, they should at least have the same knowledge.
4. Synthesis: After bilateral comparison matrices have been developed, each person’s priority of relative importance is examined. This stage of AHM is called synthesizing’. Linear arithmetic techniques are used while establishing priority vectors. This stage contains the most essential value, calculation of the essential vector equaled to the essential value and its normalization. There are several methods that are used for this purpose. Yet in the most widely used normalization method, the units of every column are divided into the total of that column. The line total of the calculated value is then divided into the number of units. Thus the priority vector of each criteria is found.. 5. Sensitivity Analysis: After building the order of the alternatives, it is necessary to review the results of the model. This examination indicates the correction parts on (of) the criticism or (of the) hierarchic structure. An important part of this examination is the evaluation of are (the) sensitivity of. (The evaluation of the sensitivity regarding the order of alternatives and the last decision in critics represents the important part of this examination. The last stage of AHP is the stage of solving the decision making problem. In this stage, mixed (composite) priorities vector is (are) built for putting (to put the) decision alternatives into order which (that) will work for performing the main target of problem. In order to build this vector, (the) average of priority vectors’ gravity which are determined for each variation is taken into consideration (Zahidi, 1986)[29].Gathered priorities can also be named as decision alternative marks and represent the density of the decision-maker’s critical perceptions about alternative preferences. 3.2. RESEARCH MODEL. Unstructured problems and their characters should be recognized and the objectives and outcomes should be stated clearly as well. The stages that are needed to be performed in order to solve a decision making problem with AHP are given below. Formulations and related explorations are explained in each stage (Huang, 2009; Ayvaz & Pehlivanl,2011)[30-31]. Step 1: In this step, the unstructured problem(s) and their characters should be recognized and the objectives and outcomes (should be) stated clearly (as well). This step includes the following two stages: The first stage, in which the decision spots are determined. In other words, the question of “How many results will be taken into consideration in order to evaluate the decision?’ is difficult to be answered. The second stage in which the factors that affect the decision spots are symbolized with “m” while the number of the factors that affect the decision spots are symbolized with “n”. Especially, the determination of the number of the factors that will affect the result and the

New York Science Journal 2014;7(5) http://www.sciencepub.net/newyork
http://www.sciencepub.net/newyork [email protected] 89
definition of each factor in details are important in respect to do logical and coherent bilateral comparisons. Step 2: Framework for personnel selection Step 3: Establishing decision hierarchy: In a hierarchy of decision problem stages, as shown in the following picture, in BSC database, BSC strategies’ connections run in a 3-level-hirerarchy in order to reach the targets. Targets of the organization are classified into 3 levels according to their importance as the four sides of BSC and the strategies of the organization.
Figure 2 The basic structure of the hierarchy of
the BSC Step 4: Collecting data from selected indicators. Step 5: Creating the comparison matrix between factors. For each element of the hierarchy structure, all the associated element in low hierarchy are compared in pair-wise comparison matrices. The comparative matrix between factors is,n x n dimensioned, is given below:
……(1) Where A = comparison pair-wise matrix, W1 = weight of element 1, W2 = weight of element 2, Wn = weight of element n. In order to determine the relative preferences for (of the) two elements of the hierarchy in matrix A, an underlying semantically scale employs with values from 1 to 9 to rate as the following table:
Table. 1: Saaty’s 9-Point Scale Of Pair-Wise Comparison
Scale Compare factor of i and j 1 Equally Important 3 Weakly Important 5 Strongly Important 7 Very Strongly Important 9 Extremely Important
2,4,6,8 Intermediate value between adjacent scales
Step 6: The percentage of importance level of the factors are determined.The comparison matrix shows the importance level of the factors according to one another in a logical way. However, in order to determine the percentage of importance distributions of these factors namely their value in the whole picture, which make up the comparison matrix’s column vectors being used, and the B column vector which has n prices and n components is (being) created. This vector is shown below.
……….. (2) Likewise, when other parts of the 1 B vectors are calculated, the vector can be obtained as shown below; and when the components of the column vector are added, the total will be 1. When the steps, explained above, are repeated in other evaluation factors, B column vectors will be obtained as much as the number of vectors. When B column matrix in n piece is brought together in a matrix format, the C matrix will be built as shown below.

New York Science Journal 2014;7(5) http://www.sciencepub.net/newyork
http://www.sciencepub.net/newyork [email protected] 90
Through the help of C matrix, the percentage of importance distribution of factors according to each other can be calculated. For this, as shown in the formula (5.3), arithmetical average of line components that shapes matrix are calculated and W column vector which is called Priority Vector is obtained.
…………..…...(3)
Step 7: Consistency of the factor comparison is evaluated. No matter how reliable is the system of Analytic Hierarchy Process's (AHP),the factorization of the results is based on the reliability of the factors' one by one comparison that is made by the decision maker. Analytic Hierarchy Process (AHP) suggests a process in order to evaluate the reliability of such comparisons. CR, which is found at the end of this process, gives an opportunity to test the reliability of factors' one by one comparison. Calculation of CR is based on the comparison of factor number and a coefficient (l) which is called Basic Value. In order to calculate l, firstly D column vector is obtained from the multiplication of W priority vector and matrix.
As defined in the formula (4), the basic value (E) is obtained from each part of the evaluated factors D and W column vectors. Arithmetic average of these
values, the 5th formula, gives the basic value ( ) of the comparison
…….(4)
……...(5) After ƛ is calculated, the Coherence Indicator (CI) can be calculated with the help of the formula (5.6).
……...(6) Finally, CI is divided into the standard correction value which is called Random Indicator (RI) and (hence) CR is obtained.
……...(7) CR value below 0.10 shows that decision-makers’ comparisons are coherent. The value over 0.10 shows that either there is a calculation error in AHM or incoherence in the comparisons of decision-maker. Step 8: For every factor, the percentage of importance distributions on M decision spots are calculated. In this step as explained above, the percentage of importance distributions of the decision spots of each factor is identified. In other wards the one-to-one comparisons and matrix operations are repeated as much as the number of factors n times. However this time, the dimension of G comparison matrixes that will be used on the decision spots for every factor will be m x m. After each comparison, according to the mxl dimension and the decision spots of the factors that were evaluated, the S column vectors, which show the percentage of distributions, are calculated. These column vectors are defined below: Step 9:Determination of the result distribution on decision spots in this stage, firstly the (MxN) dimensioned K decision matrix is created which consists n numbered mxl dimensioned S column vectors. The decision matrix is defined below: As a result, when the decision matrix is multiplied with the W column priority vector as shown below, L column vector with M pieces is obtained. L column vector gives the percentage of distribution of decision spots. In other words, the total of the elements of

New York Science Journal 2014;7(5) http://www.sciencepub.net/newyork
http://www.sciencepub.net/newyork [email protected] 91
vector is 1. This distribution, at the same time, shows the order of importance of the decision spots. 4. Empirical Study Banks are the most important financial institutions that direct the economy and investment at the countries. Banks’ financial, nonfinancial performances and multiple criteria that are considered in the decision making process for the decision makers which strengthening the strategic financial performance of Egyptian banks. This study consists of two steps; the first one is to identify the multiple criteria that are considered in the decision making process for the decision makers to make an objective and unbiased decision. The Delphi method is adopted here to accumulate expert opinions. After constructing a criteria framework, collect the primary data by questionnaire approach. Then, the criteria weights can be calculated by using AHP. 4.1. Establish an evaluate model and define the evaluative criteria: Upon using the Delphi method (Wu,C.R.& others, 2007a)[32], a consensus among experts on establishing a model can be achieved. The ultimate goal of evaluating the ideal organizational performance can be achieved, following the identification of 4 evaluation criteria, 25 drivers alternatives for financial and nonfinancial perspective evaluation as shown in the following figure. 4.2. Collect The Primary Data: This study is used the judgmental sampling or that is called the purposive sampling, where the researcher selects units to be sampled based on their knowledge and professional judgment. The study is based on the primary data which is collected by using a questionnaire survey delivered to the branch managers, vice branch manager for six central branch banks. The responses of this questionnaire was 11 questionnaires. The questionnaire depends on the pair-wise comparison approach which was introduced independently by both Ramon Llull and the mathematician and philosopher, in the eighteenth century). Marie Jean Antoine Nicolas Cariat, the Marquis de Condorcet, after which the Condorcet Method of voting, using pair-wise comparisons, is named (R Zainol1, F Ahmad, N A Nordin, A W M Aripin)[33].
Figure 3: drivers alternatives for financial and nonfinancial perspective evaluation
The questionnaire structured uses sets of pair-wise comparisons to derive both the relative weights of the individual decision criterion and the rating of options in terms of each criterion. The first set was to examine the contributions made by four financial and nonfinancial criteria to strengthen the strategic financial performance of Egyptian banks.The criteria used here, as an example for the demonstrational purposes, are those financial and nonfinancial outcome measures proposed by Kaplan and Norton (Kaplan,R.S.and Norton,D.P, 1996b)[34], Margin Growth, Revenue Growth., Customer Satisfaction, and Employee Satisfaction.
Respondents were asked to determine the importance of the criteria, i.e., the four generic financial and nonfinancial measures, to the overall objective by pair-wise comparison. It involves an objective or subjective assignment of preference weights to each pair of the measures.In pairs, each criterion is compared to each another. For example the question for pair-wise comparison between margin growth and revenue growth is: which outcome financial measure (outcome) is more important with regards to the overall financial objective, margin growth or revenue growth, and by what scale?

New York Science Journal 2014;7(5) http://www.sciencepub.net/newyork
http://www.sciencepub.net/newyork [email protected] 92
The second set involves evaluating (the evaluation of) the impact of each sub-criteria or driver alternatives’ (impact) on each (one of the) four financial and nonfinancial business performance criteria that are considered at (in) the first set. The alternatives are compared among themselves with respect to each financial and nonfinancial outcome measure; hence a (the) weight vector is assigned for each of the alternatives. For example, with regards to the financial objective of margin growth, the question is: which driver is more important to the financial objective of margin growth, driver x or driver y, and by what scale? 4.3. Using Ahp To Calculate Criteria Weights AHP has been shown to be a robust method of eliciting and using multi criteria preference relationships in a range of applications.The AHP is
based on a matrix of pair wise comparisons between criteria, and it can be used to evaluate the relative performance of decision alternatives (for example products and services) with respect to the relevant criteria. Step 1: Using the geometric average method to combine the pair-wise comparisons of various criteria and sub-criteria driver alternative that (are) generated at 4.2 (and) are organised into a square matrix. The diagonal elements of the matrix are 1. The criterion in the ith row is better than criterion in the jth column if the value of element (i, j) is more than 1; otherwise the criterion in the jth column is better than that in the ith row. The ( j, I ) element of the matrix is the reciprocal of the (i, j) element. The matrix for the main criteria reads is read as the following:
Table 2:PAIR-WISE COMPARISON MATRIX FOR MAIN CRITERIA Margin Growth Revenue Growth Customer Satisfaction Employee Satisfaction Margin Growth 1 3.58 1.25 2.44 Revenue Growth 0.28 1 0.94 2.77 Customer Satisfaction 0.80 1.06 1 2.60 Employee Satisfaction 0.41 0.36 0.38 1 Step 2:
Table 3:Standards & Weight Matrix For Main Criteria
Margin Growth
Revenue Growth
Customer Satisfaction
Employee Satisfaction
Sum W
Margin Growth 0.40 0.60 0.35 0.28 1.63 0.41 Revenue Growth 0.11 0.17 0.26 0.33 0.86 0.21 Customer Satisfaction
0.32 0.18 0.28 0.31 1.07 0.27
Employee Satisfaction
0.17 0.06 0.11 0.12 0.46 0.11
Step: 3
New York Science Journal 2014;7(5) http://www.sciencepub.net/newyork
http://www.sciencepub.net/newyork [email protected] 93
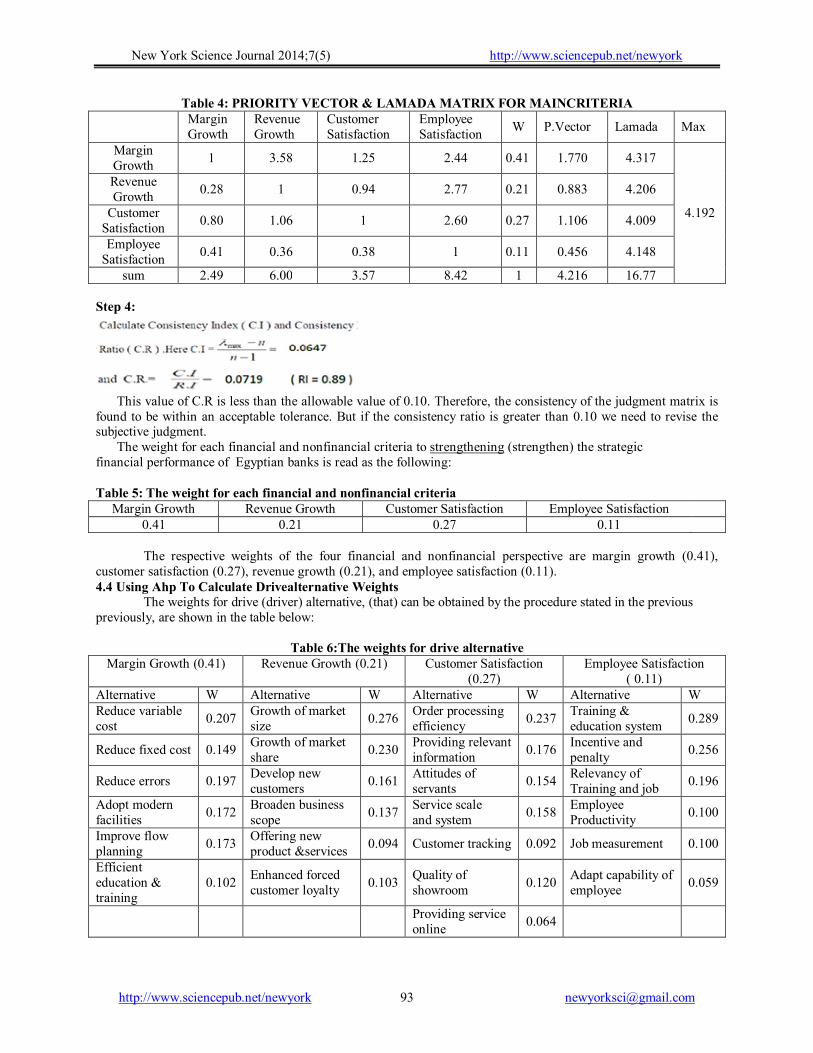
Table 4: PRIORITY VECTOR & LAMADA MATRIX FOR MAINCRITERIA
Margin Growth
Revenue Growth
Customer Satisfaction
Employee Satisfaction
W P.Vector Lamada Max
Margin Growth
1 3.58 1.25 2.44 0.41 1.770 4.317
4.192
Revenue Growth
0.28 1 0.94 2.77 0.21 0.883 4.206
Customer Satisfaction
0.80 1.06 1 2.60 0.27 1.106 4.009
Employee Satisfaction
0.41 0.36 0.38 1 0.11 0.456 4.148
sum 2.49 6.00 3.57 8.42 1 4.216 16.77 Step 4:
This value of C.R is less than the allowable value of 0.10. Therefore, the consistency of the judgment matrix is found to be within an acceptable tolerance. But if the consistency ratio is greater than 0.10 we need to revise the subjective judgment. The weight for each financial and nonfinancial criteria to strengthening (strengthen) the strategic financial performance of Egyptian banks is read as the following:
Table 5: The weight for each financial and nonfinancial criteria
Margin Growth Revenue Growth Customer Satisfaction Employee Satisfaction 0.41 0.21 0.27 0.11
The respective weights of the four financial and nonfinancial perspective are margin growth (0.41),
customer satisfaction (0.27), revenue growth (0.21), and employee satisfaction (0.11). 4.4 Using Ahp To Calculate Drivealternative Weights
The weights for drive (driver) alternative, (that) can be obtained by the procedure stated in the previous previously, are shown in the table below:
Table 6:The weights for drive alternative Margin Growth (0.41) Revenue Growth (0.21) Customer Satisfaction
(0.27) Employee Satisfaction
( 0.11) Alternative W Alternative W Alternative W Alternative W Reduce variable cost
0.207 Growth of market size
0.276 Order processing efficiency
0.237 Training & education system
0.289
Reduce fixed cost 0.149 Growth of market share
0.230 Providing relevant information
0.176 Incentive and penalty
0.256
Reduce errors 0.197 Develop new customers
0.161 Attitudes of servants
0.154 Relevancy of Training and job
0.196
Adopt modern facilities
0.172 Broaden business scope
0.137 Service scale and system
0.158 Employee Productivity
0.100
Improve flow planning
0.173 Offering new product &services
0.094 Customer tracking 0.092 Job measurement 0.100
Efficient education & training
0.102 Enhanced forced customer loyalty
0.103 Quality of showroom
0.120 Adapt capability of employee
0.059
Providing service
online 0.064

New York Science Journal 2014;7(5) http://www.sciencepub.net/newyork
http://www.sciencepub.net/newyork [email protected] 94
4.5. Ranking Of Bank’s Criteria And Driver Alternative The final priority weights, that were calculated by cross-multiplying the priority weight presented in the tables below:
Table 7: The overall priority weights for driver alternatives of financial performance ( 0.58 ) Margin Growth ( 0.41 ) Revenue Growth ( 0.21 )
Alternative Weight Rank Alternative Weight Rank Reduce variable cost 0.0492 1 Growth of market size 0.0336 1 Reduce errors 0.0468 2 Growth of market share 0.0280 2 Improve flow planning 0.0411 3 Develop new customers 0.0196 3 Adopt modern facilities 0.0409 4 Broaden business scope 0.0167 4 Reduce fixed cost 0.0354 5 Enhanced forced customer loyalty 0.0125 5 Efficient education & traning 0.0243 6 Offering new product & services 0.0114 6
Table 8 The overall priority weights for driver alternatives of nonfinancial performance ( 0.42 ) Customer Satisfaction ( 0.27 ) Employee Satisfaction ( 0.11 )
Alternative Weight Rank Alternative Weight Rank Order processing efficiency 0.0269 1 Training & education system 0.0134 1 Providing relevant information 0.0200 2 Incentive and penalty 0.0118 2 Service scale and system 0.0179 3 Relevancy of Training and job 0.0091 3 Attitudes of servants 0.0175 4 Employee Productivity 0.0046 4 Quality of showroom 0.0136 5 Job measurement 0.0046 5 Customer tracking 0.0104 6 Adapt capability of employee 0.0027 6 Providing service online 0.0073 7 Thus, according to the priority weights of the performance outcomes and the performance drivers of those outcomes, there will be three alternatives in front of the bank. First, integration of Margin Growth, Customer Satisfaction and Employee Satisfaction. Second, integration of Revenue Growth, Customer Satisfaction and Employee Satisfaction, and last, integration of Margin Growth, Revenue Growth, Customer Satisfaction and Employee Satisfaction. 5. Finding & Conclusions Whether the goal of a performance measurement system is to help direct the allocation of resources to assess and communicate progress toward strategic objectives, or to evaluate managerial performance, a major challenge for companies is determining which of the hundreds, if not thousands, of nonfinancial measures to track. Many companies my be believe that they have solved this problem by adopting a framework like the Balanced Scorecard. But using such a framework by itself won’t help identify which performance areas – and which drivers – make the greatest contribution to the company’s financial outcomes. Wherefore, this study adopting a framework integration between TDABC,BSC and AHP on Egyptian banks to identify and ranking performance
outcomes and the performance drivers of those outcomes to realize the potential benefits from using an appropriate mix of them. and the concluded findings that can be summarized as the following: 1- The Balanced Scorecard (BSC) concept came
out of the realisation that no single performance indicator can capture the full complexity of an organisation’s performance.
2- Use system BSC alone, may be does not achieve the goal of a performance measurement system, because itself won’t help identify which performance areas - and which drivers - make the greatest contribution to the company’s financial outcomes.
3- BSC is a multi-goals targeting model that focuses on the decision-making problems where multiple criteria are involved, and since each function of the firm usually comprises a large number of embedded activities leading to an exhaustive list of performance drivers.
4- TDABC, just like the traditional ABC, is a costing system in which company sources are used by the activities and activities are used by the cost (Gramco & Gremco, 2007). In other words, it is defined as the improved version of traditional ABC which helps company estimate the source demand of each process, product and customer with the help of required time to fulfill

New York Science Journal 2014;7(5) http://www.sciencepub.net/newyork
http://www.sciencepub.net/newyork [email protected] 95
the activities and the cost of capacity unit time.. However, it is stated in the study that the use of only cost carrier, that is ‘time ‘ makes TDABC special in respect to the traditional ABC (Gremco & Gremco, 2007)[8]. For this reason, it is thought that although the general logic of both significant differences in their functions.
5- For such multi-criteria decision making problems, appropriately assessing the managerial priority preferences among performance criteria will play a key role in the solution process. To assess manager's preference explicitly with a preference model, in the current literature, one of the most preferred approaches is the analytic hierarchy process (AHP), as suggested by Falkner and Benhajla and Satty[3-7].
Corresponding Author: Dr. Ahmed Abdelkader Ahmed Assistant professor Al-Azher University Faculty of Commerce Department of Accounting E-mail: [email protected] References 1. Paul, R Niven. (2006) Balanced Scorecard Step
by step: Maximizing performance and Maintaining Results, Hoboken, New Jersey, John Wiley & Sons, Inc, John Wiley&Sons, Inc
2. D. Amaratunga, D. Baldry, and M. Sarshar, (2001) "Process improvement through performance measurement: the balanced scorecard methodology," Work Study, vol. 50, pp.179-188,
3. Falkner, C. H., and Benhajla, S. (1990). "Multi-Attribute Decision Models in the Justification of CIM Systems". The Engineering Economist, 35(2), 91-114
4. Saaty, T. L. (1990). "How to Make a Decision: The Analytic Decision Process". European Journal of Operations Research, 48, 9-26.
5. Saaty, T. L. (1983). "Priority Setting in Complex Problems". IEEE Transactions on Engineering Management, EM-30 (3), 140-155.
6. Satty, T. L. (1982). Decision Making for Leaders: The Analytical Hierarchy Process for Decisions in A Complex World, Belmont, MA: Wadsworth.
7. Saaty, T. L. (1994). "How to Make a Decision: The Analytic Decision Process". Interfaces, 24(6), 19-43.
8. Gremco, O. D. L.V., & Yves, L. G. (2007). Time-driven abc: The simplification of the assessment of costs through resorting to equivalents. 30th Annual Congress of the Eropean Accounting Association, Lisbon.
9. Kaplan, R. S., & Norton, D. (1996a). Using the balanced scorecard as a strategic management system. Harvard Business Review, 74(1), 75–85
10. Kosmidou, K., Pasiouras, F., Doumpos, M., & Zopounidis, C. (2006). Assessing performance factors in the UK banking sector: A multi-criteria methodology. Central European Journal of Operations Research, 14(1), 25–44
11. Kaplan, R.; Anderson, S.R. (2004), “Time-Driven Activity-Based Costing”, Harvard Business Review, vol. 82, no.11, pp.8-131.
12. Kaplan, R.; Anderson, S.R. (2007a), “The Innovation of Time-Driven Activity-Based Costing”, Journal of Cost Management, vol.21, no.2, pp.5-15.
13. CMA Canada, standard 8000. (2008); Proposed Strategic Management Accounting Practice Standard Time-Driven Activity-Based Costing Certified Management Accountants Canada 2008, Exposure Draft
14. Bruggeman, W., S. Hoozée, K. Moreels, and T. Bruyneel, (2007), Time-driven Activity-based Costing: Inspiratiebron voor prestatieverbetering en winstverhoging, Intersentia
15. Niven, P (2002), Balanced Scorecard Step-by-Step: Maximizing Performance and Maintaining Results, New Jersey, John Wiley and Sons
16. Otley, D. (1999). Performance management a framework for management control systems research. Management Accounting Research, 10(4), 363-382.
17. Kaplan, R. S., & David, P. N. (1992). The Balanced Scorecard - Measures That Drive Performance. Harvard Business Review, Jan-Feb, 71-79.
18. Veen-Dirks, P. V., & Martin, W. (2002). Strategic Control: Meshing Critical Success Factors with the Balanced Scorecard. Long Range Planning, 35(4), 407–427
19. McAdam, R., & Timothy, W. (2003). An Inquiry into Balanced Scorecard within Best Value Implementation in UK Local Government. Public Administration, 81(4), 873-892.
20. Matthew, J, Miller, T (1998). A Framework for Integrating Activity-Based Cost and Balanced Scorecard into the Logistics Strategy Development and Monitoring Process. J. Bus. Logisit. 19: 131-138
21. Shields, M. D. 1995. "An Empirical Analysis of Firms' Implementation Experiences with Activity-Based Costing." Journal of Management Accounting Research 7: 148166

New York Science Journal 2014;7(5) http://www.sciencepub.net/newyork
http://www.sciencepub.net/newyork [email protected] 96
22. Newing, R. 1995. "Wake up to the Balanced Scorecard." Management Accounting 73 (3): 22-25.
23. Maiga, AS, Jacobs, FA (2003). Balanced scorecard, activity-based costing and company performance: an empirical analysis. J. Manage. 4(3): 283-301.
24. Wu, AN (2003). The execution of BSC and other management systems, Account. Res. Monthly. 207: 132-137.
25. Kaplan, R.S. (2007), Adding Time to Activity-Based Costing. Interview. Available at: http://hbswk.hbs.edu/item/5657.html. Accessed; 30th November, 2009.
26. Vaggelas,Georgios,k.,(2007), Distributing the Benefit from Services Provision in Passenger Ports: An AHP Approach, paper presented at the International Association of Maritime Economists (IAME) Conference, Athens, Greece.
27. Saaty,Thomas L.,(2008), Decision Making with the Analytical Hierarchy Process, International Journal of Services Sciences, vol. 1, No.1., Inder science Enterprises Ltd.
28. Saaty, T. L. (1994). Highlights and Critical Points in the Theory and Application of the Analytic Hierarchy Process. European Journal of Operational Research, 74(3), 426-447.
29. Zahedi, F. (1986). The Analytical Hierarchy Process-a Survey of the Method and its Applications. Interfaces, 16(4), 96-108.
30. Huang, H. C. (2009). Designing a Knowledge-Based System for Strategic Planning: A Balanced Scorecard Perspective. Expert Systems with Applications, 36, 219-218.
31. Ayvaz,Ednan; Pehlivanl, Davut ( 2011 ) The Use of Time-Driven Activity-Based Costing and Analytic Hierarchy Process Method in the Balanced Scorecard Implementation www.ccsenet.org/ijbm International Journal of Business and Management Vol. 6, No. 3; March 2011
32. Wu, C.R., C.T. Lin and H.C. Chen, 2007a. Optimal selection of location for Taiwanese hospitals to ensure a competitive advantage by using the Analytic Hierarchy Process and Sensitivity analysis. Build. Environ., 42: 1431-1444. http://cat.inist.fr/?aModele=afficheN&cpsidt=1840 2958
33. R Zainol1, F Ahmad, N A Nordin, A W M Aripin, Evaluation of users' satisfaction on pedestrian facilities using pair-wise comparison approach, Earth and Environmental Science 18 (2014) 012175, p1-6
34. Kaplan, R. S. and Norton, D. P., 1996b. Linking the Balanced Scorecard to Strategy,California Management Review, 39(1), 53-79