new york solar smart dg hub-resilient solar project ... · new york solar smart dg hub-resilient...
TRANSCRIPT
NREL is a national laboratory of the U.S. Department of Energy Office of Energy Efficiency & Renewable Energy Operated by the Alliance for Sustainable Energy, LLC
This report is available at no cost from the National Renewable Energy Laboratory (NREL) at www.nrel.gov/publications.
Contract No. DE-AC36-08GO28308
New York Solar Smart DG Hub-Resilient Solar Project: Economic and Resiliency Impact of PV and Storage on New York Critical Infrastructure Kate Anderson, Kari Burman, and Travis Simpkins National Renewable Energy Laboratory (NREL)
Erica Helson, Lars Lisell, and Tria Case City University of New York (CUNY)
Technical Report NREL/TP-7A40-66617 June 2016

NREL is a national laboratory of the U.S. Department of Energy Office of Energy Efficiency & Renewable Energy Operated by the Alliance for Sustainable Energy, LLC
This report is available at no cost from the National Renewable Energy Laboratory (NREL) at www.nrel.gov/publications.
Contract No. DE-AC36-08GO28308
National Renewable Energy Laboratory 15013 Denver West Parkway Golden, CO 80401 303-275-3000 • www.nrel.gov
New York Solar Smart DG Hub-Resilient Solar Project: Economic and Resiliency Impact of PV and Storage on New York Critical Infrastructure Kate Anderson, Kari Burman, and Travis Simpkins National Renewable Energy Laboratory (NREL)
Erica Helson, Lars Lisell, and Tria Case City University of New York (CUNY)
Prepared under Task No. WTLU.1000
Technical Report NREL/TP-7A40-66617 June 2016

NOTICE
This report was prepared as an account of work sponsored by an agency of the United States government. Neither the United States government nor any agency thereof, nor any of their employees, makes any warranty, express or implied, or assumes any legal liability or responsibility for the accuracy, completeness, or usefulness of any information, apparatus, product, or process disclosed, or represents that its use would not infringe privately owned rights. Reference herein to any specific commercial product, process, or service by trade name, trademark, manufacturer, or otherwise does not necessarily constitute or imply its endorsement, recommendation, or favoring by the United States government or any agency thereof. The views and opinions of authors expressed herein do not necessarily state or reflect those of the United States government or any agency thereof.
This report is available at no cost from the National Renewable Energy Laboratory (NREL) at www.nrel.gov/publications.
Available electronically at SciTech Connect http:/www.osti.gov/scitech
Available for a processing fee to U.S. Department of Energy and its contractors, in paper, from:
U.S. Department of Energy Office of Scientific and Technical Information P.O. Box 62 Oak Ridge, TN 37831-0062 OSTI http://www.osti.gov Phone: 865.576.8401 Fax: 865.576.5728 Email: [email protected]
Available for sale to the public, in paper, from:
U.S. Department of Commerce National Technical Information Service 5301 Shawnee Road Alexandria, VA 22312 NTIS http://www.ntis.gov Phone: 800.553.6847 or 703.605.6000 Fax: 703.605.6900 Email: [email protected]
Cover Photos by Dennis Schroeder: (left to right) NREL 26173, NREL 18302, NREL 19758, NREL 29642, NREL 19795.
NREL prints on paper that contains recycled content.

iii
This report is available at no cost from the National Renewable Energy Laboratory (NREL) at www.nrel.gov/publications.
Acknowledgments This work was sponsored by the U.S. Department of Energy under a Solar Market Pathways grant. The New York City Department of Citywide Administrative Services (DCAS), New York City Housing Authority, Fire Department of New York, New York Department of Education, New York City Emergency Management, New York Power Authority, Con Edison, and BlocPower were instrumental in providing data for the analysis and hosting site visits. We would like to acknowledge Dylan Cutler and Dan Olis of NREL for their role in developing the stochastic outage modeling capability in REopt. We would also like to thank Bob Butt and Dan Olis of NREL, Jeff Irvine and Allison Silverman of CUNY, Ellen Zielinski, Steve Lochner and Hamid Lekic of DCAS, Doug Staker of Demand Energy, Henry Misas of Bright Power, Cynthia Barton of New York City Emergency Management, Benjamin Pickard of Peak Power LLC, and the DG Hub Software Working Group members for their input and review of this analysis.

iv
This report is available at no cost from the National Renewable Energy Laboratory (NREL) at www.nrel.gov/publications.
List of Abbreviations and Acronyms ASHRAE American Society of Heating, Refrigerating, and Air-
Conditioning Engineers CUNY City University of New York DC direct current DCAS Department of Citywide Administrative Services DOE U.S. Department of Energy EC engine company EE energy efficiency FDNY Fire Department of New York Ft feet Ft2 square feet ICE interruption cost estimate ITC investment tax credit K thousand kW kilowatt kWh kilowatt-hour LCOE levelized cost of energy LED light-emitting diode M million MACRS modified accelerated cost recovery system NPV net present value NREL National Renewable Energy Laboratory NYC New York City NYCHA New York City Housing Authority NYC-DOE New York City Department of Education NYC EM New York City Emergency Management NYPA New York Power Authority NYSERDA New York State Energy Research and Development
Authority O&M operations and maintenance PPA power purchase agreement PV photovoltaics RE renewable energy RPR reverse power relay SCADA supervisory control and data acquisition SREC solar renewable energy credit TOD time of day W watt

Executive Summary Resilient PV, which is solar paired with storage (“solar-plus-storage”) that operates both on and off grid, provides value during normal grid operation and during power outages, as opposed to traditional solar PV, which functions only when the electric grid is operating. During normal grid operations, resilient PV systems help host sites generate revenue and/or reduce electricity bill charges. During grid outages, resilient PV provides critical emergency power that can help people in need and ease demand on emergency fuel supplies. The combination of grid interruptions during recent storms, the proliferation of solar PV, and the growing deployment of battery storage technologies has generated significant interest in using these assets for both economic and resiliency benefits. This report analyzes the technical and economic viability of solar and storage on three critical infrastructure sites in New York City (NYC): a school that is part of a coastal storm shelter system, a fire station that was flooded during Sandy, and a NYCHA senior center that serves as a cooling center during heat emergencies. This analysis differs from previous solar-plus-storage studies by placing a monetary value on resiliency and thus, in essence, modeling a new revenue stream for the avoided cost of a power outage. Analysis results show that resilient PV can be economically viable for NYC’s critical infrastructure and that it may be similarly beneficial to other commercial buildings across the city.
This report will help managers of city buildings, private building owners and managers, the resilient PV industry, and policymakers to better understand the economic and resiliency benefits of resilient PV. As NYC fortifies its building stock against future storms of increasing severity, resilient PV can play an important role in disaster response and recovery while also supporting city greenhouse gas emission reduction targets and relieving stress to the electric grid from growing power demands.
This analysis used the REopt modeling platform to optimally select and size resilient power options for the sites in the study. Four scenarios were modeled to reflect different priorities and constraints; each scenario was modeled with and without a resiliency revenue stream. The value of resiliency to a site in this analysis is equal to the estimated costs incurred due to grid interruptions. In each case, the resilient PV system was able to capture revenue streams associated with displacing energy purchases from the grid, reducing peak demand charges, and shifting grid-purchased energy from high to low time-of-use cost periods. In all cases, the model found the combination of energy assets that minimized the life cycle cost of energy for the site.
1. Scenario 1: Resilient PV sized for economic savings; no resiliency requirement imposedThe model chose from solar and storage resources to size a system that is cost-effective* forthe host site.
2. Scenario 2: Resilient PV sized to meet resiliency needsThe model chose from solar and storage resources to size a system that supports criticalelectric loads for short and long outages.
3. Scenario 3: Resilient PV and a generator (hybrid system) sized to meet resiliency needsThe model chose from solar, storage, and diesel generator resources to size a hybrid systemthat supports critical electric loads for short and long outages.
1 “Cost-effective” in this report means that the modeled system has a life cycle NPV that is equal to or greater than zero.
v
This report is available at no cost from the National Renewable Energy Laboratory (NREL) at www.nrel.gov/publications.
vi
This report is available at no cost from the National Renewable Energy Laboratory (NREL) at www.nrel.gov/publications.
4. Scenario 4: Generator sized to meet resiliency needs The model sized a diesel generator to support critical electric loads for short and long outages.
The results from the modeling indicate that resilient PV can provide both resiliency and economic benefits for the three sites analyzed in this study. The level of resiliency and/or economic savings the systems will provide depends on a number of factors including:
• Electricity rate of the host site
• Available space to accommodate solar energy
• The combination of technologies used
• The size and shape of the typical load and the critical load
• Whether or not the model includes a monetary value for resiliency.
If a technology solution is being implemented primarily to provide emergency power, the results of the analysis indicate that a hybrid system (Scenario 3) that includes resilient PV and a generator is the most cost-effective technology solution, when measured by lifecycle cost savings. The savings the battery (and sometimes PV) provides during normal grid-connected operation make the hybrid system more economical than a diesel generator alone. However, the hybrid system has a higher initial cost and is more complex than a stand-alone generator.
If lifecycle cost savings is the primary goal, and emergency power is secondary, the results of the study show storage (and sometimes PV) to be the best solution out of the options evaluated for the three sites analyzed under this study. These systems provide maximum cost savings over the project lifecycle with some resiliency benefit. A generator-only solution (Scenario 4), while having the least expensive initial cost, provided lower lifecycle cost savings because this type of asset does not provide value during normal, on-grid operations in this analysis.
The analysis also found that energy storage was cost-effective at all three locations. This is due to the high demand rates and the shape of the load profile at each of these sites. A modestly sized battery system can be strategically charged and discharged such that it shaves the monthly peak loads and therefore captures significant demand savings. It is expected that batteries would also be economically viable at other critical infrastructure sites with high demand rates and similarly shaped load profiles.
The three studied sites are all supplied by NYPA, with Con Edison providing electric delivery services. They have high demand charges and lower-than-average energy costs. For the smaller sites with limited roof space, the model did not always select solar as part of the lowest-cost solution. However, storage savings at these locations were used to offset the cost of solar to demonstrate how these technologies can be used in conjunction to create cost-effective systems. With NYC’s commitment to deploying 100 MW of solar on city-owned buildings by 2025, this analysis demonstrates that solar paired with energy storage can support the city’s solar deployment goals at buildings where energy costs are low and standalone solar may not always be cost-effective.

vii
This report is available at no cost from the National Renewable Energy Laboratory (NREL) at www.nrel.gov/publications.
Lastly, the results showed that the inclusion of the cost of power outages can have a large impact on the economic viability of a resiliency solution. The net present value (NPV) of a system was always higher when resiliency was valued. Resiliency values were higher for the radial customer (the fire station in this analysis) which is likely to experience more frequent outages, and lower for the school shelter and cooling center, which are network customers on a more reliable grid. The resiliency value realized by the systems was higher for longer outages because there are more outage costs avoided during a long outage compared to a short outage. Currently, generators are responsible for providing the majority of NYC’s emergency power needs during times of disaster. This analysis shows that cost-effective hybrid systems that include resilient PV and a generator can extend limited fuel supplies by reducing fuel consumption by approximately 9-36%. Furthermore, with and without a resiliency value, a hybrid system provides emergency power to the sites studied in this analysis at the lowest lifecycle cost.
While only three types of critical infrastructure were evaluated in this analysis, similar results could be expected at other critical infrastructure sites with similar loads and utility rate tariffs. Modestly sized resilient PV systems can achieve both economic savings during normal grid operation and limited emergency power supply during outages. When paired with a backup diesel generator, hybrid resilient PV systems can sustain critical loads for short and long outages (2 hours up to 2 days were modeled). This analysis is intended to initiate a conversation about the use of resilient PV on city buildings among policymakers who are working to increase resiliency while lowering greenhouse gas emissions and electricity costs.

viii
This report is available at no cost from the National Renewable Energy Laboratory (NREL) at www.nrel.gov/publications.
Table of Contents Acknowledgments ..................................................................................................................................... iii List of Abbreviations and Acronyms ....................................................................................................... iv Executive Summary .................................................................................................................................... v 1 Introduction ........................................................................................................................................... 1 2 Methodology ......................................................................................................................................... 4
2.1 Selection of Critical Infrastructure Sites ....................................................................................... 4 2.2 Site Overview ................................................................................................................................ 5
2.2.1 NYC-DOE High School/Shelter ...................................................................................... 5 2.2.2 FDNY Engine Company 309 ......................................................................................... 10 2.2.3 NYCHA Cooling Center ................................................................................................ 15
2.3 Modeling Description and Assumptions ..................................................................................... 19 2.4 Value of Resiliency ..................................................................................................................... 24 2.5 Analysis Approach ...................................................................................................................... 27
2.5.1 Scenario 1: Resilient PV Sized for Economic Savings; no Resiliency Requirement Imposed .......................................................................................................................... 29
2.5.2 Scenario 2: Resilient PV Sized to meet Resiliency Needs ............................................. 29 2.5.3 Scenario 3: Resilient PV and a Generator (Hybrid System) Sized to meet Resiliency
Needs .............................................................................................................................. 29 2.5.4 Scenario 4: Generator Sized to meet Resiliency Needs ................................................. 30
3 Results ................................................................................................................................................. 32 3.1 NYC-DOE High School/Coastal Storm Shelter .......................................................................... 32
Scenario 1: Resilient PV Sized for Economic Savings; no Resiliency Requirement Imposed .......................................................................................................................... 32
Scenario 2: Resilient PV Sized to meet Resiliency Needs .......................................................... 35 Scenario 3: Resilient PV and a Generator (Hybrid System) Sized to meet Resiliency Needs .... 36 Scenario 4: Generator Sized to meet Resiliency Needs .............................................................. 38 Discussion of School Shelter Results Across All Scenarios .................................................... 38
3.2 FDNY EC309 .............................................................................................................................. 39 Scenario 1: Resilient PV Sized for Economic Savings; no Resiliency Requirement Imposed ... 39 Scenario 2: Resilient PV Sized to meet Resiliency Needs .......................................................... 41 Scenario 3: Resilient PV and a Generator (Hybrid System) Sized to meet Resiliency Needs .... 42 Scenario 4: Generator Sized to meet Resiliency Needs .............................................................. 43 Discussion of Fire Station Results Across All Scenarios ........................................................ 44
3.3 NYCHA Cooling Center ............................................................................................................. 45 Scenario 1: Resilient PV Sized for Economic Savings; no Resiliency Requirement Imposed ... 45 Scenario 2: Resilient PV Sized to meet Resiliency Needs .......................................................... 47 Scenario 3: Resilient PV and a Generator (Hybrid System) Sized to meet Resiliency Needs .... 48 Scenario 4: Generator Sized to meet Resiliency Needs .............................................................. 49 Discussion of Cooling Center Results Across All Scenarios .................................................. 50
4 Conclusion .......................................................................................................................................... 52 Appendix A. Critical Load Calculations .................................................................................................. 55 Appendix B. Resiliency Calculations ...................................................................................................... 57 Appendix C. Utility Rate Tariffs ............................................................................................................... 63 Appendix D. Additional Results .............................................................................................................. 65
NYC-DOE ............................................................................................................................................ 65 FDNY ................................................................................................................................................... 70 NYCHA ................................................................................................................................................ 75

ix
This report is available at no cost from the National Renewable Energy Laboratory (NREL) at www.nrel.gov/publications.
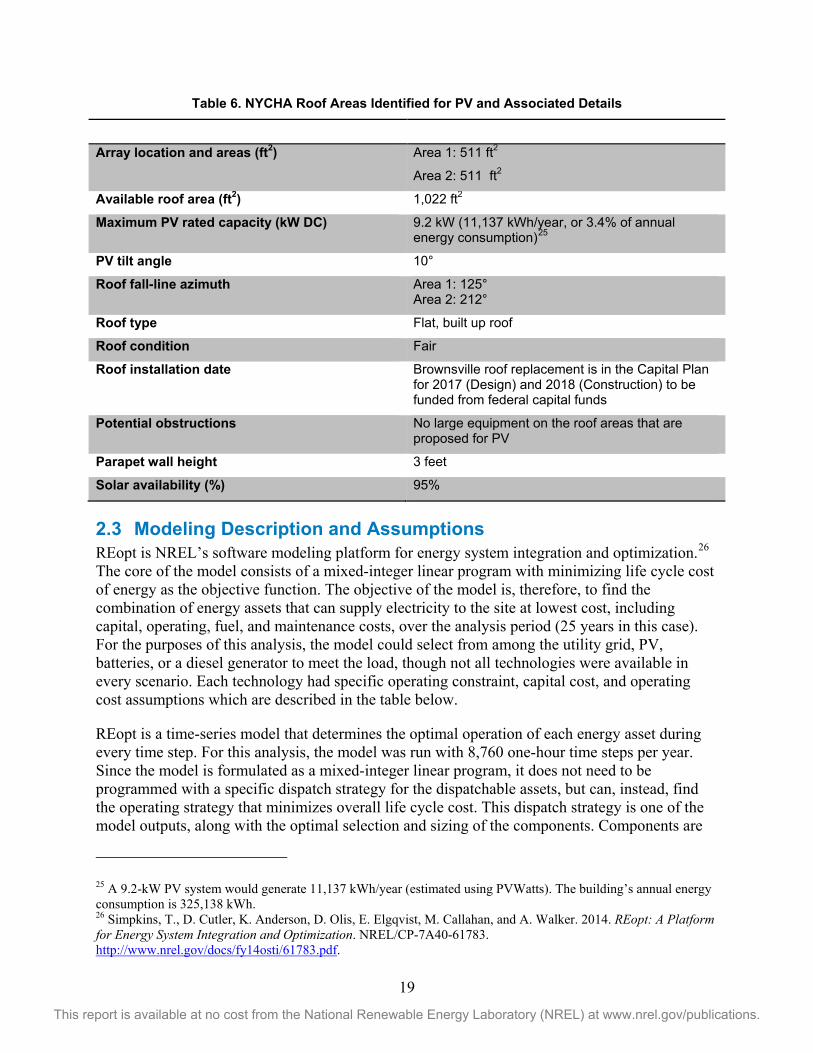
List of Figures Figure 1. Susan Wagner High School ....................................................................................................... 5 Figure 2. Susan Wagner High School annual energy profile 2014-2015 ............................................... 6 Figure 3. Susan Wagner High School composite daily load profile ...................................................... 6 Figure 4. Critical load: summer daily profile ............................................................................................ 7 Figure 5. Critical load: winter daily profile ............................................................................................... 8 Figure 6. Critical load: shoulder season daily profile ............................................................................. 8 Figure 7. Susan Wagner High School/Shelter PV layout ........................................................................ 9 Figure 8. Roof of the Susan Wagner High School, looking south in Area 1 ......................................... 9 Figure 9. FDNY EC309 in Marine Park ..................................................................................................... 11 Figure 10. FDNY EC309 annual electricity profile .................................................................................. 11 Figure 11. FDNY EC309 composite daily load profile ........................................................................... 12 Figure 12. Annual critical load profile ..................................................................................................... 13 Figure 13. FDNY: EC309 PV layout .......................................................................................................... 13 Figure 14. Roof of the fire station looking east from the west side ..................................................... 14 Figure 15. NYCHA Brownsville Senior Center ....................................................................................... 15 Figure 16. NYCHA Brownsville Senior Center annual load profile ...................................................... 16 Figure 17. NYCHA annual composite daily load profile ........................................................................ 16 Figure 18. NYCHA Brownsville Senior Center daily critical load profile ............................................. 17 Figure 19. NYCHA Senior Center PV layout ........................................................................................... 18 Figure 20. Roof of the NYCHA Senior Center/Cooling Center looking south ..................................... 18 Figure 21. Screenshot of DOE ICE Calculator inputs ............................................................................ 25 Figure 22. Con Edison system-wide grid reliability with storms ......................................................... 25 Figure 23. PV and battery combine to reduce peak demand ................................................................ 33 Figure 24. PV and battery support the critical load during a 51-hour outage .................................... 36 Figure 25. PV and battery reduce the size of generator required to meet the critical load during a 51-
hour outage ......................................................................................................................................... 37 Figure 26. PV and battery combine to reduce peak demand at the fire station ................................. 40 Figure 27. During a 21-hour grid outage on September 7th, the PV (orange) and battery (green) sustain
the critical load ................................................................................................................................... 42 Figure 28. During a 21-hour grid outage on September 7th, the PV (orange) and battery (green) meet
peak loads to reduce the size of generator required to sustain the critical load ........................ 43 Figure 29. The battery (green) is discharged in the evening to shave the peak demand ................. 46 Figure 30. During a 51-hour grid outage in August, PV production is marginal and the battery (green)
sustains most of the critical load ...................................................................................................... 48 Figure 31. During the 51-hour outage in August, the PV and battery reduce the size of diesel generator
required to meet the critical load, as well as reducing run-time of the diesel generator ........... 49 Figure B-1. Outputs from the ICE Calculator for the Fire Station ........................................................ 57 Figure B-2. Cost vs. Outage Length from the ICE Calculator for the Fire Station ............................. 58 Figure B-3. Outputs from the ICE Calculator for the NYCHA Cooling Center .................................... 59 Figure B-4. Cost vs. Outage Length from the ICE Calculator for the Cooling Center ....................... 60 Figure B-5. Outputs from the ICE Calculator for the School Shelter ................................................... 61 Figure B-6. Cost vs. Outage Length from the ICE Calculator for the School Shelter ........................ 62 Figure C-1. Service Classification No. 68 ............................................................................................... 63 Figure C-2. Service Classification No. 91 ............................................................................................... 64

x
This report is available at no cost from the National Renewable Energy Laboratory (NREL) at www.nrel.gov/publications.
List of Tables Table 1. School Shelter Load Data ......................................................................................................... 5 Table 2. DOE Roof Areas Identified for PV and Associated Details ................................................... 10 Table 3. Fire Station Load Data ........................................................................................................... 11 Table 4. FDNY Roof Areas Identified for PV and Associated Details ................................................ 14 Table 5. Cooling Center Load Data ...................................................................................................... 15 Table 6. NYCHA Roof Areas Identified for PV and Associated Details ............................................. 19 Table 7. Assumptions for the Analysis ................................................................................................. 20 Table 8. Con Edison Five-Year Average SAIFI Values for Radial and Network Customers .............. 26 Table 9. Con Edison CAIDI Values for Radial and Network Customers ............................................ 26 Table 10. Value of Resiliency for Study Facilities ............................................................................... 27 Table 11. Scenarios .............................................................................................................................. 31 Table 12. School Shelter Scenario 1 Results ........................................................................................ 32 Table 13. Percent of Critical Load System Can Support ...................................................................... 34 Table 14. School Shelter Scenario 2 Results ........................................................................................ 35 Table 15. School Shelter Scenario 3 Results ........................................................................................ 36 Table 16. School Shelter Scenario 4 Results ........................................................................................ 38 Table 17. School Shelter NPV and Payback Comparison of Scenarios 2, 3, and 4 ............................. 39 Table 18. Fire Station Scenario 1 Results ............................................................................................ 39 Table 19. Percent of Critical Load System Can Support ...................................................................... 40 Table 20. Fire Station Scenario 2 Results ............................................................................................ 41 Table 21. Fire Station Scenario 3 Results ............................................................................................ 42 Table 22. Fire Station Scenario 4 Results ............................................................................................ 44 Table 23. Fire Station NPV and Payback Comparison of Scenarios 2, 3, and 4 .................................. 44 Table 24. Cooling Center Scenario 1 Results ....................................................................................... 45 Table 25. Percent of Critical Load System Can Support ...................................................................... 47 Table 26. Cooling Center Scenario 2 Results ....................................................................................... 47 Table 27. Cooling Center Scenario 3 Results ....................................................................................... 48 Table 28. Cooling Center Scenario 4 Results ....................................................................................... 50 Table 29. Cooling Center NPV and Payback Comparison of Scenarios 2, 3, and 4 ............................ 51 Table A-1. NYCHA Cooling Center Daily Critical Load During the Summer ................................... 55 Table A-2. NYC-DOE School Shelter Daily Critical Load During the Summer and Winter .............. 56 Table B-1. Outputs from the ICE Calculator for 1-16 Hour Outages (in 60-Minute Increments) for the
Fire Station .................................................................................................................................. 58 Table B-2. Outputs from the ICE Calculator for 1-16 Hour Outages (in 60-Minute Increments) for the
Cooling Center ............................................................................................................................ 60 Table B-3. Outputs from the ICE Calculator for 1-16 Hour Outages (in 60-Minute Increments) for the
School Shelter ............................................................................................................................. 62 Table D-1. School Shelter Baseline: No Resilient PV ......................................................................... 65 Table D-2. School Shelter Scenario 1: Resilient PV Sized for Economic Savings .............................. 66 Table D-3. School Shelter Scenario 2: Resilient PV Sized to Meet Resiliency Needs ........................ 67 Table D-4. School Shelter Scenario 3: Resilient PV and Generator (Hybrid System) Sized to Meet
Resiliency Needs ......................................................................................................................... 68 Table D-5. School Shelter Scenario 4: Generator Sized to Meet Resiliency Needs ............................ 69 Table D-6. Fire Station Baseline: No Resilient PV .............................................................................. 70 Table D-7. Fire Station Scenario 1: Resilient PV Sized for Economic Savings .................................. 71 Table D-8. Fire Station Scenario 2: Resilient PV Sized to Meet Resiliency Needs ............................. 72 Table D-9. Fire Station Scenario 3: Resilient PV and Generator (Hybrid System) Sized to Meet
Resiliency Needs ......................................................................................................................... 73 Table D-10. Fire Station Scenario 4: Generator Sized to Meet Resiliency Needs ............................... 74

xi
This report is available at no cost from the National Renewable Energy Laboratory (NREL) at www.nrel.gov/publications.
Table D-11. Cooling Center Baseline: No Resilient PV ...................................................................... 75 Table D-12. Cooling Center Scenario 1: Resilient PV Sized for Economic Savings ........................... 76 Table D-13. Cooling Center Scenario 2: Resilient PV Sized to Meet Resiliency Needs ..................... 77 Table D-14. Cooling Center Scenario 3: Resilient PV and Generator (Hybrid System) Sized to Meet
Resiliency Needs ......................................................................................................................... 78 Table D-15. Cooling Center Scenario 4: Generator Sized to Meet Resiliency Needs ......................... 79

1
This report is available at no cost from the National Renewable Energy Laboratory (NREL) at www.nrel.gov/publications.
1 Introduction Electricity system resiliency focuses on preventing power disruption and, when an outage does occur, restoring electricity supply as quickly as possible while mitigating the consequences of the outage. Resiliency in energy services has always been a top priority, especially for critical or high-value facilities such as emergency response centers, hospitals, and shelters. Currently, diesel or gas-powered generators are relied upon for the majority of emergency power needs, though renewable energy and other forms of distributed generation are starting to play a role in energy resiliency.2
The United States has seen an increase in the number of high-impact/high-cost natural disasters—seven of the ten costliest storms in U.S. history have occurred in the last ten years.3 These high-impact events have sometimes resulted in widespread and long outage durations, demonstrating that existing approaches to energy resiliency were not sufficient in some cases. This was due to a number of factors including lack of generators or other forms of backup power; lack of refueling options for backup diesel generators; unreliable operation of backup generators; interruptions in natural gas and other fuel supplies; and aging infrastructure.
According to the NYC Hurricane Sandy After Action Report, the need for generators after the storm far exceeded the available supply. The city deployed approximately 230 generators in total.4 Even when they were available, generators failed at several high-profile hospitals in NYC after the storm and called attention to the fact that the presence of a generator does not ensure emergency power. Generators are more susceptible to failure when equipment is outdated, improperly maintained, placed in flood-prone basements, or when fuel supplies are limited.5 NYC codes limit onsite fuel storage for tank-based diesel generators to 250 gallons.6 For a building with a 200-kW generator operating at half capacity, a 250-gallon fuel supply would be depleted in just under 30 hours.7 The average annual outage duration with storms in NYC over the past 5 years is about 22 hours for affected radial customers and just over 50 hours for affected network customers8, but in 2012 (the year of Superstorm Sandy), outage durations
2 “Solar + Energy Storage = Resilient Power in Vermont.” 2014. Clean Energy Group. http://www.cleanegroup.org/solar-energy-storage-resilient-power-in-vermont/. 3 Executive Office of the President. 2013. Economic Benefits of Increasing Electric Grid Resilience to Weather Outages. http://energy.gov/sites/prod/files/2013/08/f2/Grid%20Resiliency%20Report_FINAL.pdf. 4 NYC Mayor’s Office. 2013. NYC Hurricane Sandy After Action Report. http://www.nyc.gov/html/recovery/downloads/pdf/sandy_aar_5.2.13.pdf. 5 Ornstein, C. 2012. “Why Do Hospital Generators Keep Failing?” ProPublica. https://www.propublica.org/article/why-do-hospitals-generators-keep-failing. 6 Fire Department of the City of New York. 2014. Study Material for the Citywide Certificate of Fitness Examination. http://www.nyc.gov/html/fdny/pdf/cof_study_material/s_94_st_mat.pdf. 7 Based on Cat Model D200-2, a 200-kW generator that is 50% loaded and uses 8.6 gallons/hour. 8 There are two types of electric grid systems, radial and secondary network. Radial systems have a single high voltage feeder sending energy from the substation to numerous distribution transformers tapped along it. Cables and transformers on radial grids are often above ground. Network grids have multiple primary feeders feeding several parallel network transformers that feed energy into a low voltage grid (grid network type) or local building bus (spot network) where the consumer is connected. Spot networks are where one or multiple transformers are dedicated to one large energy consuming building. Cables and transformers on network grids are often below ground. Network grids are considered more reliable than radial grids as there are redundant sources of backup power in case of failures on the grid and underground equipment is less prone to weather-related damage.

2
This report is available at no cost from the National Renewable Energy Laboratory (NREL) at www.nrel.gov/publications.
reached 73 and 58 hours, respectively.9 Fuel supply in New York was scarce after Sandy for nearly a month as a result of refineries being shut down and other damages to the fuel supply chain serving New York.10 Local supplies were not sufficient to meet needs, resulting in FEMA providing more than 3.48 million gallons of fuel for Sandy recovery at a cost of $6.37 million.11
Long-duration outages can lead to lost output, wages, and inventory. The estimated cost of U.S. weather-related outages in 2012 is $27-52 billion dollars.12 For individuals who rely on electronic medical equipment, these outages can be lethal. Adding to costs associated with Superstorm Sandy, NYC was sued for violating the Americans with Disabilities Act, in part for failing to provide adequate emergency power.13 The cost of power outages varies from person to person and facility to facility, but the costs are real, and so is the value of avoiding an outage.
Resilient PV can serve as an alternative or supplement to existing forms of backup power, extending limited fuel supplies when paired with generators. A resilient PV system can be operated for economic gain during the 99.9% of the time that the grid is functional by offsetting bulk energy purchases, reducing peak demand charges, performing energy arbitrage14, and providing ancillary services. With appropriate inverters and controls these same systems can be islanded to form a microgrid, often along with diesel generators, to sustain critical electrical loads for the site during grid outages. A hybrid generator/PV/battery system can sustain longer outages for a given amount of diesel fuel by reducing the run-time (and therefore fuel consumption) of the diesel generator, thus increasing the energy resiliency of the site.15 For the three sites evaluated in this analysis, the hybrid generator/PV/battery system consumed 9% -36% less fuel than the standalone diesel generator during long outages. Additionally, resilient PV systems may provide a fast-acting backup power supply for small, highly sensitive critical loads like computers or communications equipment. Some resilient PV designs can re-energize critical loads within 10 to 20 milliseconds, compared to generators that may take 3-10 seconds to start.
Standalone resilient PV systems avoid problems associated with generators like noise and air quality issues while offering host sites a cost-savings opportunity and a reduced carbon footprint. Resilient PV hits an intersection point between resiliency and sustainability, two significant areas
9 “Electric Service Reliability Reports.” 2015. New York State Department of Public Service. http://www3.dps.ny.gov/W/PSCWeb.nsf/All/D82A200687D96D3985257687006F39CA?OpenDocument. 10 NYC Mayor’s Office. 2013. A Strong, More Resilient New York. http://www.nyc.gov/html/sirr/downloads/pdf/final_report/Ch_1_SandyImpacts_FINAL_singles.pdf. 11 Office of Inspector General. 2015. FEMA Has No Assurance that Only Designated Recipients Received $6.37 Million in Fuel. Department of Homeland Security. https://www.oig.dhs.gov/assets/GrantReports/2016/OIG-16-04-D-Nov15.pdf. 12 Executive Office of the President. 2013. Economic Benefits of Increasing Electric Grid Resilience to Weather Outages.http://energy.gov/sites/prod/files/2013/08/f2/Grid%20Resiliency%20Report_FINAL.pdf. 13 Santora, M., and B. Weiser. 2013. “Court Says New York Neglected Disabled in Emergencies.” New York Times. http://www.nytimes.com/2013/11/08/nyregion/new-yorks-emergency-plans-violate-disabilities-act-judge-says.html. 14 Energy arbitrage is the process of charging batteries when energy prices are low, and discharging them when energy prices are high. This effectively shifts grid energy purchases to periods with lower energy prices. 15 1 kW of PV in NYC generates 1274 kWh/year, or an average of 0.145 kWh/hour. As previously described, a 200-kW generator that is 50% loaded requires 8.6 gallons of fuel to generate 100 kWh. If the generator fuel curve were linear, a solar system would offset approximately 0.01247 gallons of fuel per hour per kW of solar installed. In this example, a 100-kW PV system installed alongside the 200-kW generator would displace about 14.5% of the hourly fuel consumption, saving about 1.25 of the 8.6 gallons used each hour.

3
This report is available at no cost from the National Renewable Energy Laboratory (NREL) at www.nrel.gov/publications.
of interest for NYC and much of the country. With the technical analysis offered in this report, those who plan for the city’s emergency power needs have a template methodology to compare and contrast resilient power options and the opportunity to deepen collaboration across resiliency and sustainability programs.
Solar installations in New York are increasing rapidly. From 2011 to 2015, solar installations in New York increased 575%, and by 675% in NYC.16 The state is mandated to supply 50% of its electricity from renewables by 2030 and aims to deploy 3 GW of solar across the state by 2023. Energy storage can enable higher levels of intermittent renewables like solar, and studies show that the combined value of solar-plus-storage on commercial buildings is higher than deploying the technologies separately.17 In NYC, solar increased from a quarter of a megawatt in 2008 to nearly 50 megawatts in 2016, but few of these systems include backup power capabilities either through battery backup or inverters with emergency power plugs. Only a handful of commercial-scale solar-plus-storage systems exist in NYC today, and only a few of these systems are configured to provide emergency backup power. With NYC committed to deploy 100 MW of solar on city-owned buildings by 2025, this report highlights the unique opportunity that resilient PV systems can provide for critical infrastructure sites, many of which are owned by the city. The NYSolar Smart Distributed Generation (DG) Hub, through projects like this analysis, is creating pathways for resilient PV to reach the market.18
16 “Solar Growth per Region.” 2015. NYSERDA. http://www.nyserda.ny.gov/-/media/Files/About/SUN-GEN-solar-growth-by-region.pdf. 17 Sussman, M., and J. Lutton. 2015. “The Economics of Solar, Storage and Solar-Plus-Storage.” Greentech Media. http://www.greentechmedia.com/articles/read/The-Economics-of-Solar-Storage-and-Solar-Plus-Storage. 18 The DG Hub was formed by Sustainable CUNY in the aftermath of Hurricane Sandy, and received funding from the U.S. Department of Energy, NYSERDA, and NYPA in 2015 to work with partners to create strategic pathways for greater resiliency using solar and storage. Additional DG Hub resources can be found at www.cuny.edu/DGHub.

4
This report is available at no cost from the National Renewable Energy Laboratory (NREL) at www.nrel.gov/publications.
2 Methodology The City University of New York (CUNY) and the National Renewable Energy Laboratory (NREL) worked with city partners to select three critical infrastructure sites at which to evaluate PV and battery opportunities. CUNY and NREL gathered preliminary utility and site data, and verified the data during site assessments. For each of the three critical sites selected, we modeled the economic and resiliency benefits of PV and battery systems at the three sites. This section documents the data collected and assumptions made for the modeling.
Selection of Critical Infrastructure Sites 2.1CUNY and NREL, in coordination with the NYSolar Smart DG Hub software working group, identified a range of critical infrastructure facility types to consider: utilities, coastal storm shelters, transportation systems, telecommunication systems, water and wastewater treatment facilities, and healthcare facilities, among others.
CUNY sent a survey to the working group to determine the critical infrastructure facility types to focus on in the analysis. The potential sites included gas stations, nursing homes, hospitals, water treatment facilities, shelters, and stores selling emergency supplies. Site selection was based on the following factors:
• Evacuation zones and close proximity to flood plain • Prone to outages • No existing backup generation • Non-hospital site that serves medical needs • Roof age (20+ years of usable life remaining) with limited shading • Space for PV and battery (20,000 sq. ft. for solar) • Number of people the shelters supported during storms Irene and Sandy • Support from the building staff • Sites with high demand charges • Sites where energy efficiency upgrades are being implemented or considered.
The three critical infrastructure facility types selected were fire stations, cooling centers, and coastal storm shelters. CUNY reached out to the New York Department of Citywide Administrative Services (DCAS), New York City Department of Education (NYC- DOE), New York City Fire Department (FDNY), and New York City Housing Authority (NYCHA) to help select the specific sites to be analyzed in the study. The sites selected were:
• NYC-DOE coastal storm shelter: Susan Wagner High School, 1200 Manor Road, Staten Island, New York, 10314
• FDNY fire station: Engine Company 309, 1864 East 48th Street, Brooklyn, New York, 11234
• NYCHA cooling center: Brownsville Senior Center, 528 Mother Gaston Blvd, Brooklyn, New York.

5
This report is available at no cost from the National Renewable Energy Laboratory (NREL) at www.nrel.gov/publications.
Site Overview 2.2A summary of the three critical infrastructure sites is presented in this section.
2.2.1 NYC-DOE High School/Shelter Description and Load Data The Susan Wagner High School is located on Staten Island and served as a shelter (Figure 1) after Hurricane Sandy with approximately 1,000 beds in the cafeteria. The school lost power after Sandy and had diesel generators brought in for backup power.
Table 1. School Shelter Load Data
Data Source DCAS
Data Type 15-minute interval; September 2014 – August 2015
Methodology
Interval data were synthesized by modeling the building based on DOE’s secondary school commercial reference building and the New York City climate zone (ASHRAE climate zone 4A).
Load Size
Minimum Load
Maximum Load
Average Load
Peak Loads
42 kW 588 kW 177 kW May – October
Figure 1. Susan Wagner High School
Photo by Kari Burman, NREL
The annual energy profile is shown in Figure 2. Relative to May and September, peak loads do not increase during the summer months of June through August due to summer vacation.

6
This report is available at no cost from the National Renewable Energy Laboratory (NREL) at www.nrel.gov/publications.
Figure 2. Susan Wagner High School annual energy profile 2014-2015
The composite daily load profile is shown in Figure 3. The peak load occurs during the mid-afternoon which would be expected for a school.
Figure 3. Susan Wagner High School composite daily load profile
Utility Rate Structure The Susan Wagner High School is on the NYPA Service Tariff No. 100, Service Classification No. 91 for New York City Public Buildings-Schools, conventional, low tension service (see Service Classification No. 91, Appendix B, Table of Rates and Service). The tariff has an energy charge component (with different charges for summer and winter seasons) and a demand charge component. The demand component is split into a production charge and a delivery charge. For the production charge component, if metered demand in any given month is less than 75% of the maximum demand in the prior 12 months, billed demand is equal to 75% of the earlier maximum demand. For the delivery charge component, if metered demand in any given month is less than 39% of the maximum demand in the prior 18 months, billed demand is equal to 39% of the earlier maximum demand. Otherwise, the demand charges are the actual measured demand for the month.
0
50
100
150
200
250
300
Load
(kW
)
12:00 AM 4:00 AM 8:00 AM 12:00 PM 4:00 PM 8:00 PM 12:00 AM

7
This report is available at no cost from the National Renewable Energy Laboratory (NREL) at www.nrel.gov/publications.
The school is eligible for a net metering agreement. Since this site is on a spot network, however, additional smart grid equipment must be installed at NYC-DOE’s expense if the PV system exports to the grid. Per Con Edison guidance, buildings on a spot network may either enable a reverse power relay (RPR) to prevent export at a cost of $5,000 or implement a smart grid solution that allows export at a cost of $50,000-100,000. If the school installed the maximum PV system size (210 kW), the energy exported from the system would be worth about $500/year ($12,500 over 25 years), which is less than the cost of the smart grid solution and negates the benefit of net metering. Therefore, in this analysis we assumed an RPR would be implemented at a cost of $5,000 to prevent export.
Critical Load Data NYC-DOE provided a list of equipment that would need to operate during an outage as well as an estimate of the number of hours each item would run. Since the shelter might need to operate year-round, we synthesized critical load profiles for summer, winter, and shoulder seasons (see Figures 4-6). The seasonal differences are primarily a result of air conditioning and auxiliary space heating loads. The summer (June-August) critical load includes air conditioning in limited rooms for shelter residents with special needs, while the winter (October-April) critical load includes space heating. The critical load in the shoulder season (September, May) includes neither. We estimated the total critical energy use was 352 kWh/day in the summer and 432 kWh/day in the winter, which is approximately 7-13% of typical load. Peak critical demand ranges from 33 kW in the winter and shoulder seasons to 36 kW in summer. See Appendix A for a full list of equipment and calculations.
Figure 4. Critical load: summer daily profile

8
This report is available at no cost from the National Renewable Energy Laboratory (NREL) at www.nrel.gov/publications.
Figure 5. Critical load: winter daily profile
Figure 6. Critical load: shoulder season daily profile
Types of Existing Backup Power There is no existing backup power/generation at the Susan Wagner High School. Backup diesel generators were brought in during the power outage after Hurricane Sandy.
PV Assessment We visually inspected the roof areas of the high school to measure roof size, presence of rooftop equipment, and potential shading. The high school could accommodate PV systems on the roof areas designated in Figure 7. PV could also potentially be placed on carports in the parking lot, but this area was not considered in this analysis.

Figure 7. Susan Wagner High School/Shelter PV layout
Source:© 2016 Google Earth, alterations by Kari Burman
Potential PV
Carport
New
Building
Figure 8. Roof of the Susan Wagner High School, looking south in Area 1
Photo by Kari Burman, NREL
9
This report is available at no cost from the National Renewable Energy Laboratory (NREL) at www.nrel.gov/publications.

10
This report is available at no cost from the National Renewable Energy Laboratory (NREL) at www.nrel.gov/publications.
Table 2. DOE Roof Areas Identified for PV and Associated Details
Array location and areas (ft2) Area 1: 3,626 ft2
Area 2: 7,373 ft2
Area 3: 3,000 ft2
Area 4: 3,960 ft2
Area 5: 1,050 ft2
Area 6: 1,722 ft2
Area 7: 1,320 ft2
Area 8: 1,272 ft2 Available roof area (ft2) 23,323 ft2 Maximum PV rated capacity (kW DC) excluding potential carport areas
210 kW (254,457 kWh/year, or 16% of annual building energy consumption)19
PV tilt angle 10° Roof fall-line azimuth 173° Roof type Flat Roof condition Fair Roof installation date New roof will be installed in FY16 Potential obstructions Potential PV is designed around large
equipment
Parapet wall height 3 feet
Solar availability (%) PV was designated for areas with at least 90% solar availability
2.2.2 FDNY Engine Company 309 Description and Load Data Engine Company (EC) 309, located at 1864 East 48th Street in Brooklyn, provides fire and emergency medical services. This facility lost power for about five days after Hurricane Sandy.
Recent renovations at the fire station included a new roof; it re-opened in July 2015. Because the building systems and the occupancy of the station changed, historical pre-renovation energy data for EC309 were not representative of future energy consumption. We used the one month of post-renovation energy data available (August 2015) and estimated the remaining months of the year based on energy data for EC315, a station of similar size and with similar August energy consumption and demand.
19 A 210-kW PV system would generate 254,457 kWh/year (estimated using PVWatts). The school’s annual energy consumption is 1,556,800 kWh.

11
This report is available at no cost from the National Renewable Energy Laboratory (NREL) at www.nrel.gov/publications.
Table 3. Fire Station Load Data
Data Source DCAS
Data Type Energy and demand data
Methodology
Interval data were not available for this site, so they were estimated from the monthly electric use of a similar station by modeling the building based on DOE’s commercial reference buildings and the New York City climate zone (ASHRAE climate zone 4A). A fire station is not one of the DOE commercial reference building types, so we assumed 50% warehouse (for the garage area downstairs) and 50% midrise apartment (for the upstairs firefighter living quarters).
Load Size
Minimum Load
Maximum Load
Average Load
Peak Loads
2.86 kW 63.2 kW 15.2 kW May – October
Figure 9. FDNY EC309 in Marine Park
Photo by Kari Burman, NREL
The annual electricity profile is shown in Figure 10.
Figure 10. FDNY EC309 annual electricity profile

12
This report is available at no cost from the National Renewable Energy Laboratory (NREL) at www.nrel.gov/publications.
Peak loads occur during the hotter summer months of July-September. The composite daily load profile is shown in Figure 11. The daily peak load occurs around 4 p.m.
Figure 11. FDNY EC309 composite daily load profile
Utility Rate Structure The fire station is on the NYPA Service Tariff No. 10020, Service Classification No. 91 for New York City Public Buildings, conventional, low tension service (see Service Classification No. 91, Appendix B, Table of Rates and Services). The tariff has an energy charge component (with different charges for summer and winter seasons) and a demand charge component. The demand component is split into a production charge and a delivery charge. For the production charge component, if metered demand in any given month is less than 75% of the maximum demand in the prior 12 months, billed demand is equal to 75% of the earlier maximum demand. For the delivery charge component, if metered demand in any given month is less than 39% of the maximum demand in the prior 18 months, billed demand is equal to 39% of the earlier maximum demand. Otherwise, the demand charges are the actual recorded value for the month.
The fire station is eligible for a net metering agreement. This building is on a radial grid.
Critical Load Data FDNY did not provide a specific list of critical loads, so we estimated the critical load by applying a percentage reduction to the typical load. . The critical load level assumed for the fire station is 65% of typical load21, which is approximately 350 kWh/day in the summer and 170 kWh/day in the winter. This would include loads such as computers and communication equipment in the control center, lighting, and pumps to fuel trucks. The critical annual load profile is shown in Figure 12.
20 NYPA. 2015. Electric Service Tariff for New York City Governmental Customers, Service Tariff No. 100, Date of Issue March 2015. 21 The NYC and San Francisco Solar Market Pathways teams conducted site visits at fire stations to determine critical loads. Critical loads were estimated by staff to be in the range of 65-100%; 65% was selected since backing up a larger load would likely be cost prohibitive.
0
5
10
15
20
25
Load
(kW
)
12:00 AM 4:00 AM 8:00 AM 12:00 PM 4:00 PM 8:00 PM 12:00 AM

13
This report is available at no cost from the National Renewable Energy Laboratory (NREL) at www.nrel.gov/publications.
Figure 12. Annual critical load profile
Types of Existing Backup Power There is no existing backup power/generation at this fire station at the time of the site visit.
PV Assessment We visually inspected the roof areas of the fire station to measure roof size and identify the presence of rooftop equipment and potential shading. For buildings under 100 linear feet high, the New York City fire code22 requires a clear path on the roof of not less than six feet horizontal width from the front of the building to the rear of the building. An aerial view of the roof, with space available for PV, is shown in Figure 13 and a picture of the roof is shown in Figure 14. Table 4 shows the roof dimensions and PV capacity. This roof is estimated to be able to support approximately 10.2 kW-DC of PV.
Figure 13. FDNY: EC309 PV layout
Source: © 2016 Google Earth, alterations by Kari Burman
22 The New York City Fire Code, Chapter 504 and 512. 2014. http://www.nyc.gov/html/fdny/apps/pdf_viewer/viewer.html?file=firecode_chap_05.pdf§ion=firecode_2014.

14
This report is available at no cost from the National Renewable Energy Laboratory (NREL) at www.nrel.gov/publications.
Figure 14. Roof of the fire station looking east from the west side
Photo by Allison Silverman, CUNY
Table 4. FDNY Roof Areas Identified for PV and Associated Details
Array location and areas (ft2) Area 1: 891.3 ft2
Area 2: 251.6 ft2 Available roof area (ft2) 1,142 ft2 Maximum PV rated capacity (kW DC) 10.2 kW (12,362 kWh/year, or 9.2% of building annual
energy consumption)23 PV tilt angle 10° Roof fall-line azimuth 175° Roof type Flat Roof condition New Roof installation date 2015 Potential obstructions Large equipment that was previously on the roof (shown in
the roof image above) was removed during the renovation Parapet wall height 3 feet Solar availability (%) 95%
23 A 10.2-kW PV system would generate 12,362 kWh/year (estimated using PVWatts). The fire station’s annual energy consumption is 133,812 kWh.

15
This report is available at no cost from the National Renewable Energy Laboratory (NREL) at www.nrel.gov/publications.
2.2.3 NYCHA Cooling Center Description and Load Data The Brownsville Senior Center (Figure 15) is located at 528 Mother Gaston Blvd in Brooklyn, New York. The senior center is located on the first floor of a seven story apartment building and may serve as a cooling center for up to 70 people during heat waves. The building lost power for about three days after Hurricane Sandy.
Figure 15. NYCHA Brownsville Senior Center
Photo by Allison Silverman, CUNY
Table 5. Cooling Center Load Data
Data Source NYCHA
Data Type 15-minute interval; January 2015 – September 2015
Methodology
15-minute interval data were provided for January-September. October – December data were estimated based on previous months: March for October, February for November and January for December.
Load Size
Minimum Load
Maximum Load
Average Load
Peak Loads
21.5 kW 77.3 kW 30.5 kW June – Sept.

16
This report is available at no cost from the National Renewable Energy Laboratory (NREL) at www.nrel.gov/publications.
Figure 16. NYCHA Brownsville Senior Center annual load profile
A composite daily load profile for the entire apartment building was created by averaging the daily load profiles for the entire year (Figure 16 and Figure 17). The peak load occurs in the evening between 8 p.m. – 11 p.m., and the minimum load occurs in the morning between the hours of 5 a.m. - 9 a.m.
Figure 17. NYCHA annual composite daily load profile
Utility Rate Structure The NYCHA Brownsville Senior Center is on the NYPA Service Tariff No. 100, Service Classification No. 68 for Multiple Dwellings-Redistribution, Time of Day (TOD), low tension service (see Service Classification No. 68, Appendix B, Table of Rates and Service). The tariff has an energy charge component (with different charges for summer and winter seasons) and on and off peak periods. It also has a demand charge component with different demand charges for summer and winter periods. The demand component is split into a production charge and a delivery charge. For the production charge component, if metered demand in any given month is
0
2
4
6
8
10
12
Load
(kW
)
12:00 AM 4:00 AM 8:00 AM 12:00 PM 4:00 PM 8:00 PM 12:00 AM

17
This report is available at no cost from the National Renewable Energy Laboratory (NREL) at www.nrel.gov/publications.
less than 75% of the maximum demand in the prior 12 months, billed demand is equal to 75% of the earlier maximum demand. For the delivery charge component, if metered demand in any given month is less than 39% of the maximum demand in the prior 18 months, billed demand is equal to 39% of the earlier maximum demand. Otherwise, the demand charges are based on the actual recorded value for the month.
The NYCHA Brownsville Senior Center is eligible for a net metering agreement. This building is on an area network.
Critical Load Data The critical load profile for the NYCHA cooling center was synthesized by adding the individual component loads as specified by Brownsville staff. These components consist of air conditioners, a computer, lighting, fire alarm system, and refrigerator. The air conditioners are estimated to operate 8 hours/day during the grid outage and represent the majority of energy consumption in the critical load (~96 kWh/day). See Appendix A for a full list of critical loads and calculations. A graph of the synthesized critical daily load profile used in this analysis is shown in Figure 18. Since the cooling center would only operate during the summer, the critical load profile was developed for the summer season only.
Figure 18. NYCHA Brownsville Senior Center daily critical load profile
Types of Existing Backup Power There is no existing backup power at Brownsville Senior Center.
PV Assessment We visually inspected the roof areas of the NYCHA Senior Center to measure roof size, presence of rooftop equipment, and potential shading. The Senior Center could accommodate PV systems on the roof areas designated in the figures below. Note that areas on the 6th floor were not

18
This report is available at no cost from the National Renewable Energy Laboratory (NREL) at www.nrel.gov/publications.
considered for PV due to shading from the 7th floor and elevator shaft in the center. This building is under 100 linear feet, so it must comply with the New York City fire code24 which requires a clear path on the roof of not less than six feet horizontal width from the front of the building to the rear of the building. An aerial view of the roof with space available for PV is shown in Figure 19, and a picture of the roof is shown in Figure 20. Table 6 shows the roof dimensions and PV capacity. This roof can support approximately 9.2 kW-DC of PV.
Figure 19. NYCHA Senior Center PV layout
Source: © 2016 Google Earth, alterations by Kari Burman
Figure 20. Roof of the NYCHA Senior Center/Cooling Center looking south
Photo by Allison Silverman, CUNY
24 The New York City Fire Code, Chapter 504 and 512. 2014. http://www.nyc.gov/html/fdny/apps/pdf_viewer/viewer.html?file=firecode_chap_05.pdf§ion=firecode_2014.
These areas are on the 6th floor and shaded by Areas 1 and 2 that are on the 7th floor.
19
This report is available at no cost from the National Renewable Energy Laboratory (NREL) at www.nrel.gov/publications.
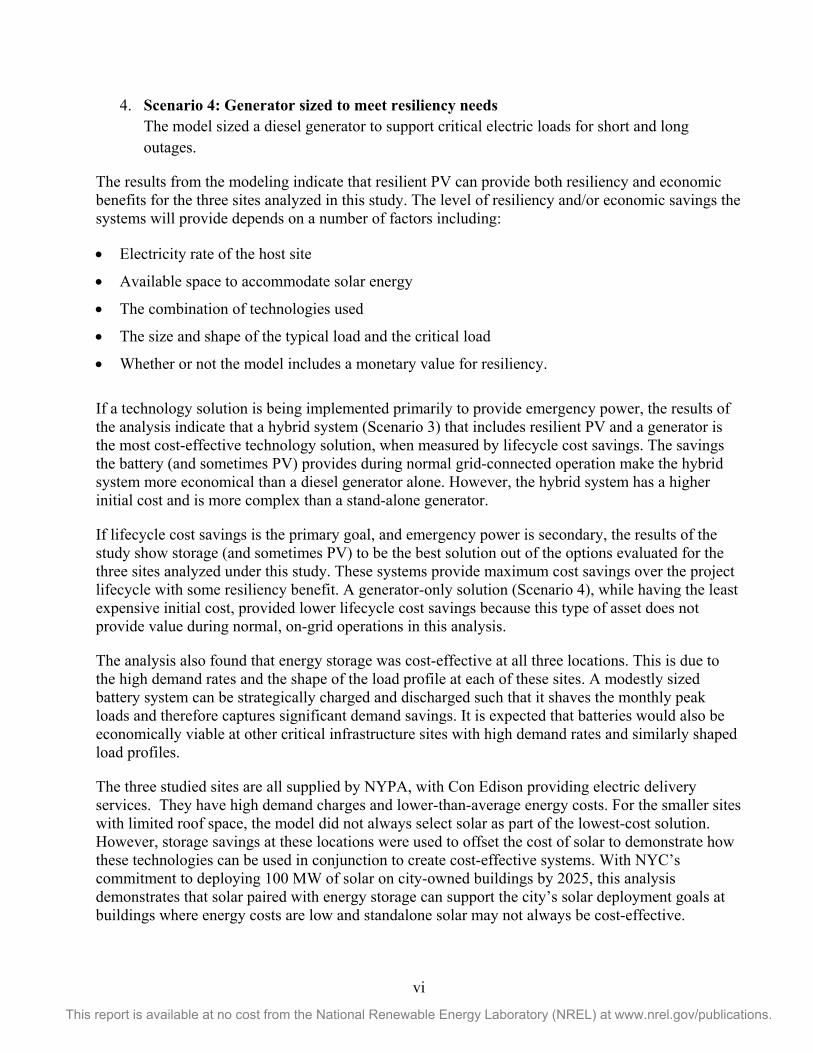
Table 6. NYCHA Roof Areas Identified for PV and Associated Details
Array location and areas (ft2) Area 1: 511 ft2
Area 2: 511 ft2 Available roof area (ft2) 1,022 ft2 Maximum PV rated capacity (kW DC) 9.2 kW (11,137 kWh/year, or 3.4% of annual
energy consumption)25 PV tilt angle 10° Roof fall-line azimuth Area 1: 125°
Area 2: 212° Roof type Flat, built up roof Roof condition Fair Roof installation date Brownsville roof replacement is in the Capital Plan
for 2017 (Design) and 2018 (Construction) to be funded from federal capital funds
Potential obstructions No large equipment on the roof areas that are proposed for PV
Parapet wall height 3 feet
Solar availability (%) 95%
Modeling Description and Assumptions 2.3REopt is NREL’s software modeling platform for energy system integration and optimization.26 The core of the model consists of a mixed-integer linear program with minimizing life cycle cost of energy as the objective function. The objective of the model is, therefore, to find the combination of energy assets that can supply electricity to the site at lowest cost, including capital, operating, fuel, and maintenance costs, over the analysis period (25 years in this case). For the purposes of this analysis, the model could select from among the utility grid, PV, batteries, or a diesel generator to meet the load, though not all technologies were available in every scenario. Each technology had specific operating constraint, capital cost, and operating cost assumptions which are described in the table below.
REopt is a time-series model that determines the optimal operation of each energy asset during every time step. For this analysis, the model was run with 8,760 one-hour time steps per year. Since the model is formulated as a mixed-integer linear program, it does not need to be programmed with a specific dispatch strategy for the dispatchable assets, but can, instead, find the operating strategy that minimizes overall life cycle cost. This dispatch strategy is one of the model outputs, along with the optimal selection and sizing of the components. Components are
25 A 9.2-kW PV system would generate 11,137 kWh/year (estimated using PVWatts). The building’s annual energy consumption is 325,138 kWh. 26 Simpkins, T., D. Cutler, K. Anderson, D. Olis, E. Elgqvist, M. Callahan, and A. Walker. 2014. REopt: A Platform for Energy System Integration and Optimization. NREL/CP-7A40-61783. http://www.nrel.gov/docs/fy14osti/61783.pdf.

20
This report is available at no cost from the National Renewable Energy Laboratory (NREL) at www.nrel.gov/publications.
sized using continuous variables rather than discrete variables for sizing, so the exact sizes recommended may not be available in the market. For example, an 11-kW, 32-kWh battery may be recommended, but the closest commercially available size may be a 10-kW, 30-kWh battery.
The table below summarizes the modeling assumptions used at each site.
Table 7. Assumptions for the Analysis
PV Assumptions
PV capital costs
• NYC-DOE School Shelter: $3.45/W-DC based on projected third-party financing prices for DCAS
• FDNY Fire Station: $3.88/W-DC based on DCAS historic PV contract prices
• NYCHA Cooling Center: $4.64/W-DC based on 2015 NYC Solarize contract pricing for 10-kW flat roof systems
PV cost details
• Costs are total installed costs including engineering, permitting, and interconnection. Additional potential costs are listed at the end of this section.
• Costs include a grid-forming inverter that assists with regulation of both voltage and frequency during a grid outage.
• A cost of $5,000 is added to the capital cost of systems at the DOE site (in addition to the $3.45/W PV capital cost) to pay for an RPR to prevent export to the spot network.
O&M cost $20/kW/year
PV system specifications
• Calculations assume standard modules in a fixed roof mount array with 14% system losses.
• Systems are modeled with 10° tilt. • System azimuth varied by site (180° is a due-south orientation):
o NYC-DOE: 173° o FDNY: 175° o NYCHA Area 1: 125°, Area 2: 212°.

21
This report is available at no cost from the National Renewable Energy Laboratory (NREL) at www.nrel.gov/publications.
Storage Assumptions
Battery type Lithium-ion nickel manganese cobalt oxide27
Minimum state of charge 20%28
State of charge at time of outage
100%
Round-Trip AC-AC Efficiency 92.5%29
Capital cost Initial Cost: $520/kWh, $1000/kW 30,31
Replacement cost Assume battery is replaced once at year 12. Estimated replacement cost in 2037 is $200/kWh, $200/kW
Diesel Generator Assumptions
Capital cost $1.50/W
Non-fuel O&M cost $0.02/kWh
Fuel cost $2.52/gallon32
Diesel fuel cost escalation rate 0.4%/year33
Fuel available 250 gallons
Minimum turndown 30%
Fuel curve slope (gal/kW/hr) 0.07211934
Fuel curve intercept (gal/hr) 0.435884
Availability Runs only during grid outages and scheduled maintenance testing. We assume the generators do not participate in peak load management.
Utility Assumptions
Electricity costs See Appendix C for tariff details.
Electricity cost escalation rate 1.52%/year35
Ownership and Financing
Ownership model NYC-DOE: Third party FDNY: Direct ownership
27 DG HUB. 2015. “Resilient Solar Photovoltaics (PV) Systems.” http://www.cuny.edu/about/resources/sustainability/SmartDGHubEmergencyPower/DecHardwareFactSheet.pdf. 28 Ibid. 29 Ibid. 30 DG Hub Survey. 2015. www.cuny.edu/DGHub 31 Rocky Mountain Institute. 2015. “Defection Economics: PV, Batteries, and the Grid.” Presented May 7, 2015. 32 https://www.eia.gov/dnav/pet/pet_pri_gnd_dcus_y35ny_a.htm 33 National Institute for Standards and Technology (NIST). 2015. “Energy Price Indices and Discount Factors for Life-Cycle Cost Analysis- 2015.” http://energy.gov/eere/femp/downloads/energy-price-indices-and-discount-factors-life-cycle-cost-analysis-2015 34 Based on Homer Pro 50-kW generator 35 National Institute for Standards and Technology (NIST). 2015. “Energy Price Indices and Discount Factors for Life-Cycle Cost Analysis- 2015.” http://energy.gov/eere/femp/downloads/energy-price-indices-and-discount-factors-life-cycle-cost-analysis-2015

22
This report is available at no cost from the National Renewable Energy Laboratory (NREL) at www.nrel.gov/publications.
NYCHA: Third party Corporate tax rate 35%
Developer discount rate 10%
Off-taker discount rate 3.1%
Incentives
Investment Tax Credit (ITC)
• Third-party ownership scenario: • 30% ITC applied to PV only; not applied to batteries because
they are not charged at least 75% from PV • Direct ownership scenario: ITC not applied
Modified Accelerated Cost Recovery System (MACRS)
• Third-party ownership scenario: 5 year MACRS applied to PV • Direct ownership scenario: MACRS not applied
Net metering NYC-DOE: No FDNY, NYCHA: Yes
NYSERDA NY-Sun incentive for PV systems under 200 kW
$0.80/W for the first 50 kW and $0.50/W for the next 51-200 kW36
Property tax abatement None (government property)
Solar Renewable Energy Credit (SREC)
None
Value Streams
Ancillary services None37
Demand response
• NYC-DOE: The Susan Wagner High School participates in the DCAS (NYISO) demand response program. Based on historical data, DCAS estimates savings of $100/kW reduced in each season (summer and winter). Because the potential savings from peak demand management are greater, and participating in the demand response program would reduce battery availability for peak demand management, in this analysis the potential demand response revenues are not included.
• FDNY: No demand response; the system is too small to participate. • NYCHA: No demand response; the system is too small to participate.
Grid outage cost • FDNY: $917.43/hour • NYCHA: $87.53/hour (See Section 2.4) • NYC-DOE: $68.97/hour
The costs modeled in this analysis include the installed cost of the PV, battery, and/or diesel generator. There may be additional costs associated with integrating these systems that are not included in the analysis. This is due to a lack of validated cost data. These may include:
36 See NY-Sun Nonresidential Block Structure, Block 3: http://ny-sun.ny.gov/For-Installers/Megawatt-Block-Incentive-Structure. 37 NYISO ancillary services program requires 1 MW minimum. These sites are all <210 kW so aggregation to meet this threshold is unlikely.

23
This report is available at no cost from the National Renewable Energy Laboratory (NREL) at www.nrel.gov/publications.
• Building physical characteristics: Installation costs can vary based on the relative ease or difficulty of installing equipment and communication and controls. For example, ideal locations for electrical or communication and controls equipment may be mechanical and electrical rooms. If these spaces do not have enough room or working clearance, additional conduit runs or trenching may be necessary.
• Structure to house batteries and environmental controls: Environmental controls (cooling, ventilation, and filters) may be required to maintain the batteries within the manufacturer’s recommended operating range. A shipping container or other structure to house the batteries may also be required if they cannot be stored inside the buildings.
• Automatic transfer switch: We assume a manual transfer switch would be installed to isolate the facility from the grid during a grid outage. This requires a person to physically flip a switch to transfer to the backup power system. The cost of the switch depends on the building voltage. An automated transfer switch could be included at additional cost. In either case, a brief outage will occur while the facility is switched from grid-connected mode to islanded mode, though in the case of the automated transfer switch, the outage would be of shorter duration (typically a few milliseconds to a few seconds).
• Critical load isolation: We did not include the cost of retrofitting the buildings with critical load panel(s). Depending on the electrical distribution infrastructure of the building, this cost can range from $10,000 to $100,00038 or more for a building in NYC, including design/permit, electrician’s fees for re-wiring, transfer switches, and new critical load panels. It may be more cost-effective to supply the entire building rather than modify the electrical system. In this case, some loads would need to be manually turned off during islanding events. In other cases, the building may have already installed a critical load panel.
• Site controller: Using resilient PV and hybrid systems during grid outages may add cost beyond what is presented in this analysis, depending on the level of system integration that is required. While most bi-directional inverters on the market are already enabled for island operation, they are controlled differently in island mode. Some commercially available microgrid controllers may be easily configured to provide both grid-connected and island functionality while others may require significant system integration engineering and additional hardware for proper islanded operation of all resources. Depending on the out-of-the-box capabilities of the site controller and the respective front end monitoring and control equipment on the PV inverter, battery, and diesel generator, this might add an additional $20,000 or more39 in system integration costs to a project. There may also be some additional hardware costs for communication cables and devices on the order of $5,000-10,000.40 If a standalone diesel generator is used to provide backup power, no additional monitoring or control costs are anticipated since controls are already built into the generator.
Additionally, it is important to note that actual demand savings may vary from predicted demand savings based on the actual battery control strategy used at the site. Because actual interval load data were not available for two of the three sites (the fire station and the school), load data were synthesized from models. There is some additional uncertainty in the results for these sites 38 Email with energy company, 12/11/15. 39 Email with energy company, 12/11/15. 40 Conversation with Robert Butt, Senior Engineer, NREL, 12/14/15.

24
This report is available at no cost from the National Renewable Energy Laboratory (NREL) at www.nrel.gov/publications.
because hour-to-hour load variation in actual load profiles may be different from those developed by the models.
There may also be additional value streams not included in this analysis. For example, for systems meeting certain requirements, NYPA’s peak load management program offers payments for capacity and energy reductions during demand response events.41
Value of Resiliency 2.4Many organizations have trouble quantifying the price they are willing to pay for having a source of continuous, reliable electricity. The challenge of valuing resiliency causes most PV and battery systems to be designed and installed based upon their expected economic return during normal grid-connected operation. Although these systems will provide some measure of added resiliency, often no hard monetary value is assigned to the added resiliency, which is to say that the systems are expected to “pencil-out” before resiliency is considered.
This analysis modeled a resiliency value stream within the REopt model in order to demonstrate how valuing resiliency impacts system sizing and project economics. In this study, we assume that the value of resiliency to a site is equal to the costs they incur during an outage. The cost of power interruptions for a facility is a site-specific cost that depends on a number of factors including frequency, duration, timing of outages, activities that take place in the facility, and availability of backup systems. To calculate a site-specific outage cost, the facility could add up the damages that it will experience as a result of a grid outage. Some facilities such as government organizations involved in life safety may be exposed to other second- and third-order damages (i.e., inability to treat wastewater, inability to dispatch firefighters, inability to react to criminal activity).
In general, there are two approaches to determining the cost of a grid interruption: macroscopic or microscopic. In the macroscopic approach, the value is based on national or utility-wide estimates of outage costs that have been experienced in the past.42 This method requires relatively little data, but may not capture site-specific values well. In the microscopic approach, the value is based on a survey of the site-specific installation of outage costs.43 This may be more accurate, but is much more time-consuming to determine.
To determine the value of resiliency for the facilities in this study, the team selected a macroscopic approach because it is widely applicable, replicable for other facilities, and could be applied without lengthy data collection activities at the site. The U.S. Department of Energy’s (DOE) Interruption Cost Estimator (ICE) calculator was used44 to calculate outage costs that were used as a proxy for the value of resiliency for grid outages at each site based on utility reliability metrics and site characteristics.
41 See. “The Power of Demand: Peak Load Management Program for Governmental Customers.” http://www.nyc.gov/html/dem/downloads/pdf/PLM_brochure.pdf. 42 Sullivan, M., J. Schellenberg, and M. Blundell. 2015. Updated Value of Service Reliability Estimates for Electric Utility Customers in the United States. Berkeley, CA: LBNL. http://eetd.lbl.gov/sites/all/files/lbnl-6941e_0.pdf. 43 Sullivan, M., and D. Keane. 1995. Outage Cost Estimation Guidebook EPRI. http://www.epri.com/abstracts/Pages/ProductAbstract.aspx?ProductId=TR-106082. 44 “Interruption Cost Estimate (ICE) Calculator.” 2015. DOE. http://icecalculator.com/.

25
This report is available at no cost from the National Renewable Energy Laboratory (NREL) at www.nrel.gov/publications.
The ICE calculator requires several inputs (Figure 21) to calculate outage costs, including reliability data. The New York State Department of Public Service releases a reliability report each year that includes the following values with and without major storms included:45
SAIFI is the average number of interruptions a customer experiences in a calendar year.
SAIDI is the average outage duration across all customers served.
CAIDI is the average outage duration per utility customer affected (in hours).
These values are reported by all regulated utilities in the country. A best-fit linear trend line shows that Con Edison grid outage duration and frequency with storms have been increasing over the past 14 years (see Figure 22).
Figure 22. Con Edison system-wide grid reliability with storms
45 “Electric Service Reliability Reports.” 2015. New York State Department of Public Service. http://www3.dps.ny.gov/W/PSCWeb.nsf/All/D82A200687D96D3985257687006F39CA?OpenDocument.
0
0.05
0.1
0.15
0.2
0.25
0.3
0.35
0.4
-10
0
10
20
30
40
50
60
70
80
2000 2002 2004 2006 2008 2010 2012 2014 2016
SAIF
I - A
vera
ge N
umbe
r of I
nter
rupt
ions
a
Cust
omer
Exp
erie
nces
in a
Yea
r
CAID
I - A
vera
ge O
utag
e Du
ratio
n Pe
r Cus
tom
er
Affe
cted
(hou
rs) CAIDI
SAIFI
Linear (CAIDI)
Linear (SAIFI)
Figure 21. Screenshot of DOE ICE Calculator inputs

26
This report is available at no cost from the National Renewable Energy Laboratory (NREL) at www.nrel.gov/publications.
To appropriately represent the increasing frequency and duration of outages due to storms, the average reliability metrics from the past five years were used instead of the full 14-year data set. The frequency of outages (SAIFI) depends on if the facility is on the network or the radial grid. The values are summarized in the following table.
Table 8. Con Edison Five-Year Average SAIFI Values for Radial and Network Customers
Grid Segment SAIFI
Radial 0.77
Network 0.04
Two outage duration values (CAIDI) are evaluated: “with storm” grid statistics (hereafter referred to as a long duration outage) and “without storm” grid statistics (hereafter referred to as a short duration outage); they are summarized in Table 9.46 This establishes a lower and upper bound for grid outage duration for both the network and the radial grid, and establishes short and long outage cases for the analysis scenarios.
Table 9. Con Edison CAIDI Values for Radial and Network Customers
Grid Type CAIDI (hours/year)
Technical Analysis Scenario
Radial Average year without storms (five-year average) 1.99 Short Average year with storms (five-year average) 21.88 Long Network Average year without storms (five-year average) 7.25 Short Average year with storms (five-year average) 50.96 Long
The facility specific costs of interruptions (i.e., annual value of resiliency) are developed using the U.S. DOE ICE Calculator.47 The ICE Calculator takes inputs of SAIFI, CAIDI, number of customers, customer class (residential, non-residential), location (state), average energy usage (MWh)48, industry type, backup capabilities, and distribution of outages by time of day (percentage). Using the reliability metrics shown above, an outage cost vs. duration table is developed for each of the facilities in the study (see cost curve tables in Appendix B). The “Unit Cost of Interruption” is averaged over the 16-hour range that the ICE Calculator is able to analyze to provide an average hourly cost of interruption.
46 The National Electric Code (NEC) requires that emergency and standby power systems supply power within a specified number of seconds and for a specified amount of time. The outage durations in this analysis are derived from Con Edison historical outage data, rather than from the NEC. 47 “Interruption Cost Estimate (ICE) Calculator.” 2015. DOE. http://icecalculator.com/. 48 Critical load that is supported during a grid outage.

27
This report is available at no cost from the National Renewable Energy Laboratory (NREL) at www.nrel.gov/publications.
Table 10 summarizes the hourly cost of interruptions, or value of providing resiliency, for the facilities included in the study. Additional information is provided in Appendix B.
Table 10. Value of Resiliency for Study Facilities
Site
Value of Resiliency Provided ($/hour/year)
Annual Cost of Short Duration Outage (2 or 7 hours)
Annual Cost of Long Duration Outage (22 or 51 hours)
NYC-DOE School Shelter (network) $ 68.97 $ 500.19 $ 3,515.15 FDNY Fire Station (radial) $ 917.43 $ 1,823.85 $ 20,071.51
NYCHA Cooling Center (network) $ 32.02 $ 232.15 $ 1631.74
Due to variation in load, solar resource, and battery state of charge, the amount of time a given resilient PV system can sustain the load during an outage varies by time of day and time of year. For each site, a series of 8760 simulations were performed to calculate the number of hours a resilient PV system could sustain the critical load for outages beginning during every hour of the year. The average number of hours the system can be expected to maintain the load was calculated from the results of these 8,760 simulations, and is defined as a resiliency metric R. Parametric sweeps were performed to calculate a range of R values for various PV and storage sizes, and then a multi-variate regression analysis was conducted to calculate regression coefficients for the PV and storage components. For Scenario 1, the value of resiliency was incorporated into the optimization of system size based on the regression coefficients, hourly cost of interruptions, and expected annual outage duration.49
Analysis Approach 2.5NREL’s REopt model was used to size and dispatch PV, battery, and/or generator systems in four scenarios including both economic and resiliency benefits:
1. Scenario 1: Resilient PV sized for economic savings; no resiliency requirement imposed The model chose from solar and storage resources to size resilient PV systems that are cost-effectivefor the host site while grid-connected, and then evaluated the resiliency benefits these systems provided.
2. Scenario 2: Resilient PV sized to meet resiliency needs The model chose from solar and storage resources to size resilient PV systems capable of sustaining critical electric loads for short and long outages, and then evaluated the grid-connected economic benefit that these systems provide during normal grid operations.
3. Scenario 3: Resilient PV and a generator (hybrid system) sized to meet resiliency needs The model chose from solar, storage, and diesel generator resources to size hybrid systems capable of sustaining critical electric loads for short and long outages, and then
49 Simpkins, T., K. Anderson, D. Cutler, and D. Olis. 2016. “Optimal Sizing of a Solar-Plus-Storage System For Utility Bill Savings and Resiliency Benefits,” accepted for publication in Proc. 7th Conf. on Innovative Smart Grid Technologies, Minneapolis, MN.

28
This report is available at no cost from the National Renewable Energy Laboratory (NREL) at www.nrel.gov/publications.
evaluated the grid-connected economic benefit that these systems provide during normal grid operations.
4. Scenario 4: Generator sized to meet resiliency needs The model sized a diesel generator to support critical electric loads for short and long outages.
In this analysis, cost-effective means that the modeled system has an NPV that is equal to or greater than zero, and thus provides lifecycle cost savings to the site. Building owners may have other measures of cost-effectiveness such as lowest initial capital cost. While initial cost is presented in our results, systems are selected based on maximizing lifecycle cost savings, not lowest first cost.
Given NYC’s commitment to install solar on city-owned buildings in order to reduce emissions, when the cost-optimal system did not include solar as part of the solution in Scenarios 1-3, any positive life cycle cost savings attainable by a battery-only system were used to offset the cost of solar and incorporate it into the recommended system, up to the point that NPV reached zero or all available space for solar was filled. This allows NYC to understand the combined impacts of solar and storage for cost savings and resiliency when installed together, and demonstrates how storage can facilitate implementation of PV systems that would not be cost-effective on their own.
In each scenario, the resilient PV system was able to operate for financial benefits during grid-tied operation and was also able to serve the critical loads during grid outages. The generator was only able to operate during the outage. We modeled each scenario both with and without a resiliency value to understand the impact of valuing resiliency has on system sizing (for scenario 1) and economics (for all scenarios). We modeled Scenarios 2-4 with two different outage lengths (a short and long duration outage, described in Section 2.4) to demonstrate how system sizing and economics change with varying outage lengths.
Since the solar resource and critical load are both time-varying, the size of the resilient PV system required to sustain the critical load will be different depending on when the outage begins. For example, an outage occurring in the spring when loads are lower may require a smaller system than one occurring in the summer when loads are higher. To properly account for the stochastic nature of the critical load and the solar resource, the model should be run multiple times with the outage beginning at a different point in the year each time. The largest system required to sustain the critical load during this series of model runs would then represent the worst case, and could be assumed to meet the load during any of the other outages. Given the computational complexity of the model, for the purposes of this analysis we selected the period with the highest load and lowest solar generation to represent the worst case outage.
In this analysis, we assume the battery is fully charged at the time the outage occurs. Some outage events can be forecasted due to extreme weather, and in these cases the building owner may choose to charge the battery prior to the outage. Some outages cannot be predicted, and in this case, the assumption that the battery is fully charged is optimistic. A more thorough stochastic examination of the impact of battery state of charge is recommended for future work, but is not part of the scope of this analysis.

29
This report is available at no cost from the National Renewable Energy Laboratory (NREL) at www.nrel.gov/publications.
We also assume that the battery will be replaced once during the 25 year project lifecycle, and the replacement cost is amortized into the upfront capital cost. The lifetime of the battery will depend on number of cycles and depth of discharge. A lithium ion battery may be expected to last ten to twelve years based on calendar degradation. A battery may not last the entire twelve years, however, if it is experiences an excessive number of deep charge / discharge cycles. Rather than include this effect in the model, we simply assume that the battery will last twelve years based on calendar degradation and then post-process the dispatch using the rainflow algorithm to verify the assumption50.
Each scenario is described in more detail below.
Scenario 1: Resilient PV Sized for Economic Savings; no Resiliency Requirement Imposed
In the first scenario, resiliency is not included as a design constraint; the optimal system configuration is based on achieving lowest life cycle cost assuming the grid is always available. In Scenario 1.1, system revenues are the utility savings, incentives, and tax benefits. Scenario 1.2 and 1.3 add a short and long outage resiliency value to the potential economic value streams.
Once the optimal sizes for the PV and/or battery system were determined based upon the revenue streams available, a series of simulations was conducted to assess the added resiliency benefit that such a system could achieve. The length of time for which the critical load could be sustained varies based on the state of charge of the battery, the solar resource, and the size of the critical load during the outage. For this analysis, we evaluated a “best case” and “worst case” outage period to show the maximum and minimum amount of resiliency the system could be expected to provide, where the best case was the period of lowest load and highest solar generation and the worst case was the period of highest load and lowest solar generation.
Scenario 2: Resilient PV Sized to meet Resiliency Needs In the second scenario, we introduce resiliency as a design constraint. Rather than designing exclusively to maximize utility savings and policy incentives, we now require that the model identify a system that can sustain the critical load during specified outage lengths. Although the system is explicitly designed to sustain the specified outages, it can also be used for economic gain in normal operation, the same as in the first scenario. This scenario illustrates the incremental cost required when resiliency is added as a design constraint as well as the incremental benefit of avoiding outage costs. We look at a short (Scenario 2.1) and a long (Scenario 2.2) outage length, and evaluate each with and without assigning a value to resiliency.
Scenario 3: Resilient PV and a Generator (Hybrid System) Sized to meet Resiliency Needs
The third scenario is essentially the same as the second except that the candidate pool of technologies now includes a diesel generator in addition to the PV and battery. The model is constrained to operating the diesel generator only during grid outages while the PV and storage can operate both during outages and when the grid is operational.
50 S.D. Downing, and D.F. Socie, Simple Rainflow Counting Algorithms; International Journal of Fatigue; 1982.

30
This report is available at no cost from the National Renewable Energy Laboratory (NREL) at www.nrel.gov/publications.
Scenario 4: Generator Sized to meet Resiliency Needs The fourth scenario considers a diesel-only case which is essentially the same as the second and third scenarios except that the candidate pool of technologies now includes only a diesel generator. Generators in this analysis were unable to participate in demand response due to small system sizes and the complexities of siting and operating a generator for demand response. Scenario 4 is included for completeness and to provide a cost comparison of the various options for ensuring resiliency of the site.
The scenarios are summarized in Table 11.
While energy efficiency, natural gas generators, combined heat and power and other distributed generation resources may also offer economic and resiliency benefits, these were not modeled due to time and funding limitations.

31
This report is available at no cost from the National Renewable Energy Laboratory (NREL) at www.nrel.gov/publications.
Table 11. Scenarios
Scenario Description Outage Length
Resiliency Valued
1.1 Resilient PV sized for economic savings; no resiliency requirement imposed
N/A No
1.2 Resilient PV sized for economic savings; no resiliency requirement imposed
Short – not required
Yes
1.3 Resilient PV sized for economic savings; no resiliency requirement imposed
Long – not required
Yes
2.1.a Resilient PV sized to meet resiliency needs Short No
2.1.b Resilient PV sized to meet resiliency needs Short Yes
2.2.a Resilient PV sized to meet resiliency needs Long No
2.2.b Resilient PV sized to meet resiliency needs Long Yes
3.1.a Resilient PV + generator sized to meet resiliency needs Short No
3.1.b Resilient PV + generator sized to meet resiliency needs Short Yes
3.2.a Resilient PV + generator sized to meet resiliency needs Long No
3.2.b Resilient PV + generator sized to meet resiliency needs Long Yes
4.1.a Generator only sized to meet resiliency needs Short No
4.1.b Generator only sized to meet resiliency needs Short Yes
4.2.a Generator only sized to meet resiliency needs Long No
4.2.b Generator only sized to meet resiliency needs Long Yes
.

32
This report is available at no cost from the National Renewable Energy Laboratory (NREL) at www.nrel.gov/publications.
3 Results A summary of REopt results for each of the four scenarios is presented in this section for all three sites. See Appendix D for comprehensive results for each site.
The costs presented in this section may not include additional integration costs, such as critical load isolation or those that result from physical building characteristics, as outlined in Section 2.3. Any increases in cost would impact project economics.
NYC-DOE High School/Coastal Storm Shelter 3.1 Scenario 1: Resilient PV Sized for Economic Savings; no Resiliency
Requirement Imposed A high-level summary of system sizing and costs for Scenario 1 are below in Table 12.
Table 12. School Shelter Scenario 1 Results
School Shelter
Scenario 1: PV + Storage Sized for Economic Savings
System 1.1: No resiliency value included
System 1.2: Short-duration resiliency value included
System 1.3: Long-duration resiliency value included
PV Size (kW-DC) 50 50 50 Battery Size (kWh) 74 74 74 Battery Size (kW) 35 35 35 Total Capital Cost $205,716 $205,716 $205,716 NPV $51,560 $58,650 $58,650 Simple Payback (years) 14.3 13.9 13.9
System 1.1 is a traditional economic analysis that does not include a resiliency value stream. This system would save the school $51,000 over 25 years, which represents about 1% savings over the base case life cycle cost (see Appendix D). Because the resiliency value for network grid customers is relatively low, allowing the system to capture resiliency benefits in Systems 1.2 and 1.3 does not change the system size, but does reduce the payback period by 0.4 years and increases the NPV by about 14% ($7,000).
Though this site can accommodate over 200 kW of solar, the economically optimal size solar array selected by the model is 50 kW-DC due in part to the NY-Sun incentive modeled at $0.80/W for the first 50 kW and $0.50/W for the next 51-200 kW. Unlike the other two sites modeled in this analysis, solar at the school shelter was selected as an economically optimal solution without requiring storage savings to offset solar costs. This is due to a lower cost of solar assumed for larger systems at this site and ample roof space. The assumed third-party ownership of the system at this site also allows the school to benefit from the federal tax incentives the developer would capture.
For all three cases, savings are attained by managing demand during peak periods. This is shown in Figure 23 where the battery is strategically discharged to reduce peak loads.
33
This report is available at no cost from the National Renewable Energy Laboratory (NREL) at www.nrel.gov/publications.
Figure 23. PV and battery combine to reduce peak demand
Because the school is on a spot network51, exported energy can be problematic, so net metering savings were not factored into the analysis. A reverse power relay could be installed to prevent export at an estimated cost of $5,000. The school could alternatively implement a smart grid solution52 to allow export. However, the smart grid solution costs $50,000-100,000, and the exported power for the maximum solar array (210 kW) is only worth about $500/year ($12,500 over 25 years), so in this case, the reverse power relay to prevent export is a better economic choice.
The school participates in both the summer and winter DCAS demand response programs through NYPA. Potential revenues are approximately $100/kW of demand reduced in each season. Historically, the school has committed 25 kW of demand response in the summer (for revenue of approximately $2,500) and 10 kW in the winter (for revenue of approximately $1,000).
51 A spot network is a utility installation designed with multiple high-voltage feeders and transformers tied to a common bus to ensure reliable electric service for large electric load users. The network protectors on these transformers are designed with an automatic safety feature where the network protector will open when energy feeds back from the low-voltage bus toward the high-voltage feeder, which is indicative of a fault on the high-voltage cable. If a PV system were installed on a spot network and solar production were to exceed building load at any given time, the network protectors would sense the export of PV power as conditions analogous to those during a high-voltage feeder fault and would open automatically, causing the electricity service to that building to go out. 52 There are two options when installing PV on a spot network. First, a reverse power relay can be installed to trip solar inverters offline whenever incoming power drops below a certain minimum amount in order to prevent any possibility of back feed of power to the network protectors. This costs approximately $5,000-10,000. Second, if export of solar is desired, a smart grid solution including lightening the sensitivity of the network protectors to prevent them from opening under normal PV export conditions, installing SCADA monitoring and communications equipment, and anti-islanding relays can be installed. This costs approximately $50,000-100,000.

34
This report is available at no cost from the National Renewable Energy Laboratory (NREL) at www.nrel.gov/publications.
The school could potentially use the battery to increase its commitment to the demand response program. In theory, if the battery were fully charged each time the demand response call was issued, and the required demand reduction period was short enough that the battery could discharge at full capacity for the whole window, the 35-kW battery could potentially save the school $3,500 in the summer and $3,500 in the winter for a total of $7,000/year.
These potential revenues are significant, but less than the savings the battery provides by managing peak demand. The battery saves the school about $14,000/year through peak demand management. If the battery is being used for peak demand management, it is unlikely the full battery capacity will be available to participate in demand response programs. Some of the battery capacity could be re-allocated away from peak management toward demand response in order to capture demand response revenues, but this would likely reduce peak demand management revenues.
It may be possible to use the battery for peak demand management while also allocating a portion of its capacity to demand response. Optimizing the use of the battery for simultaneous peak demand management and demand response requires detailed modeling of the demand response program, including the expected date and length of demand response calls and the payment available for each of those calls. This is beyond the scope of this analysis. For purposes of this analysis, we assume that the battery will be used for peak demand management rather than demand response since peak demand management provides a higher value stream.
Next, we evaluated the length of time that the 50-kW PV and 35-kW/74-kWh battery system could sustain the critical load during a short outage of 7 hours and a long outage of 51 hours. For the short outage, under the worst case scenario (low PV and high load), the system can support the full critical load for 3.1 hours, or 46% of the critical load for the entire 7 hours. Under the best case scenario (high PV and low load), the system can power additional loads beyond those designated as critical. For the long outage, under the worst case scenario (low PV and high load), the system can support the full critical load for 6 hours, or 12% of the critical load for 51 hours. Under the best case scenario (high PV and low load), the system can support the full critical load for 31 hours, or support 50% of the critical load for 51 hours; see Table 13.
Table 13. Percent of Critical Load System Can Support
System 1.1: No resiliency value captured
System 1.2: Short-duration resiliency value captured
System 1.3: Long-duration resiliency value captured
7-Hour Outage (Worst) 46% 46% 46%
7-Hour Outage (Best) 285% 285% 285%
51-Hour Outage (Worst) 12% 12% 12%
51-Hour Outage (Best) 50% 50% 50%
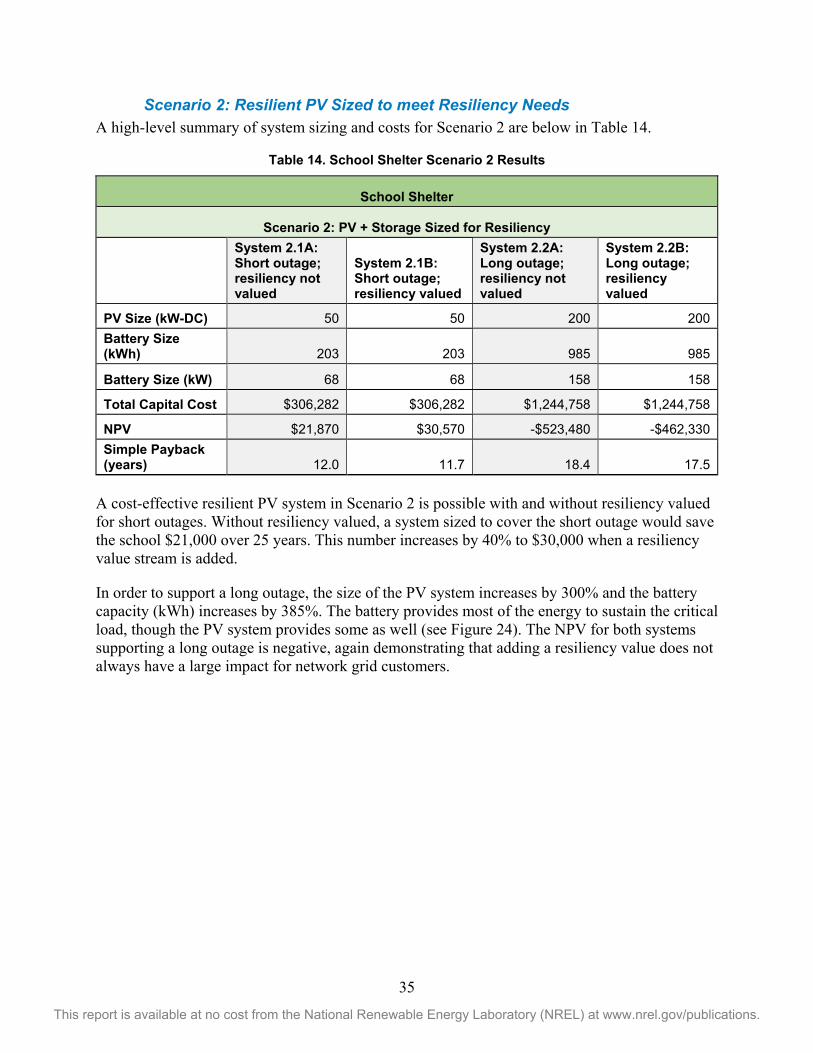
35
This report is available at no cost from the National Renewable Energy Laboratory (NREL) at www.nrel.gov/publications.
Scenario 2: Resilient PV Sized to meet Resiliency Needs A high-level summary of system sizing and costs for Scenario 2 are below in Table 14.
Table 14. School Shelter Scenario 2 Results
School Shelter
Scenario 2: PV + Storage Sized for Resiliency
System 2.1A: Short outage; resiliency not valued
System 2.1B: Short outage; resiliency valued
System 2.2A: Long outage; resiliency not valued
System 2.2B: Long outage; resiliency valued
PV Size (kW-DC) 50 50 200 200 Battery Size (kWh) 203 203 985 985
Battery Size (kW) 68 68 158 158
Total Capital Cost $306,282 $306,282 $1,244,758 $1,244,758
NPV $21,870 $30,570 -$523,480 -$462,330 Simple Payback (years) 12.0 11.7 18.4 17.5
A cost-effective resilient PV system in Scenario 2 is possible with and without resiliency valued for short outages. Without resiliency valued, a system sized to cover the short outage would save the school $21,000 over 25 years. This number increases by 40% to $30,000 when a resiliency value stream is added.
In order to support a long outage, the size of the PV system increases by 300% and the battery capacity (kWh) increases by 385%. The battery provides most of the energy to sustain the critical load, though the PV system provides some as well (see Figure 24). The NPV for both systems supporting a long outage is negative, again demonstrating that adding a resiliency value does not always have a large impact for network grid customers.
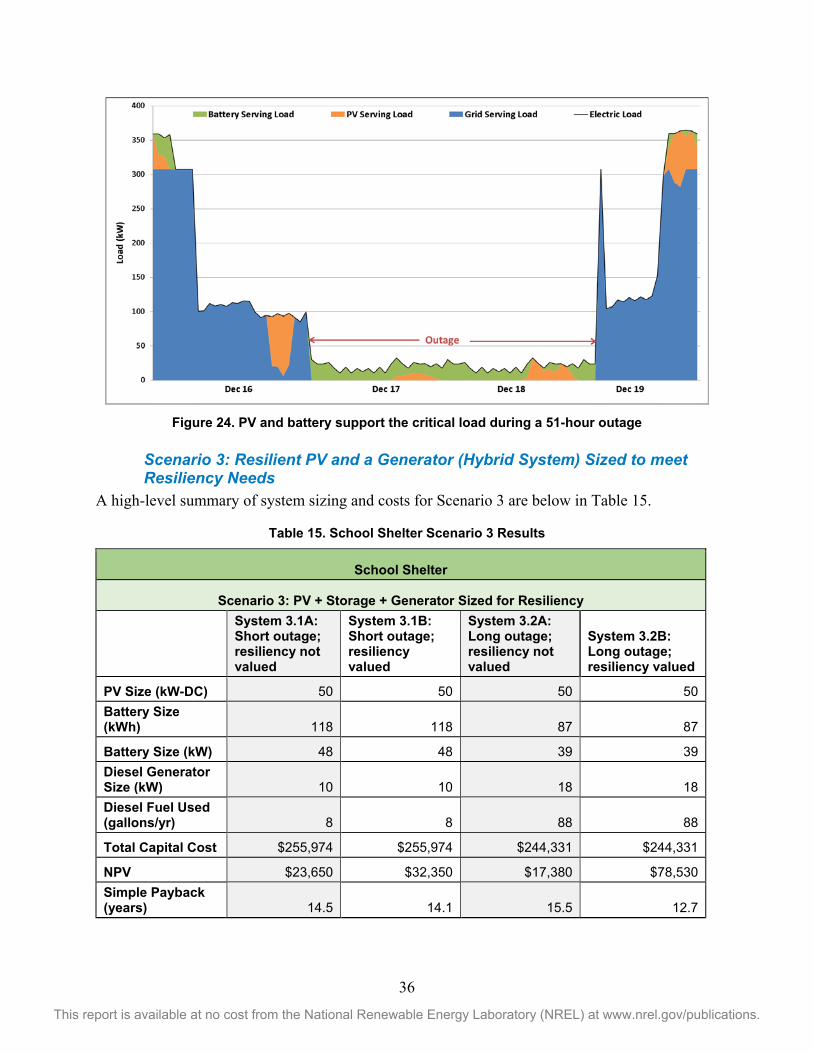
36
This report is available at no cost from the National Renewable Energy Laboratory (NREL) at www.nrel.gov/publications.
Figure 24. PV and battery support the critical load during a 51-hour outage
Scenario 3: Resilient PV and a Generator (Hybrid System) Sized to meet Resiliency Needs
A high-level summary of system sizing and costs for Scenario 3 are below in Table 15.
Table 15. School Shelter Scenario 3 Results
School Shelter
Scenario 3: PV + Storage + Generator Sized for Resiliency
System 3.1A: Short outage; resiliency not valued
System 3.1B: Short outage; resiliency valued
System 3.2A: Long outage; resiliency not valued
System 3.2B: Long outage; resiliency valued
PV Size (kW-DC) 50 50 50 50 Battery Size (kWh) 118 118 87 87
Battery Size (kW) 48 48 39 39 Diesel Generator Size (kW) 10 10 18 18 Diesel Fuel Used (gallons/yr) 8 8 88 88
Total Capital Cost $255,974 $255,974 $244,331 $244,331
NPV $23,650 $32,350 $17,380 $78,530 Simple Payback (years) 14.5 14.1 15.5 12.7
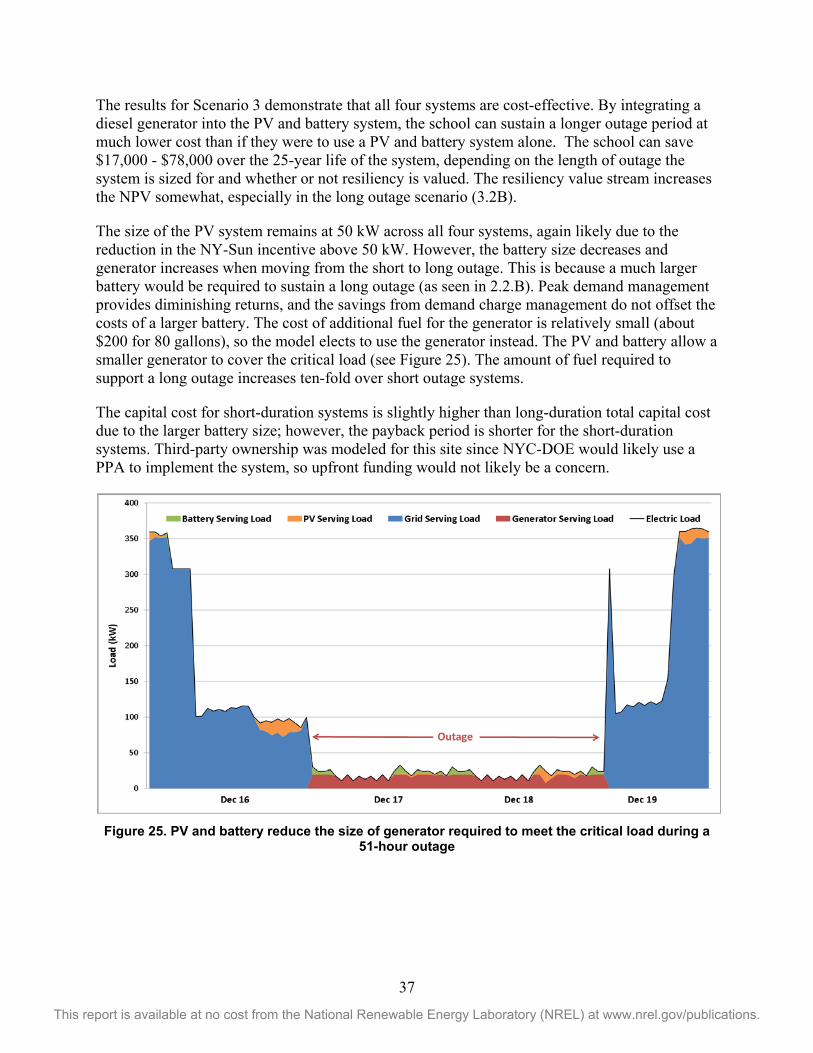
37
This report is available at no cost from the National Renewable Energy Laboratory (NREL) at www.nrel.gov/publications.
The results for Scenario 3 demonstrate that all four systems are cost-effective. By integrating a diesel generator into the PV and battery system, the school can sustain a longer outage period at much lower cost than if they were to use a PV and battery system alone. The school can save $17,000 - $78,000 over the 25-year life of the system, depending on the length of outage the system is sized for and whether or not resiliency is valued. The resiliency value stream increases the NPV somewhat, especially in the long outage scenario (3.2B).
The size of the PV system remains at 50 kW across all four systems, again likely due to the reduction in the NY-Sun incentive above 50 kW. However, the battery size decreases and generator increases when moving from the short to long outage. This is because a much larger battery would be required to sustain a long outage (as seen in 2.2.B). Peak demand management provides diminishing returns, and the savings from demand charge management do not offset the costs of a larger battery. The cost of additional fuel for the generator is relatively small (about $200 for 80 gallons), so the model elects to use the generator instead. The PV and battery allow a smaller generator to cover the critical load (see Figure 25). The amount of fuel required to support a long outage increases ten-fold over short outage systems.
The capital cost for short-duration systems is slightly higher than long-duration total capital cost due to the larger battery size; however, the payback period is shorter for the short-duration systems. Third-party ownership was modeled for this site since NYC-DOE would likely use a PPA to implement the system, so upfront funding would not likely be a concern.
Figure 25. PV and battery reduce the size of generator required to meet the critical load during a
51-hour outage

38
This report is available at no cost from the National Renewable Energy Laboratory (NREL) at www.nrel.gov/publications.
Scenario 4: Generator Sized to meet Resiliency Needs A high-level summary of system sizing and costs for Scenario 4 are below in Table 16.
Table 16. School Shelter Scenario 4 Results
School Shelter
Scenario 4: Generator Sized for Resiliency
System 4.1A: Short outage; resiliency not valued
System 4.1B: Short outage; resiliency valued
System 4.2A: Long outage; resiliency not valued
System 4.2B: Long outage; resiliency valued
Diesel Generator Size (kW) 30 30 33 33 Diesel Fuel Used (gallons/yr) 15 15 98 98
Total Capital Cost $44,850 $44,850 $48,900 $48,900
NPV -$61,470 -$52,770 -$63,550 -$2,400 Simple Payback (years) None None None 14.9
The NPV for all four systems in Scenario 4 is negative, and only system 4.2B has a simple payback when resiliency is valued. System size and capital cost do not increase much when moving from short to long outages, but the amount of fuel required increases by 83 gallons (550%).
Discussion of School Shelter Results Across All Scenarios Table 17 compares the NPV and simple payback for the three scenarios (2-4) that size systems for resiliency. The highest NPV and quickest payback in each column is highlighted in green, as is the row with the most green cells, to represent the system with the best economics overall. Looking across all the systems sized to support resiliency needs, Scenario 3 has the highest NPV and shortest payback period for systems designed to support long outages. Scenario 4 has the lowest upfront capital cost of all the scenarios, but NPV is negative in all four cases.

39
This report is available at no cost from the National Renewable Energy Laboratory (NREL) at www.nrel.gov/publications.
Table 17. School Shelter NPV and Payback Comparison of Scenarios 2, 3, and 4
School Shelter
Most Cost-Effective Option for Outage Coverage Short outage; resiliency not valued
Long outage; resiliency not valued
Short outage; resiliency valued
Long outage; resiliency valued
Scenario 2: PV+Storage NPV $21,870 -$523,480 $30,570 -$462,330 Scenario 2: PV+Storage Payback 12.0 18.4 11.7 17.5
Scenario 3: Hybrid NPV $23,650 $17,380 $32,350 $78,530 Scenario 3: Hybrid Payback 14.5 15.5 14.1 12.7 Scenario 4: Generator NPV -$61,470 -$63,550 -$52,770 -$2,400 Scenario 4: Generator Payback N/A N/A N/A 14.9
FDNY EC309 3.2Scenario 1: Resilient PV Sized for Economic Savings; no Resiliency Requirement Imposed
A high-level summary of system sizing and costs for Scenario 1 are below in Table 18.
Table 18. Fire Station Scenario 1 Results
Fire Station
Scenario 1: PV + Storage Sized for Economic Savings System 1.1: No resiliency value captured
System 1.2: Short duration resiliency value captured
System 1.3: Long duration resiliency value captured
PV Size (kW-DC) 10 10 10
Battery Size (kWh) 43 43 213
Battery Size (kW) 16 16 31
Total Capital Cost $69,413 $69,413 $172,741
NPV $22,365 $54,132 $324,250
Simple Payback (years) 15.9 10.5 6.1
System 1.1 is a traditional economic analysis that does not include a resiliency value stream. This system would save the fire station $22,000 over 25 years, which represents about 5.1% savings over the base case life cycle cost. When the system is able to capture a resiliency value for a short duration outage (approximately 2 hours/year in this case), the system size remains the same, but the payback period is reduced by 5.4 years. System 1.3 is able to capture a resiliency value for a long duration outage (approximately 22 hours/year), which increases the battery storage size by 495% and reduces the payback period by an additional 4.4 years.

40
This report is available at no cost from the National Renewable Energy Laboratory (NREL) at www.nrel.gov/publications.
For all three cases, savings are attained by managing demand during peak periods. This is shown in Figure 26, where the battery is strategically discharged to reduce peaks.
Figure 26. PV and battery combine to reduce peak demand at the fire station
Next, we evaluated the length of time that the PV and battery system could sustain the critical load during a short outage of 2 hours and a long outage of 22 hours. Because the PV and battery in this scenario are relatively small compared to the load, the battery cannot always sustain the full critical load. Systems 1.1 and 1.2 do not have an inverter large enough to support the full critical load in the worst case scenario. However, these systems could support 41% of the critical load for a 2-hour outage under the worst case scenario (low PV and high load), and could support additional loads (beyond just the critical load) under the best case scenario (high PV and low load). The systems could support 2% of the critical load for a 22-hour outage under the worst case scenario and 73% under the best case scenario. System 1.3 could support 77% of the load for a 2 hour outage and 47% for a 22 hour outage under the worst case scenario. Under the best case scenario, additional loads in excess of the critical load can be supported; see Table 19.
Table 19. Percent of Critical Load System Can Support
System 1.1: No resiliency value captured
System 1.2: Short-duration resiliency value captured
System 1.3: Long-duration resiliency value captured
2-Hour Outage (Worst) 41% 41% 77%
2-Hour Outage (Best) 732% 732% 1181%
22-Hour Outage (Worst) 2.4% 2.4% 47%
22-Hour Outage (Best) 73% 73% 264%

41
This report is available at no cost from the National Renewable Energy Laboratory (NREL) at www.nrel.gov/publications.
Scenario 2: Resilient PV Sized to meet Resiliency Needs A high-level summary of system sizing and costs for Scenario 2 are below in Table 20.
Table 20. Fire Station Scenario 2 Results
Fire Station
Scenario 2: PV + Storage Sized to Meet Resiliency Needs System 2.1A: Short outage; resiliency not valued
System 2.1B: Short outage; resiliency valued
System 2.2A: Long outage; resiliency not valued
System 2.2B: Long outage; resiliency valued
PV Size (kW-DC) 0 10 10 10 Battery Size (kWh) 136 131 613 613 Battery Size (kW) 41 40 40 40 Total Capital Cost $111,930 $138,828 $389,706 $389,706 NPV -$12,070 $10,149 -$256,158 $93,118 Simple Payback (years) 20.7 16.9 N/A 13.6
Cost-effective PV+storage systems sized to meet resiliency needs were only possible when a resiliency value stream was included. The addition of a resiliency value stream for system 2.1B results in a positive NPV of $10,000, and allows PV to be incorporated into the solution. Without the resiliency value stream, the system has an NPV of negative $12,000 (system 2.1A) and no PV. The impact that valuing resiliency can have is seen even more clearly when the systems are required to support a long outage. The NPV of system 2.2A is negative $256,000, while the NPV of system 2.2B is positive $93,000.
A large amount of battery capacity is required because the PV system can only supply on average 14% of the daily energy required. Therefore, the battery has to store the remaining 86% of the energy required in advance of the outage. Since solar resources are limited to 10 kW, sustaining a long outage requires a significant increase in battery capacity. Battery sizing for a 2-hour outage requires 131-136 kWh of battery capacity while a 22-hour outage requires 613 kWh of battery capacity, representing an increase of approximately 368%; see Figure 27.

42
This report is available at no cost from the National Renewable Energy Laboratory (NREL) at www.nrel.gov/publications.
Figure 27. During a 21-hour grid outage on September 7th, the PV (orange) and battery (green) sustain the critical load
Scenario 3: Resilient PV and a Generator (Hybrid System) Sized to meet Resiliency Needs
A high-level summary of system sizing and costs for Scenario 3 are below in Table 21.
Table 21. Fire Station Scenario 3 Results
Fire Station
Scenario 3: PV + Storage + Generator Sized to Meet Resiliency Needs System 3.1A: Short outage; resiliency not valued
System 3.1B: Short outage; resiliency valued
System 3.2A: Long outage; resiliency not valued
System 3.2B: Long outage; resiliency valued
PV Size (kW-DC) 4 10 1 10 Battery Size (kWh) 73 74 61 66 Battery Size (kW) 18 18 17 20 Diesel Generator Size (kW) 23 22 26 24 Diesel Fuel Used (gallons/yr) 4 4 43 41 Total Capital Cost $102,328 $120,505 $89,381 $121,164 NPV $0 $25,384 -$1,679 $344,848 Simple Payback (years) 19.3 15.4 19.8 4.7

43
This report is available at no cost from the National Renewable Energy Laboratory (NREL) at www.nrel.gov/publications.
Adding a resiliency value stream provided savings that were used to offset the cost of adding additional solar to the system, increasing the PV system size from 4 kW to 10 kW and reducing the generator size by 1 kW in system 3.1B. When a resiliency value is included in the long outage scenario (3.2B), the payback period drops significantly over all the other systems in Scenario 3 to 4.7 years. This hybrid system is estimated to cost approximately $121,000 to install (though there may be additional integration costs, described in Section 2), and would save FDNY approximately $344,000 over the 25-year life cycle compared to the base case of doing nothing. When resiliency is not valued for a long outage, system 3.2A would cost FDNY under $2,000 over the 25-year life cycle of the system. Assuming FDNY values resiliency at $2,000 or more over 25 years, System 3.2A would also be cost-effective. By pairing resilient PV with the generator, the size of generator required to sustain the critical load is reduced from 41 to 24kW (see Figure 28).
Figure 28. During a 21-hour grid outage on September 7th, the PV (orange) and battery (green) meet peak loads to reduce the size of generator required to sustain the critical load
Scenario 4: Generator Sized to meet Resiliency Needs For comparison, we also evaluated the cost of a conventional diesel-only backup system. A high-level summary of system sizing and costs for Scenario 4 are below in Table 22.

44
This report is available at no cost from the National Renewable Energy Laboratory (NREL) at www.nrel.gov/publications.
Table 22. Fire Station Scenario 4 Results
Fire Station
Scenario 4: Generator Sized to Meet Resiliency Needs System 4.1A: Short outage; resiliency not valued
System 4.1B: Short outage; resiliency valued
System 4.2A: Long outage; resiliency not valued
System 4.2B: Long outage; resiliency valued
Diesel Generator Size (kW) 41 41 41 41 Diesel Fuel Used (gallons/yr) 7 7 47 47 Total Capital Cost 61,620 61,620 61,620 61,620 NPV -$51,731 -$19,964 -$52,896 $296,380 Simple Payback (years) None None None 3.0
The size of the generator stays consistent at 41 kW across all 4 systems, but the amount of fuel increases from 7 gallons to 47 gallons when the outage duration is increased from 2 hours to 22 hours. The only system in Scenario 4 that is cost-effective is 4.2B, which includes a resiliency value for a long duration outage.
Discussion of Fire Station Results Across All Scenarios Table 23 compares the NPV and simple payback for the three scenarios that size systems for resiliency. The highest NPV and quickest payback in each column is highlighted in green, as is the row with the most green cells, to represent the system with the best economics overall. With and without resiliency valued, and for both short and long outages, the hybrid system consistently resulted in the highest NPV and typically, the shortest payback.
Table 23. Fire Station NPV and Payback Comparison of Scenarios 2, 3, and 4
Fire Station
Most Cost-Effective Option for Outage Coverage
Short outage; resiliency not valued
Long outage; resiliency not valued
Short outage; resiliency valued
Long outage; resiliency valued
Scenario 2: PV+Storage NPV -$12,070 -$256,158 $10,149 $93,118 Scenario 2: PV+Storage Payback 20.7 N/A 16.9 13.6 Scenario 3: Hybrid NPV $0 -$1,679 $25,384 $344,848 Scenario 3: Hybrid Payback 19.3 19.8 15.4 4.7 Scenario 4: Generator NPV -$51,713 -$51,713 -$19,964 $296,380 Scenario 4: Generator Payback N/A N/A N/A 3.0

45
This report is available at no cost from the National Renewable Energy Laboratory (NREL) at www.nrel.gov/publications.
In the hybrid systems, the PV and battery provide demand savings during normal grid-tied operation and also sustain part of the critical load during outages, reducing the size of the generator required. The generator-only scenarios all required a 41-kW generator while the generator sizing for the hybrid systems ranged from 22-26 kW. Compared to the resilient PV systems in Scenario 2, the hybrid systems in Scenario 3 use a significantly reduced battery size (131 – 613 kWh vs. 61 – 74 kWh). Reliance on diesel fuel is reduced only minimally between Scenario 4 and Scenario 3; however, there is no reliance on diesel fuel in Scenario 2.
NYCHA Cooling Center 3.3Scenario 1: Resilient PV Sized for Economic Savings; no Resiliency Requirement Imposed
A high-level summary of system sizing and costs for Scenario 1 are below in Table 24.
Table 24. Cooling Center Scenario 1 Results
Cooling Center
Scenario 1: PV + Storage Sized for Economic Savings System 1.1: No resiliency value captured
System 1.2: Short duration resiliency value captured
System 1.3: Long duration resiliency value captured
PV Size (kW-DC) 7 8 8 Battery Size (kWh) 25 25 25
Battery Size (kW) 7 7 7 Total Capital Cost $46,286 $50,120 $50,538 NPV $413 $1,683 $1,862
Simple Payback (years) 15.6 14.1 11.1
System 1.1 is a traditional economic analysis that does not include a resiliency value stream. This system would save the cooling center $413 over 25 years, which presents essentially a breakeven case over the life of the system. When the system is able to capture a resiliency value for a short outage (approximately 7 hours/year in this case), the size of the battery remains the same and the additional revenue is used to offset the costs of a slightly larger 8-kW PV system. NPV increases and payback period is shortened by approximately one year. System 1.3 is able to capture a resiliency value for a long outage (approximately 51 hours/year), which results in a slight increase in battery size (less than 1 kWh) and reduces the payback period by an additional 3 years.
These savings are attained primarily by managing demand during peak periods. This is shown in Figure 29, where the battery is strategically discharged to reduce peaks.

46
This report is available at no cost from the National Renewable Energy Laboratory (NREL) at www.nrel.gov/publications.
Figure 29. The battery (green) is discharged in the evening to shave the peak demand
Next, we evaluated the length of time that the PV and battery system could sustain the critical load during a short outage of 7 hours and a long outage of 51 hours. Because the PV and battery in this scenario are relatively small compared to the load, the battery cannot always sustain the full critical load. The best case outage scenarios assume that the outage starts in the evening when the air conditioners are off. In this case, the systems can power the lights, computer, fire alarm, and refrigerator through the night. However, they are too small to support the four air conditioners, which each draw 3 kW and together consume 12 kW each hour. The systems could, at most, support two air conditioners for four hours, or one air conditioner for eight hours.
Under the worst case scenario (low PV and high load), these systems do not have an inverter large enough to support the full critical load. However, they could support 31-32% of the critical load for a 7-hour outage. Under the best case scenario (high PV and low load), the systems could support additional load beyond the critical load during a 7-hour outage. During a 51-hour outage, the systems could support 13% of the critical load under the worst case scenario and 20-22% under the best case scenario; see Table 25.

47
This report is available at no cost from the National Renewable Energy Laboratory (NREL) at www.nrel.gov/publications.
Table 25. Percent of Critical Load System Can Support
System 1.1: No resiliency value captured
System 1.2: Short-duration resiliency value captured
System 1.3: Long-duration resiliency value captured
7-Hour Outage (Worst) 31% 32% 32%
72-Hour Outage (Best) 2996% 3138% 5138%
51-Hour Outage(Worst)
13% 13% 26%
51-Hour Outage (Best) 20% 22% 22%
Scenario 2: Resilient PV Sized to meet Resiliency Needs A high-level summary of system sizing and costs for Scenario 2 are below in Table 26.
Table 26. Cooling Center Scenario 2 Results
Cooling Center
Scenario 2: PV+Storage Sized to Meet Resiliency Needs System 2.1A: Short outage; resiliency not valued
System 2.1B: Short outage; resiliency valued
System 2.2A: Long outage; resiliency not valued
System 2.2B: Long outage; resiliency valued
PV Size (kW-DC) 2 2 9 9 Battery Size (kWh) 104 104 230 230 Battery Size (kW) 12 12 12 12 Total Capital Cost $74,907 $74,907 $167,006 $167,006 NPV -$45,555 -$41,516 -$181,636 -$153,244 Simple Payback (years) 14.9 14.3 25.5 20.4
None of the systems in Scenario 2 are cost-effective. This site has a relatively high cost of PV and a low value of resiliency. The larger systems required to sustain the longer network outages cannot capture enough savings to cover their higher capital cost.
The battery size remains consistent at 12 kW for all four systems because the peak critical load at this site is 12 kW. Battery capacity varies across the four systems, with much more battery storage required for the long outage. The large battery is required because the PV system can only supply about 36 kWh of the 124 kWh of energy required each day (29%). Therefore, the battery has to provide most of the energy required (see Figure 30).

48
This report is available at no cost from the National Renewable Energy Laboratory (NREL) at www.nrel.gov/publications.
Figure 30. During a 51-hour grid outage in August, PV production is marginal and the battery (green) sustains most of the critical load
Scenario 3: Resilient PV and a Generator (Hybrid System) Sized to meet Resiliency Needs
A high-level summary of system sizing and costs for Scenario 3 are below in Table 27.
Table 27. Cooling Center Scenario 3 Results
Cooling Center
Scenario 3: PV+Storage+Generator Sized to Meet Resiliency Needs
System 3.1A: Short outage; resiliency not valued
System 3.1B: Short outage; resiliency valued
System 3.2A: Long outage; resiliency not valued
System 3.2B: Long outage; resiliency valued
PV Size (kW-DC) 0 2 0 9 Battery Size (kWh) 25 28 25 35 Battery Size (kW) 7 7 7 8 Diesel Generator Size (kW) 9 9 10 7 Diesel Fuel Used (gallons/yr) 8 7 41 30 Total Capital Cost $33,798 $42,261 $34,376 $70,893 NPV $430 $0 $1,008 $9,329 Simple Payback (years) 11.4 12.2 11.3 12.3

49
This report is available at no cost from the National Renewable Energy Laboratory (NREL) at www.nrel.gov/publications.
All of the systems in scenario 3 were cost-effective. Solar is only cost-effective when a resiliency value is included. Adding in a resiliency value stream allows for the addition of a small PV system in System 3.1B and a larger PV system in 3.2B. It also increases the NPV by $8,000 for a long outage.
The PV and battery are synergistic, and adding a larger PV system results in a larger battery. Adding solar in System 3.2.B reduces diesel fuel use by 25% during the long duration outage, compared to the battery-generator system in System 3.2.A.
The battery provides demand savings during normal grid-tied operation and also sustains part of the critical load during the outage to reduce the size of diesel generator required and reduce run-time of the diesel generator; see Figure 31. In summary, the hybrid scenario consistently outperforms scenario 2 and 4 in economics, while achieving the desired resiliency for both short and long duration.
Figure 31. During the 51-hour outage in August, the PV and battery reduce the size of diesel generator required to meet the critical load, as well as reducing run-time of the diesel generator
Scenario 4: Generator Sized to meet Resiliency Needs A high-level summary of system sizing and costs for Scenario 4 are below in Table 28.
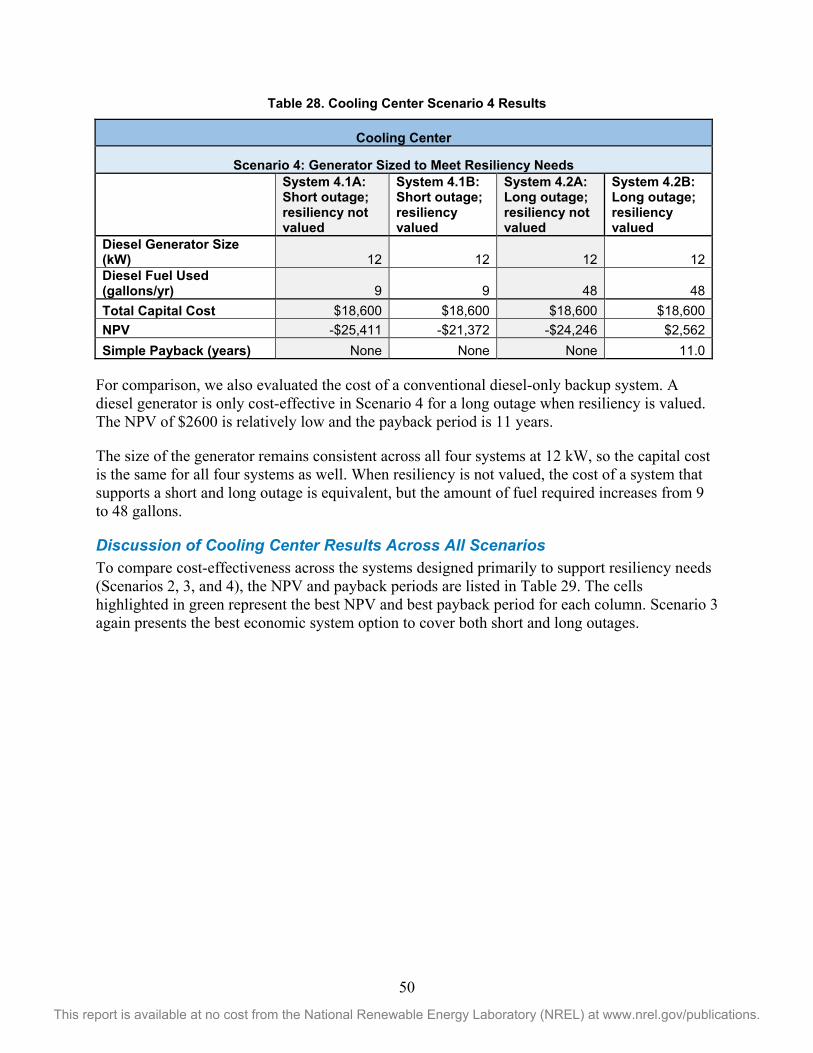
50
This report is available at no cost from the National Renewable Energy Laboratory (NREL) at www.nrel.gov/publications.
Table 28. Cooling Center Scenario 4 Results
Cooling Center
Scenario 4: Generator Sized to Meet Resiliency Needs
System 4.1A: Short outage; resiliency not valued
System 4.1B: Short outage; resiliency valued
System 4.2A: Long outage; resiliency not valued
System 4.2B: Long outage; resiliency valued
Diesel Generator Size (kW) 12 12 12 12 Diesel Fuel Used (gallons/yr) 9 9 48 48 Total Capital Cost $18,600 $18,600 $18,600 $18,600 NPV -$25,411 -$21,372 -$24,246 $2,562 Simple Payback (years) None None None 11.0
For comparison, we also evaluated the cost of a conventional diesel-only backup system. A diesel generator is only cost-effective in Scenario 4 for a long outage when resiliency is valued. The NPV of $2600 is relatively low and the payback period is 11 years.
The size of the generator remains consistent across all four systems at 12 kW, so the capital cost is the same for all four systems as well. When resiliency is not valued, the cost of a system that supports a short and long outage is equivalent, but the amount of fuel required increases from 9 to 48 gallons.
Discussion of Cooling Center Results Across All Scenarios To compare cost-effectiveness across the systems designed primarily to support resiliency needs (Scenarios 2, 3, and 4), the NPV and payback periods are listed in Table 29. The cells highlighted in green represent the best NPV and best payback period for each column. Scenario 3 again presents the best economic system option to cover both short and long outages.

51
This report is available at no cost from the National Renewable Energy Laboratory (NREL) at www.nrel.gov/publications.
Table 29. Cooling Center NPV and Payback Comparison of Scenarios 2, 3, and 4
Cooling Center
Most Cost-Effective Option for Outage Coverage
Short outage; resiliency not valued
Long outage; resiliency not valued
Short outage; resiliency valued
Long outage; resiliency valued
Scenario 2: PV+Storage NPV -$45,555 -$181,636 -$41,516 -$153,244 Scenario 2: PV+Storage Payback 14.9 25.5 14.3 20.4 Scenario 3: Hybrid NPV $430 -$1,008 $0 $9,329 Scenario 3: Hybrid Payback 11.4 11.3 12.2 12.3 Scenario 4: Generator NPV -$25,411 -$24,246 -$21,372 $2,562 Scenario 4: Generator Payback N/A N/A N/A 11.0
Recommendations Currently, there is no established resiliency value stream; therefore, it is up to the individual facility and its larger agency to determine how resiliency is valued. The level at which resiliency is valued will influence the type of emergency power system that the facility should implement. Whether or not these three facilities assign an economic value to resiliency, if they want to deploy an emergency power system, a hybrid system (Scenario 3) is recommended. If emergency power is viewed as a secondary benefit to the economic benefits that a resilient PV system can provide, a Scenario 1 system is recommended. Scenario 1 systems will allow the host site to see a return on its investment while receiving some degree of emergency power in the event of an outage, depending on when the outage occurs.

52
This report is available at no cost from the National Renewable Energy Laboratory (NREL) at www.nrel.gov/publications.
4 Conclusion This analysis modeled resilient PV systems designed for economic savings and examined the amount of emergency power these systems are capable of providing. The analysis also modeled resilient PV and hybrid systems designed to support emergency power needs, which could then be used for economic savings during normal grid operations. Finally, the analysis looked at generator-only systems designed to support emergency power needs in order to compare this traditional resiliency solution with resilient PV and hybrid solutions. The results for these sites indicate that:
• Resilient PV and hybrid systems can be NPV-positive with and without a resiliency value stream included.
• For NYPA customers, the economics of resilient PV are better than standalone solar PV, primarily due to the battery’s ability to reduce utility demand charges.
• Project economics for all modeled systems are greatly improved for radial customers when a resiliency value stream is included due to higher frequency of outages that occur on radial systems vs. network grids.
• Project economics for all modeled systems are moderately improved for network customers when a resiliency value stream is included.
• Resilient PV sized for cost savings (i.e., not for resiliency) will provide limited resiliency benefits.
• The level of resiliency provided by resilient PV systems sized for utility cost savings depends on when the outage occurs, state of charge of the battery, and load size.
• Resilient PV and hybrid systems designed to support short long outages result in systems that are larger and more costly than systems sized for cost savings.
• In some cases, inclusion of a value for avoiding utility power outages can more than offset the additional costs incurred by sizing resilient PV for resiliency rather than utility cost savings alone.
• Generators as a resiliency solution are not NPV-positive except when resiliency is valued for long outages.
• Though generators are the most widely used form of emergency and stand-by power, solar-plus-storage and hybrid systems can offer the same benefits at a better lifecycle cost. However, generators have a lower initial cost.
Scenario 1 results show that a modestly sized battery system can be strategically charged and discharged such that it shaves the peak loads and, therefore, captures significant demand savings. Since the capacity of these batteries is small, they can generally only support the critical load for a few hours, much less than the five-day outage period desired by many of the onsite staff interviewed for this project. Similarly, small roof space at two of the sites offered nominal energy savings during grid operations, and extended the duration of outage that could be served by a battery by a few hours. When resiliency isn’t prioritized or valued, a Scenario 1 system can support emission reduction targets and lower electricity costs.

53
This report is available at no cost from the National Renewable Energy Laboratory (NREL) at www.nrel.gov/publications.
The results from the second scenario show that it would take a battery of considerable size and increased solar resources to sustain the critical load for an extended outage. Inclusion of a resiliency value stream can make resilient PV economically viable, but without it, the increased system size can push the NPV negative. The results from the third scenario indicate that a hybrid system is generally the more economical system configuration for sustaining outages. The battery and PV reduce the size of the diesel generator required, and the diesel generator provides the extra energy and power required during long outage periods. The savings the battery and PV provide during normal grid-connected operation make the hybrid system more economical than a diesel generator alone, as seen in the fourth scenario. However, hybrid systems are a more complex solution with a higher first cost compared to a stand-alone diesel generator.
The size of resilient PV systems that these three sites—and other critical infrastructure sites in NYC—should deploy will depend on the priorities of the site and the degree to which resiliency is or is not valued. For city-owned buildings, solar deployment for emissions reductions is a priority. Knowing that 100 MW of solar will be installed on city buildings, it is worth noting that this analysis finds adding storage can improve project economics for NYPA customers by reducing demand charges. The incorporation of storage into NYC’s solar deployment goals will add resiliency benefits that standalone solar can not otherwise provide. Adding storage to city solar deployments could also be an opportunity to align the city’s sustainability and resiliency goals.
For critical infrastructure, interest in resilient PV may be driven by resiliency benefits rather than emissions reductions. Following Hurricane Sandy, the Mayor’s generator and boiler task force deemed restoring power to NYCHA’s 80,000 affected residents was the next-highest priority after meeting immediate life safety needs. Rather than relying solely on generators to supply emergency power needs, hybrid systems can offer NYCHA (and other sites) an option that is more cost-effective and reduces reliance on a single technology. Regulatory changes may be necessary in order to permit resilient PV as a code-compliant option for emergency power, similar to how Local Law 111 removed barriers to the use of natural gas generators for emergency power.53 In addition to resiliency, cost savings are a priority across critical infrastructure. Unlike commercial buildings that generally require quick payback, public facilities may invest in solutions that offer long-term savings when upfront capital or third-party financing is available.
For commercial buildings on Con Edison’s SC 9 tariff, demand charges range from $26 - $31/kW, which is slightly lower than the demand charges for the NYPA customers modeled in this analysis (13% - 50% lower depending on the site and season). However, energy rates for SC 9 customers average around $0.085/kWh while NYPA customers average around half that at $0.044/kWh. If the sites used in this study were analyzed on Con Edison rates, it is expected that the resulting recommended systems would have smaller battery systems, and larger PV systems. The facilities that are space-constrained would likely see all available space used for solar, and smaller storage systems. Improved project economics for a Con Edison customer would be more likely at a location with ample roof space for solar.
53 Building Resiliency Task Force, 2016. “Remove Barriers to Backup & Natural Gas Generators.” Urban Green Council. http://urbangreencouncil.org/content/remove-barriers-backup-natural-gas-generators.

54
This report is available at no cost from the National Renewable Energy Laboratory (NREL) at www.nrel.gov/publications.
Overall, results of this analysis show that pairing these systems with storage (and generators when resiliency is a priority) may be economical depending on payback requirements, site suitability, and other factors. As a next step, obtaining more granular cost assumption data on resilient PV projects would help fill in any gaps on integration, critical load isolation, and other additional costs. Improved cost assumptions would yield more accurate estimates to inform investment decisions, but these are difficult to obtain in a young market. However, as the solar and storage markets mature and prices decline, and as utilities adopt rates that are more advantageous to distributed generation54, project economics will also improve for both NYPA and Con Edison customers. The question of how resiliency is valued for critical infrastructure also needs to be answered in order to truly understand the economics of emergency power investments.
In order to start a conversation about the value of resiliency, this analysis presents a potential resiliency value in order to compare results to systems that do not value resiliency. These values do not capture the full complexity of valuing resiliency. For example, power outages have real costs which are often borne by federal agencies that are less involved in local resiliency investments. The Federal Emergency Management Agency (FEMA) typically covers 75% or more of recovery costs when a local event is declared a national disaster. How to value resiliency will require local, state, and national conversations with the public, government agencies, and private companies that bear the brunt of outage costs.
54 This is expected under New York State’s Reforming the Energy Vision.
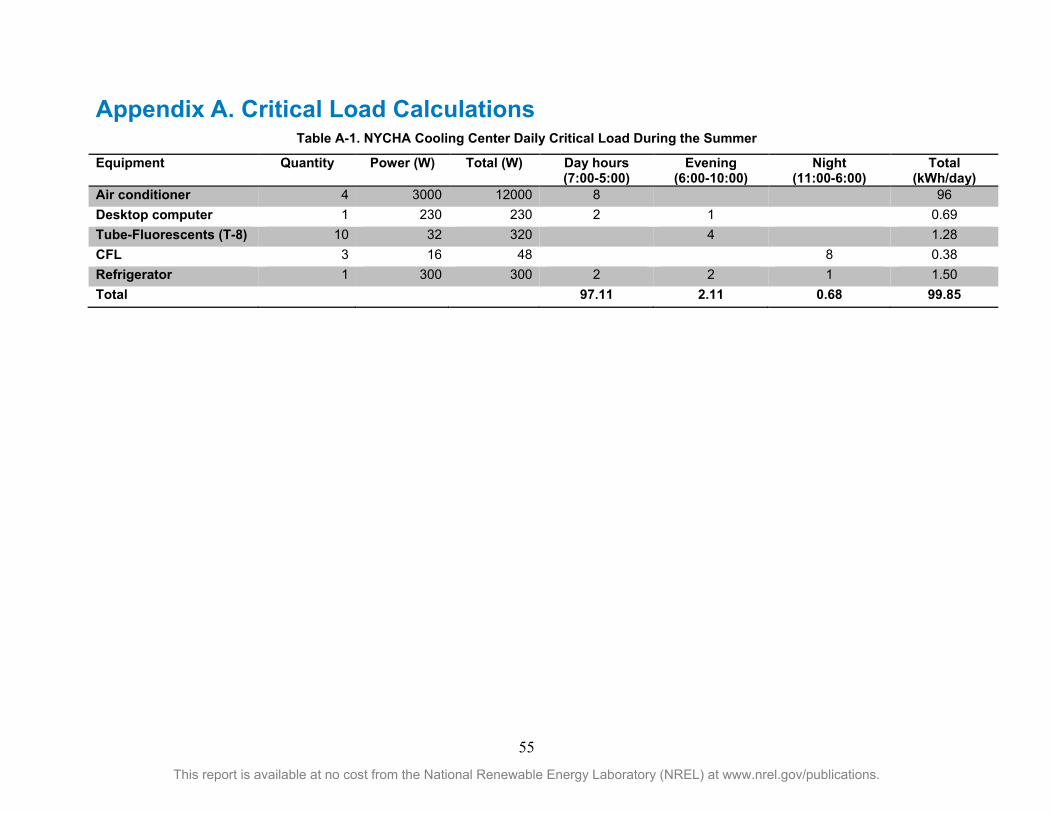
55
This report is available at no cost from the National Renewable Energy Laboratory (NREL) at www.nrel.gov/publications.
Appendix A. Critical Load Calculations Table A-1. NYCHA Cooling Center Daily Critical Load During the Summer
Equipment Quantity Power (W) Total (W) Day hours (7:00-5:00)
Evening (6:00-10:00)
Night (11:00-6:00)
Total (kWh/day)
Air conditioner 4 3000 12000 8 96 Desktop computer 1 230 230 2 1 0.69 Tube-Fluorescents (T-8) 10 32 320 4 1.28 CFL 3 16 48 8 0.38 Refrigerator 1 300 300 2 2 1 1.50 Total 97.11 2.11 0.68 99.85

56
This report is available at no cost from the National Renewable Energy Laboratory (NREL) at www.nrel.gov/publications.
Table A-2. NYC-DOE School Shelter Daily Critical Load During the Summer and Winter
Summer Winter Hours used per day Hours used per day Room Equipment
Total (W)
Day (7am-5pm)
Evening (6pm-10pm)
Night (10pm-6am)
Total kWh/da
y
Day (7am-5pm)
Evening (6pm-10pm)
Night (10pm-6am)
Total kWh/day
Window AC units 6000 9 3 0 72 0 0 0 0 Desktop computer 460 4 0 0 2 4 0 0 2 LED lamps 2016 10 4 0 28 10 4 0 28 Tube-Fluorescents (T-8) 4544 10 4 0 64 10 4 0 64 Electrical outlets 48 10 4 0 1 10 4 0 1
Boiler Room Equipment Fuel oil pump 1167 4 4 9 10 4 8 26 Vacuum pump 2691 4 4 22 10 4 8 59 Feed water pump 2725 4 4 22 10 4 8 60 Condensate pump 4248 4 4 34 10 4 8 93 Sewage ejector pump 2691 1 3 1 3 air compressors 4021 2 8 2 8
Sump pump 2043 3 2 3 16 3 2 3 16
Freezer (Walk-in) 3664 8 4 4 59 8 4 4 59
Refrigerator (Walk-in) 2774 2 1 2 14 2 1 2 14
Totals 352.57 432.20

57
This report is available at no cost from the National Renewable Energy Laboratory (NREL) at www.nrel.gov/publications.
Appendix B. Resiliency Calculations
Figure B-1. Outputs from the ICE Calculator for the Fire Station

58
This report is available at no cost from the National Renewable Energy Laboratory (NREL) at www.nrel.gov/publications.
Table B-1. Outputs from the ICE Calculator for 1-16 Hour Outages (in 60-Minute Increments) for the Fire Station
Fire Station Outage Cost Curve (radial customer) CAIDI Cost Unit Cost
Hours Minutes Interruption Cost Cost of Interruption 1 60 $ 941 $ 941.00 2 120 $ 1,447 $ 723.70 3 180 $ 2,110 $ 703.30 4 240 $ 2,935 $ 733.70 5 300 $ 3,918 $ 783.64 6 360 $ 5,044 $ 840.70 7 420 $ 6,287 $ 898.09 8 480 $ 7,608 $ 951.04 9 540 $ 8,963 $ 995.89
10 600 $ 10,298 $ 1,029.77 11 660 $ 11,554 $ 1,050.38 12 720 $ 12,674 $ 1,056.17 13 780 $ 13,601 $ 1,046.24 14 840 $ 14,287 $ 1,020.52 15 900 $ 14,695 $ 979.67 16 960 $ 14,801 $ 925.06
Average $ 917.43
Figure B-2. Cost vs. Outage Length from the ICE Calculator for the Fire Station
$-
$2,000
$4,000
$6,000
$8,000
$10,000
$12,000
$14,000
$16,000
0 200 400 600 800 1000 1200
Cost
($)
Outage (minutes)
Fire Station Cost vs. Outage

59
This report is available at no cost from the National Renewable Energy Laboratory (NREL) at www.nrel.gov/publications.
Figure B-3. Outputs from the ICE Calculator for the NYCHA Cooling Center

60
This report is available at no cost from the National Renewable Energy Laboratory (NREL) at www.nrel.gov/publications.
Table B-2. Outputs from the ICE Calculator for 1-16 Hour Outages (in 60-Minute Increments) for the Cooling Center
NYCHA Cooling Center Outage Cost Curve (network customer) CAIDI Cost Unit Cost
Hours Minutes Interruption Cost Cost of Interruption 1 60 $30 $ 29.70 2 120 $47 $ 23.60 3 180 $71 $ 23.53 4 240 $100 $ 25.03 5 300 $136 $ 27.12 6 360 $177 $ 29.43 7 420 $222 $ 31.69 8 480 $270 $ 33.75 9 540 $319 $ 35.48
10 600 $368 $ 36.76 11 660 $413 $ 37.53 12 720 $453 $ 37.73 13 780 $485 $ 37.32 14 840 $508 $ 36.31 15 900 $521 $ 34.74 16 960 $523 $ 32.67
Average $32.02
Figure B-4. Cost vs. Outage Length from the ICE Calculator for the Cooling Center
$0
$100
$200
$300
$400
$500
$600
0 200 400 600 800 1000 1200
Cost
($)
Outage (minutes)
Cost vs Outage

61
This report is available at no cost from the National Renewable Energy Laboratory (NREL) at www.nrel.gov/publications.
Figure B-5. Outputs from the ICE Calculator for the School Shelter

62
This report is available at no cost from the National Renewable Energy Laboratory (NREL) at www.nrel.gov/publications.
Table B-3. Outputs from the ICE Calculator for 1-16 Hour Outages (in 60-Minute Increments) for the School Shelter
School Shelter Outage Cost Curve (network customer)
CAIDI Cost Unit Cost Hours Minutes Interruption Cost Cost of Interruption
1 60 $ 77 $ 77.30 2 120 $ 116 $ 57.75 3 180 $ 165 $ 54.90 4 240 $ 225 $ 56.30 5 300 $ 297 $ 59.34 6 360 $ 378 $ 63.02 7 420 $ 468 $ 66.83 8 480 $ 563 $ 70.39 9 540 $ 661 $ 73.44
10 600 $ 758 $ 75.78 11 660 $ 850 $ 77.23 12 720 $ 932 $ 77.68 13 780 $ 1,002 $ 77.04 14 840 $ 1,054 $ 75.31 15 900 $ 1,088 $ 72.52 16 960 $ 1,100 $ 68.74
Average $ 68.97
Figure B-6. Cost vs. Outage Length from the ICE Calculator for the School Shelter
$-
$200
$400
$600
$800
$1,000
$1,200
0 200 400 600 800 1000 1200
Cost
($)
Outage (minutes)
School Shelter Cost vs. Outage

63
This report is available at no cost from the National Renewable Energy Laboratory (NREL) at www.nrel.gov/publications.
Appendix C. Utility Rate Tariffs
Figure C-1. Service Classification No. 68

64
This report is available at no cost from the National Renewable Energy Laboratory (NREL) at www.nrel.gov/publications.
Figure C-2. Service Classification No. 91

65
This report is available at no cost from the National Renewable Energy Laboratory (NREL) at www.nrel.gov/publications.
Appendix D. Additional Results NYC-DOE
Table D-1. School Shelter Baseline: No Resilient PV
Scenario Number 0.1 0.2 0.3
Description Without cost of grid interruptions
With cost of 2 hours/year grid
interruptions
With cost of 22 hours/year grid
interruptions
Outage START (hour of year) - - -
Outage STOP (hour of year) - - -
Resiliency Value ($/hour) 0 68.97, 7.25 hours 68.97, 50.96 hours
Outage Duration (hours) 0 0 0
PV Size (kW-DC) 0 0 0
Battery Size (kWh) 0 0 0
Battery Size (kW) 0 0 0
Diesel Generator Size (kW) 0 0 0
PV Cost ($) 0 0 0
PV Cost Less NY Sun incentive ($) 0 0 0
Battery Cost ($) 0 0 0
Generator Cost ($) 0 0 0
Total Capital Cost ($) 0 0 0
Year 1 Electric Cost ($) 69,920 69,920 69,920
Year 1 Demand Cost ($) 191,751 191,751 191,751
Year 1 Electric Savings ($) 0 0 0
Year 1 Demand Savings ($) 0 0 0
Annual Resiliency Savings ($) 0 0 0
LCC ($) 5,385,190 5,393,890 5,446,340
NPV ($) 0 0 0
SPP (years) 0 0 0
Diesel Fuel Used (gallons) 0 0 0
Incentive Required to get to NPV=0 (%) 0 0 0

66
This report is available at no cost from the National Renewable Energy Laboratory (NREL) at www.nrel.gov/publications.
Table D-2. School Shelter Scenario 1: Resilient PV Sized for Economic Savings
Scenario Number 1.1 1.2 1.3
Description No resiliency value 2 hour resiliency value
22 hour resiliency value
Outage START (hour of year) - - -
Outage STOP (hour of year) - - -
Resiliency Value ($/hour) 0 68.97, 7.25 hours 68.97, 7.25 hours
Outage Duration (hours) 0 0 0
PV Size (kW-DC) 50 50 50
Battery Size (kWh) 73.76 73.76 73.76
Battery Size (kW) 34.86 34.86 34.86
Diesel Generator Size (kW) 0 0 0
PV Cost ($) 172,500 172,500 172,500
PV Cost Less NY Sun incentive ($) 132,500 132,500 132,500
Battery Cost ($) 73,216 73,216 73,216
Generator Cost ($) 0 0 0
Total Capital Cost ($) 205,716 205,716 205,716
Year 1 Electric Cost ($) 69,652 69,652 69,652
Year 1 Demand Cost ($) 177,620 177,620 177,620
Year 1 Electric Savings ($) 268 268 268
Year 1 Demand Savings ($) 14,131 14,131 14,131
Annual Resiliency Savings ($) - 413 413
LCC ($) 5,333,630 5,335,240 5,335,240
NPV ($) 51,560 58,650 58,650
SPP (years) 14.29 13.89 13.89
Diesel Fuel Used (gallons) 0 0 0
Incentive Required to get to NPV=0 (%) 0 0 0
Size of Critical Load that Can Be Supported for Full Length of Outage (%)
7 Hour Outage- Worst 46% 46% 46%
7 Hour Outage- Best 285% 285% 285%
51 Hour Outage- Worst 12% 12% 12%
51 Hour Outage- Best 50% 50% 50%
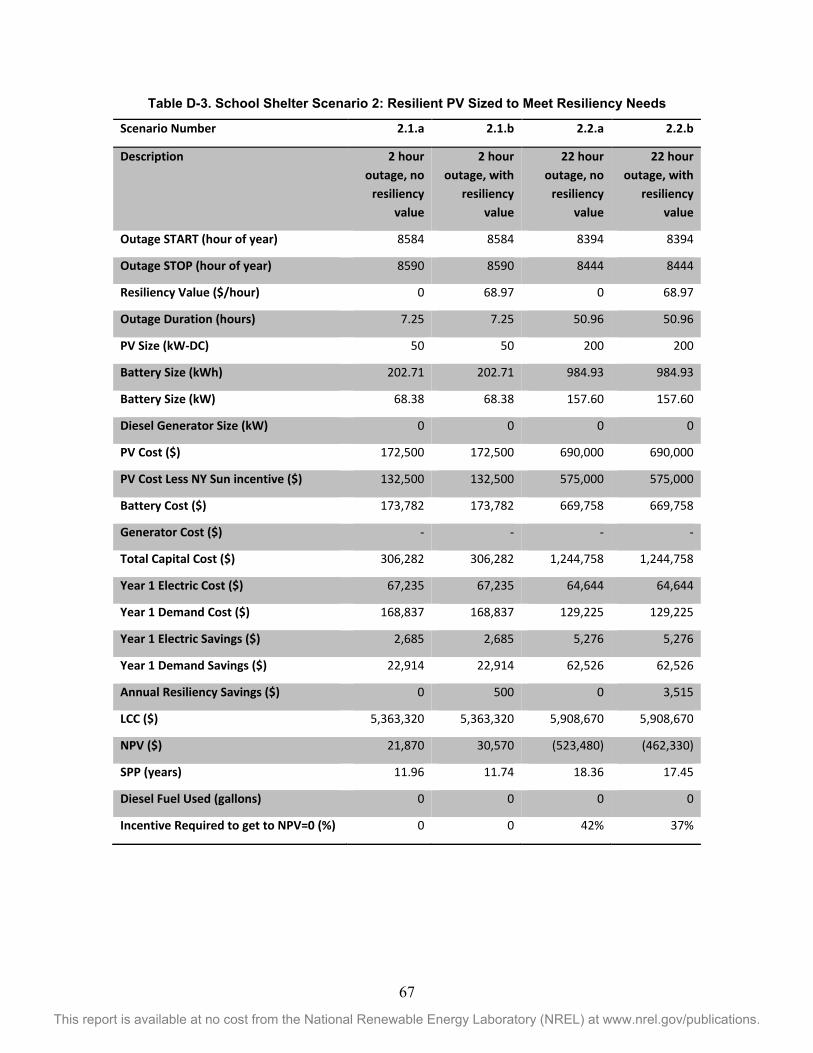
67
This report is available at no cost from the National Renewable Energy Laboratory (NREL) at www.nrel.gov/publications.
Table D-3. School Shelter Scenario 2: Resilient PV Sized to Meet Resiliency Needs
Scenario Number 2.1.a 2.1.b 2.2.a 2.2.b
Description 2 hour outage, no
resiliency value
2 hour outage, with
resiliency value
22 hour outage, no
resiliency value
22 hour outage, with
resiliency value
Outage START (hour of year) 8584 8584 8394 8394
Outage STOP (hour of year) 8590 8590 8444 8444
Resiliency Value ($/hour) 0 68.97 0 68.97
Outage Duration (hours) 7.25 7.25 50.96 50.96
PV Size (kW-DC) 50 50 200 200
Battery Size (kWh) 202.71 202.71 984.93 984.93
Battery Size (kW) 68.38 68.38 157.60 157.60
Diesel Generator Size (kW) 0 0 0 0
PV Cost ($) 172,500 172,500 690,000 690,000
PV Cost Less NY Sun incentive ($) 132,500 132,500 575,000 575,000
Battery Cost ($) 173,782 173,782 669,758 669,758
Generator Cost ($) - - - -
Total Capital Cost ($) 306,282 306,282 1,244,758 1,244,758
Year 1 Electric Cost ($) 67,235 67,235 64,644 64,644
Year 1 Demand Cost ($) 168,837 168,837 129,225 129,225
Year 1 Electric Savings ($) 2,685 2,685 5,276 5,276
Year 1 Demand Savings ($) 22,914 22,914 62,526 62,526
Annual Resiliency Savings ($) 0 500 0 3,515
LCC ($) 5,363,320 5,363,320 5,908,670 5,908,670
NPV ($) 21,870 30,570 (523,480) (462,330)
SPP (years) 11.96 11.74 18.36 17.45
Diesel Fuel Used (gallons) 0 0 0 0
Incentive Required to get to NPV=0 (%) 0 0 42% 37%

68
This report is available at no cost from the National Renewable Energy Laboratory (NREL) at www.nrel.gov/publications.
Table D-4. School Shelter Scenario 3: Resilient PV and Generator (Hybrid System) Sized to Meet Resiliency Needs
Scenario Number 3.1.a 3.1.b 3.2.a 3.2.b
Description 2 hour outage, no resiliency
value
2 hour outage, with resiliency
value
22 hour outage, no
resiliency value
22 hour outage, with
resiliency value
Outage START (hour of year) 8584 8584 8394 8394
Outage STOP (hour of year) 8590 8590 8444 8444
Resiliency Value ($/hour) 0 68.97 0 68.97
Outage Duration (hours) 7.25 7.25 50.96 50.96
PV Size (kW-DC) 50 50 50 50
Battery Size (kWh) 117.93 117.93 87.03 87.03
Battery Size (kW) 47.62 47.62 39.38 39.38
Diesel Generator Size (kW) 9.69 9.69 18.13 18.13
PV Cost ($) 172,500 172,500 172,500 172,500
PV Cost Less NY Sun incentive ($) 132,500 132,500 132,500 132,500
Battery Cost ($) 108,939 108,939 84,636 84,636
Generator Cost ($) 14,535 14,535 27,195 27,195
Total Capital Cost ($) 255,974 255,974 244,331 244,331
Year 1 Electric Cost ($) 69,635 69,635 69,447 69,447
Year 1 Demand Cost ($) 174,330 174,330 176,492 176,492
Year 1 Electric Savings ($) 285 285 473 473
Year 1 Demand Savings ($) 17,421 17,421 15,259 15,259
Annual Resiliency Savings ($) - 500 - 3,515
LCC ($) 5,361,540 5,361,540 5,367,810 5,367,810
NPV ($) 23,650 32,350 17,380 78,530
SPP (years) 14.46 14.06 15.53 12.69
Diesel Fuel Used (gallons) 7.94 7.94 88.42 88.42
Incentive Required to get to NPV=0 (%)
0 0 0 0
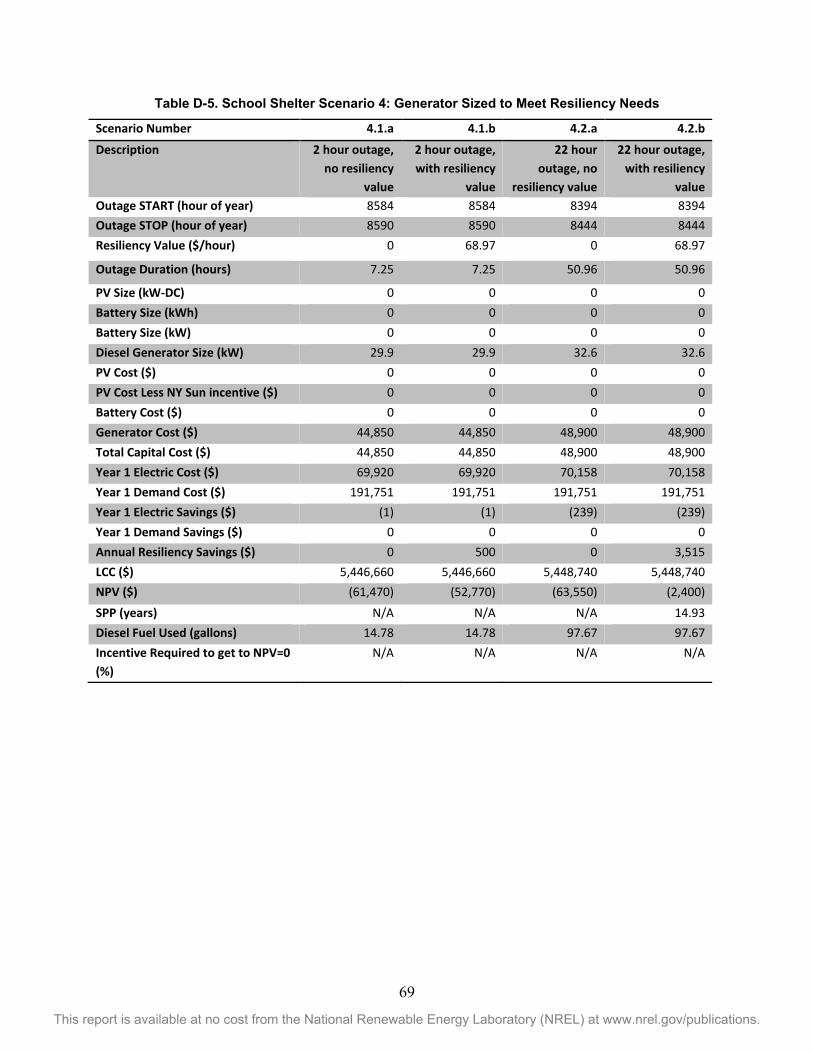
69
This report is available at no cost from the National Renewable Energy Laboratory (NREL) at www.nrel.gov/publications.
Table D-5. School Shelter Scenario 4: Generator Sized to Meet Resiliency Needs
Scenario Number 4.1.a 4.1.b 4.2.a 4.2.b
Description 2 hour outage, no resiliency
value
2 hour outage, with resiliency
value
22 hour outage, no
resiliency value
22 hour outage, with resiliency
value Outage START (hour of year) 8584 8584 8394 8394 Outage STOP (hour of year) 8590 8590 8444 8444 Resiliency Value ($/hour) 0 68.97 0 68.97
Outage Duration (hours) 7.25 7.25 50.96 50.96
PV Size (kW-DC) 0 0 0 0 Battery Size (kWh) 0 0 0 0 Battery Size (kW) 0 0 0 0 Diesel Generator Size (kW) 29.9 29.9 32.6 32.6 PV Cost ($) 0 0 0 0 PV Cost Less NY Sun incentive ($) 0 0 0 0 Battery Cost ($) 0 0 0 0 Generator Cost ($) 44,850 44,850 48,900 48,900 Total Capital Cost ($) 44,850 44,850 48,900 48,900 Year 1 Electric Cost ($) 69,920 69,920 70,158 70,158 Year 1 Demand Cost ($) 191,751 191,751 191,751 191,751 Year 1 Electric Savings ($) (1) (1) (239) (239) Year 1 Demand Savings ($) 0 0 0 0 Annual Resiliency Savings ($) 0 500 0 3,515 LCC ($) 5,446,660 5,446,660 5,448,740 5,448,740 NPV ($) (61,470) (52,770) (63,550) (2,400) SPP (years) N/A N/A N/A 14.93 Diesel Fuel Used (gallons) 14.78 14.78 97.67 97.67 Incentive Required to get to NPV=0 (%)
N/A N/A N/A N/A

70
This report is available at no cost from the National Renewable Energy Laboratory (NREL) at www.nrel.gov/publications.
FDNY Table D-6. Fire Station Baseline: No Resilient PV
Scenario Number 0.1 0.2 0.3
Description Without cost of grid interruptions
With cost of 2 hours/year grid
interruptions
With cost of 22 hours/year grid
interruptions
Outage START (hour of year) - - -
Outage STOP (hour of year)
Resiliency Value ($/hour) 0 $917.43/hr,
2 hours
917.43/hr,
22 hours
Outage Duration (hours) 0 0 0
PV Size (kW-DC) 0 0 0
Battery Size (kWh) 0 0 0
Battery Size (kW) 0 0 0
Diesel Generator Size (kW) 0 0 0
PV Cost ($) 0 0 0
PV Cost Less NY Sun incentive ($) 0 0 0
Battery Cost ($) 0 0 0
Generator Cost ($) 0 0 0
Total Capital Cost ($) 0 0 0
Year 1 Electric Cost ($) 6,092 6,092 6,092
Year 1 Demand Cost ($) 15,214 15,214 15,214
Year 1 Electric Savings ($) 0 0 0
Year 1 Demand Savings ($) 0 0 0
Annual Resiliency Savings ($) 0 0 0
LCC ($) 438,478 470,245 787,754
NPV ($) 0 0 0
SPP (years) 0 0 0
Diesel Fuel Used (gallons) 0 0 0
Incentive Required to get to NPV=0 (%) 0 0 0

71
This report is available at no cost from the National Renewable Energy Laboratory (NREL) at www.nrel.gov/publications.
Table D-7. Fire Station Scenario 1: Resilient PV Sized for Economic Savings
Scenario Number 1.1 1.1 Solar 1.2 1.2 Solar 1.3 1.3 Solar
Description No resiliency value
No resiliency value, require PV
2 hour resiliency value
2 hour resiliency value, require PV
22 hour resiliency value
22 hour resiliency value, require PV
Outage START (hour of year) - - - - - -
Outage STOP (hour of year) - - - - - -
Resiliency Value ($/hour) 0 0 $917.43/hr2 hrs
$917.43/hr2 hrs
$917.43/hr 22 hrs
$917.43/hr22 hrs
Outage Duration (hours) 0 0 0 0 0 0
PV Size (kW-DC) 0 10.0 0 10.0 0 10.0
Battery Size (kWh) 60.1 42.5 60.1 42.5 214.3 213.0
Battery Size (kW) 18.7 16.5 18.7 16.5 29.8 31.2
Diesel Generator Size (kW) 0 0 0 0 0 0
PV Cost ($) 0 38,800 0 38,800 0 38,800
PV Cost Less NY Sun incentive ($) 0 30,800 0 30,800 0 30,800
Battery Cost ($) 49,945 38,613 49,945 38,613 141,226 141,941
Generator Cost ($) 0 0 0 0 0 0
Total Capital Cost ($) 49,945 69,413 49,945 69,413 141,226 172,741
Year 1 Electric Cost ($) 6,095 5,987 6,095 5,576 6,122 5,590
Year 1 Demand Cost ($) 10,888 10,943 10,888 10,943 8,240 7,263
Year 1 Electric Savings ($) (3) 105 (3) 516 (30) 502
Year 1 Demand Savings ($) 4,327 4,271 4,327 4,271 6,974 7,951
Annual Resiliency Savings ($) 0 0 1,826 1,826 20,073 20,073
LCC ($) 404,498 416,113 404,498 416,113 452,415 463,504
NPV ($) 33,980 22,365 65,747 54,132 335,339 324,250
SPP (years) 11.55 15.86 8.12 10.50 5.23 6.06
Diesel Fuel Used (gallons) 0 0 0 0 0 0
Incentive Required to get to NPV=0 (%) 0 0 0 0 0 0
Size of Critical Load that Can Be Supported for Full Length of Outage (%)
2 Hour Outage- Worst 41% 41% 77%
2 Hour Outage- Best 732% 732% 1181%
22 Hour Outage- Worst 2.4% 2.4% 47%
22 Hour Outage- Best 73% 73% 264%

72
This report is available at no cost from the National Renewable Energy Laboratory (NREL) at www.nrel.gov/publications.
Table D-8. Fire Station Scenario 2: Resilient PV Sized to Meet Resiliency Needs
Scenario Number 2.1.a 2.1.b 2.1.b Solar 2.2.a 2.2.b
Description 2 hour outage, no
resiliency value
2 hour outage, with
resiliency value
2 hour outage, with resiliency value, require
PV
22 hour outage, no
resiliency value
22 hour outage, with
resiliency value
Outage START (hour of year) 6015 6015 6015 6004 6004
Outage STOP (hour of year) 6016 6016 6016 6025 6025
Resiliency Value ($/hour) 0 917.43 917.43 0 917.43
Outage Duration (hours) 1.99 1.99 1.99 21.88 21.88
PV Size (kW-DC) 0.0 0.0 10.0 10.0 10.0
Battery Size (kWh) 136.3 136.3 130.5 613.0 613.0
Battery Size (kW) 41.1 41.1 40.2 40.2 40.2
Diesel Generator Size (kW) 0 0 0 0 0
PV Cost ($) 0 0 38,800 38,800 38,800
PV Cost Less NY Sun incentive ($)
0 0 30,800 30,800 30,800
Battery Cost ($) 111,930 111,930 108,028 358,906 358,906
Generator Cost ($) 0 0 0 0 0
Total Capital Cost ($) 111,930 111,930 138,828 389,706 389,706
Year 1 Electric Cost ($) 6,099 6,099 5,575 5,584 5,584
Year 1 Demand Cost ($) 9,802 9,802 9,356 7,038 7,038
Year 1 Electric Savings ($) (7) (7) 517 508 508
Year 1 Demand Savings ($) 5,412 5,412 5,858 8,176 8,176
Annual Resiliency Savings ($) 0 1,826 1,826 0 20,073
LCC ($) 450,548 450,548 460,096 694,636 694,636
NPV ($) (12,070) 19,697 10,149 (256,158) 93,118
SPP (years) 20.71 15.48 16.93 44.88 13.55
Diesel Fuel Used (gallons) 0.00 0.00 1.00 0.00 0.00
Incentive Required to get to NPV=0 (%)
11% 0 0 66% 0
Note: We did not run a separate “Solar” case requiring PV for Scenario 2.1.a because there are not positive NPV savings to subsidize the cost of PV. Solar is already part of the cost-optimal solution in Scenario 2.2.a and 2.2.b, so we did not run a separate “Solar” case requiring PV for these two scenarios.

73
This report is available at no cost from the National Renewable Energy Laboratory (NREL) at www.nrel.gov/publications.
Table D-9. Fire Station Scenario 3: Resilient PV and Generator (Hybrid System) Sized to Meet Resiliency Needs
Scenario Number 3.1.a 3.1.a SOLAR 3.1.b 3.1.b Solar 3.2.a 3.2.b
Description 2 hour outage, no
resiliency value
2 hour outage, no
resiliency value, require
PV
2 hour outage,
with resiliency
value
2 hour outage, with
resiliency value, require
PV
22 hour outage, no
resiliency value
22 hour outage, with
resiliency value
Outage START (hour of year) 6015 6015 6015 6015 6004 6004
Outage STOP (hour of year) 6016 6016 6016 6016 6025 6025
Resiliency Value ($/hour) 0 0 917.43 917.43 0 917.43
Outage Duration (hours) 1.99 1.99 1.99 1.99 21.88 21.88
PV Size (kW-DC) 0.0 4.0 0.0 10.0 0.6 0.6
Battery Size (kWh) 74.1 73.2 74.1 74.3 60.5 60.5
Battery Size (kW) 19.0 18.2 19.0 18.3 16.5 16.5
Diesel Generator Size (kW) 22.11 22.51 22.11 21.86 26.30 26.30
PV Cost ($) 0 15,520 0 38,800 2,483 2,483
PV Cost Less NY Sun incentive ($) 0 12,320 0 30,800 1,971 1,971
Battery Cost ($) 57,466 56,243 57,466 56,915 47,960 47,960
Generator Cost ($) 33,165 33,765 33,165 32,790 39,450 39,450
Total Capital Cost ($) 90,631 102,328 90,631 120,505 89,381 89,381
Year 1 Electric Cost ($) 6,118 5,908 6,118 5,594 6,122 6,122
Year 1 Demand Cost ($) 10,392 10,085 10,392 9,729 10,673 10,673
Year 1 Electric Savings ($) (26) 184 (26) 498 (30) (30)
Year 1 Demand Savings ($) 4,822 5,129 4,822 5,485 4,541 4,541
Annual Resiliency Savings ($) 0 0 1,826 1,826 0 20,073
LCC ($) 436,052 438,478 436,052 444,861 440,157 440,157
NPV ($) 2,426 0 34,193 25,384 (1,679) 347,597
SPP (years) 18.90 19.26 13.69 15.43 19.81 3.64
Diesel Fuel Used (gallons) 4.06 4.12 4.06 4.03 43.30 43.30
Incentive Required to get to NPV=0 (%)
0 0 0 0 0 0
Note: Solar is already part of the cost-optimal solution in Scenario 3.2.a and 3.2.b, so we did not run a separate “Solar” case requiring PV for these two scenarios.

74
This report is available at no cost from the National Renewable Energy Laboratory (NREL) at www.nrel.gov/publications.
Table D-10. Fire Station Scenario 4: Generator Sized to Meet Resiliency Needs
Scenario Number 4.1.a 4.1.b 4.2.a 4.2.b
Description 2 hour outage, no resiliency
value
2 hour outage, with resiliency
value
22 hour outage, no
resiliency value
22 hour outage, with resiliency
value Outage START (hour of year) 6015 6015 6004 6004 Outage STOP (hour of year) 6016 6016 6025 6025 Resiliency Value ($/hour) - 917.43 - 917.43
Outage Duration (hours) 1.99 1.99 21.88 21.88
PV Size (kW-DC) 0.0 0.0 0.0 0.0 Battery Size (kWh) 0.0 0.0 0.0 0.0 Battery Size (kW) 0.0 0.0 0.0 0.0 Diesel Generator Size (kW) 41.08 41.08 41.08 41.08 PV Cost ($) 0 0 0 0 PV Cost Less NY Sun incentive ($) 0 0 0 0 Battery Cost ($) 0 0 0 0 Generator Cost ($) 61,620 61,620 61,620 61,620 Total Capital Cost ($) 61,620 61,620 61,620 61,620 Year 1 Electric Cost ($) 6,100 6,100 6,157 6,157 Year 1 Demand Cost ($) 14,725 14,725 14,725 14,725 Year 1 Electric Savings ($) (8) (8) (65) (65) Year 1 Demand Savings ($) 489 489 489 489 Annual Resiliency Savings ($) - 1,826 - 20,073 LCC ($) 490,209 490,209 491,374 491,374 NPV ($) (51,731) (19,964) (52,896) 296,380 SPP (years) 128.15 26.72 145.38 3.01 Diesel Fuel Used (gallons) 6.50 6.50 47.20 47.20 Incentive Required to get to NPV=0 (%)
N/A N/A N/A N/A
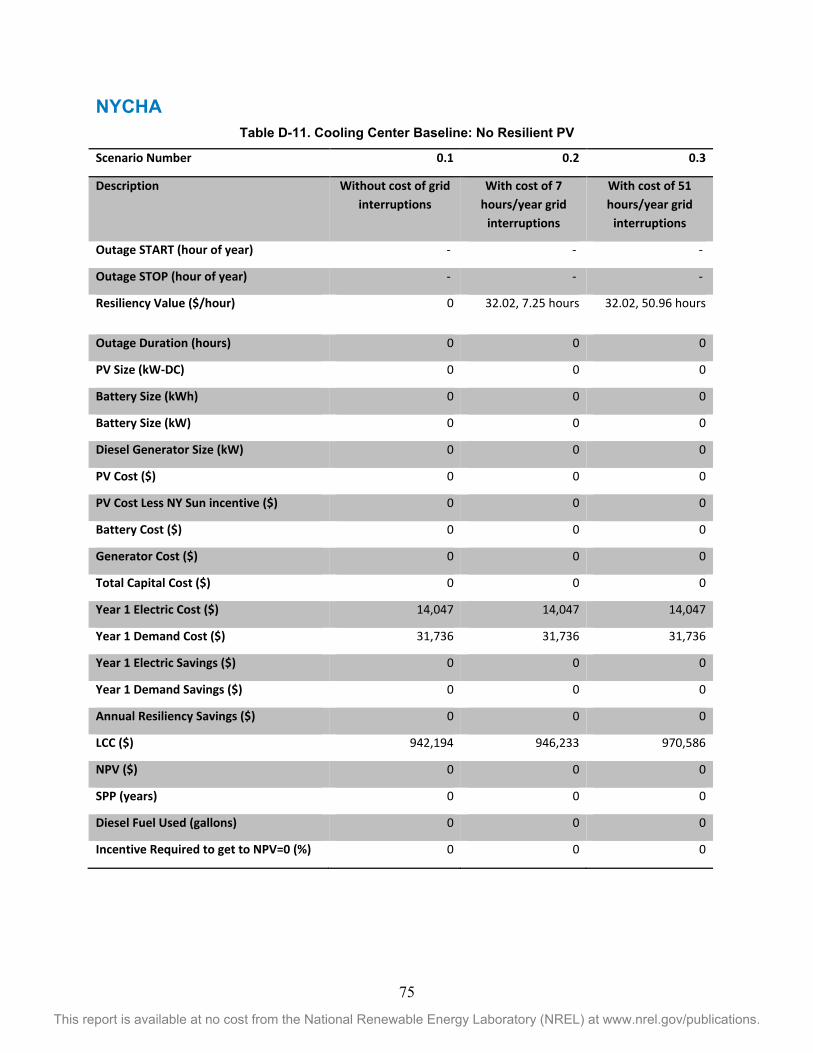
75
This report is available at no cost from the National Renewable Energy Laboratory (NREL) at www.nrel.gov/publications.
NYCHA Table D-11. Cooling Center Baseline: No Resilient PV
Scenario Number 0.1 0.2 0.3
Description Without cost of grid interruptions
With cost of 7 hours/year grid
interruptions
With cost of 51 hours/year grid
interruptions
Outage START (hour of year) - - -
Outage STOP (hour of year) - - -
Resiliency Value ($/hour) 0 32.02, 7.25 hours 32.02, 50.96 hours
Outage Duration (hours) 0 0 0
PV Size (kW-DC) 0 0 0
Battery Size (kWh) 0 0 0
Battery Size (kW) 0 0 0
Diesel Generator Size (kW) 0 0 0
PV Cost ($) 0 0 0
PV Cost Less NY Sun incentive ($) 0 0 0
Battery Cost ($) 0 0 0
Generator Cost ($) 0 0 0
Total Capital Cost ($) 0 0 0
Year 1 Electric Cost ($) 14,047 14,047 14,047
Year 1 Demand Cost ($) 31,736 31,736 31,736
Year 1 Electric Savings ($) 0 0 0
Year 1 Demand Savings ($) 0 0 0
Annual Resiliency Savings ($) 0 0 0
LCC ($) 942,194 946,233 970,586
NPV ($) 0 0 0
SPP (years) 0 0 0
Diesel Fuel Used (gallons) 0 0 0
Incentive Required to get to NPV=0 (%) 0 0 0
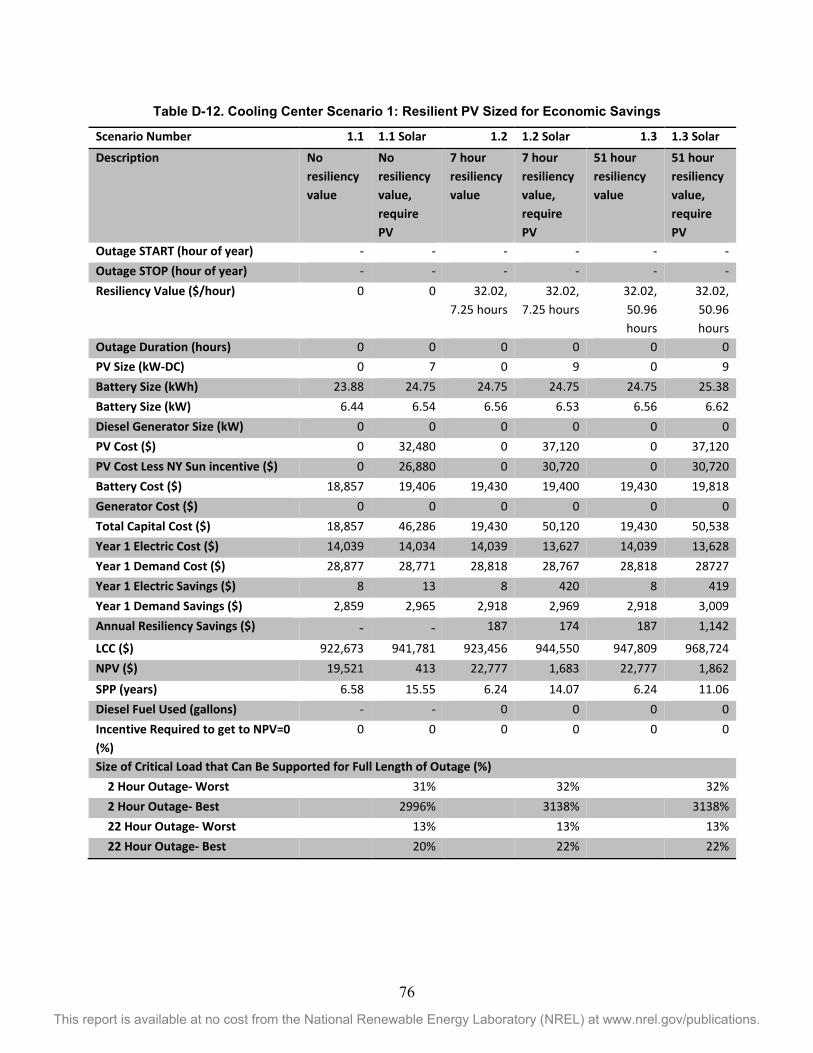
76
This report is available at no cost from the National Renewable Energy Laboratory (NREL) at www.nrel.gov/publications.
Table D-12. Cooling Center Scenario 1: Resilient PV Sized for Economic Savings
Scenario Number 1.1 1.1 Solar 1.2 1.2 Solar 1.3 1.3 Solar
Description No resiliency value
No resiliency value, require PV
7 hour resiliency value
7 hour resiliency value, require PV
51 hour resiliency value
51 hour resiliency value, require PV
Outage START (hour of year) - - - - - - Outage STOP (hour of year) - - - - - - Resiliency Value ($/hour) 0 0 32.02,
7.25 hours 32.02,
7.25 hours 32.02, 50.96 hours
32.02, 50.96 hours
Outage Duration (hours) 0 0 0 0 0 0 PV Size (kW-DC) 0 7 0 9 0 9 Battery Size (kWh) 23.88 24.75 24.75 24.75 24.75 25.38 Battery Size (kW) 6.44 6.54 6.56 6.53 6.56 6.62 Diesel Generator Size (kW) 0 0 0 0 0 0 PV Cost ($) 0 32,480 0 37,120 0 37,120 PV Cost Less NY Sun incentive ($) 0 26,880 0 30,720 0 30,720 Battery Cost ($) 18,857 19,406 19,430 19,400 19,430 19,818 Generator Cost ($) 0 0 0 0 0 0 Total Capital Cost ($) 18,857 46,286 19,430 50,120 19,430 50,538 Year 1 Electric Cost ($) 14,039 14,034 14,039 13,627 14,039 13,628 Year 1 Demand Cost ($) 28,877 28,771 28,818 28,767 28,818 28727 Year 1 Electric Savings ($) 8 13 8 420 8 419 Year 1 Demand Savings ($) 2,859 2,965 2,918 2,969 2,918 3,009 Annual Resiliency Savings ($) - - 187 174 187 1,142
LCC ($) 922,673 941,781 923,456 944,550 947,809 968,724 NPV ($) 19,521 413 22,777 1,683 22,777 1,862 SPP (years) 6.58 15.55 6.24 14.07 6.24 11.06 Diesel Fuel Used (gallons) - - 0 0 0 0 Incentive Required to get to NPV=0 (%)
0 0 0 0 0 0
Size of Critical Load that Can Be Supported for Full Length of Outage (%) 2 Hour Outage- Worst 31% 32% 32% 2 Hour Outage- Best 2996% 3138% 3138% 22 Hour Outage- Worst 13% 13% 13% 22 Hour Outage- Best 20% 22% 22%

77
This report is available at no cost from the National Renewable Energy Laboratory (NREL) at www.nrel.gov/publications.
Table D-13. Cooling Center Scenario 2: Resilient PV Sized to Meet Resiliency Needs
Scenario Number 2.1.a 2.1.b 2.2.a 2.2.b
Description 7 hour outage, no resiliency value
7 hour outage, with resiliency
value
51 hour outage, no resiliency
value
51 hour outage, with resiliency
value Outage START (hour of year) 5220 5220 5172 5172 Outage STOP (hour of year) 5226 5226 5222 5222 Resiliency Value ($/hour) 0 32.02 0 32.02
Outage Duration (hours) 7.25 7.25 50.96 50.96
PV Size (kW-DC) 2.27 2.27 9 9 Battery Size (kWh) 104.00 104.00 230.30 230.30 Battery Size (kW) 12.11 12.11 12.69 12.69 Diesel Generator Size (kW) 0 0 0 0 PV Cost ($) 10,533 10,533 41,760 41,760 PV Cost Less NY Sun incentive ($) 8,717 8,717 34,560 34,560 Battery Cost ($) 66,190 66,190 132,446 132,446 Generator Cost ($) 0 0 0 0 Total Capital Cost ($) 74,907 74,907 167,006 167,006 Year 1 Electric Cost ($) 13,893 13,893 13,399 13,399 Year 1 Demand Cost ($) 26,874 26,874 25,834 25,834 Year 1 Electric Savings ($) 154 154 648 648 Year 1 Demand Savings ($) 4,862 4,862 5,902 5,902 Annual Resiliency Savings ($) 0 232 0 1,632 LCC ($) 987,749 987,749 1,123,830 1,123,830 NPV ($) (45,555) (41,516) (181,636) (153,244) SPP (years) 14.94 13.26 25.50 15.17 Diesel Fuel Used (gallons) 0 0 0 0 Incentive Required to get to NPV=0 (%)
61% 55% 109% 92%
Note: We did not run separate “Solar” cases because solar is already part of the cost-optimal solutions.

78
This report is available at no cost from the National Renewable Energy Laboratory (NREL) at www.nrel.gov/publications.
Table D-14. Cooling Center Scenario 3: Resilient PV and Generator (Hybrid System) Sized to Meet Resiliency Needs
Scenario Number 3.1.a 3.1.b 3.1.b SOLAR
3.2.a 3.2.b 3.2.b SOLAR
Description 7 hour outage, no
resiliency value
7 hour outage,
with resiliency
value
7 hour outage, with
resiliency value,
require PV
51 hour outage,
no resiliency
value
51 hour outage,
with resiliency
value
51 hour outage,
with resiliency
value Outage START (hour of year) 5220 5220 5220 5172 5172 5172 Outage STOP (hour of year) 5226 5226 5226 5222 5222 5222 Resiliency Value ($/hour) 0 32.02 32.02 0 32.02 32.02
Outage Duration (hours) 7.25 7.25 7.25 50.96 50.96 50.96
PV Size (kW-DC) 0 0 2 0 0 9 Battery Size (kWh) 25.38 25.38 27.80 25.38 25.38 35.13 Battery Size (kW) 6.65 6.65 7.00 6.65 6.65 7.85 Diesel Generator Size (kW) 9.30 9.30 8.75 9.69 9.69 6.81 PV Cost ($) 0 0 9,280 0 0 41,760 PV Cost Less NY Sun incentive ($) 0 0 7,680 0 0 34,560 Battery Cost ($) 19,848 19,848 21,456 19,845 19,845 26,118 Generator Cost ($) 13,950 13,950 13,125 14,531 14,531 10,215 Total Capital Cost ($) 33,798 33,798 42,261 34,376 34,376 70,893 Year 1 Electric Cost ($) 14,034 14,034 13,927 13,967 13,967 13,467 Year 1 Demand Cost ($) 28,780 28,780 28,618 28,780 28,780 28,164 Year 1 Electric Savings ($) 13 13 120 80 80 580 Year 1 Demand Savings ($) 2,956 2,956 3,118 2,956 2,956 3,572 Annual Resiliency Savings ($) - 232 232 - 1,632 1,632 LCC ($) 941,764 934,415 946,233 941,186 942,942 961,257 NPV ($) 430 11,818 0.00 1,008 27,644 9,329 SPP (years) 11.39 9.38 12.18 11.32 7.37 12.26 Diesel Fuel Used (gallons) 7.75 7.75 7.47 41.28 18.11 30.22 Incentive Required to get to NPV=0 (%)
0% 0% 0% 0% 0% 0%
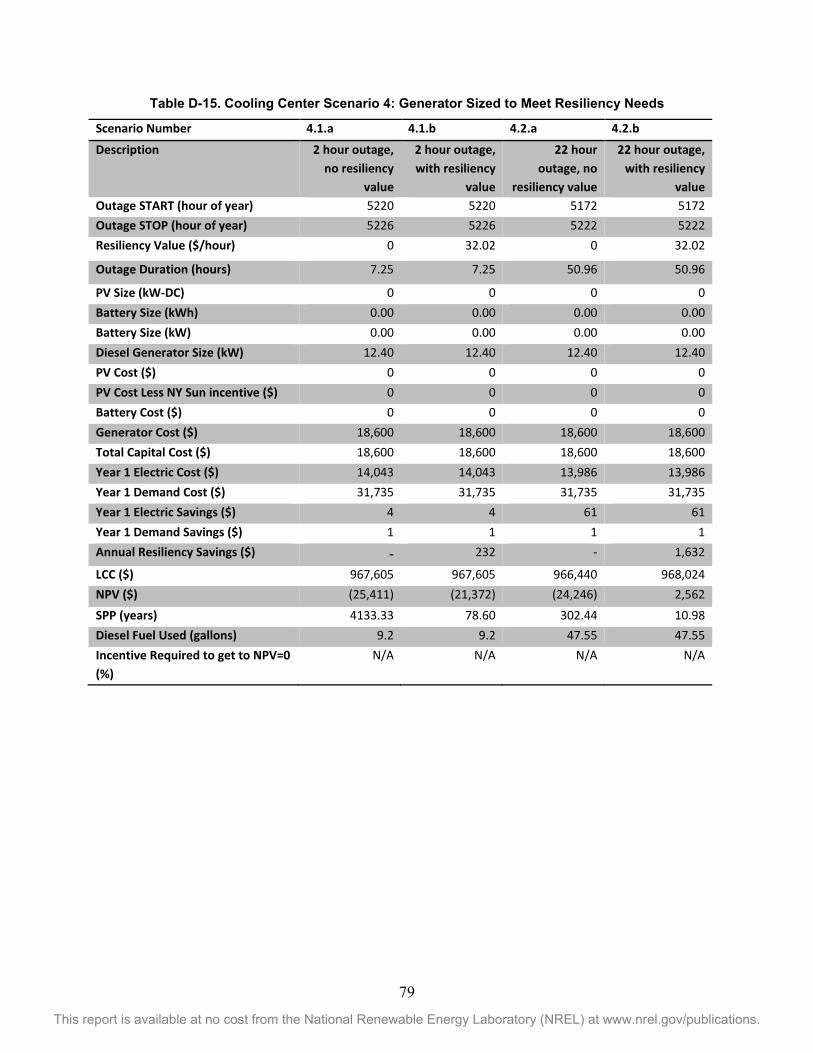
79
This report is available at no cost from the National Renewable Energy Laboratory (NREL) at www.nrel.gov/publications.
Table D-15. Cooling Center Scenario 4: Generator Sized to Meet Resiliency Needs
Scenario Number 4.1.a 4.1.b 4.2.a 4.2.b
Description 2 hour outage, no resiliency
value
2 hour outage, with resiliency
value
22 hour outage, no
resiliency value
22 hour outage, with resiliency
value Outage START (hour of year) 5220 5220 5172 5172 Outage STOP (hour of year) 5226 5226 5222 5222 Resiliency Value ($/hour) 0 32.02 0 32.02
Outage Duration (hours) 7.25 7.25 50.96 50.96
PV Size (kW-DC) 0 0 0 0 Battery Size (kWh) 0.00 0.00 0.00 0.00 Battery Size (kW) 0.00 0.00 0.00 0.00 Diesel Generator Size (kW) 12.40 12.40 12.40 12.40 PV Cost ($) 0 0 0 0 PV Cost Less NY Sun incentive ($) 0 0 0 0 Battery Cost ($) 0 0 0 0 Generator Cost ($) 18,600 18,600 18,600 18,600 Total Capital Cost ($) 18,600 18,600 18,600 18,600 Year 1 Electric Cost ($) 14,043 14,043 13,986 13,986 Year 1 Demand Cost ($) 31,735 31,735 31,735 31,735 Year 1 Electric Savings ($) 4 4 61 61 Year 1 Demand Savings ($) 1 1 1 1 Annual Resiliency Savings ($) - 232 - 1,632
LCC ($) 967,605 967,605 966,440 968,024 NPV ($) (25,411) (21,372) (24,246) 2,562 SPP (years) 4133.33 78.60 302.44 10.98 Diesel Fuel Used (gallons) 9.2 9.2 47.55 47.55 Incentive Required to get to NPV=0 (%)
N/A N/A N/A N/A