new york state ambient air quality report for 2019
TRANSCRIPT

NEW YORK STATE AMBIENT AIR QUALITY REPORT FOR 2019
New York State Ambient Air Monitoring Program
BUREAU OF AIR QUALITY SURVEILLANCE DIVISION OF AIR RESOURCES
NEW YORK STATE DEPARTMENT OF ENVIRONMENTAL CONSERVATION
625 Broadway Albany, NY 12233-3256 P: (518) 402-8508 | [email protected]
www.dec.ny.gov

Summary and background information This technical document is designed to provide summary information about the ambient air quality in New York State as it relates to the EPA’s National Ambient Air Quality Standards (NAAQS). The data here is provided in the same format at the EPA NAAQS, and as such may include information at air quality monitoring stations that have since been closed. In the footer of each page there is a key to assist in the interpretation of the data. Site numbers are the NYS internal site identifiers and are different than the AQS site numbers.
This document does not cover all pollutants measured, only those that have a NAAQS criteria. More information about the other programs for which the NYSDEC collects data, and more detailed information about the instrumentation currently available at individual site can be found in the Monitoring Network Plan.
For more information about the current and historic NAAQS, standards for regulatory action, health effects of individual pollutants, and more please go to the EPA’s Criteria Air Pollutants webpage.
Full datasets are available for download and review from the EPA Air Data webpage using the API.
For current Air Quality Index (AQI) Forecast and Current Observations for New York State, please go to the NYSDEC’s AQI webpage.
2019 Change Notes: 1. Site ID’s were updated to use the AQS site ID for ease of use instead of the NYSDEC internal site ID.
2. The direction of annual data was made consistent between pollutants.
3. AQS parameter information was added for ease of use.
4. Formatting changes for ease of reading.
File version: 11/12/2020
(Annual Means in parentheses are based on less than 75% available data) [Date of Occurrence, Hour]*Federal Ambient Air Quality Standard + Denotes a contravention of Federal AAQS

1111 1111
- I ' J :i
f I
1 {
L,
Department of Environmental Conservation
~
r'
l I L
'\. L
I J I
J ~ :1
/ ,, ?
~.J /
/
/
\ \ I
\- \ \ l
l
I \ 1 \ ' I
\
\ ~ T
\ \ I
I \ I ""'r \ r l I
/'1 \ ( / \ \ I I I ~ \, .. , C: \
r \ 7 I
/ \ I
J
New York State Department of Environmental Conservation Administrative Regions
56
9 8 7 4
3
2 1
±
0 15 30 60 90 120 Miles

National Ambient Air Quality Standards
Pollutant Primary/ Secondary
Averaging Time Level Form
Carbon Monoxide primary 8-hour 9 ppm
Not to be exceeded more than once per year 1-hour 35 ppm
Lead primary and secondary
Rolling 3-month average
0.15 µg/m3
(1) Not to be exceeded
Nitrogen Dioxide
primary 1-hour 100 ppb 98th percentile of 1-hour daily maximum concentrations, averaged over 3 years
primary and secondary
Annual 53 ppb (2) Annual Mean
Ozone primary and secondary
8-hour0.070 ppm (3)
Annual fourth-highest daily maximum 8-hr concentration, averaged over 3 years
Particle Pollution
PM2.5
primary
secondary
primary and secondary
primary and secondary
Annual 12 µg/m3 annual mean, averaged over 3 years
Annual 15 µg/m3 annual mean, averaged over 3 years
24-hour 35 µg/m3 98th percentile, averaged over 3 years
PM10 24-hour 150 µg/m3 Not to be exceeded more than once per year on average over 3 years
Sulfur Dioxide primary
secondary
1-hour 75 ppb (4) 99th percentile of 1-hour daily maximum concentrations, averaged over 3 years
3-hour 0.5 ppm Not to be exceeded more than once per year
(Annual Means in parentheses are based on less than 75% available data) [Date of Occurrence, Hour]*Federal Ambient Air Quality Standard + Denotes a contravention of Federal AAQS

Footnotes (1) Final rule signed October 15, 2008. The 1978 lead standard (1.5 µg/m3 as a quarterly average) remains in effect until one year after an area is
designated for the 2008 standard, except that in areas designated nonattainment for the 1978 year, the 1978 standard remains in effect until
implementation plans to attain or maintain the 2008 standard are approved.
(2) The official level of the annual NO2 standard is 0.053 ppm, equal to 53 ppb, which is shown here for the purpose of clearer comparison to the 1-
hour standard.
(3) Final rule signed October 1, 2015, and effective December 28, 2015. The previous (2008) O3 standards additionally remain in effect in some
areas. Revocation of the previous (2008) O3 standards and transitioning to the current (2015) standards will be addressed in the implementation rule
for the current standards.
(4) The previous SO2 standards (0.14 ppm 24-hour and 0.03 ppm annual/ 30 ppb) will additionally remain in effect in certain areas: (1) any area for
which it is not yet 1 year since the effective date of designation under the current (2010) standards, and (2) any area for which implementation plans
providing for attainment of the current (2010) standard have not been submitted and approved and which is designated nonattainment under the
previous SO2 standards or is not meeting the requirements of a SIP call under the previous SO2 standards (40 CFR 50.4(3)), A SIP call is an EPA
action requiring a state to resubmit all or part of its State Implementation Plan to demonstrate attainment of the require NAAQS.
(Annual Means in parentheses are based on less than 75% available data) [Date of Occurrence, Hour]*Federal Ambient Air Quality Standard + Denotes a contravention of Federal AAQS

--Department of Environmental Conservation
!.
Region 1 ±
Flax Pond !.
!.!.Eisenhower Pk
Babylon !.
Riverhead
Holtsville
0 4.75 9.5 19 28.5 38 Miles

I I I I I I I I I I I I
NYSDEC Region 1 SULFUR DIOXIDE - Continuous Pulsed Fluorescence
Parameter Code: 42401 Annual Averages 2009 through 2019
Annual Arithmetic Mean (ppb) - Primary Standard (12-month average not to exceed 30 PPB* (4))
Station Site No. 2009 2010 2011 2012 2013 2014 2015 2016 2017 2018 2019
Eisenhower Park 36-059-0005 3.45 2.09 1.97 (1.15) (1.12) 1.35 1.03 0.40 0.23 0.23 0.87
Holtsville 36-103-0009 3.81 3.95 2.22 (1.03) (1.20) 0.84 0.77 0.39 0.16 0.12 0.38
Holtsville site (5151-10) was operated by Suffolk County Health Dept. until 9/30/10, when NYSDEC commenced monitoring.
Comparison Between NYS Ambient Air Quality and Ambient Air Quality Standards for Calendar Year 2019
One Hour Averages average of 99th percentile for last 3 years not to exceed 75 PPB *
Observations 99th Percentile, PPB
Station Site No. Total Obs.
% Avail
2017 2018 3-yr
2019 Avg.
Eisenhower Park 36-059-0005 8,605 98 6.5 8.2 10.6 8.43
Holtsville 36-103-0009 8,161 93 3.7 2.5 3.2 3.13
(Annual Means in parentheses are based on less than 75% available data) [Date of Occurrence, Hour]*Federal Ambient Air Quality Standard + Denotes a contravention of Federal AAQS
II
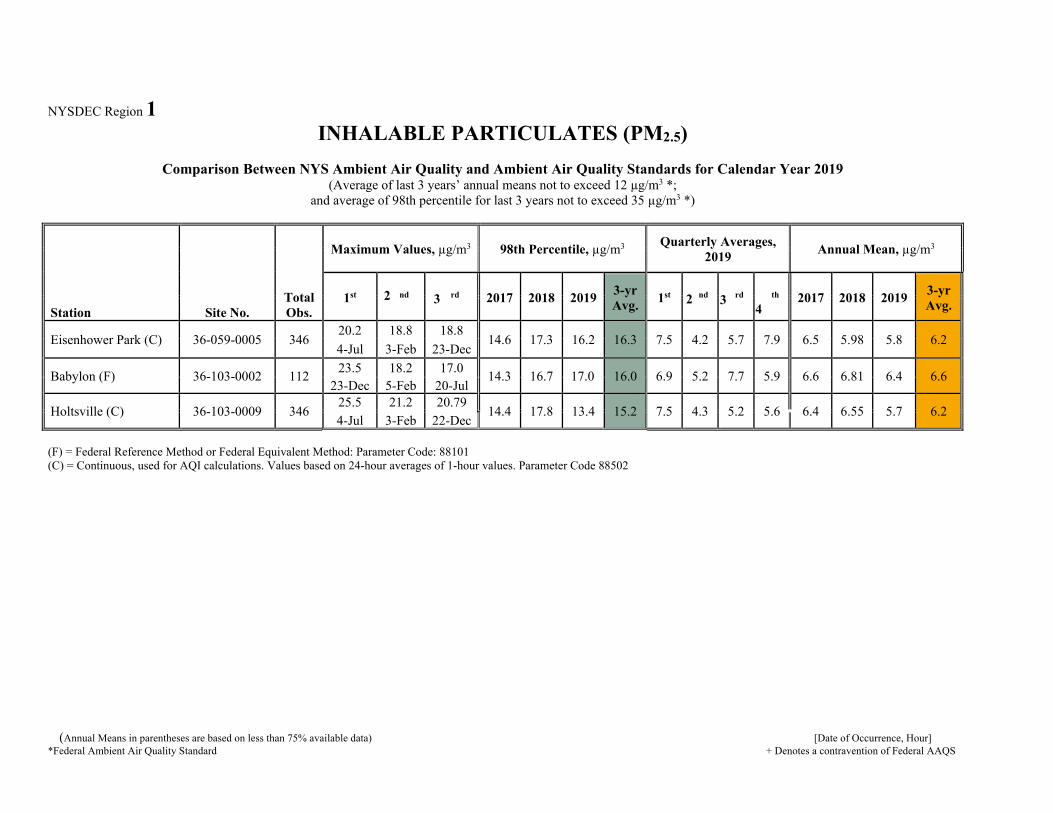
NYSDEC Region 1 INHALABLE PARTICULATES (PM2.5)
Comparison Between NYS Ambient Air Quality and Ambient Air Quality Standards for Calendar Year 2019 (Average of last 3 years’ annual means not to exceed 12 µg/m3 *;
and average of 98th percentile for last 3 years not to exceed 35 µg/m3 *)
Station Site No. Total Obs.
Maximum Values, µg/m3 98th Percentile, µg/m3 Quarterly Averages, 2019
Annual Mean, µg/m3
1st
2 nd
3 rd 2017 2018 2019 3-yrAvg.
1st 2 nd 3 rd
4th 2017 2018 2019
3-yrAvg.
Eisenhower Park (C) 36-059-0005 346 20.2
4-Jul
18.8
3-Feb
18.8
23-Dec14.6 17.3 16.2 16.3 7.5 4.2 5.7 7.9 6.5 5.98 5.8 6.2
Babylon (F) 36-103-0002 112 23.5
23-Dec18.2
5-Feb17.0
20-Jul14.3 16.7 17.0 16.0 6.9 5.2 7.7 5.9 6.6 6.81 6.4 6.6
Holtsville (C) 36-103-0009 346 25.5 4-Jul
21.2 3-Feb
20.79 22-Dec
14.4 17.8 13.4 15.2 7.5 4.3 5.2 5.6 6.4 6.55 5.7 6.2
(F) = Federal Reference Method or Federal Equivalent Method: Parameter Code: 88101(C) = Continuous, used for AQI calculations. Values based on 24-hour averages of 1-hour values. Parameter Code 88502
(Annual Means in parentheses are based on less than 75% available data) [Date of Occurrence, Hour]*Federal Ambient Air Quality Standard + Denotes a contravention of Federal AAQS
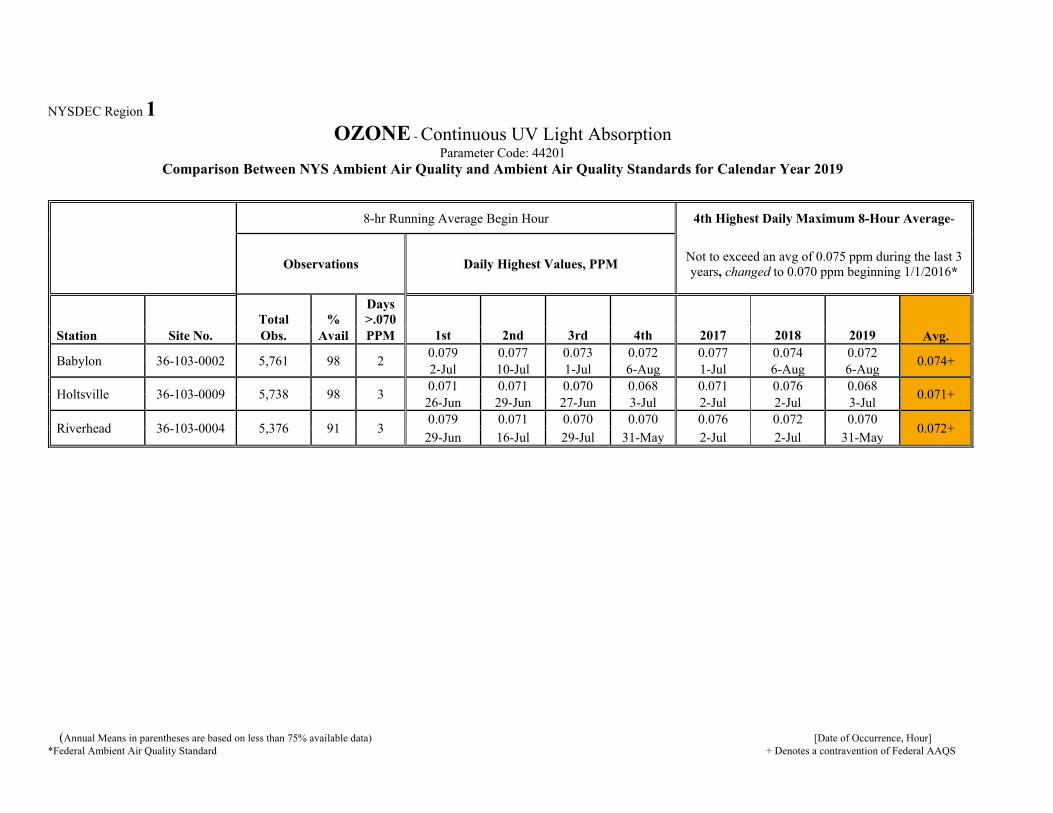
NYSDEC Region 1 OZONE - Continuous UV Light Absorption
Parameter Code: 44201 Comparison Between NYS Ambient Air Quality and Ambient Air Quality Standards for Calendar Year 2019
8-hr Running Average Begin Hour 4th Highest Daily Maximum 8-Hour Average-
Not to exceed an avg of 0.075 ppm during the last 3 years, changed to 0.070 ppm beginning 1/1/2016*
Observations Daily Highest Values, PPM
Station Site No. Total Obs.
% Avail
Days >.070 PPM 1st 2nd 3rd 4th 2017 2018 2019 Avg.
Babylon 36-103-0002 5,761 98 2 0.079 2-Jul
0.077 10-Jul
0.073 1-Jul
0.072 6-Aug
0.077 1-Jul
0.074 6-Aug
0.072 6-Aug
0.074+
Holtsville 36-103-0009 5,738 98 3 0.071 26-Jun
0.071 29-Jun
0.070 27-Jun
0.068 3-Jul
0.071 2-Jul
0.076 2-Jul
0.068 3-Jul
0.071+
Riverhead 36-103-0004 5,376 91 3 0.07929-Jun
0.071 16-Jul
0.070 29-Jul
0.07031-May
0.076 2-Jul
0.072 2-Jul
0.070 31-May
0.072+
(Annual Means in parentheses are based on less than 75% available data) [Date of Occurrence, Hour]*Federal Ambient Air Quality Standard + Denotes a contravention of Federal AAQS
--STATE OF OPPORTUNITY
Department of Environmental Conservation
0
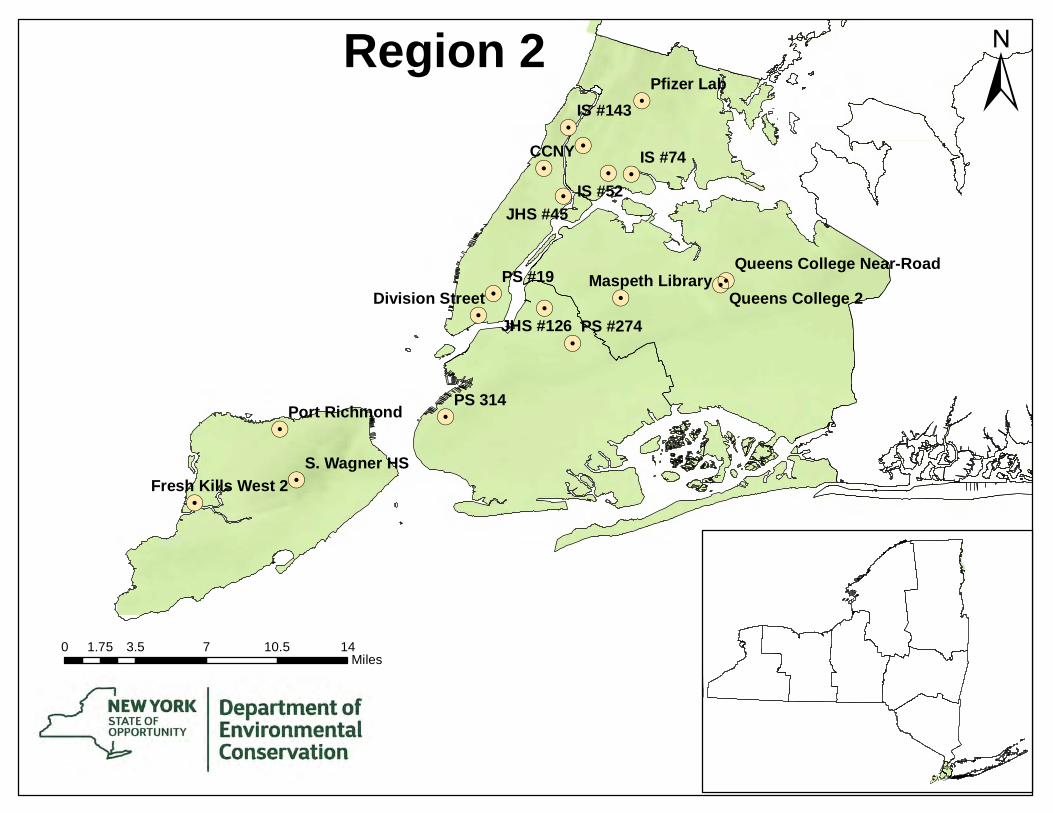
Region 2 ±Pfizer Lab
!.
Division S treet!.!.
PS #19 !.
IS #143
!.S #52
Maspeth L
!.
!.
!.
!. !.
CCNY
I IS #74
!.JHS #45
JHS #126 PS #274 !.
ibrary !!.. Queens College Near-Road
Queens Co ege 2 ll
Port Richmond PS 314 !.
!.
Fresh Kills Wes t S. Wagner HS
2!.!.
0 1.75 3.5 7 10.5 14 Miles

NYSDEC Region 2 SULFUR DIOXIDE - Continuous Pulsed Fluorescence
Parameter Code: 42401 Annual Averages 2009 through 2019
Annual Arithmetic Mean (ppb) - Primary Standard (12-month average not to exceed 30 PPB (4))
Station Site No. 2009 2010 2011 2012 2013 2014 2015 2016 2017 2018 2019
Botanical Garden (Harding Lab/Pfizer Lab)
36-005-0133 5.32 4.83 4.65 3.28 2.44 1.9 1.29 0.84 0.59 0.63 0.56
IS 52 36-005-0110 6.33 (6.22) xxx (2.1) 1.22 1.36 1.83 0.67 0.54 0.57 0.41
Queens College 36-081-0124 3.41 2.83 2.65 1.79 1.22 1.11 0.75 0.57 0.52 0.41 0.36
Sampling was suspended at 7094-07 on 06/24/10 due to building construction and resumed on 08/10/13. Sampling was suspended at 7093-10 in 2009
Comparison Between NYS Ambient Air Quality and Ambient Air Quality Standards for Calendar Year 2019
One Hour Averages average of 99th percentile for last 3 years not to exceed 75 PPB *
Observations 99th Percentile, PPB
Station Site No. Total
Obs.
%
Avail 2017 2018 2019
3-yr
Avg.
Botanical Garden (Harding Lab/Pfizer Lab)
36-005-0133 8,624 98 5.2 6.2 4.3 5.23
IS 52 36-005-0110 8,421 96 4.7 7.5 4.5 5.57
Queens College 2 36-081-0124 8,513 97 4.6 5.5 5.4 5.17
(Annual Means in parentheses are based on less than 75% available data) [Date of Occurrence, Hour]*Federal Ambient Air Quality Standard + Denotes a contravention of Federal AAQS
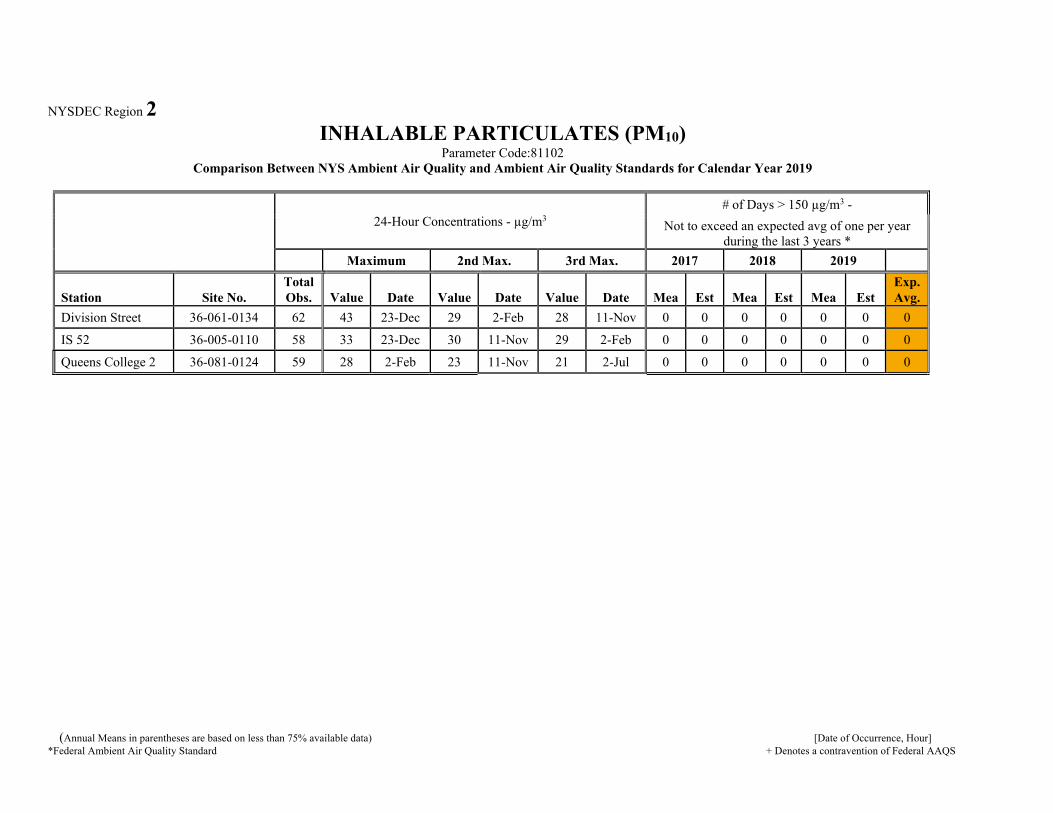
NYSDEC Region 2 INHALABLE PARTICULATES (PM10)
Parameter Code:81102 Comparison Between NYS Ambient Air Quality and Ambient Air Quality Standards for Calendar Year 2019
24-Hour Concentrations - µg/m3
# of Days > 150 µg/m3 -
Not to exceed an expected avg of one per year during the last 3 years *
Maximum 2nd Max. 3rd Max. 2017 2018 2019
Station Site No. Total Obs. Value Date Value Date Value Date Mea Est Mea Est Mea
Exp. Est Avg.
Division Street 36-061-0134 62 43 23-Dec 29 2-Feb 28 11-Nov 0 0 0 0 0 0 0
IS 52 36-005-0110 58 33 23-Dec 30 11-Nov 29 2-Feb 0 0 0 0 0 0 0
Queens College 2 36-081-0124 59 28 2-Feb 23 11-Nov 21 2-Jul 0 0 0 0 0 0 0
(Annual Means in parentheses are based on less than 75% available data) [Date of Occurrence, Hour]*Federal Ambient Air Quality Standard + Denotes a contravention of Federal AAQS

NYSDEC Region 2 INHALABLE PARTICULATES (PM2.5)
(Manhattan Sites)
Comparison Between NYS Ambient Air Quality and Ambient Air Quality Standards for Calendar Year 2019
(Average of last 3 years’ annual means not to exceed 12 µg/m3 *; and average of 98th percentile for last 3 years not to exceed 35 µg/m3 *)
Station Site No.
Total Obs.
Maximum Values, µg/m3 98th Percentile, µg/m3 Quarterly Averages, 2019 Annual Mean, µg/m3
1st
2nd
3rd 2017 2018 2019
3-yrAvg.
1st 2 nd3
rd 4
th 2017 2018 2019 3-yrAvg.
JHS 45 (F) 36-061-0079 120 18.9
23-Dec
18.7 2-Feb
18.7 11-Nov
16.5 19.7 18.7 18.3 7.7 6.4 7.8 6.7 7.4 8.1 7.2 7.5
IS 143 (C) 36-061-0115 343 22.24-Jul
19.4 4-Feb
19.3 3-Feb
17.1 19.3 17.5 17.9 9.5 5.2 6.5 7.2 8.5 7.8 7.1 7.8
PS 19 (C)* 36-061-0128 185 20.04-Jul
18.3 2-Jan
17.6 15-Feb
16.5 27.0 17.6 20.3 9.5 6.3 9.0 xx 9.1 10.4 8.3 9.2
PS 19 (F)* 36-061-0128 64 20.9
2-Feb19.6
18-Jan19.0
1-Mar 22.7 27.0 19.6 23.1 9.4 7.6 9.5 xx 9.1 10.4 8.8 8.5
Division St (F) 36-061-0134 121 21.7
5-Feb 20.2
2-Feb19.5
18-Jan17.9 21.6 19.5 19.7 9.6 8.1 9.4 7.3 8.8 9.6 8.6 9.0
Division St (C) 36-061-0134 348 25.14-Jul
18.9 23-Dec
18.3 3-Feb
15.8 18.3 17.1 17.0 8.2 5.4 7.3 6.7 7.1 6.8 6.9 6.9
CCNY (C) 36-061-0135 342 17.9
3-Feb
17.9
3-Jul
17.2
4-Feb15.3 18.9 16.2 16.8 8.0 5.9 6.0 6.4 7.7 8 6.6 7.4
(F) = Federal Reference Method or Federal Equivalent Method: Parameter Code: 88101(C) = Continuous, used for AQI calculations. Values based on 24-hour averages of 1-hour values. Parameter Code 88502* Sampling stopped at PS19 due to roof work in 2019
(Annual Means in parentheses are based on less than 75% available data) [Date of Occurrence, Hour]*Federal Ambient Air Quality Standard + Denotes a contravention of Federal AAQS

NYSDEC Region 2
(Bronx & Brooklyn Sites) INHALABLE PARTICULATES (PM2.5)
Comparison Between NYS Ambient Air Quality and Ambient Air Quality Standards for Calendar Year 2019 (Average of last 3 years’ annual means not to exceed 12 µg/m3 *;
and average of 98th percentile for last 3 years not to exceed 35 µg/m3 *)
Station Site No. Total Obs.
Maximum Values, µg/m3 98th Percentile, µg/m3 Quarterly Averages, 2019
Annual Mean, µg/m3
1st
2
nd rd 2017 2018 2019 3-yr
1st 2nd 3rd 4th 2017 2018 2019 3-yr
Avg. Avg.
Morrisania (C) 36005-0080 354 23.9 18.5 17.8
14 18.7 16.1 16.2 8.5 4.9 6.0 6.2 6.7 7.2 6.4 6.7 4- Jul
2
4-Feb
3
3-Feb
IS 52 (F) 36-005-0110 120 20.9 19.4 19.0
16.4 19.3 19.4 18.4 8.2 6.7 8.0 6.6 7.2 8 7.4 7.5 5-Feb 2-Feb 11-Nov
IS 52 (C) 36-005-0110 363 33.1 31.1 27.3
18.1 18.5 21.5 19.3 9.1 7.7 9.3 8.2 6.2 8.6 8.6 7.8 22-Dec 3-Feb 4-Feb
IS 74 (C) 36-005-0112 348 22.8 21.8 20.8
14.4 17.4 16.6 16.1 8.0 4.8 6.6 6.6 6.6 6.9 6.5 6.6 4-Feb 4-Jul 5-Feb
Botanical Gdn -Pfizer (F)
36-005-0133 121 20.7 20.2 19.2
18.7 21.5 19.2 19.8 8.0 5.9 7.6 6.5 8 8.3 7 7.7 5-Feb 23-Dec 2-Feb
PS 314 (C) 36-047-0052 345 18.5 17.6 16.9
14.9 16.1 15.6 15.5 7.2 4.6 6.1 6.6 6.3 6.2 6.1 6.2 30-Jul 4-Feb 3-Feb
JHS 126 (F) 36-047-0122 118 23.4 19.2 18.4
17.2 17.9 18.4 17.8 8.2 6.9 8.3 7.0 7.5 7.9 7.6 7.6 23-Dec 2-Feb 14-Aug
PS 274 (C) 36-047-0118 347 19.3 17.7 17.4
14.5 17.2 15.3 15.6 7.2 4.6 6.1 6.6 6.5 6.4 6.1 6.3 4-Jul 23-Dec 14-Aug
(F) = Federal Reference Method or Federal Equivalent Method: Parameter Code: 88101(C) = Continuous, used for AQI calculations. Values based on 24-hour averages of 1-hour values. Parameter Code 88502
(Annual Means in parentheses are based on less than 75% available data) [Date of Occurrence, Hour]*Federal Ambient Air Quality Standard + Denotes a contravention of Federal AAQS
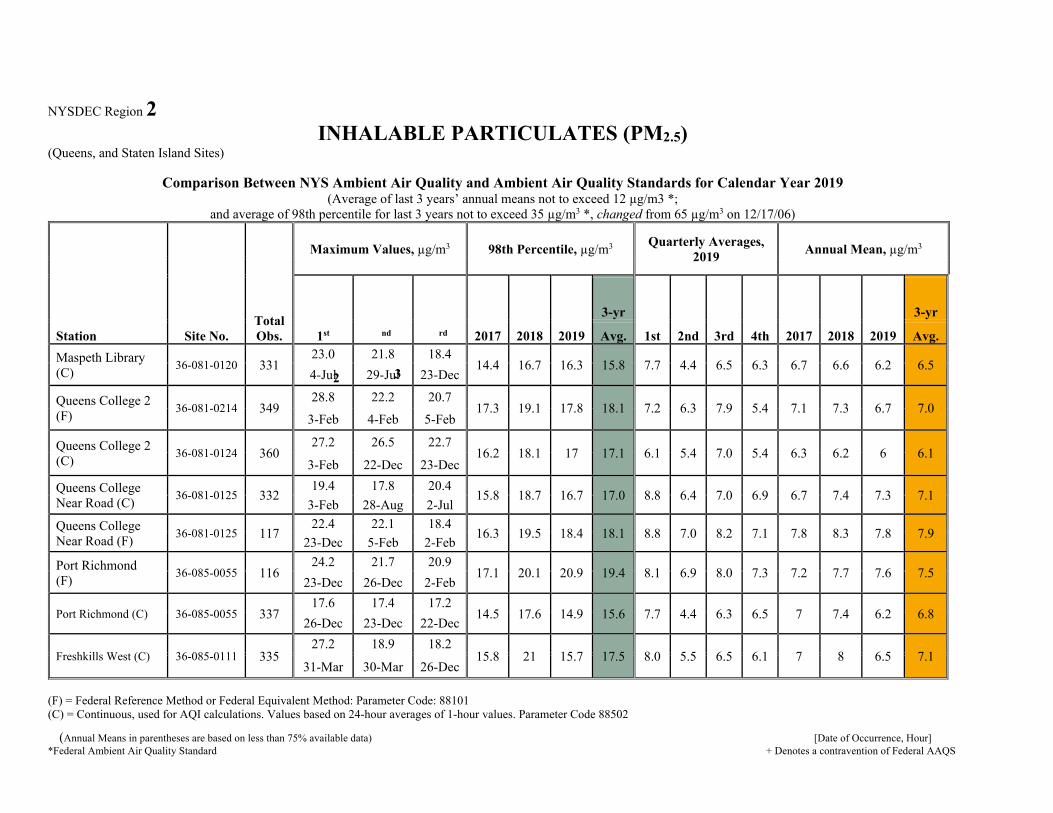
NYSDEC Region 2 INHALABLE PARTICULATES (PM2.5)
(Queens, and Staten Island Sites)
Comparison Between NYS Ambient Air Quality and Ambient Air Quality Standards for Calendar Year 2019 (Average of last 3 years’ annual means not to exceed 12 µg/m3 *;
and average of 98th percentile for last 3 years not to exceed 35 µg/m3 *, changed from 65 µg/m3 on 12/17/06)
Station Site No. Total Obs.
Maximum Values, µg/m3 98th Percentile, µg/m3 Quarterly Averages, 2019
Annual Mean, µg/m3
1st
2
nd
3
rd 2017 2018 2019
3-yr
Avg. 1st 2nd 3rd 4th 2017 2018 2019
3-yr
Avg.
Maspeth Library (C) 36-081-0120 331
23.0
4-Jul
21.8
29-Jul
18.4
23-Dec14.4 16.7 16.3 15.8 7.7 4.4 6.5 6.3 6.7 6.6 6.2 6.5
Queens College 2 (F) 36-081-0214 349
28.8
3-Feb
22.2
4-Feb
20.7
5-Feb17.3 19.1 17.8 18.1 7.2 6.3 7.9 5.4 7.1 7.3 6.7 7.0
Queens College 2 (C) 36-081-0124 360
27.2
3-Feb
26.5
22-Dec
22.7
23-Dec16.2 18.1 17 17.1 6.1 5.4 7.0 5.4 6.3 6.2 6 6.1
Queens College Near Road (C) 36-081-0125 332
19.4
3-Feb
17.8
28-Aug
20.4
2-Jul15.8 18.7 16.7 17.0 8.8 6.4 7.0 6.9 6.7 7.4 7.3 7.1
Queens College Near Road (F) 36-081-0125 117
22.4
23-Dec
22.1
5-Feb
18.4
2-Feb16.3 19.5 18.4 18.1 8.8 7.0 8.2 7.1 7.8 8.3 7.8 7.9
Port Richmond (F) 36-085-0055 116
24.2
23-Dec
21.7
26-Dec
20.9
2-Feb17.1 20.1 20.9 19.4 8.1 6.9 8.0 7.3 7.2 7.7 7.6 7.5
Port Richmond (C) 36-085-0055 337 17.6
26-Dec
17.4
23-Dec
17.2
22-Dec14.5 17.6 14.9 15.6 7.7 4.4 6.3 6.5 7 7.4 6.2 6.8
Freshkills West (C) 36-085-0111 335 27.2
31-Mar
18.9
30-Mar
18.2
26-Dec15.8 21 15.7 17.5 8.0 5.5 6.5 6.1 7 8 6.5 7.1
(F) = Federal Reference Method or Federal Equivalent Method: Parameter Code: 88101(C) = Continuous, used for AQI calculations. Values based on 24-hour averages of 1-hour values. Parameter Code 88502
(Annual Means in parentheses are based on less than 75% available data) [Date of Occurrence, Hour]*Federal Ambient Air Quality Standard + Denotes a contravention of Federal AAQS

NYSDEC Region 2 CARBON MONOXIDE - Continuous Gas Filter Correlation
Parameter Code: 42101 Comparison Between NYS Ambient Air Quality and Ambient Air Quality Standards for Calendar Year 2019
One-Hour Average
Maximum not to exceed 35 PPM more than once per calendar year *
Running 8-Hour Average (Non-Overlapping)
Maximum not to exceed 9 PPM more than once per calendar year *
Observations Highest Values, PPM Observations Highest Values, PPM
Station Site No.
Total
Obs.
%
Avail
>35
1st 2nd 3rd Total
>9
PPM 1st 2nd
Days>
PPM 9 PPM
CCNY 36-061-0135 8,509 97 0 1.87
[01/29:11] 1.68
[01/29:06] 1.68
[12/23:09] 8,681 0
1.3 [12/23:09]
1.1 [03/30:03]
0
Botanical Gardens (Pfizer Lab)
36-005-0133 8,649 99 0 1.94
[11/27:03]
1.93
[11/27:02]
1.78
[10/25:07] 8,684 0
1.50
[11/27:06]
1.30
[02/05:08] 0
Queens College 2 36-081-0124 8,519 97 0 1.51
[02/05:06]
1.48
[02/04:09
1.34
[11/04:06] 8,506 0
1.1
[02/04:11]
1.10
[02/05:09] 0
Queens College Near Road
36-081-0125 8,153 93 0 2.85
[04/04:14]
1.72
[11/04:07]
1.66
[02/05:08] 8,005 0
1.3
[02/05:10]
1.1
[02/04:10] 0
(Annual Means in parentheses are based on less than 75% available data) [Date of Occurrence, Hour]*Federal Ambient Air Quality Standard + Denotes a contravention of Federal AAQS

NYSDEC Region 2 OZONE - Continuous UV Light Absorption
(Bronx, Brooklyn, and Staten Island Sites) Parameter Code: 44201
Comparison Between NYS Ambient Air Quality and Ambient Air Quality Standards for Calendar Year 2019
8-hr Running Average Begin Hour 4th Highest Daily Maximum 8-Hour Average-
Not to exceed an avg of 0.075 ppm during the last 3 years, changed to 0.070 ppm beginning
1/1/2016* Observations Daily Highest Values, PPM
Station Site No.
Total
Obs.
%
Avail
Days >.070 PPM 1st 2nd 3rd 4th 2017 2018 2019 Avg.
Botanical Garden (Pfizer Lab)
36-005-0133 5,797 99 1 0.075
28-Jun
0.070
16-Jul
0.069
4-Jul
0.068
17-Jul
0.069
13-Jun
0.077
6-Aug
0.068
17-Jul0.071+
IS 52 36-005-0110 5,774 98 3 0.075
28-Jun
0.072
16-Jul
0.071
17-Jul
0.069
29-Jun
0.069
18-May
0.071
18-Jun
0.069
29-Jun0.069
Freshkills West 36-085-0111 5,724 97 0 0.069
10-Jul
0.069
16-Jun
0.067
17-Jul
0.065
3-Jul
xx
xx
0.077
1-Jul
0.065
3-Julxx
Susan Wagner 36-085-0067 0 0 xx
xx
xx
xx
xx
xx
xx
xx
0.072
13-Jun
xx
xx
xx
xx xx
Sampling was suspended at 7094-01 from in 2018 due to building construction
(Annual Means in parentheses are based on less than 75% available data) [Date of Occurrence, Hour]*Federal Ambient Air Quality Standard + Denotes a contravention of Federal AAQS

NYSDEC Region 2 OZONE - Continuous UV Light Absorption
(Manhattan and Queens Sites) Parameter: 44201
Comparison Between NYS Ambient Air Quality and Ambient Air Quality Standards for Calendar Year 2019
8-hr Running Average Begin Hour 4th Highest Daily Maximum 8-Hour Average-
Not to exceed an avg of 0.075 ppm during the last 3 years, changed to 0.070 ppm beginning 1/1/2016*
Observations Daily Highest Values, PPM
Station Site No.
Total
Obs.
%
Avail
Days >.070 PPM 1st 2nd 3rd 4th 2017 2018 2019 Avg.
CCNY 36-061-0135 5,768 98 20.081
28-Jun
0.071
17-Jul
0.067
16-Jul
0.066
3-Jul
0.070
10-Jul
0.077
1-Jul
0.066
3-Jul0.071+
Queens College 36-081-0124 8,612 98 4 0.076
3-Jul
0.072
29-Jun
0.072
16-Jul
0.071
29-Jul
0.079
10-Jul
0.073
25-May
0.071
29-Jul0.074+
(Annual Means in parentheses are based on less than 75% available data) *New York and Federal Ambient Air Quality Standard + Denotes a contravention of NYS/Federal AAQS

NYSDEC Region 2 NITROGEN DIOXIDE - Continuous Chemiluminescence
Parameter:42602 Annual Averages 2009 through 2019
Annual Arithmetic Mean (PPB) - Primary Standard (12-month average not to exceed 53 PPB *)
Station Site No. 2009 2010 2011 2012 2013 2014 2015 2016 2017 2018 2019
Botanical Garden
(Harding Lab/Pfizer Lab)
36-005-0133
/7094-0621.85 20.1 20.86 18.6 18.37 17.2 17.16 15.59 14.91 14.44 12.81
IS 52 36-005-0110 24.57 -24.94 xxx -20.8 20.67 19.88 20.13 18.27 17.3 17.46 16.87
Queens College 36-081-0124 20.91 19.28 (21.62) 17.5 17.5 16.75 17.16 15.81 15.25 14.44 14.18
Queens College Near-Road 36-081-0125 --
-- -- -- -- -- -- --
(16.29) 16.44 16.84
Sampling was terminated at 7093-10 on 06/30/08. Sampling was suspended at 7094-07 on 06/24/10 due to building construction, and resumed on 08/10/13.
Comparison Between NYS Ambient Air Quality and Ambient Air Quality Standards for Calendar Year 2019
One-Hour Averages - average of 98th percentile for last 3 years not to exceed 75 PPB *
Observations 98th Percentile, PPB Highest Values, PPB
Station Site No. Total
%
Avail 2017 2018 2019 3-yravg. 1st 2nd 3rd
Botanical Gardens -Pfizer Lab
36-005-0133 7,897 99 56.0 53.9 50.4 53.4 61.4
[02/04:11]59.1
[02/04:07] 54.1
[02/04:10]
IS 52 36-005-0110 7,673 91 59.4 59.3 57.7 58.8 67.2
[10/25:12]
66.3
[10/25:08]
65.5
[11/26:07]
Queens College 36-081-0124 8,512 97 58.5 53.1 53.9 55.1 61.0
[02/04:07]60.4
[02/04:09] 59.8
[03/30:00] Queens College Near-Road
36-081-0125 8,366 94 (54.4) 53.5 51.0 --59.3
[03/08:0759.2
[03/08:06] 58.9
[05/17:20]
(Annual Means in parentheses are based on less than 75% available data) *New York and Federal Ambient Air Quality Standard + Denotes a contravention of NYS/Federal AAQS

NYSDEC Region 2 LEAD –PM10 Samplers
Parameter: 85128 Comparison Between NYS Ambient Air Quality and Ambient Air Quality Standards for Calendar Year 2019
24-Hour Concentrations - µg/m3
THREE MONTH ROLLING AVERAGES
Maximum not to exceed 0.15 µg/m3, effective beginning 1/1/13
Maximum 2nd Max. 3rd Max. Highest Values, µg/m3
Station Site No.
Total Obs.
% Avail Value Date Value Date Value Date 2017 2018 2019
IS 52 36-005-0110 56 92 0.0082 1-Feb 0.006 14-Apr 0.0049 27-Mar 0.0041 0.0033 0.0027
(Annual Means in parentheses are based on less than 75% available data) *New York and Federal Ambient Air Quality Standard + Denotes a contravention of NYS/Federal AAQS
1111 1111
Department of Environmental Conservation
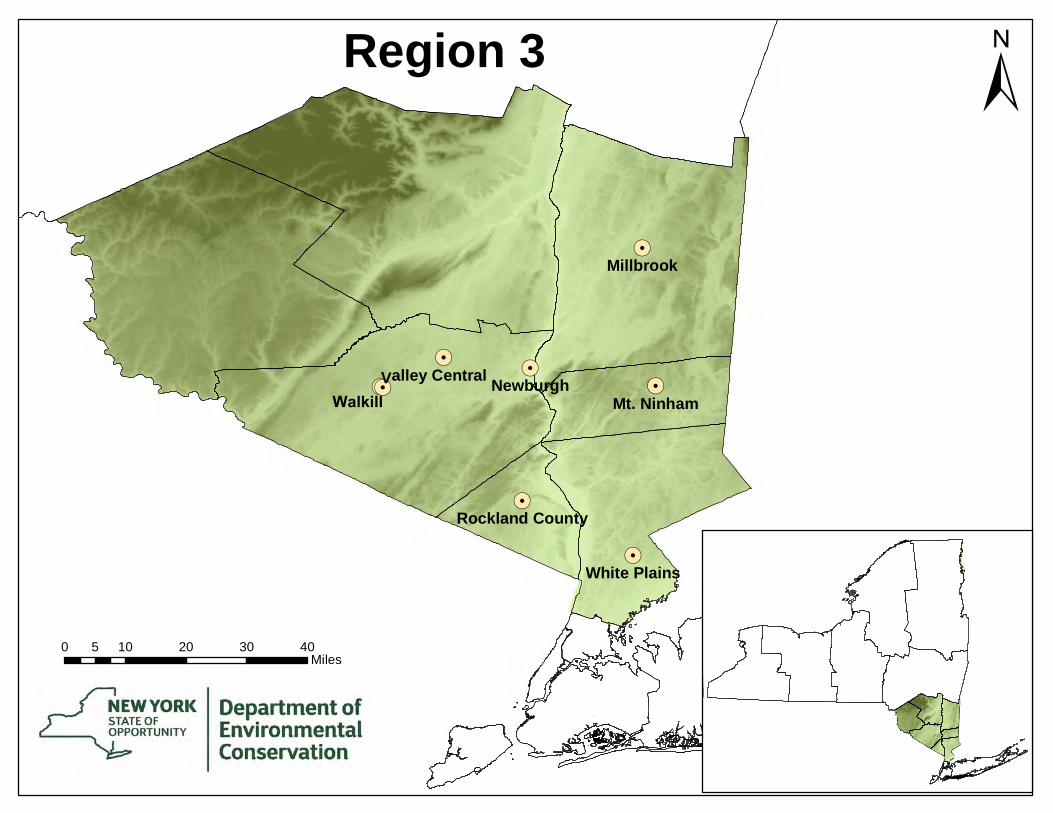
!.!a ey Cen
.V Newburgh
Walkill
and County
!.
!.
!.ll tral
Rockl
Whi
brook
!.Mt. Ninham
!.
te P!.
Region 3 ±
Mill
lains
0 5 10 20 30 40 Miles

NYSDEC Region 3 SULFUR DIOXIDE - Continuous Pulsed Fluorescence
Parameter: 42401 Annual Averages 2009 through 2019
Annual Arithmetic Mean (ppb) - Primary Standard (12-month average not to exceed 30 PPB* (4))
Station Site No. 2009 2010 2011 2012 2013 2014 2015 2016 2017 2018 2019
Mt. Ninham 36-079-0005 1.14 0.8 0.86 0.73 0.72 0.63 0.59 0.23 0.22 0.11 0.13
Millbrook 36-027-0007 xx xx -0.97 1.42 2.45 0.65 0.81 0.18 0.16 0.18 0.23
Belleayre Mtn. 5565-03 0.71 0.5 0.52 0.31 xxx xxx xxx xxx xxx xxx xxx
Sampling was suspended at 5565-03 in 2013
Comparison Between NYS Ambient Air Quality and Ambient Air Quality Standards for Calendar Year 2019
One Hour Averages
average of 99th percentile for last 3 years not to exceed 75 PPB *
Observations 99th Percentile, PPB
Station Site No. Total
Obs.
%
Avail 2017 2018 2019
3-yr
Avg.
Mt. Ninham 36-079-0005 8,622 98 5.9 3.4 1.5 3.60
Millbrook 36-027-0007 8,628 98 1.2 3.4 1.6 2.07
(Annual Means in parentheses are based on less than 75% available data) *New York and Federal Ambient Air Quality Standard + Denotes a contravention of NYS/Federal AAQS

NYSDEC Region 3 INHALABLE PARTICULATES (PM2.5)
Comparison Between NYS Ambient Air Quality and Ambient Air Quality Standards for Calendar Year 2019 (Average of last 3 years= annual means not to exceed 12 µg/m3 *;
and average of 98th percentile for last 3 years not to exceed 35 µg/m3 *, changed from 65 m3g/m3 on 12/17/06)
Station Site No.
Total
Obs.
Maximum Values, µg/m3 98th Percentile, µg/m3 Quarterly Averages, 2019
Annual Mean, µg/m3
1st
2
nd
3
rd 2017 2018 2019
3-yr
1st 2nd 3rd 4th 2017 2018 2019
3-yr
Avg. Avg.
Newburgh (F) 36-071-0002 118 18.8
5-Jul
17.5
2-Feb
14.5
15-Jan13.9 16.2 14.5 14.9 6.1 5.1 6.9 5.2 6 6.4 5.8 6.0
Newburgh (C) 36-071-0002 334 20.2
5-Jul
17.8
3-Feb
17.1
4-Feb16.4 19.3 15 16.9 7.6 4.3 6.1 6.0 6.2 6.3 5.5 6.0
Rockland Co. (C) 36-087-0005 327 17.2
5-Jul
16.6
3-Feb
16.3
30-Jul12.3 16.9 14.3 14.5 6.9 4.0 5.6 5.4 5.6 5.7 5.5 5.6
White Plains (C) 36-119-2004 329 17.8
3-Feb
15.4
22-Dec
14.9
4-Jul13 15.8 12.6 13.8 6.7 4.0 5.3 5.4 5.8 5.8 5.3 5.6
(F) = Federal Reference Method or Federal Equivalent Method: Parameter Code: 88101(C) = Continuous, used for AQI calculations. Values based on 24-hour averages of 1-hour values. Parameter Code 88502
(Annual Means in parentheses are based on less than 75% available data) *New York and Federal Ambient Air Quality Standard + Denotes a contravention of NYS/Federal AAQS
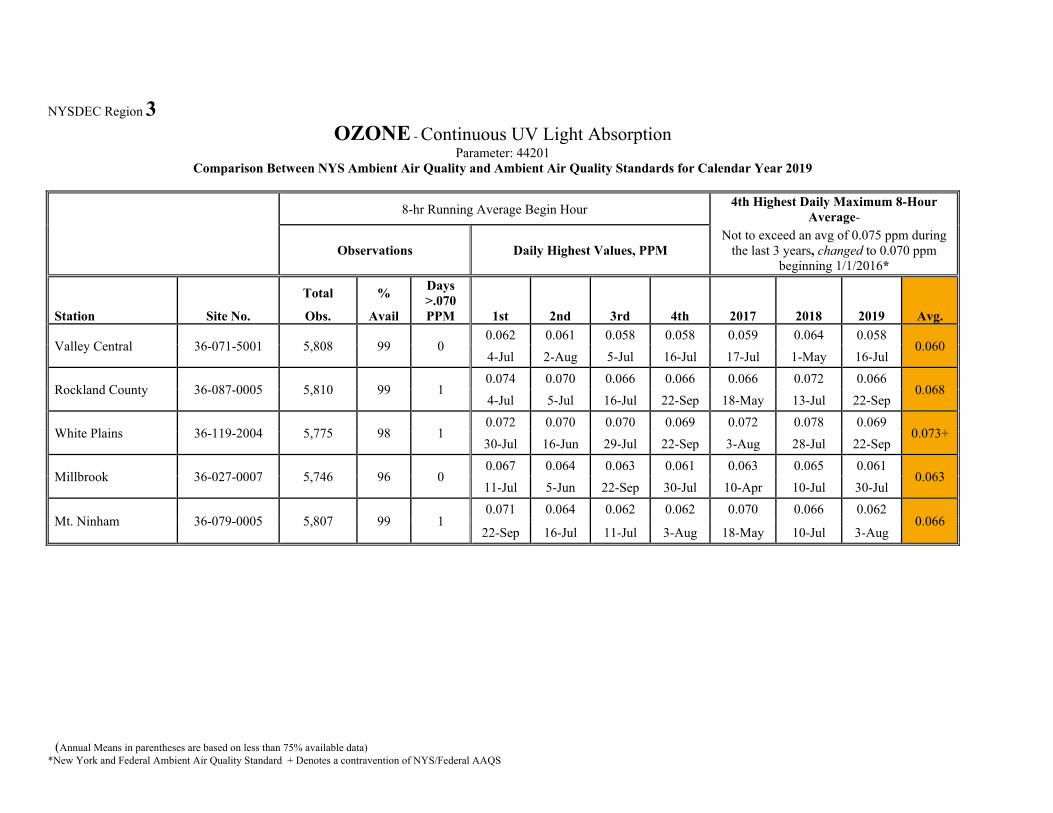
NYSDEC Region 3 OZONE - Continuous UV Light Absorption
Parameter: 44201 Comparison Between NYS Ambient Air Quality and Ambient Air Quality Standards for Calendar Year 2019
8-hr Running Average Begin Hour4th Highest Daily Maximum 8-Hour
Average-Not to exceed an avg of 0.075 ppm during
the last 3 years, changed to 0.070 ppm beginning 1/1/2016*
Observations Daily Highest Values, PPM
Station Site No.
Total
Obs.
%
Avail
Days >.070 PPM 1st 2nd 3rd 4th 2017 2018 2019 Avg.
0.060 Valley Central 36-071-5001 5,808 99 0 0.062
4-Jul
0.061
2-Aug
0.058
5-Jul
0.058
16-Jul
0.059
17-Jul
0.064
1-May
0.058
16-Jul
Rockland County 36-087-0005 5,810 99 1 0.074
4-Jul
0.070
5-Jul
0.066
16-Jul
0.066
22-Sep
0.066
18-May
0.072
13-Jul
0.066
22-Sep0.068
White Plains 36-119-2004 5,775 98 1 0.072
30-Jul
0.070
16-Jun
0.070
29-Jul
0.069
22-Sep
0.072
3-Aug
0.078
28-Jul
0.069
22-Sep0.073+
Millbrook 36-027-0007 5,746 96 00.067
11-Jul
0.064
5-Jun
0.063
22-Sep
0.061
30-Jul
0.063
10-Apr
0.065
10-Jul
0.061
30-Jul0.063
Mt. Ninham 36-079-0005 5,807 99 1 0.071
22-Sep
0.064
16-Jul
0.062
11-Jul
0.062
3-Aug
0.070
18-May
0.066
10-Jul
0.062
3-Aug0.066
(Annual Means in parentheses are based on less than 75% available data) *New York and Federal Ambient Air Quality Standard + Denotes a contravention of NYS/Federal AAQS

NYSDEC Region 3 LEAD - Low Volume Air Samplers
Parameter: 14128 Comparison Between NYS Ambient Air Quality and Ambient Air Quality Standards for Calendar Year 2019
24-Hour Concentrations - µg/m3
THREE MONTH ROLLING AVERAGES
Maximum not to exceed 0.15 µg/m3, effective beginning 1/1/13
Maximum 2nd Max. 3rd Max. Highest Values, µg/m3
Station Site No.
Total
Obs.
%
Avail Value Date Value Date Value Date 2017 2018 2019
Wallkill 36-071-3002 122 97 0.08 24-Oct 0.02 3-Jan 0.01 27-Oct 0.01 0.01 0.01
(Annual Means in parentheses are based on less than 75% available data) *New York and Federal Ambient Air Quality Standard + Denotes a contravention of NYS/Federal AAQS

!.!.!.
AlbanyLoudonville
of Environmental Conservation
0 5 10 20 30 40 Miles
Region 4 ±

NYSDEC Region 4 SULFUR DIOXIDE - Continuous Pulsed Fluorescence
Parameter: 42401 Annual Averages 2009 through 2019
Annual Arithmetic Mean (ppb) - Primary Standard (12-month average not to exceed 30 PPB * (4))
Station Site No. 2009 2010 2011 2012 2013 2014 2015 2016 2017 2018 2019
Loudonville 36-001-0012 3.85 2.33 1.92 0.97 2.03 1.6 1.3 0.36 0.37 0.36 0.17
Schenectady 4601-05 2.63 1.92 (2.18) xxx xxx xxx xxx xxx xxx xxx xxx
Grafton State Park 4153-04 1.52 1.12 1.13 (0.76) xxx xxx xxx xxx xxx xxx xxx
Sampling at 4601-05 and 4153-04 was terminated on 06/30/11 and 12/31/12, respectively.
Comparison Between NYS Ambient Air Quality and Ambient Air Quality Standards for Calendar Year 2019
One Hour Averages
average of 99th percentile for last 3 years not to exceed 75 PPB *
Observations 99th Percentile, PPB
Station Site No.Total
Obs.
%
Avail 2017 2018 2019
3-yr
Avg.
Loudonville 36-001-0012 8,537 97 3.7 2.1 3.4 3.07
(Annual Means in parentheses are based on less than 75% available data) *New York and Federal Ambient Air Quality Standard + Denotes a contravention of NYS/Federal AAQS

NYSDEC Region 4 INHALABLE PARTICULATES (PM2.5)
Comparison Between NYS Ambient Air Quality and Ambient Air Quality Standards for Calendar Year 2019 (Average of last 3 years annual means not to exceed 12 µg/m3 *
and average of 98th percentile for last 3 years not to exceed 35 µg/m3 *, changed from 65 m3g/m3 on 12/17/06)
Station Site No.
Total
Obs.
Maximum Values, µg/m3 98th Percentile, µg/m3 Quarterly Averages, 2019
Annual Mean, µg/m3
1st
2
nd
3
rd 2017 2018 2019
3-yr
1st 2nd 3rd 4th 2017 2018 2019
3-yr
Avg. Avg.
Albany Co. HD (F) 36-001-0005 120 19.6
23-Dec
17.5
15-Jan
17.3
2-Feb17.7 18.6 17.7 17.2 6.3 4.7 6.6 6.0 6.5 6 5.9 6.1
Albany Co. HD (C) 36-001-0005 364 31.5
3-Feb
30.0
22-Dec
28.4
15-Jan17 19.7 19.9 18.8 9.6 5.8 6.9 8.0 7.5 7.9 7.6 7.6
Loudonville (F) 36-001-0012 118 15.6
15-Jan
15.0
2-Feb
16.2
5-Jul13.6 16.2 13.4 14.4 5.3 4.4 6.1 4.5 5.8 5.8 5.1 5.5
(F) = Federal Reference Method or Federal Equivalent Method: Parameter Code: 88101(C) = Continuous, used for AQI calculations. Values based on 24-hour averages of 1-hour values. Parameter Code 88502
(Annual Means in parentheses are based on less than 75% available data) *New York and Federal Ambient Air Quality Standard + Denotes a contravention of NYS/Federal AAQS

NYSDEC Region 4 CARBON MONOXIDE - Continuous Gas Filter Correlation
Parameter: 42101 Comparison Between NYS Ambient Air Quality and Ambient Air Quality Standards for Calendar Year 2019
One-Hour Average
Maximum not to exceed 35 PPM more than once per calendar year *
Running 8-Hour Average (Non-Overlapping)
Maximum not to exceed 9 PPM more than once per calendar year *
Observations Highest Values, PPM Observations Highest Values, PPM
Station Site No.
Total
Obs.
%
Avail
>35
1st 2nd 3rd Total
>9
PPM 1st 2nd
Days>
PPM 9PPM
Loudonville 36-001-0012 8,125 93 0 1.5
[05/02:14]
0.9
[12/22:08]
0.9
[02/01:08] 8,066 0
0.7
[12/22:07]
0.6
[12/22:11] 0
(Annual Means in parentheses are based on less than 75% available data) *New York and Federal Ambient Air Quality Standard + Denotes a contravention of NYS/Federal AAQS

NYSDEC Region 4 OZONE - Continuous UV Light Absorption
Parameter: 44201 Comparison Between NYS Ambient Air Quality and Ambient Air Quality Standards for Calendar Year 2019
8-hr Running Average Begin Hour 4th Highest Daily Maximum 8-Hour Average-
Not to exceed an avg of 0.075 ppm during the last 3 years, changed to 0.070 ppm beginning
1/1/2016* Observations Daily Highest Values, PPM
Station Site No.
Total
Obs.
%
Avail
Days >.070 PPM 1st 2nd 3rd 4th 2017 2018 2019 Avg.
Loudonville 36-001-0012 5,778 98 00.062
5-Jul
0.059
5-Jun
0.059
28-Jun
0.056
19-May
0.061
17-May
0.064
2-May
0.056
19-May0.060
(Annual Means in parentheses are based on less than 75% available data) *New York and Federal Ambient Air Quality Standard + Denotes a contravention of NYS/Federal AAQS

Region 5 ±
!. !.
!.
!.
!.
Whiteface Base
Whiteface Summit
Stillwater
Paul Smiths
Piseco Lake
--Department of Environmental Conservation
0 5 10 20 30 40 Miles

NYSDEC Region 5 SULFUR DIOXIDE - Continuous Pulsed Fluorescence
Parameter: 42401 Annual Averages 2009 through 2019
Annual Arithmetic Mean (ppb) - Primary Standard (12-month average not to exceed 30 PPB * (4))
Station Site No. 2009 2010 2011 2012 2013 2014 2015 2016 2017 2018 2019
Whiteface Mtn. - Lodge 36-031-0003 0.64 0.72 0.73 0.61 0.36 0.38 0.47 0.26 0.18 0.18 0.13
Paul Smiths College 36-033-0004 0.6 0.57 0.67 0.5 -0.52 0.6 0.32 0.2 0.28 0.11 0.17
Piseco Lake 36-041-0005 0.44 0.34 0.32 0.14 0.17 0.21 0.16 0.05 0.03 0.03 0.05
Comparison Between NYS Ambient Air Quality and Ambient Air Quality Standards for Calendar Year 2019
One Hour Averages
average of 99th percentile for last 3 years not to exceed 75 PPB *
Observations 99th Percentile, PPB
Station Site No.Total
Obs.
%
Avail 2017 2018 2019
3-yr
Avg.
Whiteface Mtn. - Lodge 36-031-0003 8,425 96 1.5 1 0.9 1.13
Paul Smiths College 36-033-0004 8,463 97 1.2 1.1 1.1 1.13
Piseco Lake 36-041-0005 8,493 97 1 1 0.6 0.87
(Annual Means in parentheses are based on less than 75% available data) *New York and Federal Ambient Air Quality Standard + Denotes a contravention of NYS/Federal AAQS

NYSDEC Region 5 INHALABLE PARTICULATES (PM2.5)
Comparison Between NYS Ambient Air Quality and Ambient Air Quality Standards for Calendar Year 2019 (Average of last 3 years= annual means not to exceed 12 µg/m3 *;
and average of 98th percentile for last 3 years not to exceed 35 µg/m3 *, changed from 65 µg/m3 on 12/17/06)
Station Site No.
Total
Obs.
Maximum Values, µg/m3 98th Percentile, µg/m3 Quarterly Averages, 2019
Annual Mean, µg/m3
1st
2
nd
3
rd
2017 2018 2019
3-yr
1st 2nd 3rd 4th 2017 2018 2019
3-yr
Avg. Avg.
Whiteface Base (F) 36-031-0002 50 8.7
20-Jul
7.2
2-Jun
6.9
13-Aug11.7 12.5 8.7 11.0 2.7 2.8 3.8 1.8 3.7 3.4 2.8 3.3
Whiteface Base (C) 36-031-0002 306 12.1 3-Jul
10.7 4-Jul
10.3 28-Jul
9.9 10.3 8.7 9.6 3.1 2.8 4.3 2.5 3.6 3.6 3.2 3.4
(F) = Federal Reference Method or Federal Equivalent Method: Parameter Code: 88101(C) = Continuous, used for AQI calculations. Values based on 24-hour averages of 1-hour values. Parameter Code 88502
(Annual Means in parentheses are based on less than 75% available data) *New York and Federal Ambient Air Quality Standard + Denotes a contravention of NYS/Federal AAQS

NYSDEC Region 5 OZONE - Continuous UV Light Absorption
Parameter: 44201 Comparison Between NYS Ambient Air Quality and Ambient Air Quality Standards for Calendar Year 2019
8-hr Running Average Begin Hour 4th Highest Daily Maximum 8-Hour Average-
Not to exceed an avg of 0.075 ppm during the last 3 years, changed to 0.070 ppm beginning 1/1/2016*
Observations Daily Highest Values, PPM
Station Site No.
Total
Obs.
%
Avail
Days >.070
PPM 1st 2nd 3rd 4th 2016 2017 2019 Avg.
Stillwater 36-091-0004 5,736 98 00.057
5-Jul
0.056
25-May
0.054
5-Jun
0.054
26-Jun
0.060
17-May
0.067
26-May
0.054
26-Jun0.060
Whiteface Mtn. Summit 36-031-0002 5,815 99 0 0.064
5-Jun
0.063
30-Mar
0.062
19-Oct
0.061
28-Jun
0.066
12-Jun
0.066
1-May
0.061
28-Jun(0.064)
Whiteface Mtn. Base 36-031-0003 5,648 96 0 0.061
30-Mar
0.057
28-Mar
0.057
6-May
0.056
28-Jun
0.060
15-Apr
0.066
2-May
0.056
28-Jun0.060
Piseco Lake 36-041-0005 5,759 98 0 0.056
28-Jun
0.055
29-Jun
0.054
1-Jun
0.054
28-Jul
0.064
17-May
0.063
24-Apr
0.054
28-Jul0.060
Mt. Ninham 36-079-0005 5,807 99 1 0.071
22-Sep
0.064
16-Jul
0.062
11-Ju1
0.062
3-Aug
0.070
18-May
0.066
10-Jul
0.062
3-Aug0.066
(Annual Means in parentheses are based on less than 75% available data) *New York and Federal Ambient Air Quality Standard + Denotes a contravention of NYS/Federal AAQS

Perch River •
••c:::::::11-r:::::=---===:::::::i--
Department of Environmental Conservation
0 5 10 20 30 40 Miles
WYORK TEOF ORTUN ITY

I I I I I I I I I
NYSDEC Region 6 SULFUR DIOXIDE - Continuous Pulsed Fluorescence
Parameter: 42401 Annual Averages 2009 through 2019
Annual Arithmetic Mean (ppb) - Primary Standard (12-month average not to exceed 30 PPB * (4))
Station Site No. 2009 2010 2011 2012 2013 2014 2015 2016 2017 2018 2019
Alcoa West 36-089-0004 xxx xxx xxx xxx xxx xxx xxx xxx 5.16 4.00 4.01
Alcoa East 36-089-0005 xxx xxx xxx xxx xxx xxx xxx xxx 1.62 1.30 1.36
Nick’s Lake 36-043-0005 0.52 0.54 0.48 0.65 0.6 0.67 0.52 0.2 (0.16) 0.12 (0.28)
Comparison Between NYS Ambient Air Quality and Ambient Air Quality Standards for Calendar Year 2019
One Hour Averages
average of 99th percentile for last 3 years not to exceed 75 PPB *
Observations 99th Percentile, PPB
Station Site No.Total
Obs.
%
Avail 2017 2018 2019
3-yr
Avg.
Alcoa West 36-089-0004 8,706 98 90.5 86.5 82 86.3+
Alcoa East 36-089-0005 8,742 100 45.2 40.6 42 42.6
Nick’s Lake 36-043-0005 52.63 96 1.1 1.1 2.5 1.57
*Alcoa East and Alcoa West are source oriented monitors established in 2017 to comply with the Data Requirements Rule for the 2010 1-Hour Sulfur Dioxide PrimaryNational Ambient Air Quality Standard (80 FR 51052) that requires that NYSDEC provide data to characterize the 1-hour ambient air concentration of SO2 in areas nearthe Alcoa Massena West Aluminum Plant.
(Annual Means in parentheses are based on less than 75% available data) *New York and Federal Ambient Air Quality Standard + Denotes a contravention of NYS/Federal AAQS

NYSDEC Region 6 INHALABLE PARTICULATES (PM2.5)
Comparison Between NYS Ambient Air Quality and Ambient Air Quality Standards for Calendar Year 2019 (Average of last 3 years= annual means not to exceed 12 µg/m3 *;
and average of 98th percentile for last 3 years not to exceed 35 µg/m3 *, changed from 65 µg/m3 on 12/17/06)
Station Site No. Total
Obs.
Maximum Values, µg/m3 98th Percentile, µg/m3 Quarterly Averages, 2019
Annual Mean, µg/m3
1st
2
nd
3
rd 2017 2018 2019 3-yr
1st 2nd 3rd 4th 2017 2018 2019 3-yr
Avg. Avg.
Utica (C) 36-065-2001 326 16.3
22-Dec15.0
23-Dec 13.9
15-Jan14.1 14.2 12.8 13.7 7.1 3.4 4.3 4.8 5.4 5.4 4.9 5.2
(F) = Federal Reference Method or Federal Equivalent Method: Parameter Code: 88101(C) = Continuous, used for AQI calculations. Values based on 24-hour averages of 1-hour values. Parameter Code 88502
(Annual Means in parentheses are based on less than 75% available data) *New York and Federal Ambient Air Quality Standard + Denotes a contravention of NYS/Federal AAQS

NYSDEC Region 6 OZONE - Continuous UV Light Absorption
Parameter: 44201 Comparison Between NYS Ambient Air Quality and Ambient Air Quality Standards for Calendar Year 2019
8-hr Running Average Begin Hour4th Highest Daily Maximum 8-Hour
Average-
Not to exceed an avg of 0.075 ppm during the last 3 years, changed to 0.070 ppm beginning 1/1/2016*
Observations Daily Highest Values, PPM
Station Site No.
Total
Obs.
%
Avail
Days >.070
PPM 1st 2nd 3rd 4th 2017 2018 2019 Avg.
Nick’s Lake 36-043-0005 4,871 83 0 0.049
25-Jun
0.049
3-Aug
0.048
1-Jun
0.048
26-Jun
0.057
10-Jun
0.064
1-May
0.048
26-Jun(0.056)
Perch River 36-045-0002 3,721 93 2 0.05926-Jun
0.05927-Jun
0.05627-Jul
0.05629-Jul
0.06612-Jun
0.0682-May
0.056 29-Jul
0.063
Sampling stopped at 2167-03 in December 31st 2019 due to no power being available at the site
(Annual Means in parentheses are based on less than 75% available data) *New York and Federal Ambient Air Quality Standard + Denotes a contravention of NYS/Federal AAQS

--Department of Environmental Conservation
!.
Region 7 ±
Fulton
E. Syracuse!.
!. Cayuga East
0 5 10 20 30 40 Miles

NYSDEC Region 7 SULFUR DIOXIDE - Continuous Pulsed Fluorescence
Parameter: 42401 Annual Averages 2009 through 2019
Annual Arithmetic Mean (ppb) - Primary Standard (12-month average not to exceed 30 PPB * (4))
Station Site No. 2009 2010 2011 2012 2013 2014 2015 2016 2017 2018 2019
Camp Georgetown 2655-01 1.17 1.09 0.52 xxx xxx xxx xxx xxx xxx xxx xxx
Cayuga East* 36-109-0002 xxx xxx xxx xxx xxx xxx xxx xxx 0.34 0.09 -0.03
East Syracuse 36-067-1015 1.23 0.92 0.88 0.88 0.61 0.7 0.6 0.4 0.35 0.26 0.12
Sampling at 2655-01 was suspended on 04/02/2012 *Cayuga East is a source-oriented monitor established in 2017 to comply with the Data Requirements Rule for the 2010 1-Hour Sulfur Dioxide Primary National AmbientAir Quality Standard (80 FR 51052) that requires that NYSDEC provide data to characterize the 1-hour ambient air concentration of SO2 in areas near the CayugaOperating Company Power Plant.
Comparison Between NYS Ambient Air Quality and Ambient Air Quality Standards for Calendar Year 2019
One Hour Averages
average of 99th percentile for last 3 years not to exceed 75 PPB *
Observations 99th Percentile, PPB
Station Site No. Total
Obs.
%
Avail 2017 2018 2019
3-yr
Avg.
Cayuga East 36-109-0002 8,595 98 24.9 51.8 20.8 32.5
East Syracuse 36-067-1015 8,574 98 1.9 2.2 0.9 1.67
(Annual Means in parentheses are based on less than 75% available data) *New York and Federal Ambient Air Quality Standard + Denotes a contravention of NYS/Federal AAQS

NYSDEC Region 7 INHALABLE PARTICULATES (PM2.5)
Comparison Between NYS Ambient Air Quality and Ambient Air Quality Standards for Calendar Year 2019 (Average of last 3 years= annual means not to exceed 15 µg/m3*;
and average of 98th percentile for last 3 years not to exceed 35 µg/m3*, changed from 65 µg/m3 on 12/17/06)
Station Site No.
Total
Obs.
Maximum Values, µg/m3 98th Percentile, µg/m3 Quarterly Averages, 2019
Annual Mean, µg/m3
1st
2
nd
3
rd 2017 2018 2019
3-yr
1st 2nd 3rd 4th 2017 2018 2019
3-yr
Avg.Avg.
East Syracuse (C) 36-067-1015 355 19.2
7-Feb 17.6
3-Feb 16.9
22-Dec12.2 16.2 14.9 14.4 6.5 5.8 6.6 6.9 5.2 4.8 6.4 5.4
East Syracuse (F) 36-067-1015 120 15.8
15-Jan
12.7
12-Dec
12.6
2-Feb13 16.1 14.8 14.6 5.8 4.6 6.1 4.7 5.5 5.9 5.3 5.6
(F) = Federal Reference Method or Federal Equivalent Method: Parameter Code: 88101(C) = Continuous, used for AQI calculations. Values based on 24-hour averages of 1-hour values. Parameter Code 88502
(Annual Means in parentheses are based on less than 75% available data) *New York and Federal Ambient Air Quality Standard + Denotes a contravention of NYS/Federal AAQS

NYSDEC Region 7 OZONE - Continuous UV Light Absorption
Parameter:44201 Comparison Between NYS Ambient Air Quality and Ambient Air Quality Standards for Calendar Year 2019
8-hr Running Average Begin Hour 4th Highest Daily Maximum 8-Hour Average-
Not to exceed an avg of 0.075 ppm during the last 3 years, changed to 0.070 ppm beginning 1/1/2016*
Observations Daily Highest Values, PPM
Station Site No.
Total
Obs.
%
Avail
Days >.070 PPM 1st 2nd 3rd 4th 2017 2018 2019 Avg.
East Syracuse 36-067-1015 5,752 99 0 0.063
68-Jun
0.059
9-Mar
0.059
30-Mar
0.058
14-Mar
0.064
19-Jul
0.066
2-May
0.058
14-Mar 0.062
Fulton/Granby 36-075-0003 5,537 94 0 0.060
6-Mar
0.058
28-Jun
0.057
26-Jun
0.056
29-Jun
0.063
12-Jun
0.067
14-Jul
0.056
29-Jun0.062
(Annual Means in parentheses are based on less than 75% available data) *New York and Federal Ambient Air Quality Standard + Denotes a contravention of NYS/Federal AAQS

Region 8 ±
!.
!.!.
!.
!.
!.
Williamson
Cayuga West
Rochester Pri 2
Pinnacle State Park
Rochester Near-Road
--Department of Environmental Conservation
0 5 10 20 30 40 Miles
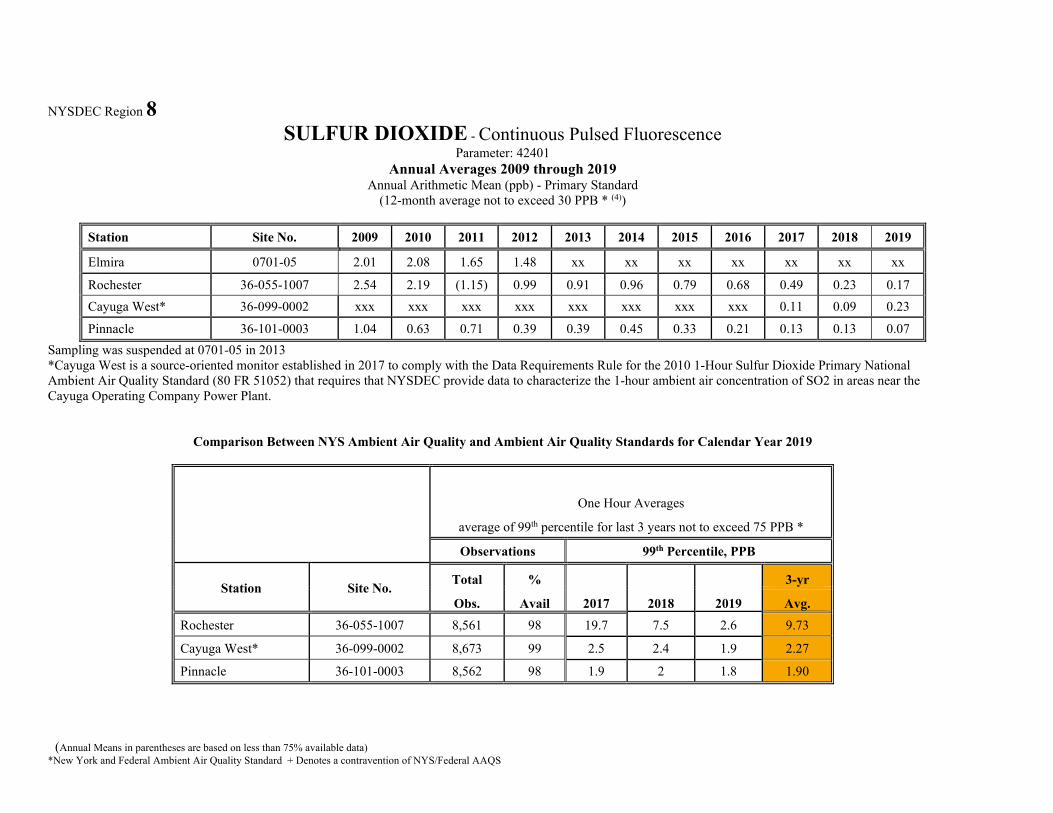
NYSDEC Region 8 SULFUR DIOXIDE - Continuous Pulsed Fluorescence
Parameter: 42401 Annual Averages 2009 through 2019
Annual Arithmetic Mean (ppb) - Primary Standard (12-month average not to exceed 30 PPB * (4))
Station Site No. 2009 2010 2011 2012 2013 2014 2015 2016 2017 2018 2019
Elmira 0701-05 2.01 2.08 1.65 1.48 xx xx xx xx xx xx xx
Rochester 36-055-1007 2.54 2.19 (1.15) 0.99 0.91 0.96 0.79 0.68 0.49 0.23 0.17
Cayuga West* 36-099-0002 xxx xxx xxx xxx xxx xxx xxx xxx 0.11 0.09 0.23
Pinnacle 36-101-0003 1.04 0.63 0.71 0.39 0.39 0.45 0.33 0.21 0.13 0.13 0.07
Sampling was suspended at 0701-05 in 2013 *Cayuga West is a source-oriented monitor established in 2017 to comply with the Data Requirements Rule for the 2010 1-Hour Sulfur Dioxide Primary NationalAmbient Air Quality Standard (80 FR 51052) that requires that NYSDEC provide data to characterize the 1-hour ambient air concentration of SO2 in areas near theCayuga Operating Company Power Plant.
Comparison Between NYS Ambient Air Quality and Ambient Air Quality Standards for Calendar Year 2019
One Hour Averages
average of 99th percentile for last 3 years not to exceed 75 PPB *
Observations 99th Percentile, PPB
Station Site No. Total
Obs.
%
Avail 2017 2018 2019
3-yr
Avg.
Rochester 36-055-1007 8,561 98 19.7 7.5 2.6 9.73
Cayuga West* 36-099-0002 8,673 99 2.5 2.4 1.9 2.27
Pinnacle 36-101-0003 8,562 98 1.9 2 1.8 1.90
(Annual Means in parentheses are based on less than 75% available data) *New York and Federal Ambient Air Quality Standard + Denotes a contravention of NYS/Federal AAQS
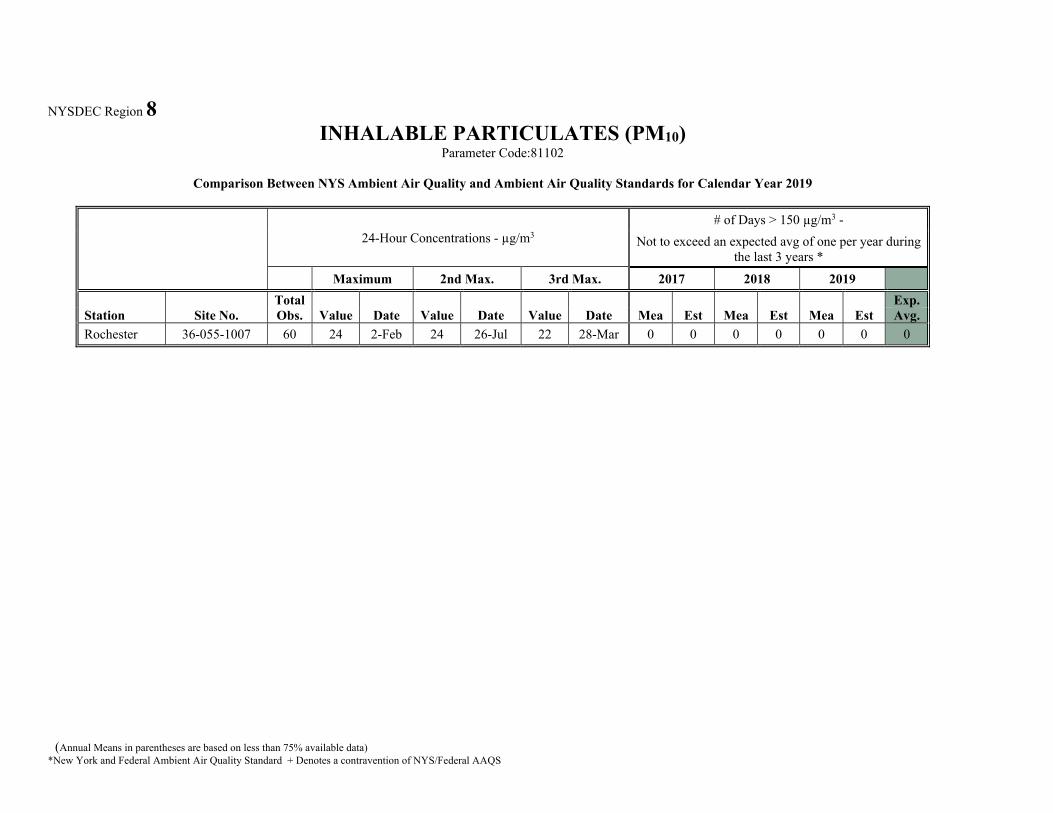
NYSDEC Region 8 INHALABLE PARTICULATES (PM10)
Parameter Code:81102
Comparison Between NYS Ambient Air Quality and Ambient Air Quality Standards for Calendar Year 2019
24-Hour Concentrations - µg/m3
# of Days > 150 µg/m3 -
Not to exceed an expected avg of one per year during the last 3 years *
Maximum 2nd Max. 3rd Max. 2017 2018 2019
Station Site No. Total Obs. Value Date Value Date Value Date Mea Est Mea Est Mea Est
Exp. Avg.
Rochester 36-055-1007 60 24 2-Feb 24 26-Jul 22 28-Mar 0 0 0 0 0 0 0
(Annual Means in parentheses are based on less than 75% available data) *New York and Federal Ambient Air Quality Standard + Denotes a contravention of NYS/Federal AAQS

NYSDEC Region 8 INHALABLE PARTICULATES (PM2.5)
Comparison Between NYS Ambient Air Quality and Ambient Air Quality Standards for Calendar Year 2019 (Average of last 3 years= annual means not to exceed 12 µg/m3 *;
and average of 98th percentile for last 3 years not to exceed 35 µg/m3 *, changed from 65 µg/m3 on 12/17/06)
Station Site No. Total
Obs.
Maximum Values, µg/m3 98th Percentile, µg/m3 Quarterly Averages, 2019
Annual Mean, µg/m3
1st
2
nd
3
rd 2017 2018 2019 3-yrAvg. 1st 2nd 3rd 4th 2017 2018 2019
3-yrAvg.
Rochester Near Road (F) 36-055-0015 108
18.5
20-Nov
17.7
29-Dec
15.7
2-Feb15.7 19.3 15.7 16.6 8.2 5.6 6.4 6.2 6.5 7.3 6.6 6.8
Rochester Near Road (T) 36-055-0015 342
19.1
30-Jul
16.3
29-Jul
15.8
26-Dec13.8 16.9 14.3 15.0 7.9 5.1 6.8 7.4 6.2 7.3 6.8 6.7
Rochester 2 (T) 36-055-1007 352
18.6
29-Dec
17.6
26-Dec
17.5
25-Nov13.9 17.4 16.1 15.8 6.0 5.8 6.2 7.0 7.2 6.2 6.3 6.5
Rochester 2 (F) 36-055-1007 113
18.6 29-Jul
17.9 26-Jul
17.7 20-Nov
13.9 18.8 16.2 16.2 6.1 6.2 7.6 6.2 6.7 6.9 6.5 6.7
Pinnacle (C) 36-101-0003 363
18.9
26-Dec
17.7
27-Dec
17.1
11-Dec11.1 13.1 13.3 12.5 6.7 5.5 6.2 6.1 4.6 4.8 6.1 5.1
Pinnacle (F) 36-101-0003 109
14.3
26-Dec
12.7
20-Nov
11.0
18-Jan11.1 13.7 13.4 12.7 4.8 3.9 4.9 4.2 4.6 5.4 4.4 4.8
(F) = Federal Reference Method or Federal Equivalent Method: Parameter Code: 88101(C) = Continuous, used for AQI calculations. Values based on 24-hour averages of 1-hour values. Parameter Code 88502
(Annual Means in parentheses are based on less than 75% available data) *New York and Federal Ambient Air Quality Standard + Denotes a contravention of NYS/Federal AAQS
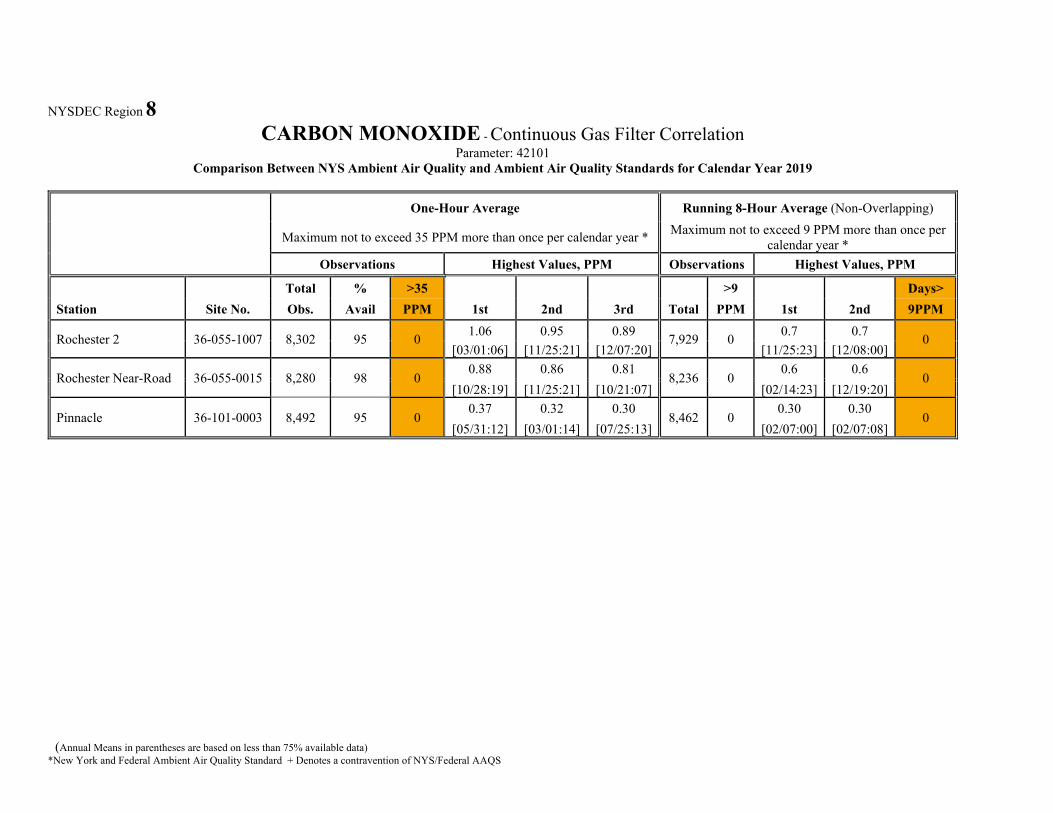
NYSDEC Region 8 CARBON MONOXIDE - Continuous Gas Filter Correlation
Parameter: 42101 Comparison Between NYS Ambient Air Quality and Ambient Air Quality Standards for Calendar Year 2019
One-Hour Average
Maximum not to exceed 35 PPM more than once per calendar year *
Running 8-Hour Average (Non-Overlapping)
Maximum not to exceed 9 PPM more than once per calendar year *
Observations Highest Values, PPM Observations Highest Values, PPM
Station Site No.
Total
Obs.
%
Avail
>35
PPM 1st 2nd 3rd Total
>9
PPM 1st 2nd
Days>
9PPM
Rochester 2 36-055-1007 8,302 95 0 1.06
[03/01:06]
0.95
[11/25:21]
0.89
[12/07:20] 7,929 0
0.7
[11/25:23]
0.7
[12/08:00] 0
Rochester Near-Road 36-055-0015 8,280 98 0 0.88
[10/28:19]
0.86
[11/25:21]
0.81
[10/21:07] 8,236 0
0.6
[02/14:23]
0.6
[12/19:20] 0
Pinnacle 36-101-0003 8,492 95 0 0.37
[05/31:12]
0.32
[03/01:14]
0.30
[07/25:13] 8,462 0
0.30
[02/07:00]
0.30
[02/07:08] 0
(Annual Means in parentheses are based on less than 75% available data) *New York and Federal Ambient Air Quality Standard + Denotes a contravention of NYS/Federal AAQS

NYSDEC Region 8 OZONE - Continuous UV Light Absorption
Comparison Between NYS Ambient Air Quality and Ambient Air Quality Standards for Calendar Year 2019
8-hr Running Average Begin Hour4th Highest Daily Maximum 8-
Hour Average-
Not to exceed an avg of 0.075 ppm during the last 3 years, changed to 0.070 ppm beginning 1/1/2016*
Observations Daily Highest Values, PPM
Station Site No.
Total
Obs.
%
Avail
Days >.070
PPM 1st 2nd 3rd 4th 2017 2018 2019 Avg.
Rochester 2 36-055-1007 8,430 96 0 0.067
28-Jun
0.062
13-Jul
0.059
6-May
0.059
27-Jun
0.067
12-Jun
0.071
9-Jul
0.059
27-Jun0.065
Pinnacle 36-101-0003 8,558 98 0 0.055
20-Apr
0.055
6-May
0.055
23-May
0.054
9-Mar
0.058
10-Jun
0.064
1-May
0.054
9-Mar0.058
Williamson 36-117-3001 5,597 95 0 0.067
28-Jun
0.061
27-Jul
0.060
13-Apr
0.060
27-Jun
0.065
10-Jun
0.071
14-Jul
0.060
27-Jun0.065
(Annual Means in parentheses are based on less than 75% available data) *New York and Federal Ambient Air Quality Standard + Denotes a contravention of NYS/Federal AAQS
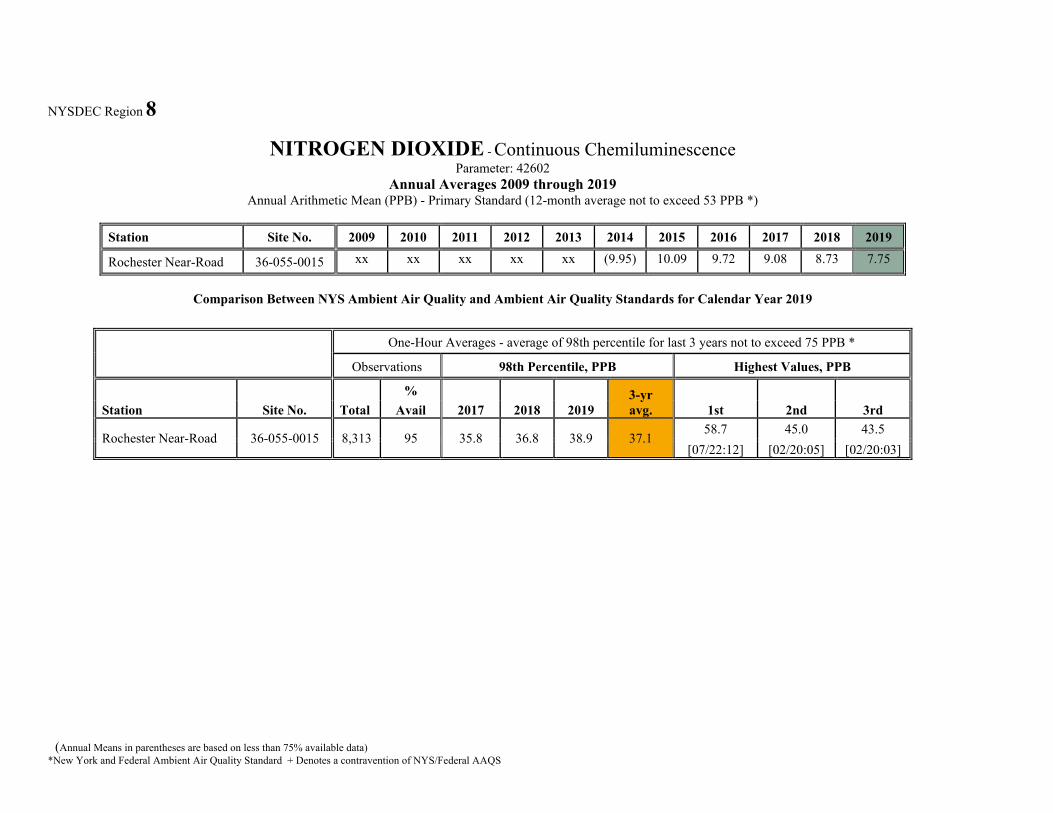
NYSDEC Region 8
NITROGEN DIOXIDE - Continuous Chemiluminescence Parameter: 42602
Annual Averages 2009 through 2019 Annual Arithmetic Mean (PPB) - Primary Standard (12-month average not to exceed 53 PPB *)
Station Site No. 2009 2010 2011 2012 2013 2014 2015 2016 2017 2018 2019
Rochester Near-Road 36-055-0015 xx xx xx xx xx (9.95) 10.09 9.72 9.08 8.73 7.75
Comparison Between NYS Ambient Air Quality and Ambient Air Quality Standards for Calendar Year 2019
One-Hour Averages - average of 98th percentile for last 3 years not to exceed 75 PPB *
Observations 98th Percentile, PPB Highest Values, PPB
Station Site No. Total
%
Avail 2017 2018 2019 3-yravg. 1st 2nd 3rd
Rochester Near-Road 36-055-0015 8,313 95 35.8 36.8 38.9 37.1 58.7
[07/22:12]
45.0
[02/20:05]
43.5
[02/20:03]
(Annual Means in parentheses are based on less than 75% available data) *New York and Federal Ambient Air Quality Standard + Denotes a contravention of NYS/Federal AAQS

NYSDEC Region 8 LEAD –PM10 Samplers
Parameter: 85128 Comparison Between NYS Ambient Air Quality and Ambient Air Quality Standards for Calendar Year 2019
24-Hour Concentrations - µg/m3
THREE MONTH ROLLING AVERAGES
Maximum not to exceed 0.15 µg/m3, effective beginning 1/1/13 * (the old standard of 1.5 µg/m3
will remain in force until that date)
Maximum 2nd Max. 3rd Max. Highest Values, µg/m3
Station Site No. Total
Obs.
%
Avail Value Date Value Date Value Date 2017 2018 2019
Rochester 36-055-1007 61 99 0.0037 29-Dec 0.0031 25-Aug 0.0028 30-Sep 0.0042 0.0022 0.0017
(Annual Means in parentheses are based on less than 75% available data) *New York and Federal Ambient Air Quality Standard + Denotes a contravention of NYS/Federal AAQS

Region 9 ± !.!.
!.
!.
!.
!. !.
!.!.
Buffalo
Dunkirk
Amherst
MiddleportNiagara Falls
Brookside Ter W
Grand Island BlvdBuffalo Near-Road
--Department of Environmental Conservation
0 5 10 20 30 40 Miles

NYSDEC Region 9 SULFUR DIOXIDE - Continuous Pulsed Fluorescence
Parameter: 42401 Annual Averages 2009 through 2019
Annual Arithmetic Mean (ppb) - Primary Standard (12-month average not to exceed 30 PPB * (4))
Station Site No. 2009 2010 2011 2012 2013 2014 2015 2016 2017 2018 2019
Buffalo 36-029-0005 1.74 1.5 2.01 2.72 (2.4) 1.49 1.02 0.49 0.35 0.40 0.40
Brookside Terrace 36-029-0023 2.1 1.83 3.43 2.11 2.82 (1.52) 1.04 0.77 0.35 0.38 0.33
Dunkirk 36-013-0006 2.55 1.54 1.72 1.3 1.03 1.5 1.28 0.41 0.16 0.14 0.13
Niagara Falls 3102-25 1.58 1.53 2.74 3.47 xxx xxx xxx xxx xxx xxx xxx
Sampling was suspended at 1472-04 in 2007, and at 0675-01 and 3102-25 in 2013
Comparison Between NYS Ambient Air Quality and Ambient Air Quality Standards for Calendar Year 2019
One Hour Averages
average of 99th percentile for last 3 years not to exceed 75 PPB *
Observations 99th Percentile, PPB
Station Site No.Total
Obs.
%
Avail 2017 2018 2019
3-yr
Avg.
Buffalo 36-029-0005 8,608 98 8.3 7.1 13.6 9.66
Brookside Terrace 36-029-0023 8,581 98 3.2 5 2.5 3.56
Dunkirk 36-013-0006 8,307 95 2.6 3 3.2 2.93
(Annual Means in parentheses are based on less than 75% available data) *New York and Federal Ambient Air Quality Standard + Denotes a contravention of NYS/Federal AAQS

NYSDEC Region 9 INHALABLE PARTICULATES (PM10)
Parameter Code:81102
Comparison Between NYS Ambient Air Quality and Ambient Air Quality Standards for Calendar Year 2019
24-Hour Concentrations - µg/m3 # of Days > 150 µg/m3 -
Not to exceed an expected avg of one per year during the last 3 years *
Maximum 2nd Max. 3rd Max. 2017 2018 2019
Total Exp.
Station Site No. Obs. Value Date Value Date Value Date Mea Est Mea Est Mea Est Avg.
Buffalo (R&P) 36-029-0005 49 29 15-Jan 24 20-Feb 23 28-Mar 0 0 0 0 0 0 0
(Annual Means in parentheses are based on less than 75% available data) *New York and Federal Ambient Air Quality Standard + Denotes a contravention of NYS/Federal AAQS

NYSDEC Region 9 INHALABLE PARTICULATES (PM2.5)
Comparison Between NYS Ambient Air Quality and Ambient Air Quality Standards for Calendar Year 2019 (Average of last 3 years= annual means not to exceed 12 µg/m3 *;
and average of 98th percentile for last 3 years not to exceed 35 µg/m3 *, changed from 65 µg/m3 on 12/17/06)
Station Site No.
Maximum Values, µg/m3 98th Percentile, µg/m3 Quarterly Averages, 2019
Annual Mean, µg/m3
Total
1st
2
nd
3
rd 2017 2018 2019
3-yr
1st
2
nd
3
rd
4
th 2017 2018 2019
3-yr
Avg. Avg.
Buffalo (F) 36-029-0005 115 21.0
20-Nov
20.5
15-Jan
16.8
5-Jun16.7 19.4 16.8 17.6 7.5 6.9 7.3 6.6 7.2 7.5 7 7.2
Buffalo (C) 36-029-0005 361 19.5
4-Jul
19.1
29-Jul
17.1
28-Jul16.1 16.2 14.4 15.5 7.5 5.3 6.7 7.6 7.5 7.5 6.8 7.2
Grand Island Blvd (C) 36-029-1013 365 16.9
10-Jul
15.9
28-Jul
15.6
29-Jul16.3 19.7 14.2 16.7 7.3 4.9 6.6 7.4 7.8 9.4 6.5 7.9
36-029-1014 352 27.5
28-Jul
23.2
27-Jul
16.7
4-Jul13.6 17.5 14.1 15.0 7.0 5.1 7.3 7.3. 7 7.3 6.7 7.0 Brookside Terrace (C)
Buffalo Near Road (C) 36-029-0023 364 16.3
29-Jul
15.3
28-Dec
15.0
10-Jul16.1 16.1 14.5 15.5 7.5 5.5 7.1 7.6 7.8 7.4 6.9 7.3
Buffalo Near Road (F) 36-029-0023 111 18.1
15-Jan
16.5
5-Jun
14.9
19-Mar15.0 17.8 14.9 15.9 8.1 7.0 7.2 6.2 7.4 7.6 7.1 7.3
Dunkirk (F) 36-013-0006 115 15.0
5-Jun
14.3
15-Jan
13.8
1-Mar13.7 17.2 13.8 14.9 6.2 6.1 6.4 5.0 6.2 6.6 5.9 6.2
Amherst (F) 36-029-0002 120 18.6
20-Nov
17.8
15-Jan
14.8
2-Feb14.7 17.8 14.8 15.8 6.9 5.9 6.7 6.1 6.6 6.9 6.4 6.6
(F) = Federal Reference Method or Federal Equivalent Method: Parameter Code: 88101(C) = Continuous, used for AQI calculations. Values based on 24-hour averages of 1-hour values. Parameter Code 88502
TEOM sampling at 3102-25 was terminated on 12/31/12, and FRM on 4/01/13. Sampling resumed on 4/4/13 at 0601-04.
(Annual Means in parentheses are based on less than 75% available data) *New York and Federal Ambient Air Quality Standard + Denotes a contravention of NYS/Federal AAQS

NYSDEC Region 9 CARBON MONOXIDE - Continuous Gas Filter Correlation
Parameter:42101
Comparison Between NYS Ambient Air Quality and Ambient Air Quality Standards for Calendar Year 2019
One-Hour Average Running 8-Hour Average (Non-Overlapping) Maximum not to exceed 35 PPM more than once per calendar
year * Maximum not to exceed 9 PPM more than once
per calendar year *
Observations Highest Values, PPM Observations Highest Values, PPM
Total % >35 >9 Days>
Station Site No. Obs. Avail PPM 1st 2nd 3rd Total PPM 1st 2nd 9PPM
Buffalo 36-029-0005 8,569 98 0 1.1 1.1 1.0
8,645 0 0.90 0.70
0[01/04:22] [10/29:06] [01/04:23] [01/05:04] [01/05:07]
Buffalo Near-Road 36-029-0023 8,603 97 0 1.14 1.07 0.92
8,582 0 0.80 0.70
0 [03/20:06] [01/04:22] [12/26:19] [01/05:04] [10/28:23]
(Annual Means in parentheses are based on less than 75% available data) *New York and Federal Ambient Air Quality Standard + Denotes a contravention of NYS/Federal AAQS
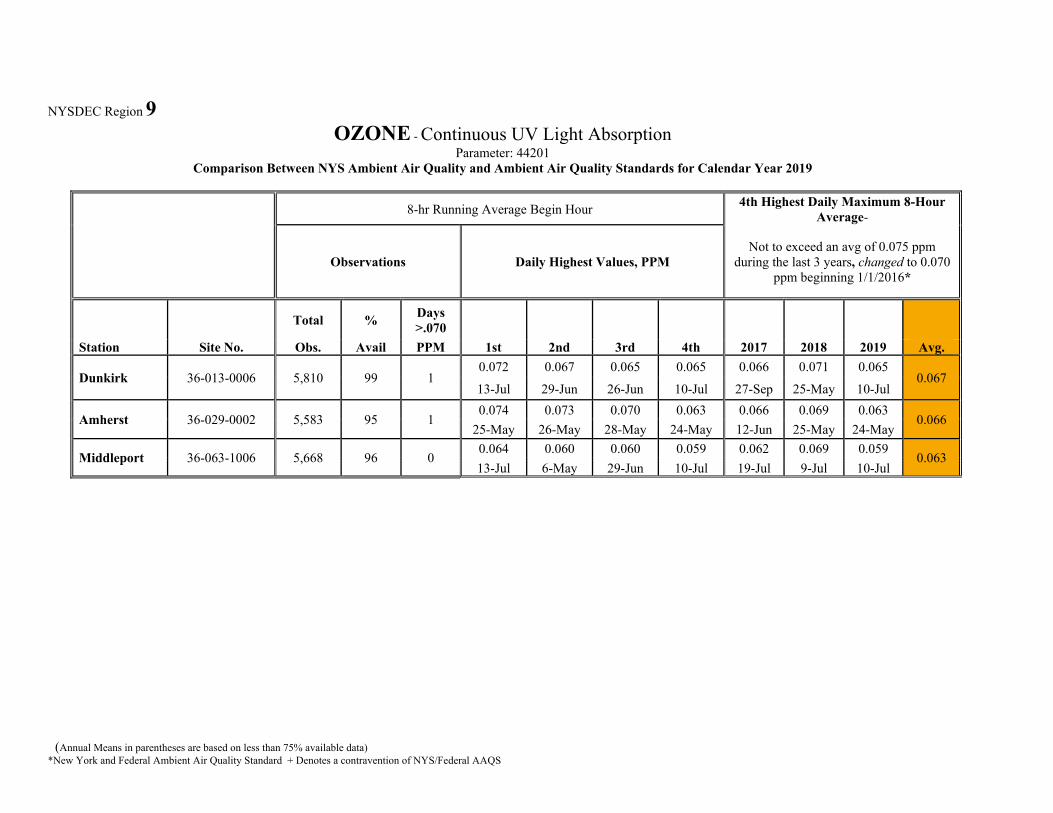
NYSDEC Region 9 OZONE - Continuous UV Light Absorption
Parameter: 44201 Comparison Between NYS Ambient Air Quality and Ambient Air Quality Standards for Calendar Year 2019
8-hr Running Average Begin Hour4th Highest Daily Maximum 8-Hour
Average-
Not to exceed an avg of 0.075 ppm during the last 3 years, changed to 0.070
ppm beginning 1/1/2016* Observations Daily Highest Values, PPM
Station Site No.
Total
Obs.
%
Avail
Days >.070
PPM 1st 2nd 3rd 4th 2017 2018 2019 Avg.
0.067 Dunkirk 36-013-0006 5,810 99 1 0.072
13-Jul
0.067
29-Jun
0.065
26-Jun
0.065
10-Jul
0.066
27-Sep
0.071
25-May
0.065
10-Jul
Amherst 36-029-0002 5,583 95 1 0.074
25-May
0.073
26-May
0.070
28-May
0.063
24-May
0.066
12-Jun
0.069
25-May
0.063
24-May0.066
Middleport 36-063-1006 5,668 96 0 0.064
13-Jul
0.060
6-May
0.060
29-Jun
0.059
10-Jul
0.062
19-Jul
0.069
9-Jul
0.059
10-Jul0.063
(Annual Means in parentheses are based on less than 75% available data) *New York and Federal Ambient Air Quality Standard + Denotes a contravention of NYS/Federal AAQS

NYSDEC Region 9 NITROGEN DIOXIDE - Continuous Chemiluminescence
Parameter: 42602 Annual Averages 2009 through 2019
Annual Arithmetic Mean (PPB) - Primary Standard (12-month average not to exceed 53 PPB *)
Station Site No. 2009 2010 2011 2012 2013 2014 2015 2016 2017 2018 2019
Buffalo Near-Road 36-029-0023 --
--
--
-- --
9.9 12.4 10.78 9.6 9.54 9.47
Buffalo 36-029-0005 15.05 13.88 13 (12.52) 10.46 (10.38) (8.7) 9.9 9.49 9.81 9.11
Amherst 36-029-0002 (9.71) (7.42) 8.19 8.32 6.44 --
--
--
-- --
--
Sampling at 1451-03 was suspended 12/31/12.
Comparison Between NYS Ambient Air Quality and Ambient Air Quality Standards for Calendar Year 2019
One-Hour Averages - average of 98th percentile for last 3 years not to exceed 75 PPB *
Observations 98th Percentile, PPB Highest Values, PPB
Station Site No. Total
%
Avail 2017 2018 2019 3-yr avg. 1st 2nd 3rd
Buffalo Near-Road 36-029-0023 8,057 92 40.4 41.0 45.0 42.3 58.6
[03/08:21]57.0
[03/09:00] 56.4
[03/08:22]
Buffalo 36-029-0005 8,231 94 45.8 47.2 51.0 48.0 62.4
[03/08:22]59.9
[03/08:05] 59.9
[03/09:01]
(Annual Means in parentheses are based on less than 75% available data) *New York and Federal Ambient Air Quality Standard + Denotes a contravention of NYS/Federal AAQS