new york state and local retirement system
TRANSCRIPT

NEW YORK STATE AND LOCAL RETIREMENT SYSTEM
Basic Financial Statements and Supplementary Information
March 31, 2016
(With Independent Auditors’ Report Thereon)

NEW YORK STATE AND LOCAL RETIREMENT SYSTEM
Table of Contents
Page(s)
Independent Auditors’ Report 1–2
Management’s Discussion and Analysis (Unaudited) 3–8
Basic Financial Statements:
Combining Basic Statement of Fiduciary Net Position 9
Combining Basic Statement of Changes in Fiduciary Net Position 10
Notes to Basic Financial Statements 11–33
Required Supplementary Information (Unaudited)
Schedule 1 – Schedule of Changes in the Employers’ Net Pension Liability and Related Ratios 34–35
Schedule 2 – Schedule of Employer Contributions 36
Schedule 3 – Schedule of Investment Returns 37
Notes to Required Supplementary Information 38
Other Supplementary Information
Schedule 4 – Schedule of Administrative Expenses 39
Schedule 5 – Schedule of Investment Expenses 40
Schedule 6 – Schedule of Consulting Fees 41
Independent Auditors’ Report on Internal Control over Financial Reporting and on Compliance
and Other Matters Based on an Audit of Financial Statements Performed in Accordance with
Government Auditing Standards 42–43

Independent Auditors’ Report
The Trustee
New York State and Local Retirement System:
Report on the Financial Statements
We have audited the accompanying combining statement of fiduciary net position of the New York State
and Local Retirement System (the System) as of March 31, 2016, the related combining statement of changes
in fiduciary net position for the year then ended, and the related notes to the financial statements.
Management’s Responsibility for the Financial Statements
Management is responsible for the preparation and fair presentation of these financial statements in
accordance with U.S. generally accepted accounting principles; this includes the design, implementation,
and maintenance of internal control relevant to the preparation and fair presentation of financial statements
that are free from material misstatement, whether due to fraud or error.
Auditors’ Responsibility
Our responsibility is to express an opinion on these financial statements based on our audit. We conducted
our audit in accordance with auditing standards generally accepted in the United States of America and the
standards applicable to financial audits contained in Government Auditing Standards issued by the
Comptroller General of the United States. Those standards require that we plan and perform the audit to
obtain reasonable assurance about whether the financial statements are free from material misstatement.
An audit involves performing procedures to obtain audit evidence about the amounts and disclosures in the
financial statements. The procedures selected depend on the auditors’ judgment, including the assessment of
the risks of material misstatement of the financial statements, whether due to fraud or error. In making those
risk assessments, the auditors consider internal control relevant to the entity’s preparation and fair
presentation of the financial statements in order to design audit procedures that are appropriate in the
circumstances, but not for the purpose of expressing an opinion on the effectiveness of the entity’s internal
control. Accordingly, we express no such opinion. An audit also includes evaluating the appropriateness of
accounting policies used and the reasonableness of significant accounting estimates made by management,
as well as evaluating the overall presentation of the financial statements.
We believe that the audit evidence we have obtained is sufficient and appropriate to provide a basis for our
audit opinion.
Opinion
In our opinion, the financial statements referred to above present fairly in all material respects, the fiduciary
net position of the System as of March 31, 2016, and the changes in fiduciary net position for the year then
ended, in accordance with U.S. generally accepted accounting principles.
KPMG LLP515 BroadwayAlbany, NY 12207-2974
KPMG LLP is a Delaware limited liability partnership, the U.S. member firm of KPMG International Cooperative (“KPMG International”), a Swiss entity.

2
Other Matters
Required Supplementary Information
U.S. generally accepted accounting principles require that the management’s discussion and analysis and
required supplementary information as listed in the accompanying table of contents be presented to
supplement the basic financial statements. Such information, although not a part of the basic financial
statements, is required by the Governmental Accounting Standards Board who considers it to be an essential
part of financial reporting for placing the basic financial statements in an appropriate operational, economic,
or historical context. We have applied certain limited procedures to the required supplementary information
in accordance with auditing standards generally accepted in the United States of America, which consisted
of inquiries of management about the methods of preparing the information and comparing the information
for consistency with management’s responses to our inquiries, the basic financial statements, and other
knowledge we obtained during our audit of the basic financial statements. We do not express an opinion or
provide any assurance on the information because the limited procedures do not provide us with sufficient
evidence to express an opinion or provide any assurance.
Other Supplementary Information
Our audit was conducted for the purpose of forming an opinion on the System’s basic financial statements.
The accompanying other supplementary information as listed in the accompanying table of contents is
presented for purposes of additional analysis and is not a required part of the basic financial statements. Such
information is the responsibility of management and was derived from and relates directly to the underlying
accounting and other records used to prepare the basic financial statements. Such information has been
subjected to the auditing procedures applied in the audit of the basic financial statements and certain
additional procedures, including comparing and reconciling such information directly to the underlying
accounting and other records used to prepare the basic financial statements or to the basic financial statements
themselves, and other additional procedures in accordance with auditing standards generally accepted in the
United States of America. In our opinion, the other supplementary information is fairly stated in all material
respects in relation to the basic financial statements as a whole.
Other Reporting Required by Government Auditing Standards
In accordance with Government Auditing Standards, we have also issued our report dated July 20, 2016 on
our consideration of the System’s internal control over financial reporting and on our tests of its compliance
with certain provisions of laws, regulations, contracts, and grant agreements and other matters. The purpose
of that report is to describe the scope of our testing of internal control over financial reporting and compliance
and the results of that testing, and not to provide an opinion on internal control over financial reporting or on
compliance. That report is an integral part of an audit performed in accordance with Government Auditing
Standards in considering the System’s internal control over financial reporting and compliance.
July 20, 2016
NEW YORK STATE AND LOCAL RETIREMENT SYSTEM
Management’s Discussion and Analysis
March 31, 2016
(Unaudited)
3 (Continued)
The following overview of the financial activity of the New York State and Local Retirement System (the System)
for the fiscal year ended March 31, 2016 is intended to provide the reader with an analysis of the System’s overall
financial position. The System is comprised of the New York State and Local Employees’ Retirement System
(ERS) and the New York State and Local Police and Fire Retirement System (PFRS). This management’s
discussion and analysis should be read in conjunction with the basic financial statements of the System, which
follow.
Financial Highlights
The fiduciary net position of the System held in trust to pay pension benefits was $183.64 billion as of March 31,
2016. This amount reflects a decrease of $5.77 billion from the prior fiscal year. This change is primarily the result
of the net depreciation of the fair value of the investment portfolio. Investment (depreciation) appreciation for the
fiscal years ended March 31, 2016 and 2015 is $(3.93) billion and $9.28 billion, respectively.
The System’s investments reported a positive money-weighted rate of return, net of investment expense, of
0.03 percent for the fiscal year ended March 31, 2016 and a positive money-weighted rate of return, net of
investment expense, of 6.98 percent for the fiscal year ended March 31, 2015.
Retirement and death benefits paid during fiscal year 2016 to 440,943 annuitants totaled $10.91 billion, as
compared to $10.44 billion paid to 430,308 annuitants for fiscal year 2015. The increase is primarily due to
the number of new retirees.
Contributions from employers decreased from $5.80 billion for the fiscal year ended March 31, 2015 to
$5.14 billion for the fiscal year ended March 31, 2016. The decrease in contributions is attributable to lower
billing rates.
The Net Pension Liability (NPL) for ERS was $16.10 billion for the measurement period ended March 31,
2016 as compared to $3.38 billion for the measurement period ended March 31, 2015. The fiduciary net
position, restricted for pension benefits as of March 31, 2016, was $156.25 billion, which represents
90.7 percent of the calculated total pension liability for ERS. The NPL is allocated to participating employers
and reported pursuant to Governmental Accounting Standards Board (GASB) Statements 67 and 68.
The NPL for the PFRS was $2.96 billion for the measurement period ended March 31, 2016 as compared to
$275.26 million for the measurement period ended March 31, 2015. The fiduciary net position restricted for
pension benefits as of March 31, 2016, was $27.39 billion, which represents 90.2 percent of the calculated
total pension liability for the PFRS. The NPL is allocated to participating employers and reported pursuant
to GASB Statements 67 and 68.
Overview of the Financial Statements
The financial statements consist of the combining basic statement of fiduciary net position, the combining basic
statement of changes in fiduciary net position, and the notes to the basic financial statements. The required
supplementary information that appears after the notes to the basic financial statements is not a required part of the
basic financial statements, but is supplementary information required by the GASB. The other supplementary
information following the required supplementary information is not required, but management has chosen to
include such information to increase transparency.

NEW YORK STATE AND LOCAL RETIREMENT SYSTEM
Management’s Discussion and Analysis
March 31, 2016
(Unaudited)
4 (Continued)
The combining basic statement of fiduciary net position reflects the resources available to pay members, retirees
and beneficiaries at the close of the System’s fiscal year. This statement also provides information about the fair
value and composition of the System’s net position.
The combining basic statement of changes in fiduciary net position presents the changes to the System’s net
position for the fiscal year, including net investment (loss) income, net appreciation or depreciation in fair value
of the investment portfolio, and contributions from members and employers. Benefits and administrative expenses
paid by the System are included under the deductions section of the statement.
The notes to the financial statements are an integral part of the basic financial statements and provide additional
information about the plans, policies and performance of the System. The financial statement notes include
Description of Plans, Summary of Significant Accounting Policies, System Reserves, Investments, Deposit and
Investment Risk Disclosure, Derivatives, Securities Lending Program, Net Pension Liability of Participating
Employers, Federal Income Tax Status, Commitments, and Contingencies.
The required supplementary schedules include: Schedule of Changes in the Employers’ Net Pension Liability and
Related Ratios, Schedule of Employer Contributions, and Schedule of Investment Returns.
The other supplementary information includes schedules of administrative expenses, investment expenses, and
consulting fees.
Analysis of the Overall Financial Position of the System
The purpose of the System’s investments is to provide for long-term growth, while also ensuring a reliable cash
flow that meets the funding requirements of the near-term pension obligation. To achieve these goals, the
investments are allocated to a variety of asset types and strategies in order to meet the current funding needs as
well as future growth requirements of the pension liability. Equity-related investments are included for their
long-term return and growth characteristics. While a majority of fixed income and debt-related investments are
generally included in the allocation for their ability to control investment risk and provide for a reliable cash flow
that meets the funding requirements of the pension payments, a portion is strategically invested in more actively
traded markets. It is important to note that the change from year to year is due not only to changes in fair values,
but also to purchases, sales, and redemptions. Tables 1, 2, and 3 summarize and compare financial data for the
current and prior years.
NEW YORK STATE AND LOCAL RETIREMENT SYSTEM
Management’s Discussion and Analysis
March 31, 2016
(Unaudited)
5 (Continued)
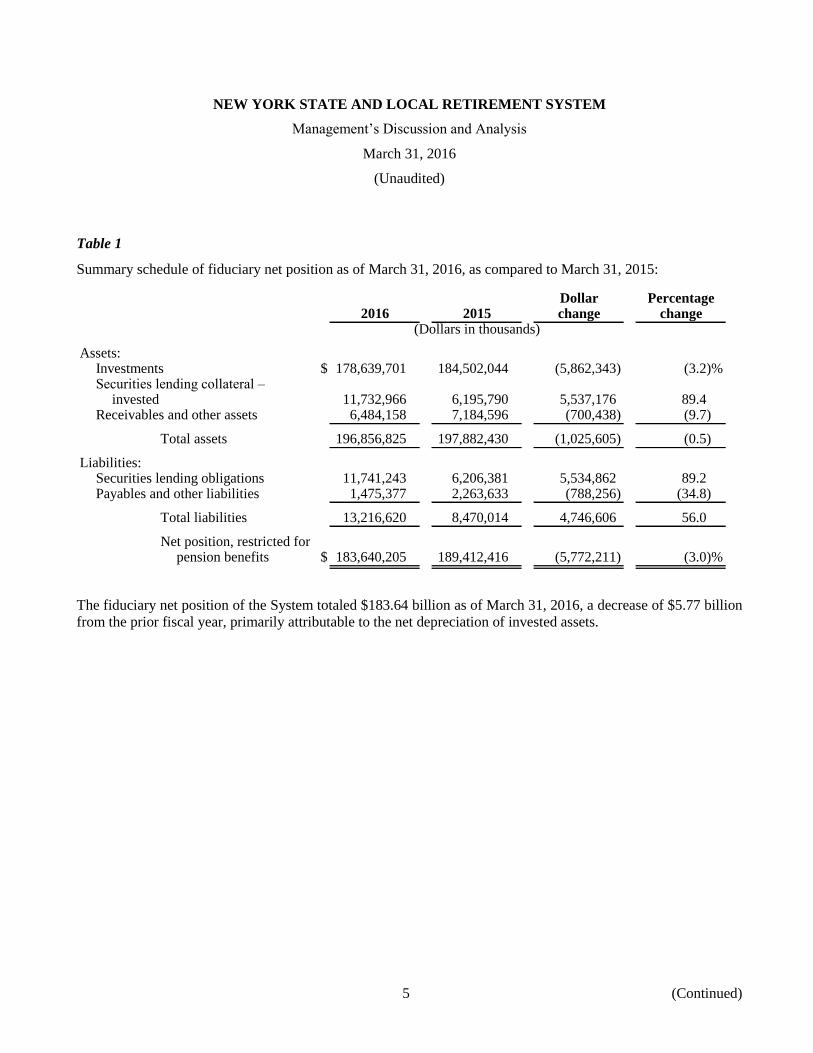
Table 1
Summary schedule of fiduciary net position as of March 31, 2016, as compared to March 31, 2015:
Dollar Percentage2016 2015 change change
(Dollars in thousands)
Assets:Investments $ 178,639,701 184,502,044 (5,862,343) (3.2)%Securities lending collateral –
invested 11,732,966 6,195,790 5,537,176 89.4Receivables and other assets 6,484,158 7,184,596 (700,438) (9.7)
Total assets 196,856,825 197,882,430 (1,025,605) (0.5)
Liabilities:Securities lending obligations 11,741,243 6,206,381 5,534,862 89.2Payables and other liabilities 1,475,377 2,263,633 (788,256) (34.8)
Total liabilities 13,216,620 8,470,014 4,746,606 56.0
Net position, restricted forpension benefits $ 183,640,205 189,412,416 (5,772,211) (3.0)%
The fiduciary net position of the System totaled $183.64 billion as of March 31, 2016, a decrease of $5.77 billion
from the prior fiscal year, primarily attributable to the net depreciation of invested assets.
NEW YORK STATE AND LOCAL RETIREMENT SYSTEM
Management’s Discussion and Analysis
March 31, 2016
(Unaudited)
6 (Continued)
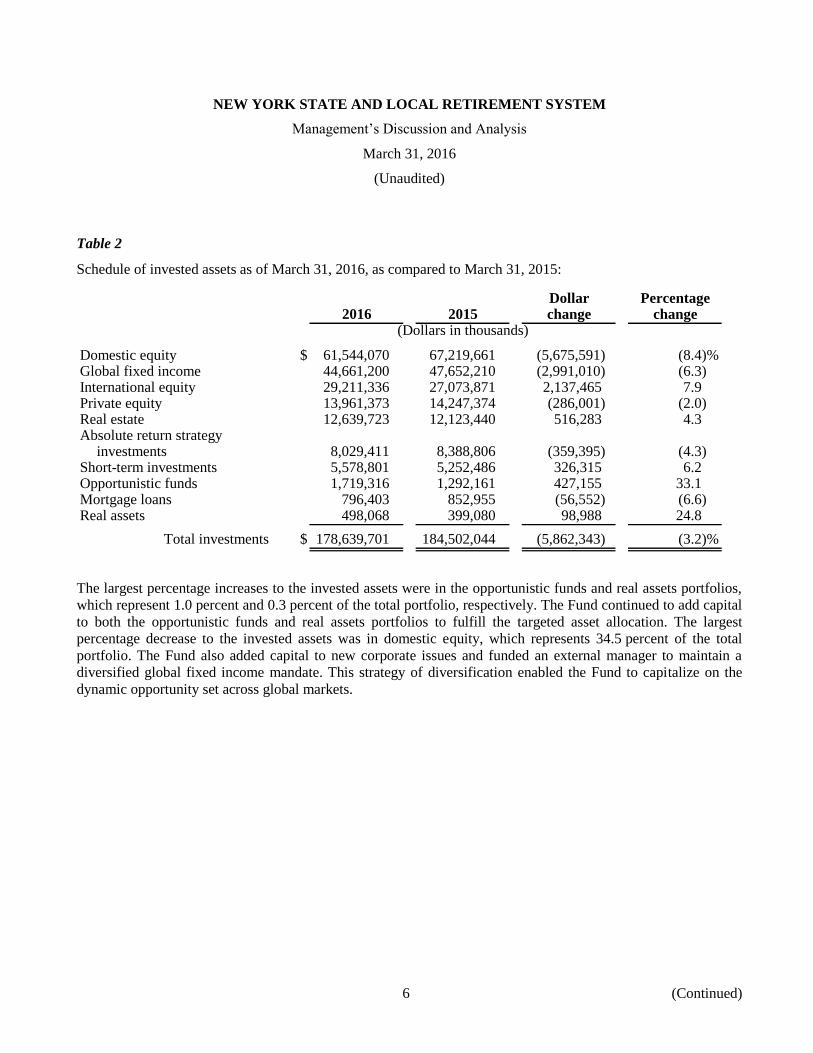
Table 2
Schedule of invested assets as of March 31, 2016, as compared to March 31, 2015:
Dollar Percentage2016 2015 change change
(Dollars in thousands)
Domestic equity $ 61,544,070 67,219,661 (5,675,591) (8.4)%Global fixed income 44,661,200 47,652,210 (2,991,010) (6.3)International equity 29,211,336 27,073,871 2,137,465 7.9Private equity 13,961,373 14,247,374 (286,001) (2.0)Real estate 12,639,723 12,123,440 516,283 4.3Absolute return strategy
investments 8,029,411 8,388,806 (359,395) (4.3)Short-term investments 5,578,801 5,252,486 326,315 6.2Opportunistic funds 1,719,316 1,292,161 427,155 33.1Mortgage loans 796,403 852,955 (56,552) (6.6)Real assets 498,068 399,080 98,988 24.8
Total investments $ 178,639,701 184,502,044 (5,862,343) (3.2)%
The largest percentage increases to the invested assets were in the opportunistic funds and real assets portfolios,
which represent 1.0 percent and 0.3 percent of the total portfolio, respectively. The Fund continued to add capital
to both the opportunistic funds and real assets portfolios to fulfill the targeted asset allocation. The largest
percentage decrease to the invested assets was in domestic equity, which represents 34.5 percent of the total
portfolio. The Fund also added capital to new corporate issues and funded an external manager to maintain a
diversified global fixed income mandate. This strategy of diversification enabled the Fund to capitalize on the
dynamic opportunity set across global markets.

NEW YORK STATE AND LOCAL RETIREMENT SYSTEM
Management’s Discussion and Analysis
March 31, 2016
(Unaudited)
7 (Continued)
Table 3
Summary schedule of changes in fiduciary net position for the year ended March 31, 2016, as compared to the year
ended March 31, 2015:
Dollar Percentage2016 2015 change change
(Dollars in thousands)
Additions:Net investment (loss) income $ (384,834) 12,444,891 (12,829,725) (103.1)%Total contributions 5,779,715 6,313,041 (533,326) (8.4)
Total additions 5,394,881 18,757,932 (13,363,051) (71.2)
Deductions:Total benefits paid (11,060,472) (10,513,714) (546,758) 5.2Administrative expenses (106,620) (107,151) 531 (0.5)
Total deductions (11,167,092) (10,620,865) (546,227) 5.1
Net (decrease) increase (5,772,211) 8,137,067 (13,909,278) (170.9)
Net position, restricted for pensionbenefits – beginning of year 189,412,416 181,275,349 8,137,067 4.5
Net position, restricted for pensionbenefits – end of year $ 183,640,205 189,412,416 (5,772,211) (3.0)%
The change in net investment (loss) income is primarily attributable to the net depreciation in fair value of
investments from 2015 to 2016. This is reflected in the change in the money-weighted rate of return, net of
investment expense, from 6.98 percent in 2015 to 0.03 percent in 2016. The decrease in total contributions is
attributable to the change in employer billing rates.
Economic Factors and Rates of Return
The Fund announced positive investment performance for the fiscal year ended March 31, 2016, with a
time-weighted rate of return of 0.19 percent, a modest increase which reflected the volatility in the world equity
markets. The Fund’s private equity and real estate portfolios experienced strong positive performance which
benefited the total Fund. The U.S. equity market’s performance was flat for the year while the international
markets, particularly the emerging markets, experienced negative performance. Market volatility and concerns
about increasing inflation and political uncertainty across the globe continued through this year. This was the
seventh consecutive year of positive performance for the Fund following the fiscal crisis of 2008.
NEW YORK STATE AND LOCAL RETIREMENT SYSTEM
Management’s Discussion and Analysis
March 31, 2016
(Unaudited)
8
Requests for Information
This financial report is designed to provide a general overview of the System’s finances for all interested parties.
Questions concerning any of the information provided in this report or requests for additional financial information
should be addressed to the New York State and Local Retirement System, 110 State Street, Albany, New York
12244-0001. The report can also be accessed on the Comptroller’s website at
www.osc.state.ny.us/retire/about_us/financial_statements_index.php.

9
NEW YORK STATE AND LOCAL RETIREMENT SYSTEM
Combining Basic Statement of Fiduciary Net Position
March 31, 2016
(Dollars in thousands)
Police andEmployees’ FireRetirement Retirement
System System Total
Assets:Investments (notes 2(b), 4 and 5):
Domestic equity $ 52,272,728 9,271,342 61,544,070 Global fixed income 37,933,188 6,728,012 44,661,200 International equity 24,810,777 4,400,559 29,211,336 Private equity 11,858,154 2,103,219 13,961,373 Real estate 10,735,605 1,904,118 12,639,723 Absolute return strategy investments 6,819,816 1,209,595 8,029,411 Short-term investments 4,738,379 840,422 5,578,801 Opportunistic funds 1,460,309 259,007 1,719,316 Mortgage loans 676,428 119,975 796,403 Real assets 423,036 75,032 498,068
Total investments 151,728,420 26,911,281 178,639,701
Securities lending collateral – invested (note 7) 9,965,447 1,767,519 11,732,966 Forward foreign exchange contracts (note 6) 101,970 18,086 120,056
Receivables:Employers’ contributions 3,749,357 471,217 4,220,574 Members’ contributions 8 — 8 Member loans 1,067,191 2,725 1,069,916 Investment income 341,935 60,647 402,582 Investment sales 240,234 42,609 282,843 Other 88,288 110,398 198,686
Total receivables 5,487,013 687,596 6,174,609
Capital assets, at cost, net of accumulateddepreciation 160,947 28,546 189,493
Total assets 167,443,797 29,413,028 196,856,825
Liabilities:Securities lending obligations (note 7) 9,972,478 1,768,765 11,741,243 Forward foreign exchange contracts (note 6) 100,243 17,780 118,023 Accounts payable – investments 758,449 134,522 892,971 Benefits payable 204,081 81,068 285,149 Other liabilities 155,281 23,953 179,234
Total liabilities 11,190,532 2,026,088 13,216,620
Net position, restricted for pensionbenefits $ 156,253,265 27,386,940 183,640,205
See accompanying notes to basic financial statements.

10
NEW YORK STATE AND LOCAL RETIREMENT SYSTEM
Combining Basic Statement of Changes in Fiduciary Net Position
Year ended March 31, 2016
(Dollars in thousands)
Police andEmployees’ FireRetirement Retirement
System System Total
Additions:Income (loss) from investing activities:
Net depreciation in fair value of investments $ (3,344,512) (590,341) (3,934,853) Interest income 1,229,554 217,015 1,446,569 Dividend income 1,354,026 238,984 1,593,010 Other income 874,361 154,324 1,028,685 Less investment expenses (480,957) (84,888) (565,845)
Total loss from investing activities (367,528) (64,906) (432,434)
Income from securities lending activities:Securities lending income 31,191 5,505 36,696 Securities lending rebates 13,754 2,428 16,182 Less securities lending management fees (4,486) (792) (5,278)
Total income from securities lendingactivities 40,459 7,141 47,600
Total net investment loss (327,069) (57,765) (384,834)
Contributions:Employers 4,347,619 792,585 5,140,204 Members 289,333 17,298 306,631 Interest on accounts receivable 128,648 15,711 144,359 Other 69,684 118,837 188,521
Total contributions 4,835,284 944,431 5,779,715
Total additions 4,508,215 886,666 5,394,881
Deductions:Benefits paid:
Retirement benefits (9,045,042) (1,675,252) (10,720,294) Death benefits (179,861) (8,329) (188,190) Other, net (150,294) (1,694) (151,988)
Total benefits paid (9,375,197) (1,685,275) (11,060,472)
Administrative expenses (93,012) (13,608) (106,620)
Total deductions (9,468,209) (1,698,883) (11,167,092)
Net decrease (4,959,994) (812,217) (5,772,211)
Net position, restricted for pension benefits –beginning of year 161,213,259 28,199,157 189,412,416
Net position, restricted for pension benefits –end of year $ 156,253,265 27,386,940 183,640,205
See accompanying notes to basic financial statements.

NEW YORK STATE AND LOCAL RETIREMENT SYSTEM
Notes to Basic Financial Statements
March 31, 2016
11 (Continued)
(1) Description of Plans
The Office of the New York State Comptroller administers the following plans: the New York State and
Local Employees’ Retirement System (ERS) and the New York State and Local Police and Fire Retirement
System (PFRS), which are collectively referred to as the New York State and Local Retirement System
(the System). The net position of the System is held in the New York State Common Retirement Fund
(the Fund), which was established to hold all assets and record changes in fiduciary net position allocated to
the System.
The Comptroller of the State of New York serves as the trustee of the Fund and is the administrative head of
the System. The Comptroller is an elected official determined in a direct statewide election and serves a
four-year term. Thomas P. DiNapoli has served as Comptroller since February 7, 2007. In November 2014,
he was elected for a new term commencing January 1, 2015. System benefits are established under the
provisions of the New York State Retirement and Social Security Law (RSSL). Once a public employer
elects to participate in the System, the election is irrevocable. The New York State Constitution provides
that pension membership is a contractual relationship and plan benefits cannot be diminished or impaired.
Benefits can be changed for future members only by enactment of a State statute. Generally, members of the
System are employees of the State and its municipalities, other than New York City.
ERS and PFRS are cost-sharing, multiple-employer, defined benefit pension plans. The System is included
in the State’s financial report as a pension trust fund. The Public Employees’ Group Life Insurance Plan
(GLIP) provides death benefits in the form of life insurance. In these statements, GLIP amounts are
apportioned to and included in ERS and PFRS.
As of March 31, 2016, the number of participating employers for ERS and PFRS consisted of the following:
ERS PFRS
State 1 1 Counties 57 4 Cities 61 61 Towns 913 207 Villages 487 375 Other 793 38 School districts 698 —
Total 3,010 686
As of March 31, 2016, the System membership for ERS and PFRS consisted of the following:
ERS PFRS
Retirees and beneficiaries currently receiving benefits 407,112 33,831 Active members 494,411 31,720 Inactive members * 117,883 3,385
Total members and benefit recipients 1,019,406 68,936
* Includes vested members not currently receiving benefits and nonvested members.

NEW YORK STATE AND LOCAL RETIREMENT SYSTEM
Notes to Basic Financial Statements
March 31, 2016
12 (Continued)
(a) Membership Tiers
Pension legislation enacted in 1973, 1976, 1983, 2009 and 2012 established distinct classes of
membership. For convenience, the System uses a tier concept to distinguish these groups, generally:
ERS
Tier 1 Those persons who last became members before July 1, 1973.
Tier 2 Those persons who last became members on or after July 1, 1973, but before July 27,
1976.
Tier 3 Generally, those persons who are State correction officers who last became members on
or after July 27, 1976, but before January 1, 2010, and all others who last became
members on or after July 27, 1976, but before September 1, 1983.
Tier 4 Generally, except for correction officers, those persons who last became members on or
after September 1, 1983, but before January 1, 2010.
Tier 5 Those persons who last became members on or after January 1, 2010, but before April 1,
2012.
Tier 6 Those persons who first became members on or after April 1, 2012.
PFRS
Tier 1 Those persons who last became members before July 31, 1973.
Tier 2 Those persons who last became members on or after July 31, 1973, but before July 1,
2009.
Tier 3 Those persons who last became members on or after July 1, 2009, but before January 9,
2010.
Tier 4 N/A
Tier 5 Those persons who last became members on or after January 9, 2010, but before April 1,
2012, or who were previously PFRS Tier 3 members who elected to become Tier 5.
Tier 6 Those persons who first became members on or after April 1, 2012.
(b) Vesting
Members who joined the System prior to January 1, 2010 need five years of service to be 100 percent
vested. Members who joined on or after January 1, 2010 (ERS) or January 9, 2010 (PFRS) require
ten years of service credit to be 100 percent vested.

NEW YORK STATE AND LOCAL RETIREMENT SYSTEM
Notes to Basic Financial Statements
March 31, 2016
13 (Continued)
(c) Employer Contributions
Participating employers are required under the RSSL to contribute to the System at an actuarially
determined rate adopted annually by the Comptroller. The average contribution rate for ERS for the
fiscal year ended March 31, 2016 was approximately 18.2 percent of payroll. The average contribution
rate for PFRS for the fiscal year ended March 31, 2016 was approximately 24.7 percent of payroll.
Delinquent annual bills for employer contributions accrue interest at the actuarial interest rate
applicable during the year. For the fiscal year ended March 31, 2016, the applicable interest rate was
7.5 percent.
(d) Member Contributions
Generally, Tier 3, 4, and 5 members must contribute 3 percent of their salary to the System. As a result
of Article 19 of the RSSL, eligible Tier 3 and 4 employees, with a membership date on or after July 27,
1976, who have ten or more years of membership or credited service with the System, are not required
to contribute. Members cannot be required to begin making contributions or to make increased
contributions beyond what was required when membership began. For Tier 6 members, the
contribution rate varies from 3 percent to 6 percent depending on salary. Generally, Tier 5 and 6
members are required to contribute for all years of service.
(e) Benefits
Tiers 1 and 2
Eligibility: Tier 1 members, with the exception of those retiring under special retirement plans, must
be at least age 55 to be eligible to collect a retirement benefit. There is no minimum service
requirement for Tier 1 members. Tier 2 members, with the exception of those retiring under special
retirement plans, must have five years of service and be at least age 55 to be eligible to collect a
retirement benefit. The age at which full benefits may be collected for Tier 1 is 55, and the full benefit
age for Tier 2 is 62.
Benefit Calculation: Generally, the benefit is 1.67 percent of final average salary for each year of
service if the member retires with less than 20 years. If the member retires with 20 or more years of
service, the benefit is 2 percent of final average salary for each year of service. Tier 2 members with
five or more years of service can retire as early as age 55 with reduced benefits. Tier 2 members age 55
or older with 30 or more years of service can retire with no reduction in benefits. As a result of
Article 19 of the RSSL, Tier 1 and Tier 2 members who worked continuously from April 1, 1999
through October 1, 2000 received an additional month of service credit for each year of credited service
they have at retirement, up to a maximum of 24 additional months.
Final average salary is the average of the wages earned in the three highest consecutive years of
employment. For Tier 1 members who joined on or after June 17, 1971, each year’s compensation
used in the final average salary calculation is limited to no more than 20% greater than the previous
year. For Tier 2 members, each year of final average salary is limited to no more than 20% greater
than the average of the previous two years.

NEW YORK STATE AND LOCAL RETIREMENT SYSTEM
Notes to Basic Financial Statements
March 31, 2016
14 (Continued)
Tiers 3, 4, and 5
Eligibility: Tier 3 and 4 members, with the exception of those retiring under special retirement plans,
must have five years of service and be at least age 55 to be eligible to collect a retirement benefit.
Tier 5 members, with the exception of those retiring under special retirement plans, must have
ten years of service and be at least age 55 to be eligible to collect a retirement benefit. The full benefit
age for Tiers 3, 4 and 5 is 62.
Benefit Calculation: Generally, the benefit is 1.67 percent of final average salary for each year of
service if the member retires with less than 20 years. If a member retires with between 20 and 30 years
of service, the benefit is 2 percent of final average salary for each year of service. If a member retires
with more than 30 years of service, an additional benefit of 1.5 percent of final average salary is
applied for each year of service over 30 years. Tier 3 and 4 members with five or more years of service
and Tier 5 members with ten or more years of service can retire as early as age 55 with reduced
benefits. Tier 3 and 4 members age 55 or older with 30 or more years of service can retire with no
reduction in benefits.
Final average salary is the average of the wages earned in the three highest consecutive years of
employment. For Tier 3, 4 and 5 members, each year’s compensation used in the final average salary
calculation is limited to no more than 10 percent greater than the average of the previous two years.
Tier 6
Eligibility: Tier 6 members, with the exception of those retiring under special retirement plans, must
have ten years of service and be at least age 55 to be eligible to collect a retirement benefit. The full
benefit age for Tier 6 is 63 for ERS members and 62 for PFRS members.
Benefit Calculation: Generally, the benefit is 1.67 percent of final average salary for each year of
service if the member retires with less than 20 years. If a member retires with 20 years of service, the
benefit is 1.75 percent of final average salary for each year of service. If a member retires with more
than 20 years of service, an additional benefit of 2 percent of final average salary is applied for each
year of service over 20 years. Tier 6 members with ten or more years of service can retire as early as
age 55 with reduced benefits.
Final average salary is the average of the wages earned in the five highest consecutive years of
employment. For Tier 6 members, each year’s compensation used in the final average salary
calculation is limited to no more than 10 percent greater than the average of the previous four years.
Special Plans
The 25-Year Plans allow a retirement after 25 years of service with a benefit of one-half of final
average salary, and the 20-Year Plans allow a retirement after 20 years of service with a benefit of
one-half of final average salary. These plans are available to certain PFRS members, sheriffs, and
correction officers.
NEW YORK STATE AND LOCAL RETIREMENT SYSTEM
Notes to Basic Financial Statements
March 31, 2016
15 (Continued)
Ordinary Disability Benefits
Generally, ordinary disability benefits, usually one-third of salary, are provided to eligible members
after ten years of service; in some cases, they are provided after five years of service.
Accidental Disability Benefits
For all eligible Tier 1 and Tier 2 ERS and PFRS members, the accidental disability benefit is a pension
of 75% of final average salary, with an offset for any Workers’ Compensation benefits received. The
benefit for eligible Tier 3, 4, 5 and 6 members is the ordinary disability benefit with the
years-of-service eligibility requirement dropped.
Ordinary Death Benefits
Death benefits are payable upon the death, before retirement, of a member who meets eligibility
requirements as set forth by law. The first $50,000 of an ordinary death benefit is paid in the form of
group term life insurance. The benefit is generally three times the member’s annual salary. For most
members, there is also a reduced post-retirement ordinary death benefit available.
Post-Retirement Benefit Increases
A cost-of-living adjustment is provided annually to: (i) all pensioners who have attained age 62 and
have been retired for five years; (ii) all pensioners who have attained age 55 and have been retired for
ten years; (iii) all disability pensioners, regardless of age, who have been retired for five years;
(iv) ERS recipients of an accidental death benefit, regardless of age, who have been receiving such
benefit for five years; and (v) the spouse of a deceased retiree receiving a lifetime benefit under an
option elected by the retiree at retirement. An eligible spouse is entitled to one-half the cost-of-living
adjustment amount that would have been paid to the retiree when the retiree would have met the
eligibility criteria. This cost-of-living adjustment is a percentage of the annual retirement benefit of
the eligible member as computed on a base benefit amount not to exceed $18,000 of the annual
retirement benefit. The cost-of-living percentage shall be 50% of the annual Consumer Price Index as
published by the U.S. Bureau of Labor, but cannot be less than 1 percent or exceed 3 percent.
(2) Summary of Significant Accounting Policies
(a) Basis of Accounting
The System maintains records and accounts, and prepares financial statements using the accrual basis
of accounting. Employer contributions are recognized when legally due, pursuant to statutory
requirements, in accordance with the terms of each plan. Member contributions are based on earned
member salaries and are recognized when due. Benefits, expenses, and refunds are recognized when
due and payable.
(b) Investments
Investments are recorded on a trade-date basis and reported at fair value. Fair value is defined as the
amount that can reasonably be expected to be received for an investment in a current sale between a
willing buyer and a willing seller. Due to the nature of investments, it is reasonable that changes in the
value of investments will occur in the near future, and such changes could materially affect the amounts

NEW YORK STATE AND LOCAL RETIREMENT SYSTEM
Notes to Basic Financial Statements
March 31, 2016
16 (Continued)
reported. The amounts reported as investments on the financial statements are allocated between ERS
and PFRS based on each system’s monthly average equity in the Fund. See note 4(c) for detailed
information on the System’s policy on investment valuation.
(c) Member Loan Programs
Members are entitled to participate in a loan program that allows them to borrow up to 75 percent of
their member contributions. Repayment of outstanding amounts is generally made through payroll
deductions within five years. The interest rate charged for member loans is fixed at 1 percent below
the actuarial interest rate at the time the loan is granted. The rate for loans issued during the fiscal year
ended March 31, 2016 was 6 percent.
(d) Capital Assets
Capital assets are capitalized at cost and depreciated on a straight-line basis over the related assets’
estimated useful lives.
During the fiscal year ended March 31, 2011, the System began capitalizing outlays associated with
its data imaging, filing, and storage system. This project was completed in the fiscal year ended March
31, 2016. The outlays for the project totaled $36.64 million.
During the fiscal year ended March 31, 2014, the System began capitalizing outlays associated with
its pension administration system redesign. As of March 31, 2016, capitalized outlays for the project
total $133.0 million. This project is currently ongoing and is expected to be completed in the fiscal
year ending March 31, 2019, at which time depreciation of the capitalized costs will begin.
(e) Contributions Receivable
Employers’ contributions receivable are presented net of withdrawals, refunds, advance employer
payments, and credits due employers. Receivable amounts from participating employers include
$32.91 million for amortization of retirement incentives, new plan adoptions, and retroactive
membership. The Retirement and Social Security Law includes several provisions related to the
amortization of employer contribution amounts. These include:
Chapter 260 of the Laws of 2004 authorized local employers to amortize over ten years, at
5 percent interest, the portion of their annual bill for the fiscal year ended 2007 that exceeded
10.5 percent of payroll. The amortized amount receivable from participating employers as of
March 31, 2016 is $2.65 million.

NEW YORK STATE AND LOCAL RETIREMENT SYSTEM
Notes to Basic Financial Statements
March 31, 2016
17 (Continued)
Chapter 57 of the Laws of 2010 authorized the State and local employers to amortize a portion
of their annual pension costs during periods when actuarial contribution rates exceed thresholds
established by the statute. Amortized amounts will be paid in equal annual installments over a
ten-year period including a rate of interest set by the Comptroller annually. Employers may
prepay these amounts at any time without penalty. The first payment will be due in the fiscal
year following the decision to amortize. Chapter 57 further provides that when contribution rates
fall below legally specified levels and all outstanding amortizations have been paid, employers
that elected to amortize will be required to pay additional moneys into reserve funds, specific to
each employer, which will be used to offset their contributions in the future. These reserve funds
will be invested separately from pension assets.
For the annual bill for the fiscal year ended 2011, the statutory amortization threshold was
9.5 percent of payroll for ERS and 17.5 percent for PFRS. The Comptroller set an interest rate
of 5 percent. The amortized amount receivable from the State as of March 31, 2016 is
$136.37 million and from local participating employers is $23.07 million.
For the annual bill for the fiscal year ended 2012, the statutory amortization threshold was
10.5 percent of payroll for ERS and 18.5 percent for PFRS. The Comptroller set an interest rate
of 3.75 percent. The amortized amount receivable from the State as of March 31, 2016 is
$354.88 million and from local participating employers is $131.07 million.
For the annual bill for the fiscal year ended 2013, the statutory amortization threshold was
11.5 percent of payroll for ERS and 19.5 percent for PFRS. The Comptroller set an interest rate
of 3 percent. The amortized amount receivable from the State as of March 31, 2016 is
$562.94 million and from local participating employers is $264.31 million.
For the annual bill for the fiscal year ended 2014, the statutory amortization threshold was
12.5 percent of payroll for ERS and 20.5 percent for PFRS. The Comptroller set an interest rate
of 3.67 percent. The amortized amount receivable from the State as of March 31, 2016 is
$777.93 million and from local participating employers is $177.69 million.
For the annual bill for the fiscal year ended 2015, the statutory amortization threshold was
13.5 percent of payroll for ERS and 21.5 percent for PFRS. The Comptroller set an interest rate
of 3.15 percent. The amortized amount receivable from the State as of March 31, 2016 is
$653.07 million and from local participating employers is $134 million.
For the annual bill for the fiscal year ended 2016, the statutory amortization threshold is
14.5 percent of payroll for ERS and 22.5 percent for PFRS. The Comptroller has set an interest
rate of 3.21 percent. The amortized amount receivable from the State as of March 31, 2016 is
$357.05 million and from local participating employers is $67.05 million.

NEW YORK STATE AND LOCAL RETIREMENT SYSTEM
Notes to Basic Financial Statements
March 31, 2016
18 (Continued)
The fiscal year 2014 Enacted Budget included an alternate contribution program (the Alternate
Contribution Stabilization Program) that provided certain participating employers with a
one-time election to amortize slightly more of their required contributions than would be
available for amortization under the 2010 legislation. In addition, the maximum payment period
was increased from ten years to twelve years. The election was available to: counties, cities,
towns, villages, BOCES, school districts and the four public health care centers operated in the
counties of Nassau, Westchester and Erie. The State was not eligible to participate in the
Alternate Contribution Stabilization Program.
For the annual bill for the fiscal year ended 2014, the alternative amortization threshold was
12 percent of payroll for ERS and 20 percent for PFRS. The Comptroller set an interest rate of
3.76 percent. The amortized amount receivable as of March 31, 2016 from participating
employers is $215.65 million.
For the annual bill for the fiscal year ended 2015, the alternative amortization threshold was
12 percent of payroll for ERS and 20 percent for PFRS. The Comptroller set an interest rate of
3.5 percent. The amortized amount receivable as of March 31, 2016 from participating
employers is $182.75 million.
For the annual bill for the fiscal year ended 2016, the alternative amortization threshold is
12.5 percent of payroll for ERS and 20.5 percent for PFRS. The Comptroller has set an interest
rate of 3.31 percent. The amortized amount receivable as of March 31, 2016 from participating
employers is $134.08 million.
(f) Use of Estimates
The preparation of financial statements in conformity with U.S. generally accepted accounting
principles requires management to make estimates and assumptions that affect the reported amounts
of assets and liabilities and the disclosure of contingencies. These estimates are subject to a certain
amount of uncertainty in the near term, which could result in changes in the values reported for those
assets in the combined statement of fiduciary net position. Estimates also affect the reported amounts
of income/additions and expenses/deductions during the reporting period. Actual results could differ
from these estimates.
(g) Recent Accounting Pronouncements
Governmental Accounting Standards Board (GASB) Statement No. 72, Fair Value Measurement and
Application, provides guidance for determining a fair value measurement for financial reporting
purposes. This Statement also provides guidance for applying fair value to certain investments and
disclosures related to all fair value measurements. The System will implement this standard beginning
with the financial statements as of and for the fiscal year ended March 31, 2017.
NEW YORK STATE AND LOCAL RETIREMENT SYSTEM
Notes to Basic Financial Statements
March 31, 2016
19 (Continued)
(3) System Reserves
The legally required reserves, as covered by provisions of the RSSL, are maintained by the System, are fully
funded as of March 31, 2016, and are described below:
Annuity Savings Funds – Funds in which contributions of Tier 1 and Tier 2 members are accumulated.
Annuity Reserve Funds – Funds from which member contribution annuities are paid.
Pension Accumulation Funds – Funds in which employer contributions and income from the
investments of the System are accumulated.
Pension Reserve Funds – Funds from which pensions are paid.
Designated Annuitant Funds – Funds from which beneficiary annuities are paid.
Loan Insurance Funds – Funds that provide loan insurance coverage for members with existing
no-default loan balances at time of death.
Group Life Insurance Plan Reserve – Reserves that provide group term death benefits not to exceed
$50,000, payable upon the death of eligible members.
Coescalation (COESC) Contribution Funds – Funds in which member contributions are accumulated.
These funds are transferred to the Pension Accumulation Fund at retirement.
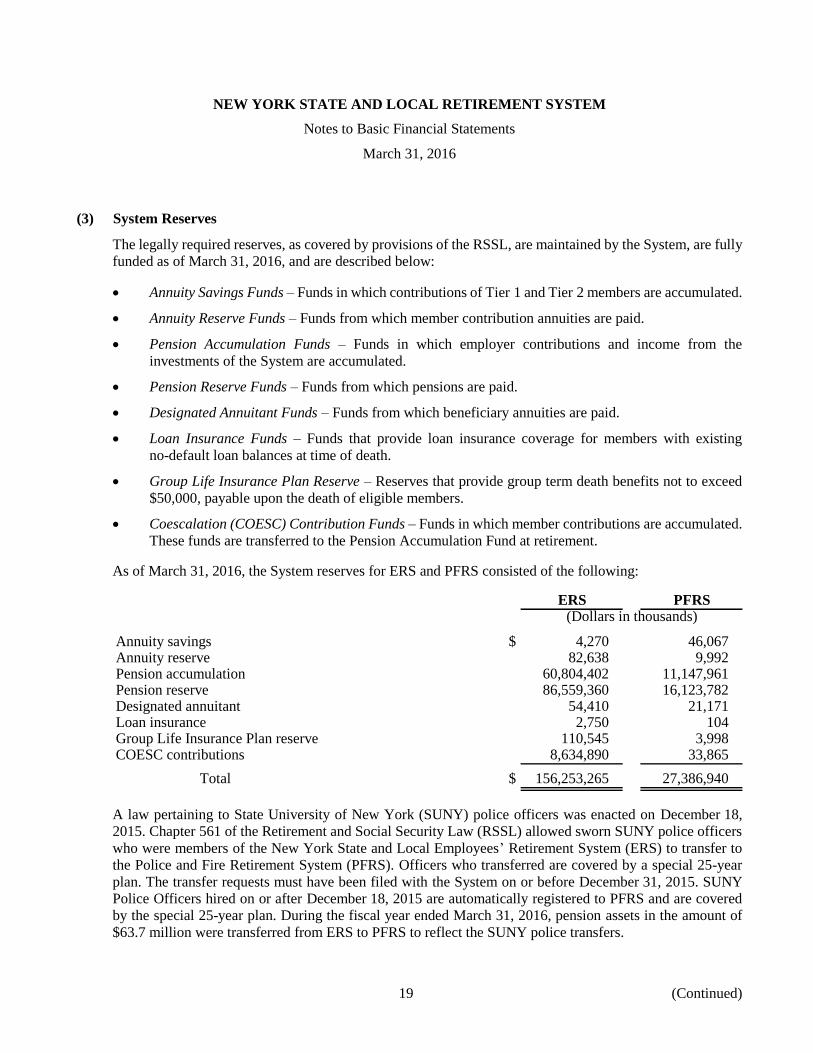
As of March 31, 2016, the System reserves for ERS and PFRS consisted of the following:
ERS PFRS(Dollars in thousands)
Annuity savings $ 4,270 46,067 Annuity reserve 82,638 9,992 Pension accumulation 60,804,402 11,147,961 Pension reserve 86,559,360 16,123,782 Designated annuitant 54,410 21,171 Loan insurance 2,750 104 Group Life Insurance Plan reserve 110,545 3,998 COESC contributions 8,634,890 33,865
Total $ 156,253,265 27,386,940
A law pertaining to State University of New York (SUNY) police officers was enacted on December 18,
2015. Chapter 561 of the Retirement and Social Security Law (RSSL) allowed sworn SUNY police officers
who were members of the New York State and Local Employees’ Retirement System (ERS) to transfer to
the Police and Fire Retirement System (PFRS). Officers who transferred are covered by a special 25-year
plan. The transfer requests must have been filed with the System on or before December 31, 2015. SUNY
Police Officers hired on or after December 18, 2015 are automatically registered to PFRS and are covered
by the special 25-year plan. During the fiscal year ended March 31, 2016, pension assets in the amount of
$63.7 million were transferred from ERS to PFRS to reflect the SUNY police transfers.

NEW YORK STATE AND LOCAL RETIREMENT SYSTEM
Notes to Basic Financial Statements
March 31, 2016
20 (Continued)
(4) Investments
(a) Investment Policy
The State Comptroller, currently Comptroller Thomas P. DiNapoli, is Trustee of the Fund. He is
directly accountable for the investment of Fund assets and for the oversight and management of the
Fund. Comptroller DiNapoli is responsible for implementing an asset allocation with an appropriate
balance of risk and return. The Trustee has put in place investment policies and practices designed to
ensure that investments are made for the exclusive benefit of the participants and beneficiaries of the
System, on whose behalf the assets of the Fund are invested, and that Fund investments are made with
the care that a prudent person serving in a like capacity and familiar with such matters would use in
the conduct of an enterprise of like character and with like aims – the “prudent person” and “exclusive
benefit” fiduciary standards of investment. Additionally, the Trustee has adopted policies and practices
to ensure that the Fund is managed with high levels of ethical conduct and transparency.
The Comptroller seeks the input of a wide range of internal and external advisors to determine the
allocation of assets and the appropriate investment choices for the Fund. Approximately sixty
employees work in the Office of the State Comptroller’s Division of Pension Investment and Cash
Management (PICM). The Comptroller appoints a Chief Investment Officer to oversee PICM
operations, manage staff, and supervise investments on a day-to-day basis. The Fund also relies on
advice from a network of outside advisors, consultants, and legal counsel, as well as the members of
independent external advisory committees appointed by the Comptroller. Outside advisors and internal
investment staff are part of the chain of approval that must recommend all investment decisions before
they reach the Comptroller for final approval.
The asset allocation is not intended to be an absolute limit on the type of investments that can be made
by the Comptroller or considered by staff. The Comptroller is expressly permitted to invest the assets
of the Fund pursuant to various provisions of State law, including, among others, sections 13, 176,
177, 178, and 313 of the RSSL, which also contains limitations on the amount and quality of
investments the Fund may hold in certain asset categories. Investments purchased pursuant to these
provisions are so-called “legal list” investments. In addition to the foregoing, section 177(9) of the
RSSL contains a provision that currently provides that up to 25 percent of the Fund’s assets may be
placed in investments not specifically authorized by any other provision of law. In making investments
under this provision, the Comptroller is subject to the prudent person and exclusive benefit provisions
in the statute. Subject to such standards, investments made under this provision must also, to the extent
reasonably possible, benefit the overall economic health of the State. Investments purchased pursuant
to section 177(9) of the RSSL are so-called “basket clause” investments.
The external advisory committees appointed by the Comptroller meet periodically throughout the year
and provide independent, expert assistance in guiding the Fund. These committees include: the
Advisory Council for the Retirement System; the Investment Advisory Committee; the Real Estate
Advisory Committee; the Actuarial Advisory Committee; and the Audit Advisory Committee.
NEW YORK STATE AND LOCAL RETIREMENT SYSTEM
Notes to Basic Financial Statements
March 31, 2016
21 (Continued)
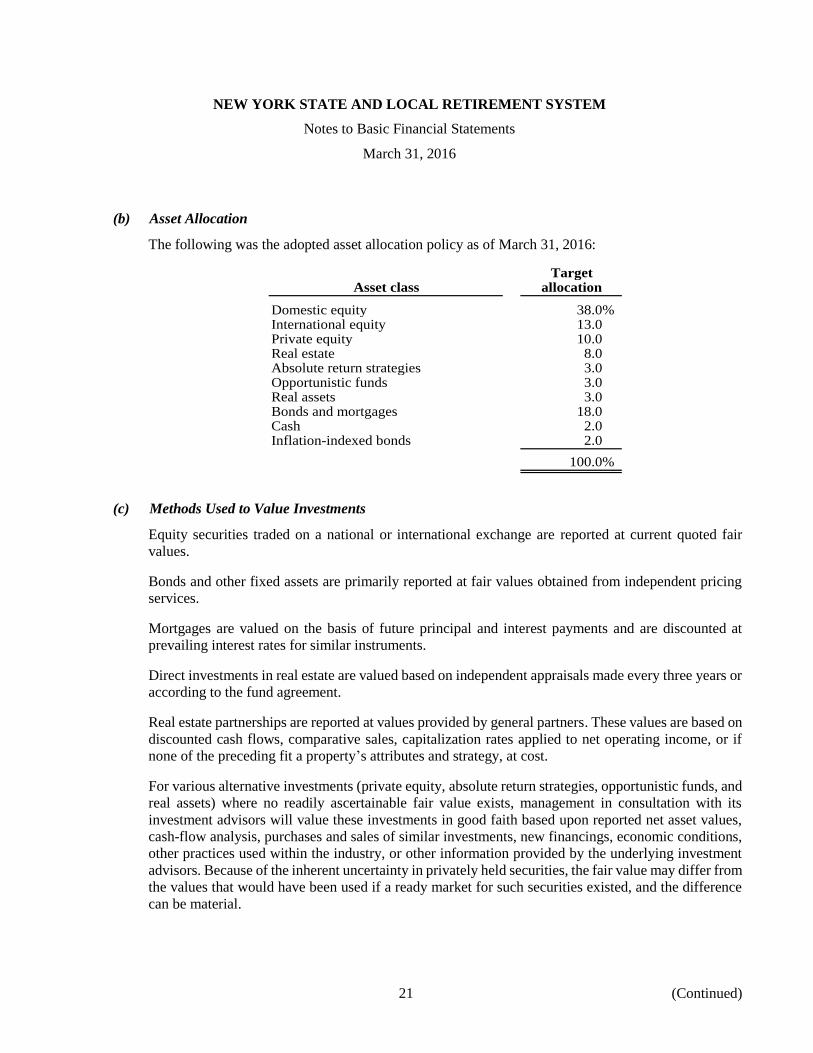
(b) Asset Allocation
The following was the adopted asset allocation policy as of March 31, 2016:
TargetAsset class allocation
Domestic equity 38.0%International equity 13.0Private equity 10.0Real estate 8.0Absolute return strategies 3.0Opportunistic funds 3.0Real assets 3.0Bonds and mortgages 18.0Cash 2.0Inflation-indexed bonds 2.0
100.0%
(c) Methods Used to Value Investments
Equity securities traded on a national or international exchange are reported at current quoted fair
values.
Bonds and other fixed assets are primarily reported at fair values obtained from independent pricing
services.
Mortgages are valued on the basis of future principal and interest payments and are discounted at
prevailing interest rates for similar instruments.
Direct investments in real estate are valued based on independent appraisals made every three years or
according to the fund agreement.
Real estate partnerships are reported at values provided by general partners. These values are based on
discounted cash flows, comparative sales, capitalization rates applied to net operating income, or if
none of the preceding fit a property’s attributes and strategy, at cost.
For various alternative investments (private equity, absolute return strategies, opportunistic funds, and
real assets) where no readily ascertainable fair value exists, management in consultation with its
investment advisors will value these investments in good faith based upon reported net asset values,
cash-flow analysis, purchases and sales of similar investments, new financings, economic conditions,
other practices used within the industry, or other information provided by the underlying investment
advisors. Because of the inherent uncertainty in privately held securities, the fair value may differ from
the values that would have been used if a ready market for such securities existed, and the difference
can be material.

NEW YORK STATE AND LOCAL RETIREMENT SYSTEM
Notes to Basic Financial Statements
March 31, 2016
22 (Continued)
The Fund trades in foreign exchange contracts in the normal course of its investing activities in order
to manage exposure to market risks. Such contracts, which are generally for a period of less than one
year, are used to purchase and sell foreign currency at a guaranteed future price. These contracts are
recorded at fair value using foreign currency exchange rates.
(d) Rates of Return
In accordance with U.S. generally accepted accounting principles, the money-weighted rate of return
on plan investments, net of investment expenses, was 0.03 percent for the year ended March 31, 2016.
For internal purposes, the System evaluates investment performance using the time-weighted rate of
return, gross of certain investment fees, which was 0.19 percent for the year ended March 31, 2016.
(5) Deposit and Investment Risk Disclosure
(a) Custodial Credit Risk for Investments
Investment securities are exposed to custodial credit risk if the securities are not registered in the name
of the Fund, or are held either by the counterparty or the counterparty’s trust department or agent, but
not in the name of the Fund.
Equity and fixed income investments owned directly by the Fund, which trade in the United States
(U.S.) markets, are generally held by the Fund’s custodian, in separate accounts, in the name of the
Comptroller of the State of New York in Trust for the Fund. These securities are typically held in
electronic form through the Federal Book Entry System and by the Depository Trust Company (DTC)
and its subsidiaries acting as an agent of the Fund’s custodian bank. Securities held directly by the
Fund that trade in markets outside the U.S. are held by a subsidiary of the Fund’s custodian bank in
the local market, a bank performing custodial services in the local market acting as an agent for the
Fund’s custodian bank, and in some foreign markets, the securities are held in electronic form by a
DTC subsidiary or an organization similar to DTC. Fixed income investments that are not held by the
Fund’s custodian are held by third-party administrators in the name of the Comptroller of the State of
New York in Trust for the Fund.
Equity investments held indirectly by the Fund via limited partnerships, commingled investment funds,
joint ventures, and other similar vehicles are held in custody by an organization contracted by the
general partner and/or the investment management firm responsible for the management of each
investment organization.
Title to real estate invested in by the Fund is held either by a real estate holding company or a real
estate investment fund. Ownership of mortgage assets is documented by the Fund’s holding of original
mortgage and note documents by the Office of the State Comptroller’s PICM.
(b) Custodial Credit Risk for Deposits
Deposits are exposed to custodial credit risk if the deposits are not covered by depository insurance or
the deposits are uncollateralized, collateralized with securities held by the pledging financial
institution, or collateralized with securities held by the pledging institution’s trust department or agent,
but not in the name of the Fund.

NEW YORK STATE AND LOCAL RETIREMENT SYSTEM
Notes to Basic Financial Statements
March 31, 2016
23 (Continued)
In accordance with existing policies and procedures, the PICM in the Office of the State Comptroller
monitors deposit balances for the purpose of determining collateralization levels. Collateral sufficient
to cover all uninsured deposits is held at the State’s custodial bank.
(c) Interest Rate Risk
The System is subject to interest rate risk, which is the risk that changes in market interest rates will
adversely affect the fair value of the Fund’s fixed income securities. Pursuant to the Fund’s investment
policies and procedures and to address changing economic factors and their impact on various sectors
of the economy, the Division’s staff meets regularly to discuss the investment strategy for the fixed
income portfolio. Several factors are taken into account when formulating this strategy, including
sector weightings and the current duration of the portfolio.
The price volatility of the Fund’s fixed income holdings is measured by duration. Effective duration
is a measure of the price sensitivity of a bond to interest rate movements. Effective duration follows
the concept that interest rates and bond prices move in opposite directions.
As of March 31, 2016, the duration of the fixed income portfolio is as follows (dollars in thousands):
Percentageof bond Effective
Bond category Fair value portfolio duration(In years)
Core portfolio:Treasury $ 5,599,754 12.5% 8.66Federal agency 2,033,357 4.6 5.23Corporate 14,378,582 32.2 6.39Asset-backed 2,382,686 5.3 1.78Commercial mortgage-backed 1,716,539 3.8 2.87Mortgage-backed 4,974,643 11.1 3.54Collateralized loan obligations 2,947,060 6.6 0.02Municipal bonds 382,373 0.9 10.55
Core portfolio 34,414,994 77.0 5.27
Treasury Inflation-ProtectedSecurities (TIPS) 6,658,845 14.9 5.52
Externally managed funds:BlackRock Fixed Income 1,997,256 4.5 2.95Neuberger Berman Fixed Income 1,022,589 2.3 2.39Semper Capital Management 247,158 0.6 1.32Smith Graham 320,358 0.7 3.50
Total $ 44,661,200 100.0%

NEW YORK STATE AND LOCAL RETIREMENT SYSTEM
Notes to Basic Financial Statements
March 31, 2016
24 (Continued)
(d) Credit Risk of Debt Securities
Fixed income obligations purchased pursuant to section 177(1-a) of the RSSL must be investment
grade at the time of their acquisition. A bond is considered investment grade if its credit rating is Baa
or higher by Moody’s or BBB– or higher by Standard & Poor’s. Fixed income obligations purchased
pursuant to section 177(9) of the RSSL, the “basket clause,” are subject to a standard of prudence. As
of March 31, 2016, credit ratings, obtained from several industry rating services, for the fixed income
portfolio are as follows (dollars in thousands):
Percentage ofQuality rating Fair value fair value
AAA $ 24,233,307 54.25%AA 4,237,770 9.49A 5,820,883 13.03BAA 5,703,566 12.77BBB 802,548 1.80BA 542,116 1.21BB 61,920 0.14B 132,829 0.30CAA 80,494 0.18CA 2,479 0.01C 3,196 0.01Not rated 20,247 0.05
Externally managed funds:1
Black Rock Fixed IncomeRange AAA to C & Not Rated 1,997,256 4.47
Neuberger Berman Fixed IncomeRange AAA to CAA & Not Rated 1,022,589 2.29
Total $ 44,661,200 100.00%
1 These externally managed funds are part of the “basket clause” investments described in note 4(a).
Approximately 75 percent of the holdings in each of these funds are rated as non investment grade or
not rated. The remaining holdings in these funds as rated investment grade or above.
(e) Concentration of Credit Risk
Concentration of credit risk is the risk of loss attributed to the magnitude of the Fund’s investment in
a single issuer.
As of March 31, 2016, the System did not hold any investments in any one issuer that totaled 5 percent
or more of the pension plan’s fiduciary net position. Investments issued or explicitly guaranteed by
the U.S. government and pooled investments are excluded.

NEW YORK STATE AND LOCAL RETIREMENT SYSTEM
Notes to Basic Financial Statements
March 31, 2016
25 (Continued)
Issuer limits for investments held by the Fund are established by law and by policy guidelines adopted
by the PICM.
Short-term fixed income investments not purchased pursuant to section 177(9) of the RSSL are
generally limited to the following investment types maturing in one year or less:
Obligations for which the full faith and credit of the U.S. is pledged to provide payment of
interest and principal.
Obligations issued by any Federal Home Loan Bank or obligations fully guaranteed as to
principal and interest by the Federal National Mortgage Association or Federal Home Loan
Mortgage Corporation.
Commercial paper that has received the highest rating from two nationally recognized rating
services. A maximum of $1 billion of the short-term portfolio may be invested in any one
commercial paper issuer.
Simultaneous purchase and sale of U.S. Treasury obligations may be executed with Primary
Government Dealers. A maximum of $200 million may be invested with any one Primary
Government Dealer.
Corporate and asset-backed securities (ABS) that are rated investment grade by two nationally
recognized rating services. ABS must have a weighted average life of one year or less.
Short-term fixed income investments purchased pursuant to section 177(9) of the RSSL are subject to
the specific prudent person investor and exclusive benefit provisions of this statute. Subject to such
standards, investments made under section 177(9) must, to the extent reasonably possible, benefit the
overall economic health of the State.
Fixed income investments not purchased pursuant to section 177(9) of the RSSL are generally limited
to the following investment types with maturities longer than one year:
Obligations for which the full faith and credit of the U.S. is pledged to provide payment of
principal and interest.
Obligations payable in U.S. dollars issued by any department, agency, or political subdivision
of the U.S. government or issued by any corporation, company, or other issuer of any kind or
description created or existing under the laws of the U.S., any state of the U.S., the District of
Columbia, or the Commonwealth of Puerto Rico, and obligations payable in U.S. funds of
Canada or any province or city of Canada, provided each obligation at the time of investment
shall be rated investment grade by two nationally recognized rating services (or by one
nationally recognized rating service in the event only one such service rates such obligation).
The aggregate investment by the Fund in the obligations of any one issuer shall not exceed 2%
of the assets of the Fund or 5 percent of the direct liabilities of the issuer.

NEW YORK STATE AND LOCAL RETIREMENT SYSTEM
Notes to Basic Financial Statements
March 31, 2016
26 (Continued)
Interest-bearing obligations payable in U.S. funds, which at the time of investment are rated in
one of the three highest rating grades by each rating service approved by the New York State
Department of Financial Services that has rated such obligations. The aggregate amount
invested in the obligations of any single issuer may not exceed 1 percent of the assets of the
Fund.
Bonds issued or guaranteed by the State of Israel and approved by the United States Comptroller
of the Currency, payable in U.S. dollars, not to exceed 5 percent of the assets of the Fund.
Obligations issued or guaranteed by the International Bank for Reconstruction and Development
(not to exceed 5 percent of the assets of the Fund), the Inter-American Development Bank, the
Asian Development Bank, or the African Development Bank.
Fixed income investments purchased pursuant to section 177(9) of the RSSL are subject to the specific
prudent person investor and exclusive benefit provisions of this statute. Subject to such standards,
investments made under section 177(9) must, to the extent reasonably possible, benefit the overall
economic health of the State.
(f) Foreign Currency Risk
Foreign currency risk is the risk that changes in exchange rates will adversely affect the fair value of
an investment or a deposit. The Fund has exposure through direct investments in international equities,
international equity commingled funds, international fixed income investments, international real
estate investments, international absolute return strategies, international private equity investments,
international opportunistic funds, and international real asset funds. The Fund’s asset allocation and
investment policies allow for active and passive investments in international securities. The Fund
permits the managers of direct investments in international equities to use forward currency contracts
to manage their exposure to foreign currencies relative to the U.S. dollar. Where the Fund participates
in commingled funds, limited partnerships, or other investment arrangements, the decision whether or
not to use forward currency contracts to manage their foreign currency exposure is left up to the
individual investment managers. To address the impact of changes in exchange rates, only forward
foreign exchange contracts of one year or less are allowed when used to lessen portfolio volatility or
hedge the portfolio’s currency exposure.
NEW YORK STATE AND LOCAL RETIREMENT SYSTEM
Notes to Basic Financial Statements
March 31, 2016
27 (Continued)
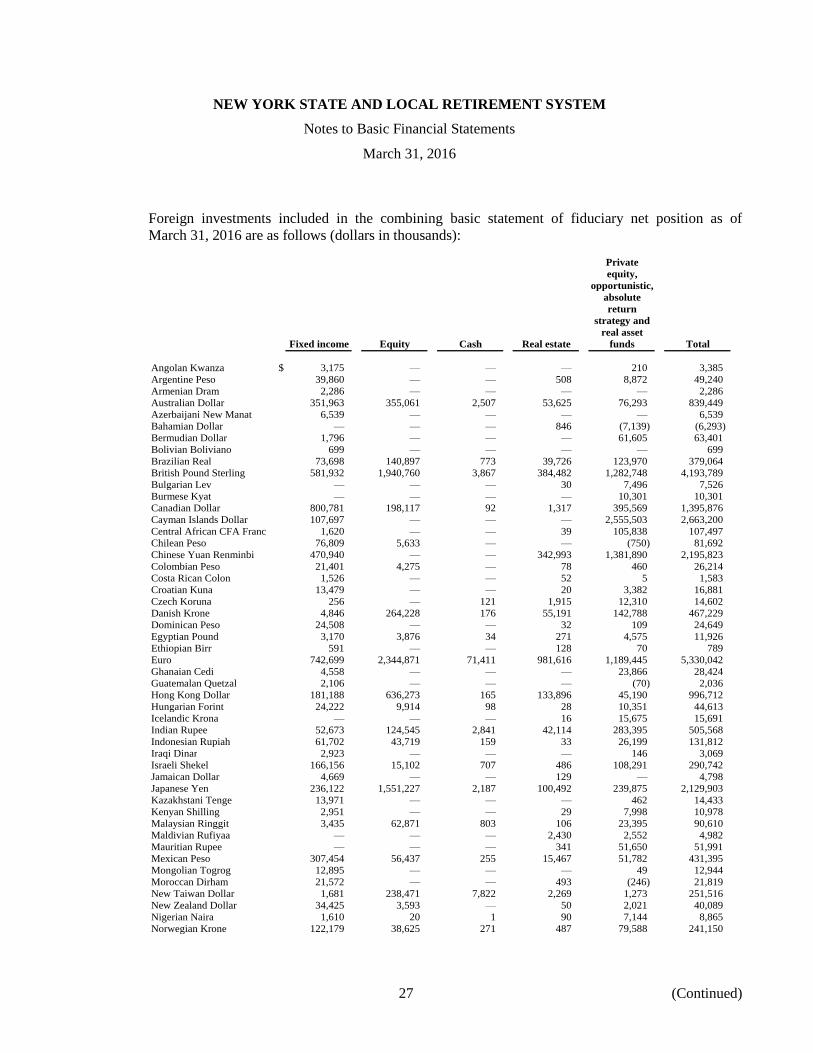
Foreign investments included in the combining basic statement of fiduciary net position as of
March 31, 2016 are as follows (dollars in thousands):
Private
equity,
opportunistic,
absolute
return
strategy and
real asset
Fixed income Equity Cash Real estate funds Total
Angolan Kwanza $ 3,175 — — — 210 3,385
Argentine Peso 39,860 — — 508 8,872 49,240
Armenian Dram 2,286 — — — — 2,286
Australian Dollar 351,963 355,061 2,507 53,625 76,293 839,449
Azerbaijani New Manat 6,539 — — — — 6,539
Bahamian Dollar — — — 846 (7,139) (6,293)
Bermudian Dollar 1,796 — — — 61,605 63,401
Bolivian Boliviano 699 — — — — 699
Brazilian Real 73,698 140,897 773 39,726 123,970 379,064
British Pound Sterling 581,932 1,940,760 3,867 384,482 1,282,748 4,193,789
Bulgarian Lev — — — 30 7,496 7,526
Burmese Kyat — — — — 10,301 10,301
Canadian Dollar 800,781 198,117 92 1,317 395,569 1,395,876
Cayman Islands Dollar 107,697 — — — 2,555,503 2,663,200
Central African CFA Franc 1,620 — — 39 105,838 107,497
Chilean Peso 76,809 5,633 — — (750) 81,692
Chinese Yuan Renminbi 470,940 — — 342,993 1,381,890 2,195,823
Colombian Peso 21,401 4,275 — 78 460 26,214
Costa Rican Colon 1,526 — — 52 5 1,583
Croatian Kuna 13,479 — — 20 3,382 16,881
Czech Koruna 256 — 121 1,915 12,310 14,602
Danish Krone 4,846 264,228 176 55,191 142,788 467,229
Dominican Peso 24,508 — — 32 109 24,649
Egyptian Pound 3,170 3,876 34 271 4,575 11,926
Ethiopian Birr 591 — — 128 70 789
Euro 742,699 2,344,871 71,411 981,616 1,189,445 5,330,042
Ghanaian Cedi 4,558 — — — 23,866 28,424
Guatemalan Quetzal 2,106 — — — (70) 2,036
Hong Kong Dollar 181,188 636,273 165 133,896 45,190 996,712
Hungarian Forint 24,222 9,914 98 28 10,351 44,613
Icelandic Krona — — — 16 15,675 15,691
Indian Rupee 52,673 124,545 2,841 42,114 283,395 505,568
Indonesian Rupiah 61,702 43,719 159 33 26,199 131,812
Iraqi Dinar 2,923 — — — 146 3,069
Israeli Shekel 166,156 15,102 707 486 108,291 290,742
Jamaican Dollar 4,669 — — 129 — 4,798
Japanese Yen 236,122 1,551,227 2,187 100,492 239,875 2,129,903
Kazakhstani Tenge 13,971 — — — 462 14,433
Kenyan Shilling 2,951 — — 29 7,998 10,978
Malaysian Ringgit 3,435 62,871 803 106 23,395 90,610
Maldivian Rufiyaa — — — 2,430 2,552 4,982
Mauritian Rupee — — — 341 51,650 51,991
Mexican Peso 307,454 56,437 255 15,467 51,782 431,395
Mongolian Togrog 12,895 — — — 49 12,944
Moroccan Dirham 21,572 — — 493 (246) 21,819
New Taiwan Dollar 1,681 238,471 7,822 2,269 1,273 251,516
New Zealand Dollar 34,425 3,593 — 50 2,021 40,089
Nigerian Naira 1,610 20 1 90 7,144 8,865
Norwegian Krone 122,179 38,625 271 487 79,588 241,150

NEW YORK STATE AND LOCAL RETIREMENT SYSTEM
Notes to Basic Financial Statements
March 31, 2016
28 (Continued)
Private
equity,
opportunistic,
absolute
return
strategy and
real asset
Fixed income Equity Cash Real estate funds Total
Pakistani Rupee $ 4,908 — — — — 4,908
Panamanian Balboa 14,024 — — 29 392 14,445
Paraguayan Guarani 2,417 — — — — 2,417
Peruvian Nuevo Sol 13,461 — 1 46 7,923 21,431
Philippine Peso 13,680 14,603 7 — 7,297 35,587
Polish Zloty — 26,438 191 4,175 29,925 60,729
Qatar Rial — 3,113 — 60 — 3,173
Romanian Leu 4,169 — — 368 4,373 8,910
Russian Ruble 27,728 — — 3,193 56,544 87,465
Serbian Dinar 6,081 — — — — 6,081
Singapore Dollar 4,456 160,338 39 1,807 40,962 207,602
South African Rand 50,004 163,508 641 492 30,978 245,623
South Korean Won 342,424 501,549 552 2,941 103,981 951,447
Sri Lankan Rupee 20,794 — — 20 262 21,076
Swedish Krona — 351,810 422 181,722 2,549 536,503
Swiss Franc 46,562 781,752 392 1,115 235,901 1,065,722
Thai Baht — 56,558 — 6,783 (235) 63,106
Tunisian Dinar 1,420 — — — — 1,420
Turkish Lira New 123,078 39,705 57 4,468 54,446 221,754
Ukrainian Hryvnia 12,745 — — 1,598 2,279 16,622
United Arab Emirates Dirham 24,869 12,986 14 11,300 1,824 50,993
Uruguayan Peso 7,286 — — 35 — 7,321
Venezuelan Bolivar 22,764 — — 2,327 10,603 35,694
Vietnamese Dong 4,365 — — 9 4,317 8,691
West African CFA Franc 14,239 — — — — 14,239
Zambian Kwacha 1,520 — — — 367 1,887
Other 4,824 — — 712 (364) 5,172
Total subject to foreign
currency risk 5,358,581 10,150,875 96,606 2,385,025 8,930,460 26,921,547
Commingled international
equity in U.S. Dollars — 14,947,581 — — — 14,947,581
Foreign investments in
U.S. Dollars — 4,112,880 — 4,415 4,850,759 8,968,054
Total foreign
investments $ 5,358,581 29,211,336 96,606 2,389,440 13,781,219 50,837,182
(6) Derivatives
A derivative is generally defined as an investment contract or security with a value that depends on, or is
derived from, the value of an underlying asset, reference rate, or financial index. The System has classified
the following as derivatives:
Forward Currency Contracts
The System may enter into forward currency contracts to manage exposure to fluctuations in foreign currency
exchange rates on portfolio holdings. The System also enters into forward exchange contracts to settle future
obligations. A forward exchange contract is a commitment to purchase or sell a foreign currency at a future
date at a negotiated forward rate. A contract is classified as a forward contract when the settlement date is
NEW YORK STATE AND LOCAL RETIREMENT SYSTEM
Notes to Basic Financial Statements
March 31, 2016
29 (Continued)
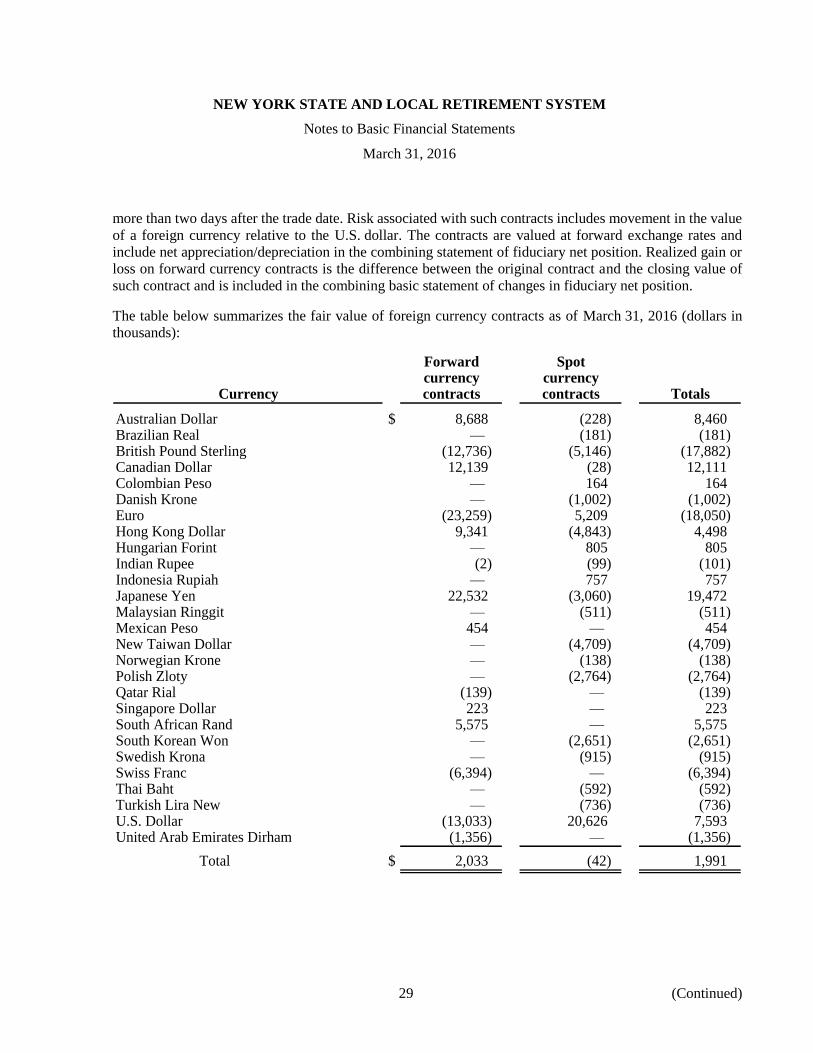
more than two days after the trade date. Risk associated with such contracts includes movement in the value
of a foreign currency relative to the U.S. dollar. The contracts are valued at forward exchange rates and
include net appreciation/depreciation in the combining statement of fiduciary net position. Realized gain or
loss on forward currency contracts is the difference between the original contract and the closing value of
such contract and is included in the combining basic statement of changes in fiduciary net position.
The table below summarizes the fair value of foreign currency contracts as of March 31, 2016 (dollars in
thousands):
Forward Spotcurrency currency
Currency contracts contracts Totals
Australian Dollar $ 8,688 (228) 8,460 Brazilian Real — (181) (181) British Pound Sterling (12,736) (5,146) (17,882) Canadian Dollar 12,139 (28) 12,111 Colombian Peso — 164 164 Danish Krone — (1,002) (1,002) Euro (23,259) 5,209 (18,050) Hong Kong Dollar 9,341 (4,843) 4,498 Hungarian Forint — 805 805 Indian Rupee (2) (99) (101) Indonesia Rupiah — 757 757 Japanese Yen 22,532 (3,060) 19,472 Malaysian Ringgit — (511) (511) Mexican Peso 454 — 454 New Taiwan Dollar — (4,709) (4,709) Norwegian Krone — (138) (138) Polish Zloty — (2,764) (2,764) Qatar Rial (139) — (139) Singapore Dollar 223 — 223 South African Rand 5,575 — 5,575 South Korean Won — (2,651) (2,651) Swedish Krona — (915) (915) Swiss Franc (6,394) — (6,394) Thai Baht — (592) (592) Turkish Lira New — (736) (736) U.S. Dollar (13,033) 20,626 7,593 United Arab Emirates Dirham (1,356) — (1,356)
Total $ 2,033 (42) 1,991

NEW YORK STATE AND LOCAL RETIREMENT SYSTEM
Notes to Basic Financial Statements
March 31, 2016
30 (Continued)
(7) Securities Lending Program
Section 177-d of the RSSL authorizes the Fund to enter into security loan agreements with broker/dealers
and state or national banks. The Fund has designated its master custodian bank (the custodian) to manage a
securities lending program. This program is subject to a written contract between the Fund and the custodian
who acts as securities lending agent for the Fund. The custodian is authorized to lend securities within the
borrower limits and guidelines established by the Fund. Types of collateral received from borrowers for
securities loaned are cash, government securities, and obligations of federal agencies. The custodian is
authorized to invest the cash collateral in short-term investments that are legal for the Fund. These include
domestic corporate and bank notes, U.S. Treasury obligations, obligations of federal agencies, repurchase
agreements, and specific asset-backed securities. All rights of ownership to securities pledged as collateral
remain with the borrower except in the event of default. As of March 31, 2016, there were no violations of
legal or contractual provisions. The Fund did not experience any losses resulting from the default of a
borrower or lending agent during the year ended March 31, 2016.
The Fund lends fixed income, domestic equity, and international equity securities to approved broker/dealers.
Collateral for securities loaned equals 102 percent of fair value for domestic securities and 105% for
international securities. Credit risk associated with the investment of cash collateral pledged by borrowers is
mitigated by the maturity restrictions, percentage limitations, and rating requirements for individual asset
classes included in the Fund’s reinvestment guidelines. The custodian acknowledges responsibility to
reimburse the Fund for losses that might arise from managing the program in a manner inconsistent with the
contract. The Fund manages its market risk by recording investments at fair value daily and maintaining the
value of the collateral held by the Fund in excess of the value of the securities loaned. As of March 31, 2016,
the fair value of securities on loan was $13.66 billion. The associated collateral was $13.99 billion, of which
$11.76 billion was cash collateral and $2.23 billion was securities. The cash collateral has been reinvested
in other instruments, which had a fair value of $11.73 billion as of March 31, 2016. The securities lending
obligations were $11.74 billion. The unrealized loss in invested cash collateral on March 31, 2016 was
$8.28 million, which is reported in the combining basic statement of changes in fiduciary net position as part
of “Net depreciation in fair value of investments.”
All open security loans can be terminated on demand by either the Fund or the borrower. To provide
sufficient liquidity, the policy of the Fund is to maintain a minimum of 10% collateral in overnight
investments. While the Fund’s Securities Lending Investment Guidelines allow investments of up to a
maximum of three years for U.S. Treasury and federal agency obligations and one year for all other
investments, the average term of open security loans at March 31, 2016 was 35 days. All loans were open
loans. There were no direct matching loans.
On March 4, 2013, a securities lending collateral deficiency was realized in the amount of $127.14 million
and agreed to be repaid to the lending agent through future earnings commencing with revenues earned
effective April 1, 2013 and continuing in the future until the deficiency is reimbursed in full. The securities
lending collateral deficiency is due to a loss in the reinvestment of cash collateral. Investment guidelines
have been strengthened to mitigate future losses. At March 31, 2016, the balance of the securities lending
collateral deficiency was $20.33 million.
The collateral pool is valued at fair value obtained from independent pricing services.

NEW YORK STATE AND LOCAL RETIREMENT SYSTEM
Notes to Basic Financial Statements
March 31, 2016
31 (Continued)
(8) Net Pension Liability of Participating Employers
The components of the net pension liability of the employers participating in the system as of March 31, 2016, were as follows:
Employees’ Police and fireretirement retirement
system system Total(Dollars in thousands)
Employers’ total pension liability $ 172,303,544 30,347,727 202,651,271 Fiduciary net position 156,253,265 27,386,940 183,640,205
Employers’ net pensionliability $ 16,050,279 2,960,787 19,011,066
Ratio of fiduciary net position to theemployers’ total pension liability 90.7% 90.2% 90.6%
(a) Actuarial Assumptions
The total pension liability at March 31, 2016 was determined by using an actuarial valuation as of April 1, 2015, with update procedures used to roll forward the total pension liability to March 31, 2016. The actuarial valuation used the following actuarial assumptions:
ERS PFRS
Inflation 2.5% 2.5%Salary increases 3.8 4.5Investment rate of return (net of investment expense,
including inflation) 7.0 7.0Cost of living adjustments 1.3% 1.3%
Annuitant mortality rates are based on April 1, 2010 – March 31, 2015 System experience with adjustments for mortality improvements based on the Society of Actuaries’ Scale MP-2014.
The actuarial assumptions used in the April 1, 2015 valuation are based on the results of an actuarial experience study for the period April 1, 2010 – March 31, 2015.
The long-term expected rate of return on pension plan investments was determined using a building-block method in which best-estimate ranges of expected future real rates of return (expected return, net of investment expenses and inflation) are developed for each major asset class. These ranges are combined to produce the long-term expected rate of return by weighting the expected future real rates of return by the target asset allocation percentage and by adding expected inflation.

NEW YORK STATE AND LOCAL RETIREMENT SYSTEM
Notes to Basic Financial Statements
March 31, 2016
32 (Continued)
Best estimates of arithmetic real rates of return for each major asset class included in the target asset
allocation as of March 31, 2016 (see Investment policy – note 4(a)) are summarized below:
Long-termexpected real
Asset class rate of return
Domestic equity 7.30%International equity 8.55Private equity 11.00Real estate 8.25Absolute return strategies 6.75Opportunistic portfolio 8.60Real assets 8.65Bonds and mortgages 4.00Cash 2.25Inflation-indexed bonds 4.00
(b) Discount Rate
The discount rate used to calculate the total pension liability was 7.0 percent. The projection of cash
flows used to determine the discount rate assumes that contributions from plan members will be made
at the current contribution rates and that contributions from employers will be made at statutorily
required rates, actuarially. Based upon the assumptions, the System’s fiduciary net position was
projected to be available to make all projected future benefit payments of current plan members.
Therefore, the long-term expected rate of return on pension plan investments was applied to all periods
of projected benefit payments to determine the total pension liability.
(c) Sensitivity of the Net Pension Liability to the Discount Rate Assumption
The following presents the current-period net pension liability of the employers calculated using the
current-period discount rate assumption of 7.0 percent, as well as what the net pension liability (asset)
would be if it were calculated using a discount rate that is one percentage-point lower (6.0 percent) or
one percentage-point higher (8.0 percent) than the current assumption (dollars in thousands):
One percent Current One percentdecrease assumption increase(6.0%) (7.0%) (8.0%)
ERS net pension liability (asset) $ 36,192,213 16,050,279 (968,795) PFRS net pension liability (asset) 6,613,230 2,960,787 (100,751)

NEW YORK STATE AND LOCAL RETIREMENT SYSTEM
Notes to Basic Financial Statements
March 31, 2016
33
(9) Federal Income Tax Status
ERS and PFRS are qualified defined benefit retirement plans under section 401(a) of the Internal Revenue
Code and are exempt from federal income taxes. ERS and PFRS last received favorable determination letters
from the Internal Revenue Service dated August 28, 2014 stating that ERS and PFRS are in compliance with
the applicable requirements of the Internal Revenue Code. Therefore, no provision for income taxes has been
included in the System’s financial statements.
(10) Commitments
As of March 31, 2016, the System had contractual commitments totaling $11.45 billion to fund future private
equity investments, $5.19 billion to fund future real estate investments, $1.67 billion for opportunistic funds,
$40 million to fund absolute return strategies and $720 million to fund future real asset investments. Future
commitments will be funded over the commitment period through transaction income including
distributions, redemptions, and maturities.
(11) Contingencies
The System is a defendant in litigation proceedings involving individual benefit payments, participant
eligibility, and other issues arising from its normal activities. Management of the System believes there will
be no material adverse effect on the basic financial statements as a result of the outcome of these matters.

REQUIRED SUPPLEMENTARY INFORMATION
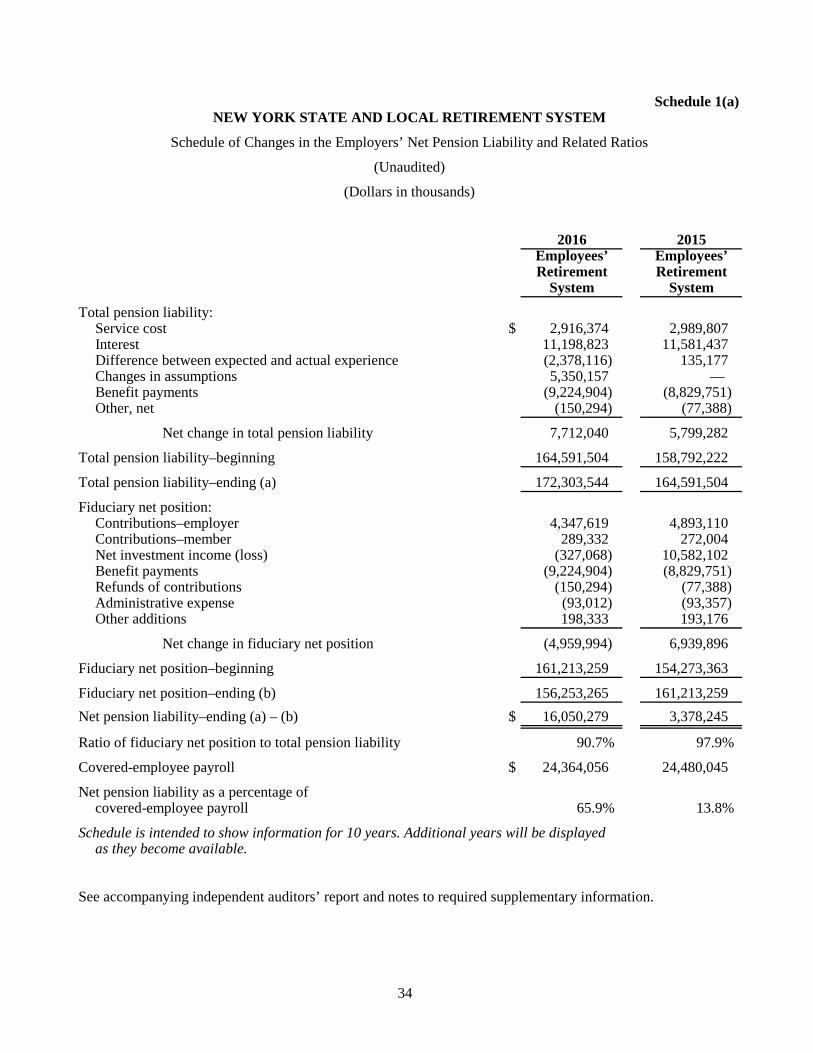
34
Schedule 1(a)NEW YORK STATE AND LOCAL RETIREMENT SYSTEM
Schedule of Changes in the Employers’ Net Pension Liability and Related Ratios
(Unaudited)
(Dollars in thousands)
2016 2015Employees’ Employees’Retirement Retirement
System System
Total pension liability:Service cost $ 2,916,374 2,989,807 Interest 11,198,823 11,581,437 Difference between expected and actual experience (2,378,116) 135,177 Changes in assumptions 5,350,157 — Benefit payments (9,224,904) (8,829,751) Other, net (150,294) (77,388)
Net change in total pension liability 7,712,040 5,799,282
Total pension liability–beginning 164,591,504 158,792,222
Total pension liability–ending (a) 172,303,544 164,591,504
Fiduciary net position:Contributions–employer 4,347,619 4,893,110 Contributions–member 289,332 272,004 Net investment income (loss) (327,068) 10,582,102 Benefit payments (9,224,904) (8,829,751) Refunds of contributions (150,294) (77,388) Administrative expense (93,012) (93,357) Other additions 198,333 193,176
Net change in fiduciary net position (4,959,994) 6,939,896
Fiduciary net position–beginning 161,213,259 154,273,363
Fiduciary net position–ending (b) 156,253,265 161,213,259 Net pension liability–ending (a) – (b) $ 16,050,279 3,378,245
Ratio of fiduciary net position to total pension liability 90.7% 97.9%
Covered-employee payroll $ 24,364,056 24,480,045
Net pension liability as a percentage ofcovered-employee payroll 65.9% 13.8%
Schedule is intended to show information for 10 years. Additional years will be displayedas they become available.
See accompanying independent auditors’ report and notes to required supplementary information.

35
Schedule 1(b)NEW YORK STATE AND LOCAL RETIREMENT SYSTEM
Schedule of Changes in the Employers’ Net Pension Liability and Related Ratios
(Unaudited)
(Dollars in thousands)
2016 2015Police and Police and
Fire FireRetirement Retirement
System System
Total pension liability:Service cost $ 628,863 625,648 Interest 1,935,222 1,997,215 Difference between expected and actual experience (537,163) 39,833 Changes in assumptions 1,531,662 — Benefit payments (1,683,580) (1,606,417) Other, net (1,694) (158)
Net change in total pension liability 1,873,310 1,056,121
Total pension liability–beginning 28,474,417 27,418,296
Total pension liability–ending (a) 30,347,727 28,474,417
Fiduciary net position:Contributions–employer 792,585 904,339 Contributions–member 17,297 12,789 Net investment income (loss) (57,765) 1,862,789 Benefit payments (1,683,580) (1,606,417) Refunds of contributions (1,694) (158) Administrative expense (13,608) (13,794) Other additions 134,548 37,623
Net change in fiduciary net position (812,217) 1,197,171
Fiduciary net position–beginning 28,199,157 27,001,986
Fiduciary net position–ending (b) 27,386,940 28,199,157 Net pension liability–ending (a) – (b) $ 2,960,787 275,260
Ratio of fiduciary net position to total pension liability 90.2% 99.0%
Covered-employee payroll $ 3,232,589 3,257,100
Net pension liability as a percentage ofcovered-employee payroll 91.6% 8.5%
Schedule is intended to show information for 10 years. Additional years will be displayedas they become available.
See accompanying independent auditors’ report and notes to required supplementary information.

36
Schedule 2NEW YORK STATE AND LOCAL RETIREMENT SYSTEM
Schedule of Employer Contributions
(Unaudited)
(Dollars in millions)
Employees’ Retirement System2016 2015 2014 2013 2012 2011 2010 2009 2008 2007
Actuarially determined contribution (1) $ 4,348 4,893 5,138 4,524 3,879 3,623 1,879 1,963 2,135 2,216
Contributions in relation to theactuarially determined contribution (2) 4,348 4,893 5,138 4,524 3,879 3,623 1,879 1,963 2,135 2,216
Contribution deficiency (excess) $ — — — — — — — — — —
Covered-employee payroll (3) $ 24,364 24,480 24,361 24,405 24,291 24,389 24,972 24,099 22,779 22,018
Contributions as a percentage ofcovered-employee payroll 17.85% 19.99% 21.09% 18.54% 15.97% 14.86% 7.52% 8.15% 9.37% 10.06%
Police and Fire Retirement System2016 2015 2014 2013 2012 2011 2010 2009 2008 2007
Actuarially determined contribution (1) $ 793 904 926 812 706 542 465 493 513 502
Contributions in relation to theactuarially determined contribution (2) 793 904 926 812 706 542 465 493 513 502
Contribution deficiency (excess) $ — — — — — — — — — —
Covered-employee payroll (3) $ 3,232 3,257 3,233 3,163 3,191 3,146 3,113 2,970 2,926 2,825
Contributions as a percentage ofcovered-employee payroll 24.54% 27.76% 28.64% 25.67% 22.12% 17.23% 14.94% 16.60% 17.53% 17.77%
(1) The actuarially determined contribution includes normal costs, the GLIP amounts, adjustments made to record the reconciliation of projected salary to actual salary and miscellaneous accounting adjustments.
(2) The contributions in relation to the actuarially determined contribution reflects actual payments and installment payment plans.
(3) Covered-employee payroll represents pensionable payroll.
See accompanying independent auditors’ report and notes to required supplementary information.

37
Schedule 3NEW YORK STATE AND LOCAL RETIREMENT SYSTEM
Schedule of Investment Returns
(Unaudited)
2016 2015
Annual money-weighted rate of return, net of investment expenses 0.03% 6.98%
Schedule is intended to show information for 10 years. Additional yearswill be displayed as they become available.
See accompanying independent auditors’ report.
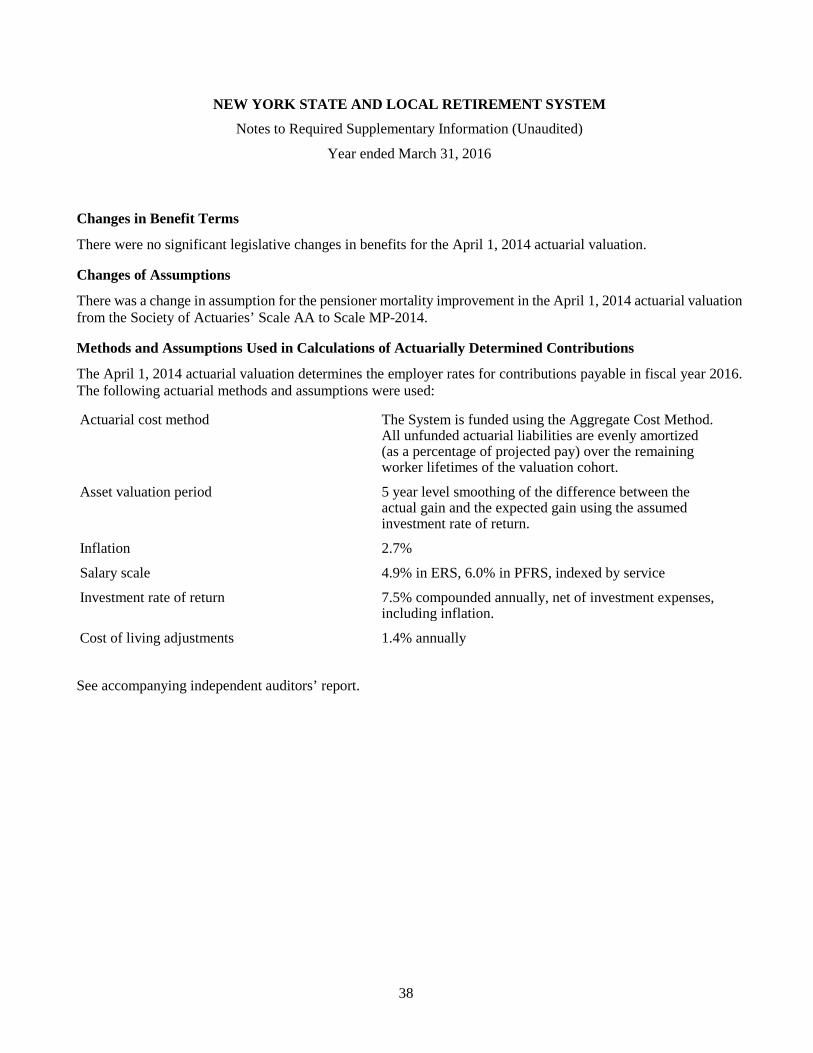
NEW YORK STATE AND LOCAL RETIREMENT SYSTEM
Notes to Required Supplementary Information (Unaudited)
Year ended March 31, 2016
38
Changes in Benefit Terms
There were no significant legislative changes in benefits for the April 1, 2014 actuarial valuation.
Changes of Assumptions
There was a change in assumption for the pensioner mortality improvement in the April 1, 2014 actuarial valuation from the Society of Actuaries’ Scale AA to Scale MP-2014.
Methods and Assumptions Used in Calculations of Actuarially Determined Contributions
The April 1, 2014 actuarial valuation determines the employer rates for contributions payable in fiscal year 2016. The following actuarial methods and assumptions were used:
Actuarial cost method The System is funded using the Aggregate Cost Method.All unfunded actuarial liabilities are evenly amortized(as a percentage of projected pay) over the remainingworker lifetimes of the valuation cohort.
Asset valuation period 5 year level smoothing of the difference between theactual gain and the expected gain using the assumedinvestment rate of return.
Inflation 2.7%
Salary scale 4.9% in ERS, 6.0% in PFRS, indexed by service
Investment rate of return 7.5% compounded annually, net of investment expenses,including inflation.
Cost of living adjustments 1.4% annually
See accompanying independent auditors’ report.

OTHER SUPPLEMENTARY INFORMATION

39
Schedule 4NEW YORK STATE AND LOCAL RETIREMENT SYSTEM
Schedule of Administrative Expenses
Year ended March 31, 2016
(Dollars in thousands)
Personal services:Salaries $ 54,665 Overtime salaries 2,435 Fringe benefits 28,075
Total personal services 85,175
Building occupancy expenses:Building, lease and condominium fees 3,424 Utilities and municipal assessments 108 Office supplies and services 287 Telephone 680
Total building occupancy expenses 4,499
Computer expenses:IT shared services 1 10,635
Total computer expenses 10,635
Personal and operating expenses:Training 90 Travel and auto expenses – includes pre-retirement seminars 1,160 Postage – includes member and retiree communication 1,576 Printing – includes member and retiree communication 261 Subscriptions/memberships 128
Total personal and operating expenses 3,215
Professional expenses:Audit services 1,064 Medical/clinical services 1,470 Miscellaneous consulting services 562
Total professional expenses 3,096 Total $ 106,620
1 The System is implementing a shared service, information technology (IT) model within the Office of theState Comptroller, wherein all IT costs, including personal services, will be incorporated into the ITshared services and reflected as nonpersonal service expenditures.
See accompanying independent auditors’ report.

40
Schedule 5NEW YORK STATE AND LOCAL RETIREMENT SYSTEM
Schedule of Investment Expenses
Year ended March 31, 2016
(Dollars in thousands)
Investment expenses:Investment management and incentive fees:
Absolute return strategy funds $ 150,183 Private equity 138,799 International equity 81,617 Real estate 55,328 Domestic equity 46,754 Opportunistic funds 28,812 Real assets 14,189 Fixed income 12,717
Total investment management and incentive fees 528,399
Investment-related expenses:General consulting 8,582 Miscellaneous expenses 7,661 Data processing expenses/licenses 5,364 Real estate consulting and monitoring 3,527 Mortgage loan servicing fees 2,914 Private equity consulting and monitoring 2,597 Legal fees 2,330 Absolute return strategy consulting and monitoring 1,999 Administrative expenses 1,255 Real assets consulting and monitoring 587 Audit and audit-related fees1 413 Custodial fees 122 Domestic equity consulting and monitoring 69 Global equity consulting 26
Total investment-related expenses 37,446 Total investment expenses $ 565,845
1 “Audit and audit–related fees” include expenses incurred for the system’s fiduciary review.
See accompanying independent auditors’ report.

41
Schedule 6NEW YORK STATE AND LOCAL RETIREMENT SYSTEM
Schedule of Consulting Fees
Year ended March 31, 2016
Fees in excess of $25,000 paid to outside professionals other than investment advisors.
Amount Nature
Seward & Kissel, LLP $ 688,315 Legal ServicesMorgan, Lewis & Bockius, LLP 494,408 Legal ServicesFoster, Pepper & Shefelman, PLLC 398,311 Legal ServicesKPMG LLP 239,183 Audit ServicesFunston Advisory Services 173,600 Audit ServicesOrrick Herrington & Sutcliffe, LLP 165,847 Legal ServicesD & D Medical Associates, PC 160,336 Medical ServicesFCME Management, Inc. 151,336 Medical ServicesNixon Peabody, LLP 141,863 Legal ServicesJeffrey M. Meyer MD, PLLC 93,132 Medical ServicesRegional Orthopaedics, PLLC 91,525 Medical ServicesMayer, Brown, LLP 80,635 Legal ServicesK&L Gates, LLP 80,110 Legal ServicesSeyfarth Shaw, LLP 70,000 Legal ServicesFirst Choice Evaluations 66,162 Medical ServicesJackson Walker, LLP 57,744 Legal ServicesMichael Lynch 42,340 Medical ServicesGroom Law Group 38,379 Legal/ Tax ConsultantJohn S. Mazella MD, PC 37,150 Medical ServicesProHEALTH Care Associates 36,801 Medical ServicesSimaren Corporation 35,033 Security ServicesLouis Benton, MD 31,000 Medical ServicesRiverside Orthopaedic & Sports Medicine Assoc. 30,525 Medical ServicesSpecialty Consultants 28,333 Recruitment ServicesPine Bush Mental Health, LLP 27,700 Medical ServicesEdward A Toriello MD, FACS. 26,775 Medical ServicesCertified Medical Consultants, Inc. 25,740 Medical ServicesCEM Benchmarking, Inc. 25,000 Industry Measurement Survey
See accompanying independent auditors’ report.

42
Independent Auditors’ Report on Internal Control over Financial Reporting and on Compliance
and Other Matters Based on an Audit of Financial Statements Performed in Accordance with
Government Auditing Standards
The Trustee
New York State and Local Retirement System:
We have audited, in accordance with the auditing standards generally accepted in the United States of
America and the standards applicable to financial audits contained in Government Auditing Standards, issued
by the Comptroller General of the United States, the financial statements of the New York State and Local
Retirement System (the System), which comprise the combining statement of fiduciary net position as of
March 31, 2016, and the related combining statement of changes in fiduciary net position for the year then
ended, and the related notes to the financial statements, and have issued our report thereon dated July 20,
2016.
Internal Control over Financial Reporting
In planning and performing our audit of the financial statements, we considered the System’s internal control
over financial reporting (internal control) to determine the audit procedures that are appropriate in the
circumstances for the purpose of expressing our opinion on the financial statements, but not for the purpose
of expressing an opinion on the effectiveness of the System’s internal control. Accordingly, we do not
express an opinion on the effectiveness of the System’s internal control.
A deficiency in internal control exists when the design or operation of a control does not allow management
or employees, in the normal course of performing their assigned functions, to prevent, or detect and correct,
misstatements on a timely basis. A material weakness is a deficiency, or combination of deficiencies, in
internal control, such that there is a reasonable possibility that a material misstatement of the entity’s
financial statements will not be prevented, or detected and corrected on a timely basis. A significant
deficiency is a deficiency, or a combination of deficiencies, in internal control that is less severe than a
material weakness, yet important enough to merit attention by those charged with governance.
Our consideration of internal control was for the limited purpose described in the first paragraph of this
section and was not designed to identify all deficiencies in internal control that might be material weaknesses
or significant deficiencies. Given these limitations, during our audit we did not identify any deficiencies in
internal control that we consider to be material weaknesses. However, material weaknesses may exist that
have not been identified.
Compliance and Other Matters
As part of obtaining reasonable assurance about whether the System’s financial statements are free from
material misstatement, we performed tests of its compliance with certain provisions of laws, regulations,
contracts, and grant agreements, noncompliance with which could have a direct and material effect on the
determination of financial statement amounts. However, providing an opinion on compliance with those
provisions was not an objective of our audit, and accordingly, we do not express such an opinion. The results
of our tests disclosed no instances of noncompliance or other matters that are required to be reported under
Government Auditing Standards.
KPMG LLP515 BroadwayAlbany, NY 12207-2974
KPMG LLP is a Delaware limited liability partnership, the U.S. member firm of KPMG International Cooperative (“KPMG International”), a Swiss entity.

43
Purpose of this Report
The purpose of this report is solely to describe the scope of our testing of internal control and compliance
and the results of that testing, and not to provide an opinion on the effectiveness of the System’s internal
control or on compliance. This report is an integral part of an audit performed in accordance with Government
Auditing Standards in considering the System’s internal control and compliance. Accordingly, this
communication is not suitable for any other purpose.
July 20, 2016