new york state bald eagle report 2010 · new york state . bald eagle report . 2010. ... this...
TRANSCRIPT
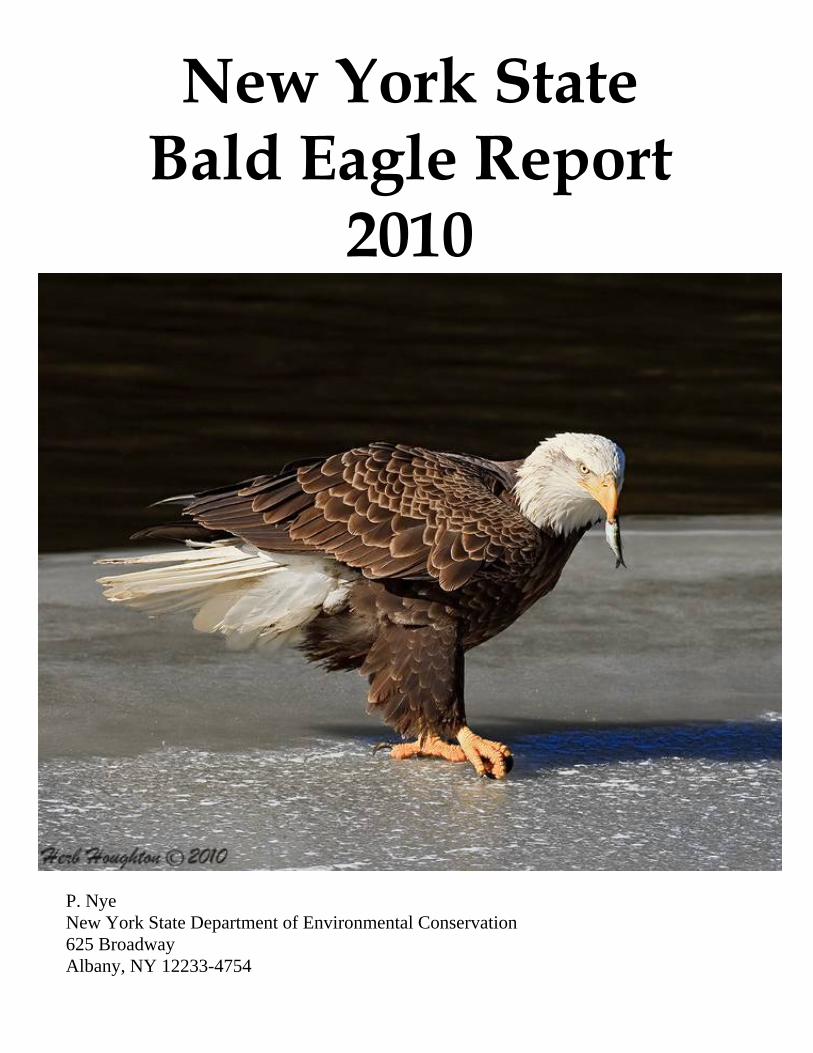
New York State Bald Eagle Report
2010
P. Nye New York State Department of Environmental Conservation 625 Broadway Albany, NY 12233-4754
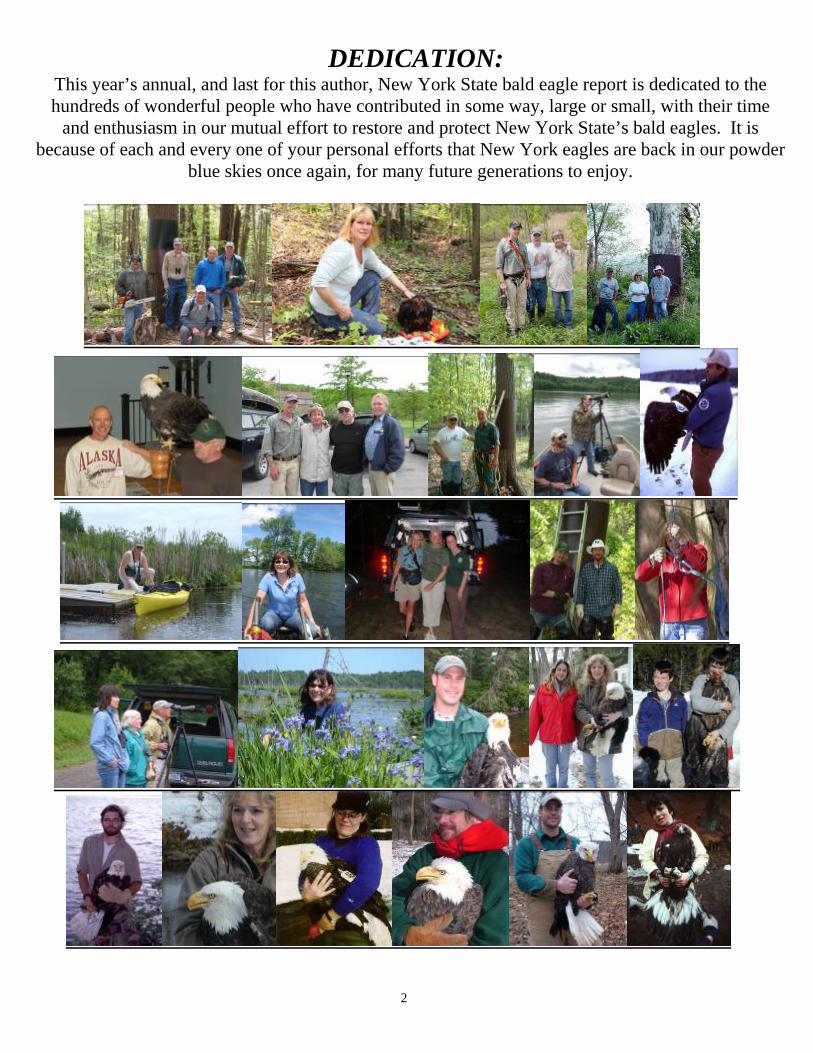
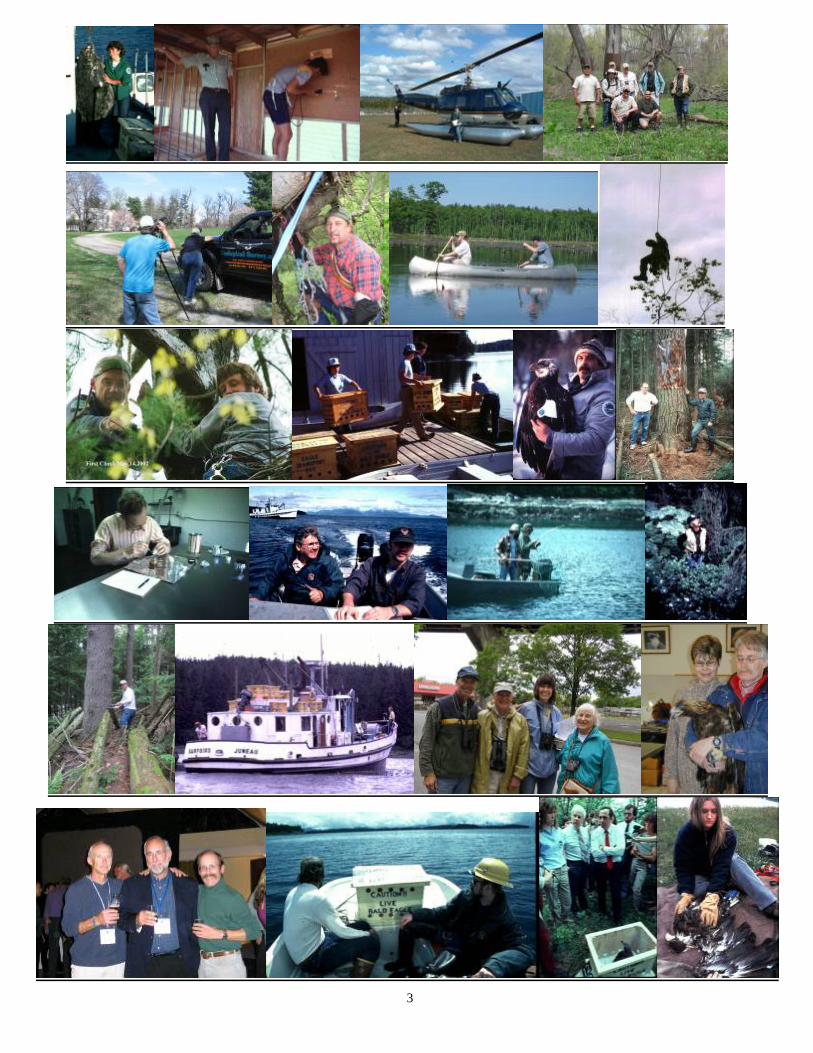
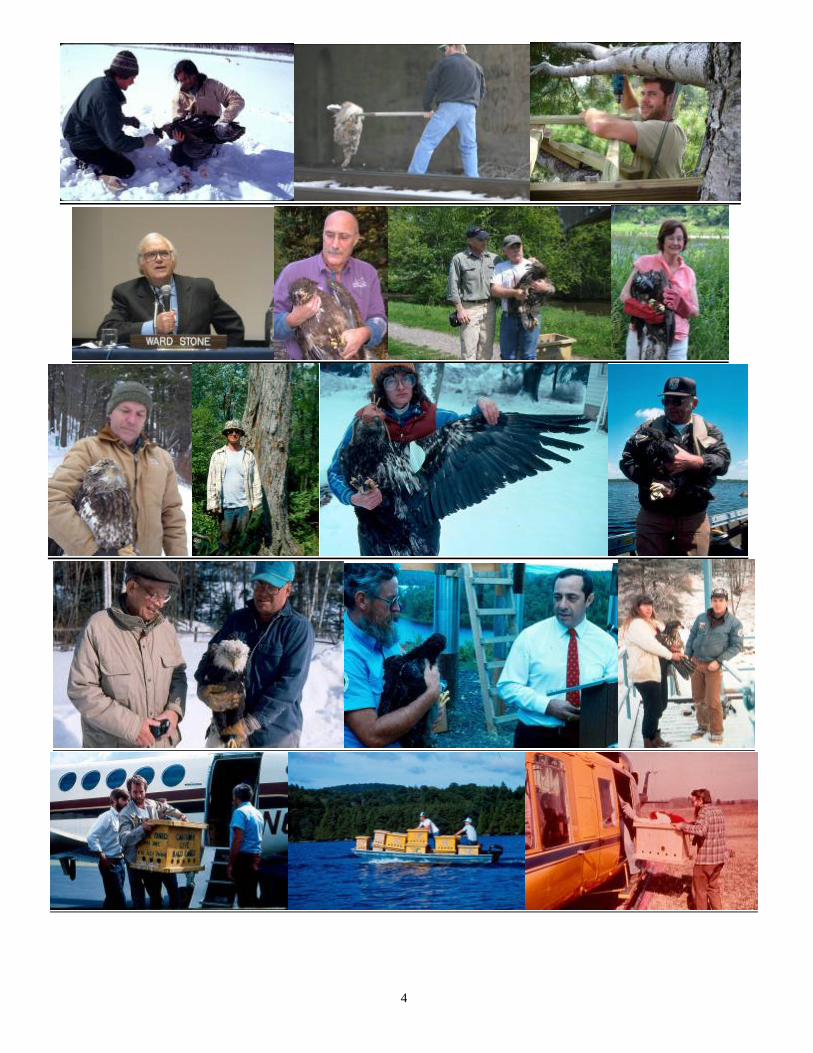
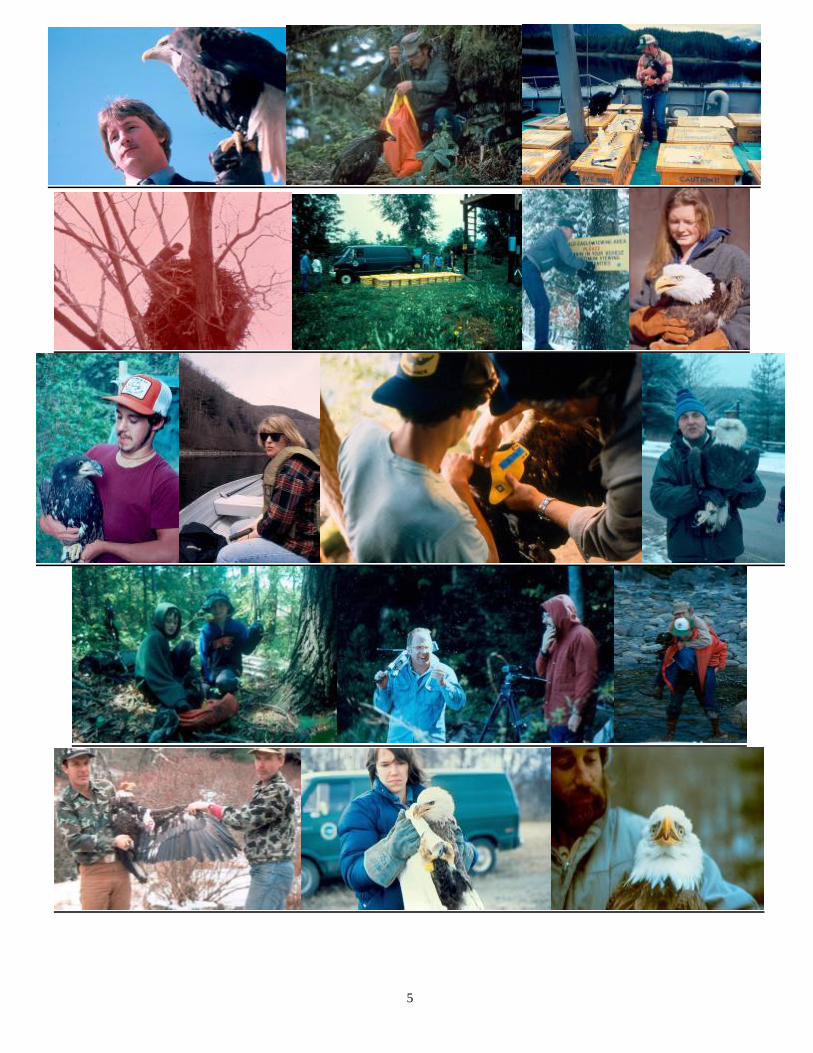
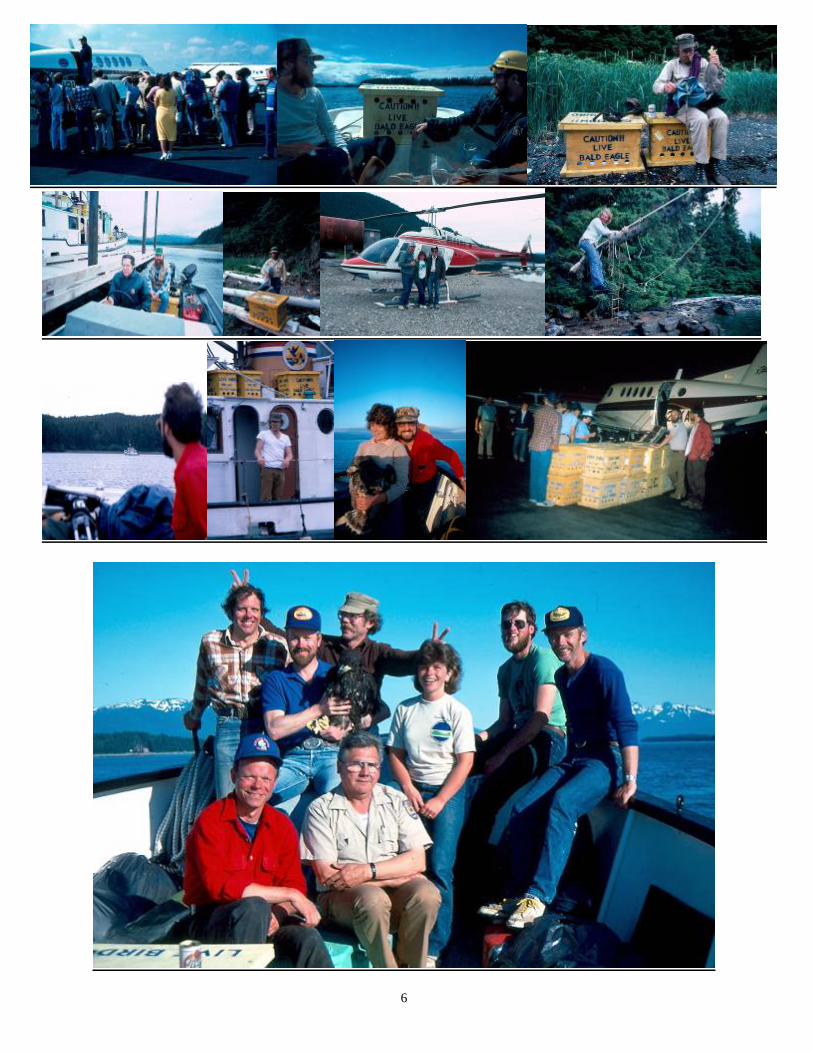
DEDICATION: This year’s annual, and last for this author, New York State bald eagle report is dedicated to the hundreds of wonderful people who have contributed in some way, large or small, with their time
and enthusiasm in our mutual effort to restore and protect New York State’s bald eagles. It is because of each and every one of your personal efforts that New York eagles are back in our powder
blue skies once again, for many future generations to enjoy.
2
3
4
5
6
DEDICATION: ....................................................................................................................................................... 2
TABLE OF CONTENTS I. Wintering Bald Eagles .................................................................................................................................... 9
A. Surveys ....................................................................................................................................................... 9 1. Statewide .................................................................................................................................................. 9 2. Southeast NY ......................................................................................................................................... 12 3. Upper Delaware River ........................................................................................................................... 13 4. Mongaup River System.......................................................................................................................... 15 5. Hudson River (Lower) ........................................................................................................................... 16 6. Hudson River (Upper) ........................................................................................................................... 18 7. St. Lawrence River ................................................................................................................................ 19 8. Lake Champlain ..................................................................................................................................... 20
II. Breeding Bald Eagles .................................................................................................................................... 22 A.Surveys ....................................................................................................................................................... 22
1. Statewide ................................................................................................................................................. 22 a. Contaminant Sampling ........................................................................................................................ 24 b. Nesting Failures and other Miscellaneous Breeding Information ....................................................... 24
2. DEC Regional Area and Other Interesting Productivity Information: ................................................... 29 a. Hudson River ....................................................................................................................................... 32 b. Delaware River .................................................................................................................................... 34
B.Nestling Movement/Survival Study ........................................................................................................... 36 C.Observations of Banded Eagles .................................................................................................................. 37 D.Recoveries .................................................................................................................................................. 37
And Finally. ....................................................................................................................................................... 39 It’s Been a Long, Good Run .............................................................................................................................. 41 Acknowledgements ........................................................................................................................................... 43 Additional Eagle Information Links .................................................................................................................. 43

8
List of Tables Table 1. Numbers of eagles observed in NY State during annual national mid-winter bald eagle surveys. ........................ 11 Table 2. Combined (aerial and ground) January winter eagle survey results, Southeast Region of NYS ............................ 12 Table 3. No. of wintering bald eagles counted annually along the main stem of the Delaware River, NY-PA ................... 14 Table 4. Wintering Bald Eagle Numbers from Mid-winter Aerial Surveys for Mongaup Valley, NY 1978-2010 .............. 15 Table 5A. Numbers of Bald Eagles Observed During Annual Mid-Winter Counts Along the Lower Hudson River, NY .. 17 Table 5B. Numbers of bald eagles observed during simultaneous night roost surveys along the Lower Hudson R., 2010 . 18 Table 5C. Annual Summary of Lower Hudson River Coordinated Bald Eagle Rooost Counts, 2004-2010 ....................... 18 Table 6. No. of Bald Eagles Observed during Annual Mid-winter Surveys along the St. Lawrence R, NY, 1980-2010 .... 19 Table 7. Lake Champlain Winter Aerial-Ground (combined) Eagle Surveys ...................................................................... 20 Table 8. Annual Regional Summary: Number of bald eagles observed within major NYS wintering areas. ..................... 21 Table 9. New York State Bald Eagle Breeding Summary 2000-2010 .................................................................................. 26 Table 10. Bald Eagle Productivity by NYSDEC Region,2002-2010 ................................................................................... 29 Table 11. Annual Bald Eagle Breeding Success: Hudson River, New York ....................................................................... 33 Table 12. Bald Eagle Productivity along the NY side of the Delaware River (main-stem).................................................. 34 List of Figures: Figure 1. No. of Bald Eagles Observed Annually in NY During National Mid-Winter Bald Eagle Survey: 1979-2010 .... 10 Figure 2. No. of Bald Eagles Observed During Annual Mid-Winter Surveys: Southeast NY, 1980-2010 .......................... 13 Figure 3. No. of Bald Eagles Observed During Annual Mid-Winter Surveys: Mainstem Upper Delaware River, NY, 1990-
2010 ................................................................................................................................................................. 14 Figure 4. No. of Bald Eagles Observed During Annual Mid-Winter Surveys: Mongaup River System, NY, 1978-2010 .. 16 Figure 5. No. of Bald Eagles Observed During Annual Mid-Winter Surveys: Lower Hudson River, NY, 1980-2010 ....... 16 Figure 6. No. of Bald Eagles Observed During Annual Mid-Winter Surveys: St. Lawrence River, NY, 1979-2010 ......... 20 Figure 7. No. of Bald Eagles Observed During January Aerial Surveys Along Lake Champlain, NY, 2006-2010 ............ 21 Figure 8. NYS Bald Eagle Productivity: Annual No. Occupied and Successful Nests and Young Fledged: 1965-2010 .... 27 Figure 9. Annual Number of Occupied Bald Eagle Nests and Success Rate: NYS .............................................................. 27 Figure 10. Annual Percent of 1,2, or 3-young Bald Eagle Nests in New York State ........................................................... 28 Figure 11. NYS Bald Eagle Productivity: Young per Occupied and Successful Pair .......................................................... 28 Figure 12 DEC Regional Bald Eagle Productivity Data: 2010 ............................................................................................. 30 Figure 12a. Number of New Bald Eagle Breeding Pairs by DEC Region, 2010 .................................................................. 31 Figure 13. New NYS Bald EagleA Territories 2010 ............................................................................................................ 31 Figure 14. Hudson River, NY, Annual Bald Eagle Productivity 1992-2010 ........................................................................ 33 Figure 15. Upper Delaware River (NY side) Annual Bald Eagle Productivity: 1993-2010 ................................................. 35 Figure 16. Annual Success of Occupied Bald Eagle Nests: NYS, 2005-2010 ..................................................................... 35 Figure 17. Young Per Occupied Pair: NY Statewide, 2005-2010 ........................................................................................ 36 Figures 18A-E. Numbers and locations of NYS Bald Eagle Nests: 40-year review ............................................................ 40

Unknown author
I. Wintering Bald Eagles A. Surveys: 1. Statewide:
Surveys for wintering bald eagles continued throughout New York State during the winter of 2008-2009 with our participation in the National Midwinter Bald Eagle Survey during January 2010 for the 32nd consecutive year. As usual, our surveys were conducted by both DEC staff and numerous volunteers, both on the ground and in the air. Our National survey effort, conducted this year throughout the lower 48 United States between 30 December 2009 through 13 January 2010, involved approximately 75 survey routes and about 100 DEC and public cooperators. Five separate helicopter surveys were again conducted over our major winter eagle-concentration areas this year, covering areas in southwestern NY (Allegheny Reservoir and River area, Lake Erie shorelines and tributaries), all of Lake Champlain, the St. Lawrence River, and most of the lower Hudson River and Upper Delaware River watershed.
While the winter weather from 2006 - 2008 was fairly mild with extensive open water, the winter of
2009 proved more typical with cold, snow and ice, perhaps accounting for the drop in overall wintering eagle numbers we witnessed last year. As we entered the winter of 2009-10, early December greeted us with mild temperatures and no snow, until December 9th when eastern and northern NY got a significant
9
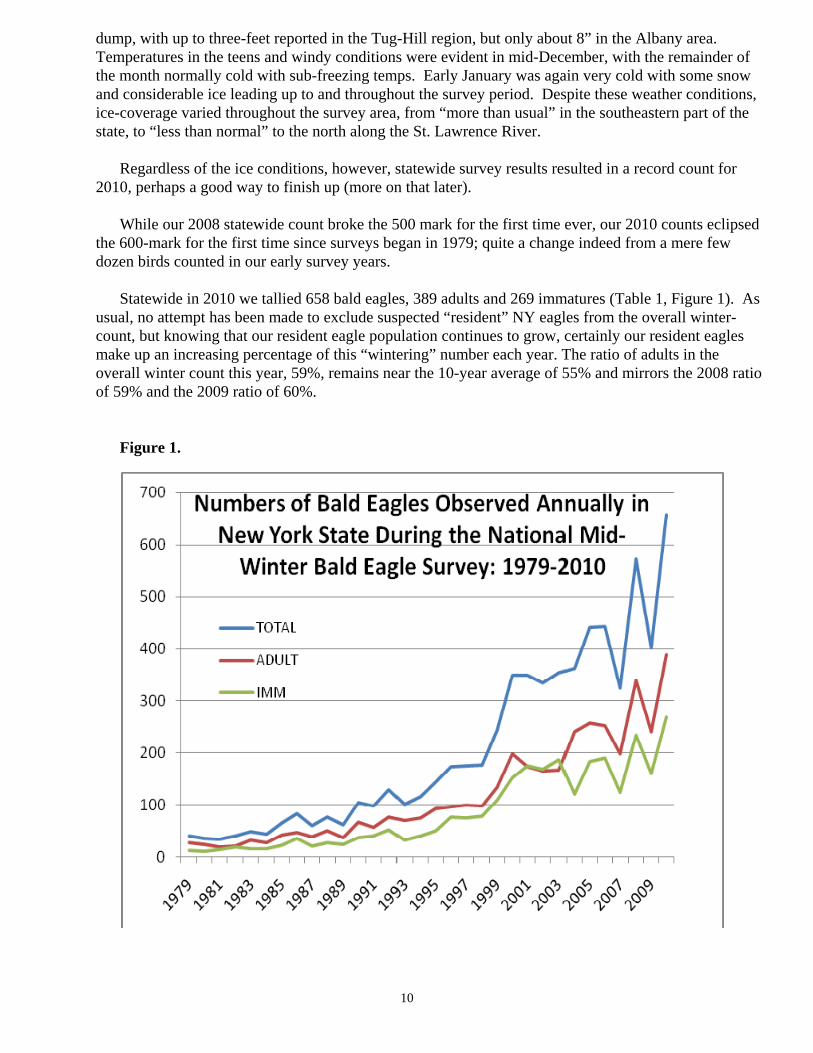
dump, with up to three-feet reported in the Tug-Hill region, but only about 8” in the Albany area. Temperatures in the teens and windy conditions were evident in mid-December, with the remainder of the month normally cold with sub-freezing temps. Early January was again very cold with some snow and considerable ice leading up to and throughout the survey period. Despite these weather conditions, ice-coverage varied throughout the survey area, from “more than usual” in the southeastern part of the state, to “less than normal” to the north along the St. Lawrence River.
Regardless of the ice conditions, however, statewide survey results resulted in a record count for
2010, perhaps a good way to finish up (more on that later). While our 2008 statewide count broke the 500 mark for the first time ever, our 2010 counts eclipsed
the 600-mark for the first time since surveys began in 1979; quite a change indeed from a mere few dozen birds counted in our early survey years.
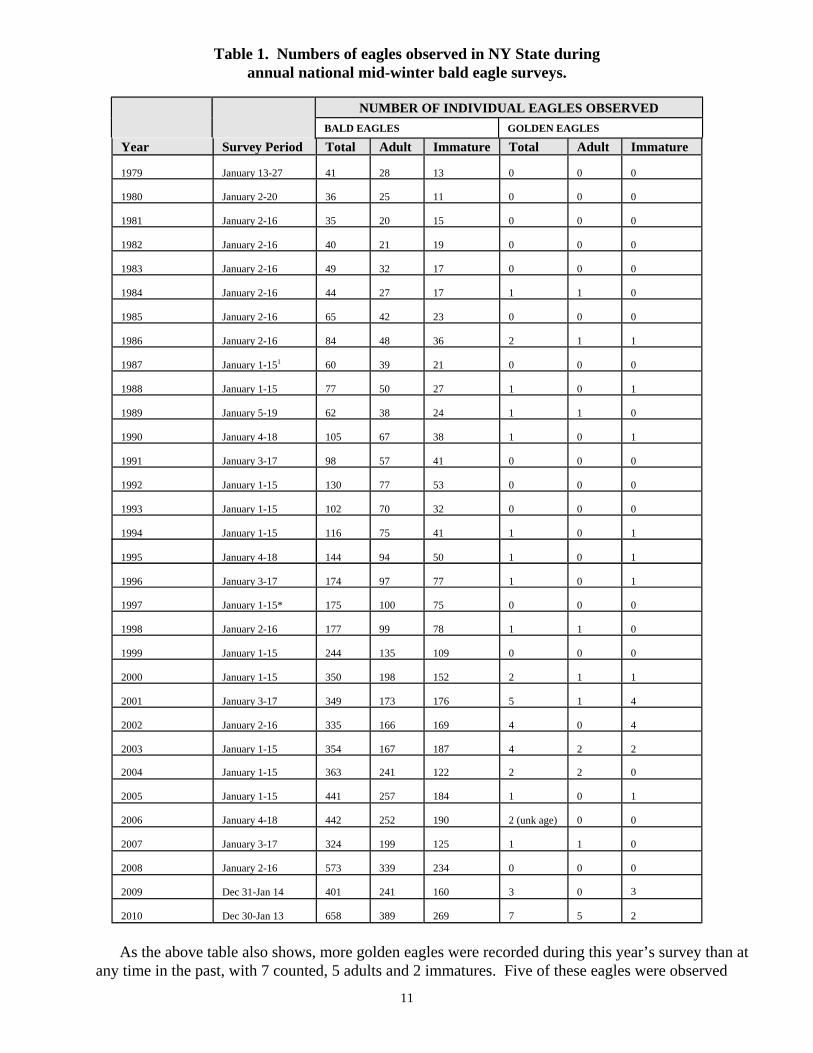
Statewide in 2010 we tallied 658 bald eagles, 389 adults and 269 immatures (Table 1, Figure 1). As
usual, no attempt has been made to exclude suspected “resident” NY eagles from the overall winter-count, but knowing that our resident eagle population continues to grow, certainly our resident eagles make up an increasing percentage of this “wintering” number each year. The ratio of adults in the overall winter count this year, 59%, remains near the 10-year average of 55% and mirrors the 2008 ratio of 59% and the 2009 ratio of 60%.
Figure 1.
10
11
Table 1. Numbers of eagles observed in NY State during
annual national mid-winter bald eagle surveys.
NUMBER OF INDIVIDUAL EAGLES OBSERVED BALD EAGLES GOLDEN EAGLES
Year Survey Period Total Adult Immature Total Adult Immature 1979
January 13-27
41 28 13 0
0
0
1980
January 2-20
36 25 11 0
0
0
1981
January 2-16
35 20 15 0
0
0
1982
January 2-16
40 21 19 0
0
0
1983
January 2-16
49 32 17 0
0
0
1984
January 2-16
44 27 17 1
1
0
1985
January 2-16
65 42 23 0
0
0
1986
January 2-16
84 48 36 2
1
1
1987
January 1-151
60 39 21 0
0
0
1988
January 1-15
77 50 27 1
0
1
1989
January 5-19
62 38 24 1
1
0
1990
January 4-18
105 67 38 1
0
1
1991
January 3-17
98 57 41 0
0
0
1992
January 1-15
130 77 53 0
0
0
1993
January 1-15
102 70 32 0
0
0
1994
January 1-15
116 75 41 1
0
1
1995
January 4-18
144 94 50 1
0
1
1996
January 3-17
174 97 77 1
0
1
1997
January 1-15*
175 100 75 0
0
0
1998
January 2-16
177 99 78 1
1
0
1999
January 1-15
244 135 109 0
0
0
2000
January 1-15
350 198 152 2
1
1
2001
January 3-17
349 173 176 5
1
4
2002
January 2-16
335 166 169 4
0
4
2003
January 1-15
354 167 187 4
2
2
2004
January 1-15
363 241 122 2
2
0
2005
January 1-15
441 257 184 1
0
1
2006
January 4-18
442 252 190 2 (unk age)
0
0
2007
January 3-17
324 199 125 1
1
0
2008
January 2-16
573 339 234 0
0
0
2009
Dec 31-Jan 14
401 241 160 3
0
3
2010
Dec 30-Jan 13
658 389 269 7
5
2
As the above table also shows, more golden eagles were recorded during this year’s survey than at
any time in the past, with 7 counted, 5 adults and 2 immatures. Five of these eagles were observed
12
along the lower Hudson River or east of there, while 2 were observed in central NY south of Utica. These observations may be mirroring a trend of more “northern” (i.e. eastern Canadian) golden eagles showing up from fall to spring in NY and other eastern states.
Regional Wintering Eagle Survey results making up our statewide total are discussed further below.
2. Southeast NY (Overall):
This southeast survey route covers the Hudson River south from Albany to Croton Point, the Upper Delaware River from Port Jervis to Hancock NY, and major tributaries, reservoirs and lakes within this watershed, primarily in Sullivan and Delaware Counties. Ground-counters cover additional areas within this zone (such as the East and West Branches of the Delaware River), in a non-overlapping count fashion.
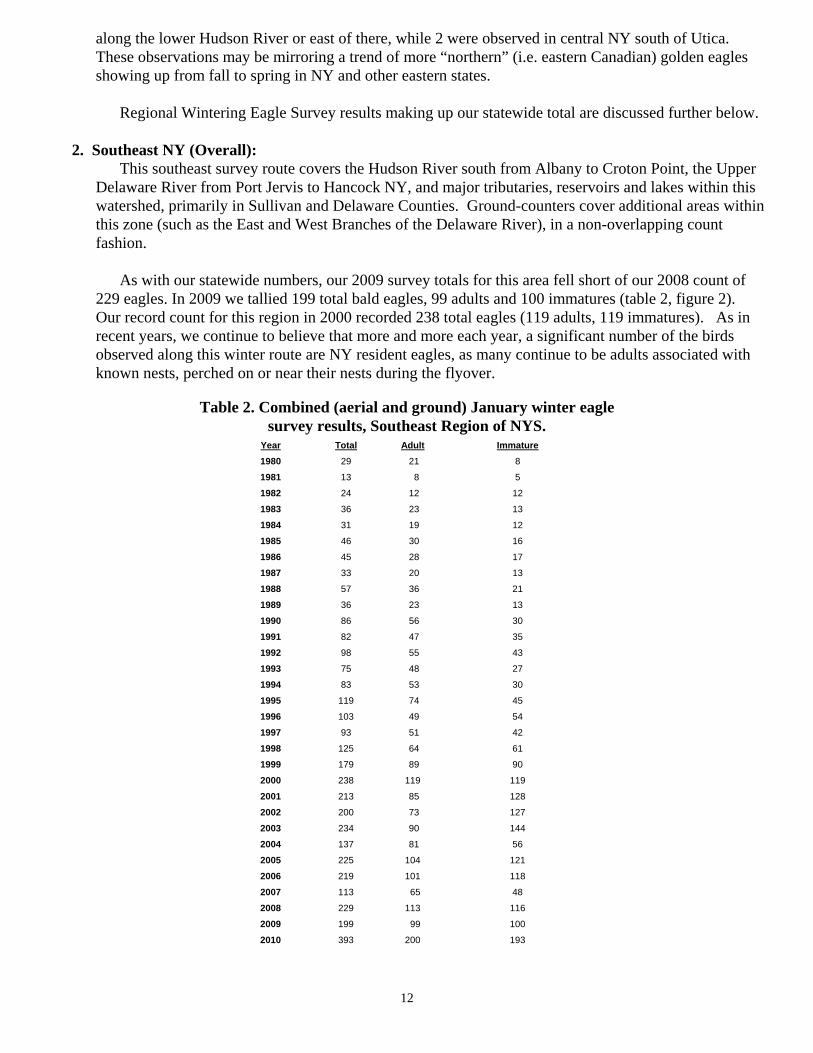
As with our statewide numbers, our 2009 survey totals for this area fell short of our 2008 count of
229 eagles. In 2009 we tallied 199 total bald eagles, 99 adults and 100 immatures (table 2, figure 2). Our record count for this region in 2000 recorded 238 total eagles (119 adults, 119 immatures). As in recent years, we continue to believe that more and more each year, a significant number of the birds observed along this winter route are NY resident eagles, as many continue to be adults associated with known nests, perched on or near their nests during the flyover.
Table 2. Combined (aerial and ground) January winter eagle
survey results, Southeast Region of NYS. Year Total Adult Immature 1980 29 21 8
1981 13 8 5
1982 24 12 12
1983 36 23 13
1984 31 19 12
1985 46 30 16
1986 45 28 17
1987 33 20 13
1988 57 36 21
1989 36 23 13
1990 86 56 30
1991 82 47 35
1992 98 55 43
1993 75 48 27
1994 83 53 30
1995 119 74 45
1996 103 49 54
1997 93 51 42
1998 125 64 61
1999 179 89 90
2000 238 119 119
2001 213 85 128
2002 200 73 127
2003 234 90 144
2004 137 81 56
2005 225 104 121
2006 219 101 118
2007 113 65 48
2008 229 113 116
2009 199 99 100
2010 393 200 193
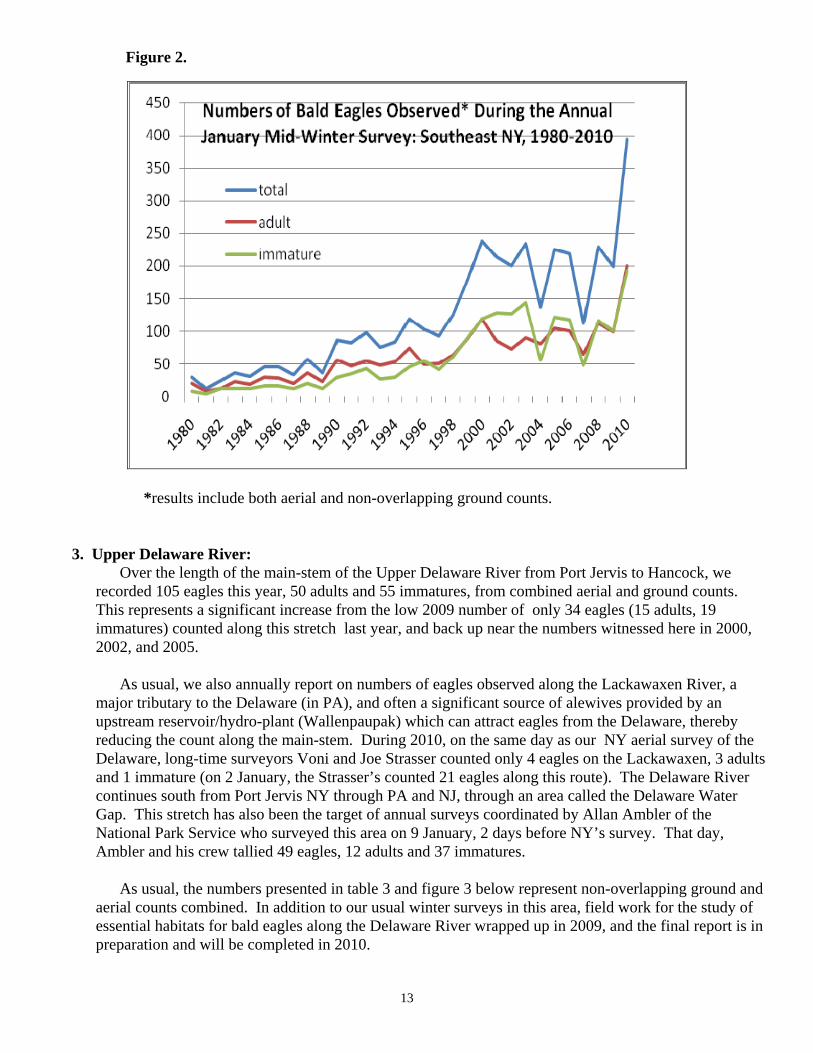
Figure 2.
*results include both aerial and non-overlapping ground counts.
3. Upper Delaware River: Over the length of the main-stem of the Upper Delaware River from Port Jervis to Hancock, we
recorded 105 eagles this year, 50 adults and 55 immatures, from combined aerial and ground counts. This represents a significant increase from the low 2009 number of only 34 eagles (15 adults, 19 immatures) counted along this stretch last year, and back up near the numbers witnessed here in 2000, 2002, and 2005.
As usual, we also annually report on numbers of eagles observed along the Lackawaxen River, a
major tributary to the Delaware (in PA), and often a significant source of alewives provided by an upstream reservoir/hydro-plant (Wallenpaupak) which can attract eagles from the Delaware, thereby reducing the count along the main-stem. During 2010, on the same day as our NY aerial survey of the Delaware, long-time surveyors Voni and Joe Strasser counted only 4 eagles on the Lackawaxen, 3 adults and 1 immature (on 2 January, the Strasser’s counted 21 eagles along this route). The Delaware River continues south from Port Jervis NY through PA and NJ, through an area called the Delaware Water Gap. This stretch has also been the target of annual surveys coordinated by Allan Ambler of the National Park Service who surveyed this area on 9 January, 2 days before NY’s survey. That day, Ambler and his crew tallied 49 eagles, 12 adults and 37 immatures.
As usual, the numbers presented in table 3 and figure 3 below represent non-overlapping ground and
aerial counts combined. In addition to our usual winter surveys in this area, field work for the study of essential habitats for bald eagles along the Delaware River wrapped up in 2009, and the final report is in preparation and will be completed in 2010.
13
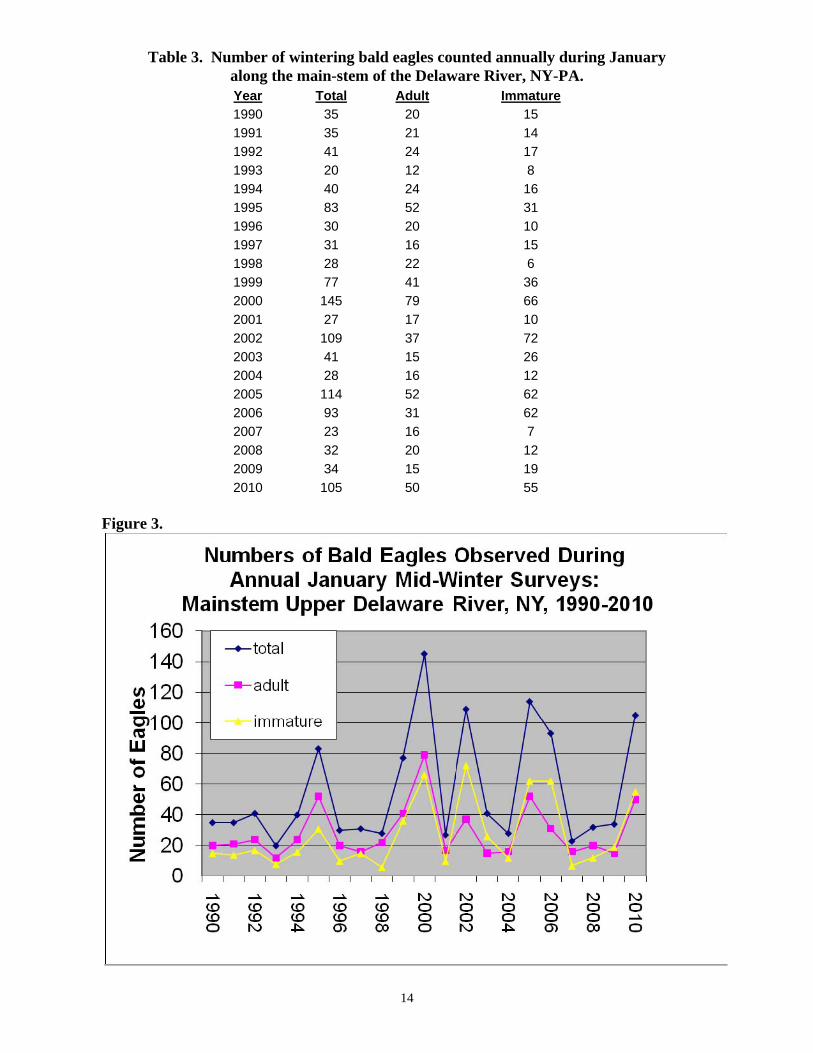
Table 3. Number of wintering bald eagles counted annually during January
along the main-stem of the Delaware River, NY-PA. Year Total Adult Immature 1990 35 20 15 1991 35 21 14 1992 41 24 17 1993 20 12 8 1994 40 24 16 1995 83 52 31 1996 30 20 10 1997 31 16 15 1998 28 22 6 1999 77 41 36 2000 145 79 66 2001 27 17 10 2002 109 37 72 2003 41 15 26 2004 28 16 12 2005 114 52 62 2006 93 31 62 2007 23 16 7 2008 32 20 12 2009 34 15 19 2010 105 50 55
Figure 3.
14
15
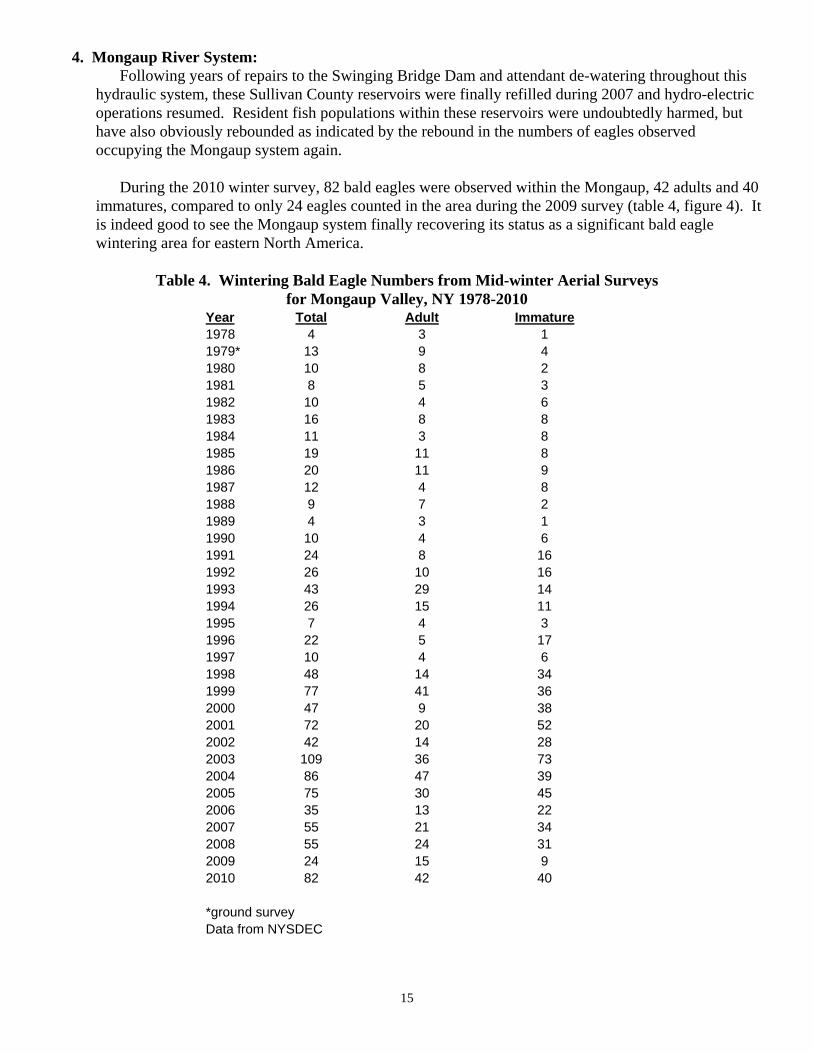
4. Mongaup River System:
Following years of repairs to the Swinging Bridge Dam and attendant de-watering throughout this hydraulic system, these Sullivan County reservoirs were finally refilled during 2007 and hydro-electric operations resumed. Resident fish populations within these reservoirs were undoubtedly harmed, but have also obviously rebounded as indicated by the rebound in the numbers of eagles observed occupying the Mongaup system again.
During the 2010 winter survey, 82 bald eagles were observed within the Mongaup, 42 adults and 40
immatures, compared to only 24 eagles counted in the area during the 2009 survey (table 4, figure 4). It is indeed good to see the Mongaup system finally recovering its status as a significant bald eagle wintering area for eastern North America.
Table 4. Wintering Bald Eagle Numbers from Mid-winter Aerial Surveys
for Mongaup Valley, NY 1978-2010 Year Total Adult Immature 1978 4 3 1 1979* 13 9 4 1980 10 8 2 1981 8 5 3 1982 10 4 6 1983 16 8 8 1984 11 3 8 1985 19 11 8 1986 20 11 9 1987 12 4 8 1988 9 7 2 1989 4 3 1 1990 10 4 6 1991 24 8 16 1992 26 10 16 1993 43 29 14 1994 26 15 11 1995 7 4 3 1996 22 5 17 1997 10 4 6 1998 48 14 34 1999 77 41 36 2000 47 9 38 2001 72 20 52 2002 42 14 28 2003 109 36 73 2004 86 47 39 2005 75 30 45 2006 35 13 22 2007 55 21 34 2008 55 24 31 2009 24 15 9 2010 82 42 40
*ground survey Data from NYSDEC
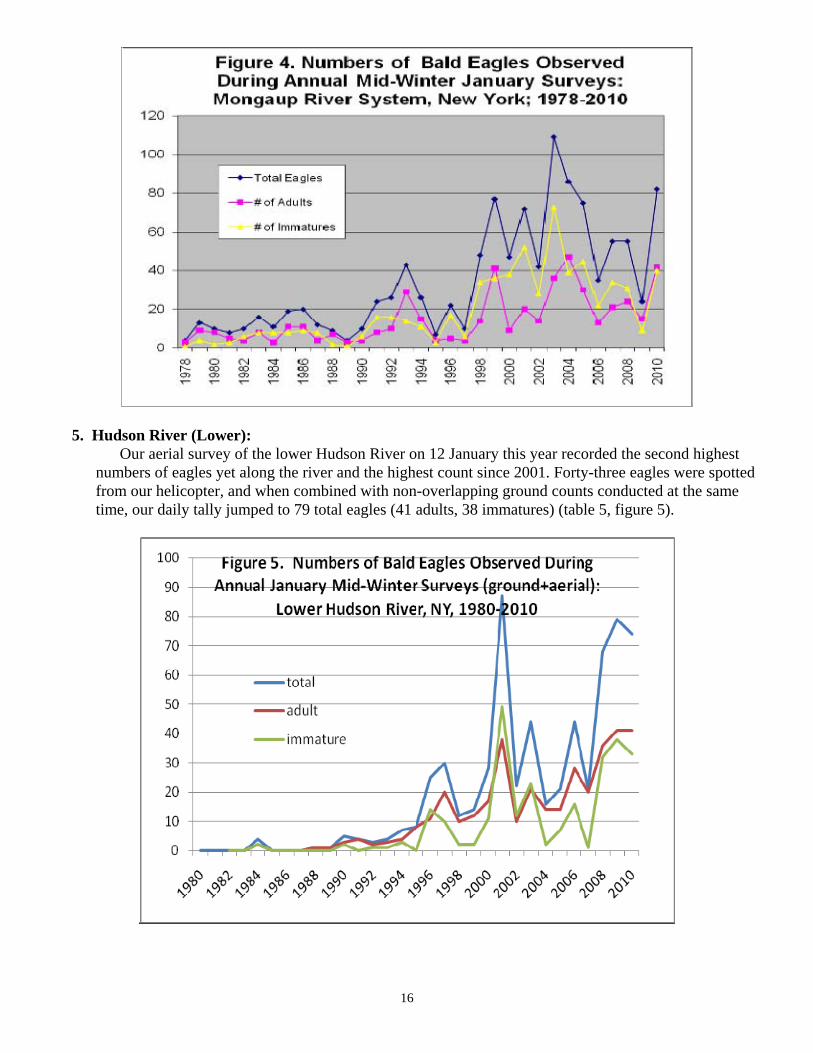
Figure 4
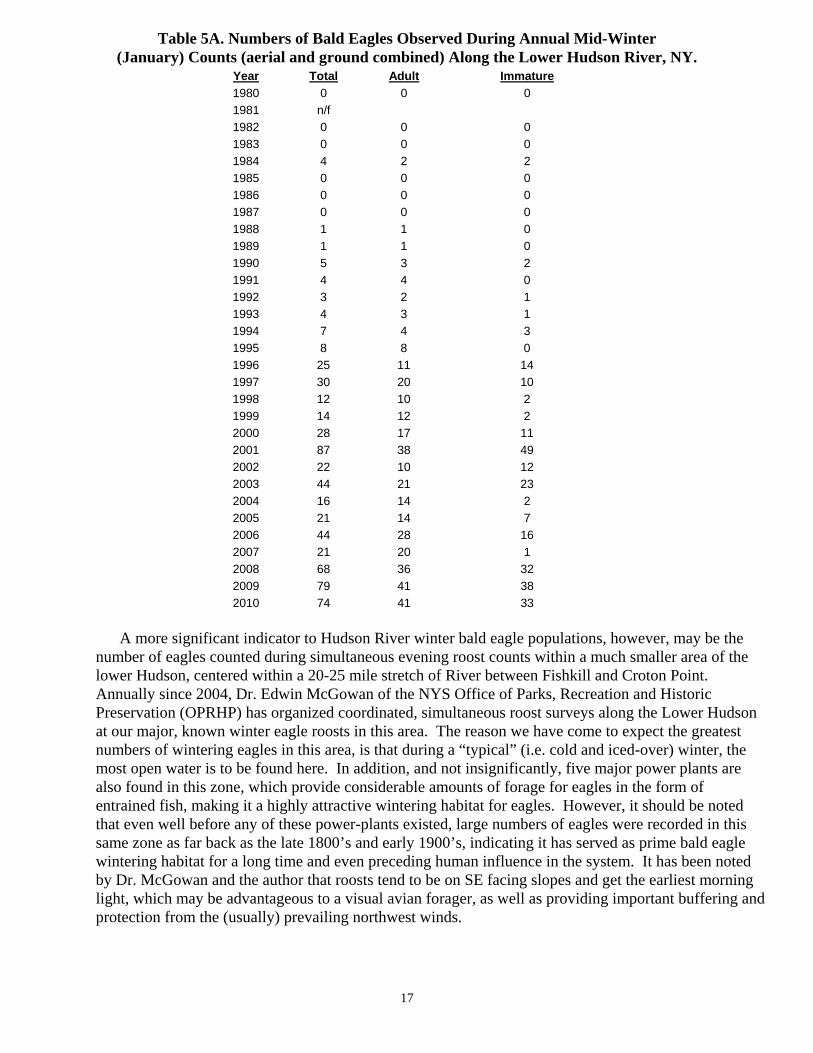
5. Hudson River (Lower):
Our aerial survey of the lower Hudson River on 12 January this year recorded the second highest numbers of eagles yet along the river and the highest count since 2001. Forty-three eagles were spotted from our helicopter, and when combined with non-overlapping ground counts conducted at the same time, our daily tally jumped to 79 total eagles (41 adults, 38 immatures) (table 5, figure 5).
Figure 5
16
17
Table 5A. Numbers of Bald Eagles Observed During Annual Mid-Winter (January) Counts (aerial and ground combined) Along the Lower Hudson River, NY.
Year Total Adult Immature 1980 0 0 0 1981 n/f 1982 0 0 0 1983 0 0 0 1984 4 2 2 1985 0 0 0 1986 0 0 0 1987 0 0 0 1988 1 1 0 1989 1 1 0 1990 5 3 2 1991 4 4 0 1992 3 2 1 1993 4 3 1 1994 7 4 3 1995 8 8 0 1996 25 11 14 1997 30 20 10 1998 12 10 2 1999 14 12 2 2000 28 17 11 2001 87 38 49 2002 22 10 12 2003 44 21 23 2004 16 14 2 2005 21 14 7 2006 44 28 16 2007 21 20 1 2008 68 36 32 2009 79 41 38 2010 74 41 33
A more significant indicator to Hudson River winter bald eagle populations, however, may be the
number of eagles counted during simultaneous evening roost counts within a much smaller area of the lower Hudson, centered within a 20-25 mile stretch of River between Fishkill and Croton Point. Annually since 2004, Dr. Edwin McGowan of the NYS Office of Parks, Recreation and Historic Preservation (OPRHP) has organized coordinated, simultaneous roost surveys along the Lower Hudson at our major, known winter eagle roosts in this area. The reason we have come to expect the greatest numbers of wintering eagles in this area, is that during a “typical” (i.e. cold and iced-over) winter, the most open water is to be found here. In addition, and not insignificantly, five major power plants are also found in this zone, which provide considerable amounts of forage for eagles in the form of entrained fish, making it a highly attractive wintering habitat for eagles. However, it should be noted that even well before any of these power-plants existed, large numbers of eagles were recorded in this same zone as far back as the late 1800’s and early 1900’s, indicating it has served as prime bald eagle wintering habitat for a long time and even preceding human influence in the system. It has been noted by Dr. McGowan and the author that roosts tend to be on SE facing slopes and get the earliest morning light, which may be advantageous to a visual avian forager, as well as providing important buffering and protection from the (usually) prevailing northwest winds.
18
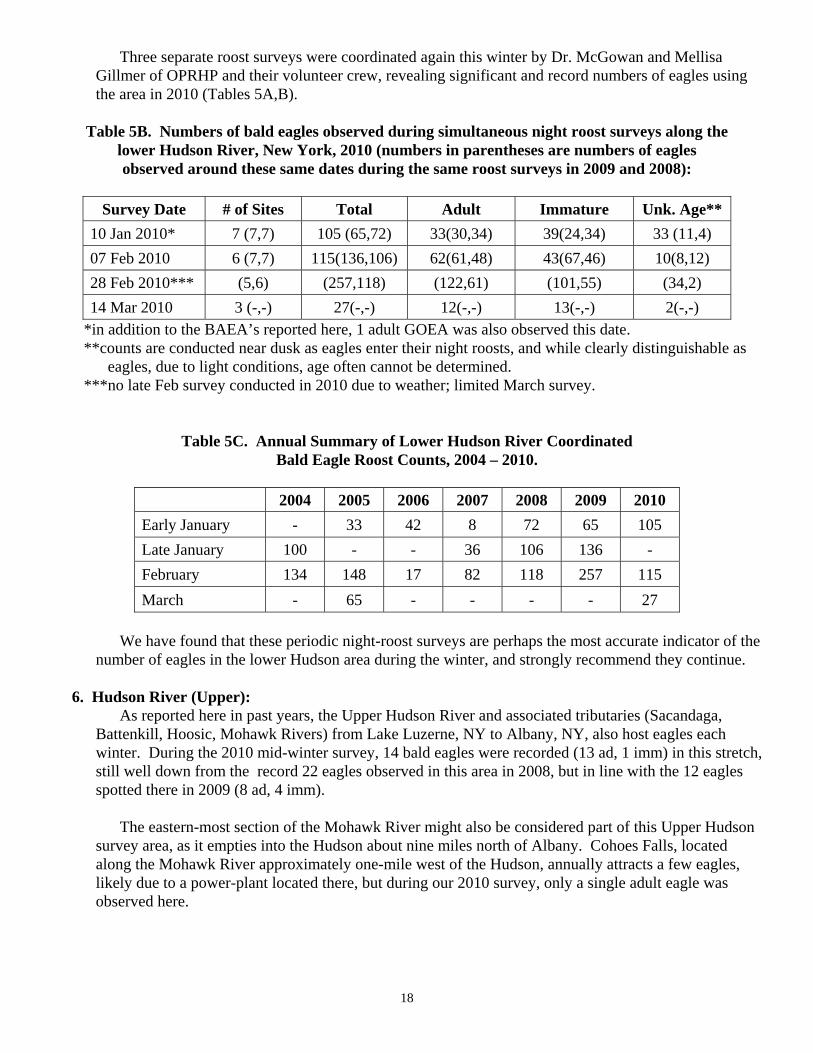
Three separate roost surveys were coordinated again this winter by Dr. McGowan and Mellisa
Gillmer of OPRHP and their volunteer crew, revealing significant and record numbers of eagles using the area in 2010 (Tables 5A,B).
Table 5B. Numbers of bald eagles observed during simultaneous night roost surveys along the
lower Hudson River, New York, 2010 (numbers in parentheses are numbers of eagles observed around these same dates during the same roost surveys in 2009 and 2008):
Survey Date # of Sites Total Adult Immature Unk. Age**
10 Jan 2010* 7 (7,7) 105 (65,72) 33(30,34) 39(24,34) 33 (11,4) 07 Feb 2010 6 (7,7) 115(136,106) 62(61,48) 43(67,46) 10(8,12) 28 Feb 2010*** (5,6) (257,118) (122,61) (101,55) (34,2) 14 Mar 2010 3 (-,-) 27(-,-) 12(-,-) 13(-,-) 2(-,-)
*in addition to the BAEA’s reported here, 1 adult GOEA was also observed this date. **counts are conducted near dusk as eagles enter their night roosts, and while clearly distinguishable as
eagles, due to light conditions, age often cannot be determined. ***no late Feb survey conducted in 2010 due to weather; limited March survey.
Table 5C. Annual Summary of Lower Hudson River Coordinated Bald Eagle Roost Counts, 2004 – 2010.
2004 2005 2006 2007 2008 2009 2010
Early January - 33 42 8 72 65 105 Late January 100 - - 36 106 136 - February 134 148 17 82 118 257 115 March - 65 - - - - 27
We have found that these periodic night-roost surveys are perhaps the most accurate indicator of the
number of eagles in the lower Hudson area during the winter, and strongly recommend they continue.
6. Hudson River (Upper): As reported here in past years, the Upper Hudson River and associated tributaries (Sacandaga,
Battenkill, Hoosic, Mohawk Rivers) from Lake Luzerne, NY to Albany, NY, also host eagles each winter. During the 2010 mid-winter survey, 14 bald eagles were recorded (13 ad, 1 imm) in this stretch, still well down from the record 22 eagles observed in this area in 2008, but in line with the 12 eagles spotted there in 2009 (8 ad, 4 imm).
The eastern-most section of the Mohawk River might also be considered part of this Upper Hudson
survey area, as it empties into the Hudson about nine miles north of Albany. Cohoes Falls, located along the Mohawk River approximately one-mile west of the Hudson, annually attracts a few eagles, likely due to a power-plant located there, but during our 2010 survey, only a single adult eagle was observed here.
19
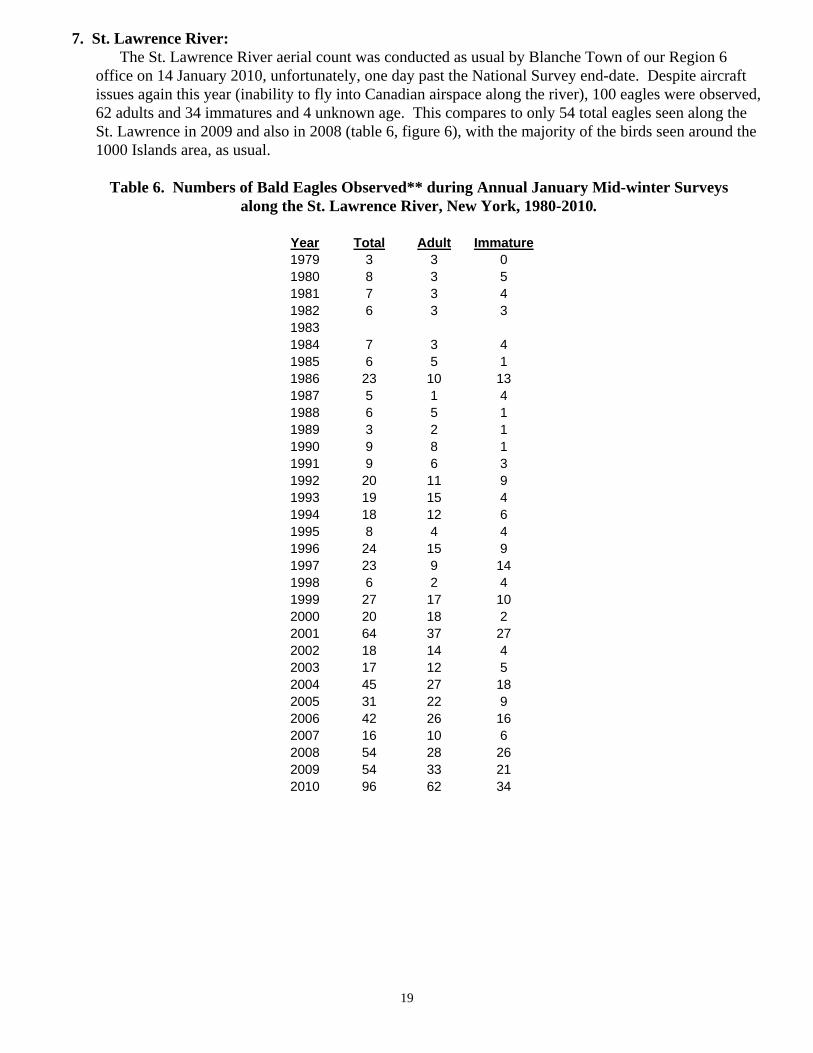
7. St. Lawrence River: The St. Lawrence River aerial count was conducted as usual by Blanche Town of our Region 6
office on 14 January 2010, unfortunately, one day past the National Survey end-date. Despite aircraft issues again this year (inability to fly into Canadian airspace along the river), 100 eagles were observed, 62 adults and 34 immatures and 4 unknown age. This compares to only 54 total eagles seen along the St. Lawrence in 2009 and also in 2008 (table 6, figure 6), with the majority of the birds seen around the 1000 Islands area, as usual.
Table 6. Numbers of Bald Eagles Observed** during Annual January Mid-winter Surveys
along the St. Lawrence River, New York, 1980-2010.
Year Total Adult Immature 1979 3 3 0 1980 8 3 5 1981 7 3 4 1982 6 3 3 1983 1984 7 3 4 1985 6 5 1 1986 23 10 13 1987 5 1 4 1988 6 5 1 1989 3 2 1 1990 9 8 1 1991 9 6 3 1992 20 11 9 1993 19 15 4 1994 18 12 6 1995 8 4 4 1996 24 15 9 1997 23 9 14 1998 6 2 4 1999 27 17 10 2000 20 18 2 2001 64 37 27 2002 18 14 4 2003 17 12 5 2004 45 27 18 2005 31 22 9 2006 42 26 16 2007 16 10 6 2008 54 28 26 2009 54 33 21 2010 96 62 34
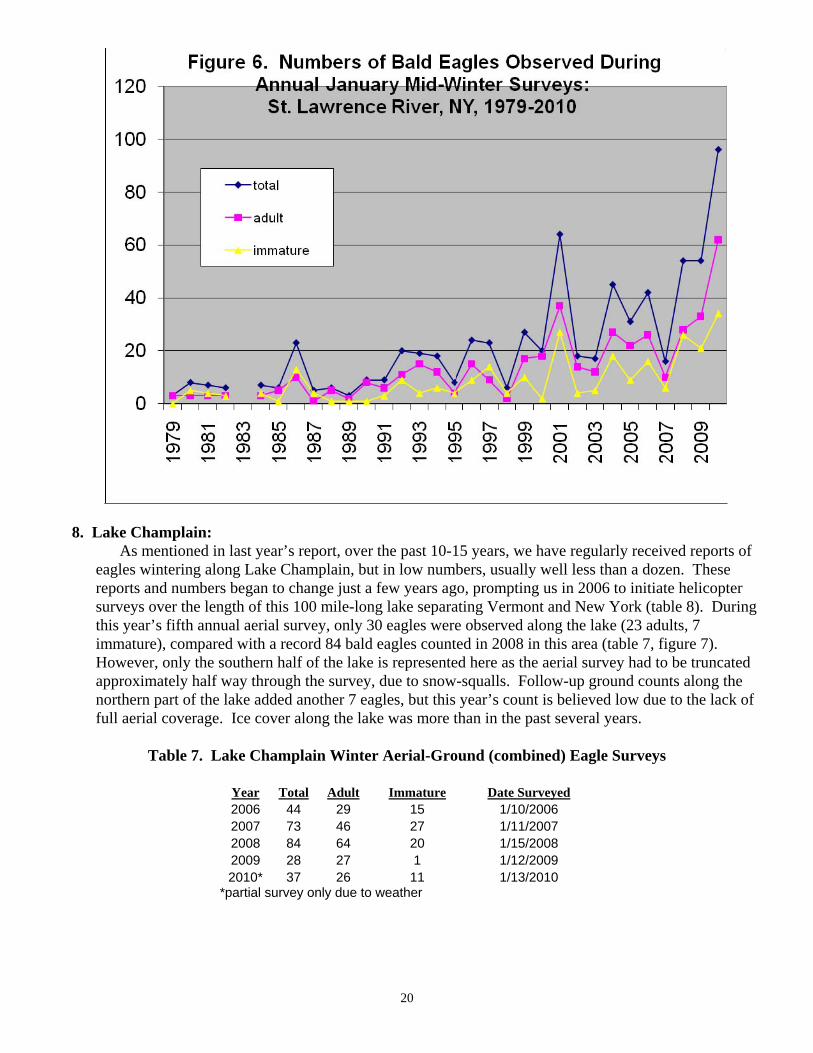
Figure 6
8. Lake Champlain:
As mentioned in last year’s report, over the past 10-15 years, we have regularly received reports of eagles wintering along Lake Champlain, but in low numbers, usually well less than a dozen. These reports and numbers began to change just a few years ago, prompting us in 2006 to initiate helicopter surveys over the length of this 100 mile-long lake separating Vermont and New York (table 8). During this year’s fifth annual aerial survey, only 30 eagles were observed along the lake (23 adults, 7 immature), compared with a record 84 bald eagles counted in 2008 in this area (table 7, figure 7). However, only the southern half of the lake is represented here as the aerial survey had to be truncated approximately half way through the survey, due to snow-squalls. Follow-up ground counts along the northern part of the lake added another 7 eagles, but this year’s count is believed low due to the lack of full aerial coverage. Ice cover along the lake was more than in the past several years.
Table 7. Lake Champlain Winter Aerial-Ground (combined) Eagle Surveys
Year Total Adult Immature Date Surveyed 2006 44 29 15 1/10/2006 2007 73 46 27 1/11/2007 2008 84 64 20 1/15/2008 2009 28 27 1 1/12/2009 2010* 37 26 11 1/13/2010
*partial survey only due to weather
20
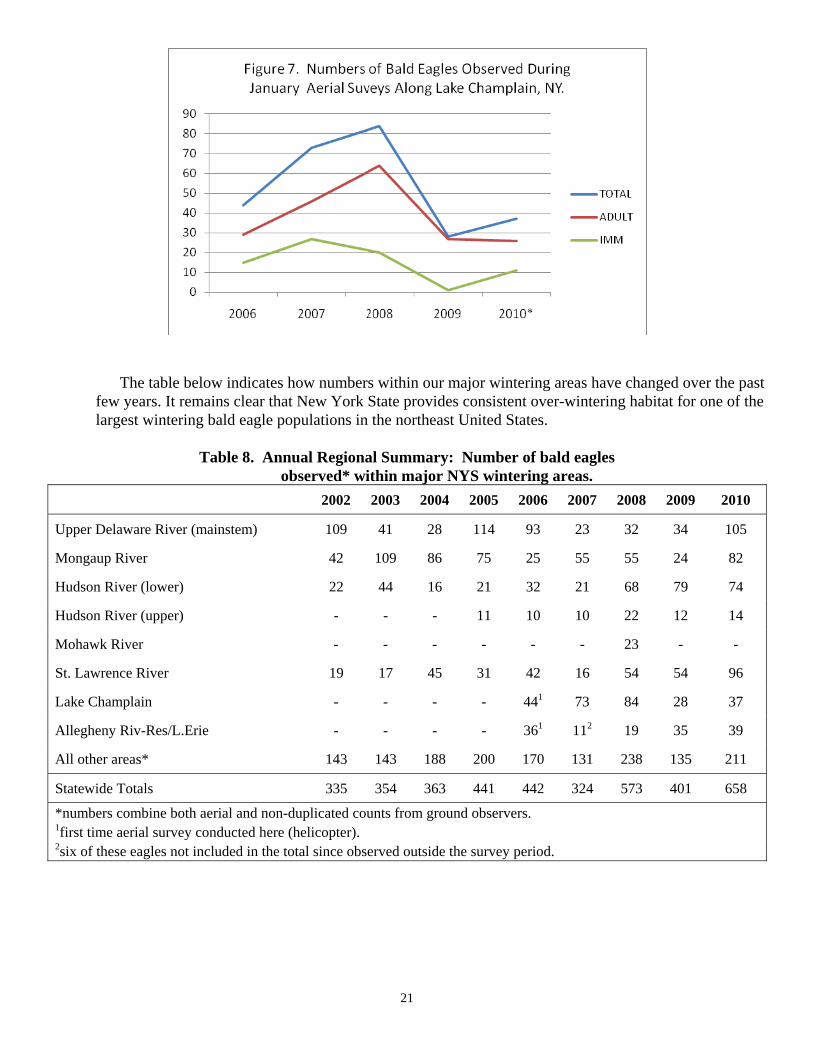
Figure 7
The table below indicates how numbers within our major wintering areas have changed over the past
few years. It remains clear that New York State provides consistent over-wintering habitat for one of the largest wintering bald eagle populations in the northeast United States.
Table 8. Annual Regional Summary: Number of bald eagles
observed* within major NYS wintering areas. 2002 2003 2004 2005 2006 2007 2008 2009 2010
Upper Delaware River (mainstem) 109 41 28 114 93 23 32 34 105
Mongaup River 42 109 86 75 25 55 55 24 82
Hudson River (lower) 22 44 16 21 32 21 68 79 74
Hudson River (upper) - - - 11 10 10 22 12 14
Mohawk River - - - - - - 23 - -
St. Lawrence River 19 17 45 31 42 16 54 54 96
Lake Champlain - - - - 441 73 84 28 37
Allegheny Riv-Res/L.Erie - - - - 361 112 19 35 39
All other areas* 143 143 188 200 170 131 238 135 211
Statewide Totals 335 354 363 441 442 324 573 401 658
*numbers combine both aerial and non-duplicated counts from ground observers. 1first time aerial survey conducted here (helicopter). 2six of these eagles not included in the total since observed outside the survey period.
21
Weather: unknown author
II. Breeding Bald Eagles
A. Surveys:
1. Statewide: As reported here each year for the past 30 years, New York has been enjoying a long-term,
consistent annual increase in our breeding bald eagle population, which continued in 2010. Although this trend was again evident in 2010 with an 11% increase in the total number of occupied pairs statewide and a 9% increase in total young fledged over 2009, 2010 could well be characterized as the year of weather, with numerous losses of both nest structures and young due to frequent and ill-timed severe thunderstorms and snow. Similar negative weather effects were reported in many of our neighboring Northeast states this year. And, for better or worse, New York eagles continued their recent trend of initiating nesting and egg-laying earlier in the year, with numerous pairs statewide now incubating in February, timing that presumably exposes such pairs to more severe weather events during the critical incubation and early nestling stages.
Spring and summer 2010 were on the wet side again, and depending on the region of New York, the
precipitation came as rain or snow. Southern NYS, especially the Delaware River Valley, received anywhere from 20-35” of snow in late February, and even the Albany area received 19” of snow on 24 February, when several pairs were already incubating. The end of March brought heavy rains, especially to Southeastern NYS, but also to central and eastern portions of the state, and strong winds and thunderstorms in this area toppled significant numbers of trees, including some eagle nest trees.
22
23
Significant snow affected northern NYS around Mother’s Day in early May, and more severe thunderstorms and heavy rains continued through May and June, toppling several of our nests and ejecting eaglets; at least three eaglets are known to have died and two more were rescued.
Again, however, despite these losses and failures, New York’s eagle numbers continued to grow. In 2010 we added 29 new pairs, and increased our total number of occupied pairs from 173 pairs in
2009 to 192 pairs statewide (table 9, figure 8). Our total number of breeding pairs (egg-layers) increased 9%, from 158 to 173 pairs, as did the number of successful pairs (those fledging young), which rose 13% from 123 pairs to 139 pairs. The total number of young also rose 9%, from 223 young in 2009 to 244 young fledging in New York in 2010. Our productivity values remain excellent as well, with 1.3 young fledged per occupied pair (same as in 2008 and 2009) and 72% of all occupied pairs successful in fledging young (figure 9).
The annual determination of the status of New York’s breeding bald eagle population involves
monitoring of existing pairs and follow-up observations on reported adults or new nests. This annual determination takes hundreds of hours of observation, in many cases by dedicated volunteers as well as DEC staff, and usually entails a minimum of at least two visits to the nesting territory to accurately determine the breeding status and outcome. In the past, the New York State Police Aviation Unit has provided essential aerial survey support for this effort, often the only way to confirm exactly what is going on in remote areas or up in the nests, short of actually climbing to the nests, and eliminating the need for more extensive manpower efforts on the ground. In 2010, however, NYS aircraft availability was drastically curtailed, requiring substantially more on-ground observational effort in an attempt to accurately determine the status of all known bald eagle nests in New York State. Even though most of our Regions and volunteers rose to this challenge, the author believes the number of young (and even the true outcome of some nests) as reported here is underestimated. In the absence of actually climbing to the nests or via helicopter observation, accurate counts of the number of young in successful nests is extremely difficult unless timed perfectly at the near-fledging stage.
While we have tried to visit each and every nest in the past, given the sheer numbers of nests we
now have and the limited staff and time, our approach to monitoring during the past few years and including this year, continued to focus on visitations to new or extremely remote nests where information on nest-status was otherwise difficult to obtain. In addition, due to the confirmed threat of Type E botulism to eagles in and around Lake Erie, Region 9 staff have indicated a desire to attempt to band eaglets produced in that area. Monitoring via volunteers, staff and limited aerial surveys were conducted as usual to determine early nesting activity (i.e. incubation), but final chick-counts (productivity) was determined mostly by on-ground nest visits, late nesting period distant ground observations when young were approaching fledging age and hence large enough to be easily visible on the nest, and very limited aerial survey, most using more difficult and inefficient fixed-wing aircraft, when available. Actual nest visits and climbing were restricted to new or remote territories or areas of concern as described above. This resulted in fewer young actually being banded this year, but still provided accurate chick-counts. If anything, increased reliance on late-season ground counts under-counts the actual number of young present, as, even at advanced ages, chicks can be “hidden” in the nest and not visible from below. We believe this was certainly the case in New York again in 2010, and that our total young-count under-represents the actual number of young eagles fledged in New York this year.
On-the-ground visits to new nests are extremely important to assess the breeding territory for safety
and/or potential disturbances which could affect the success of nesting attempts, as well as to meet landowners and explain eagle biology and needs, and to garner their cooperation.

24
Our nest visits accomplish these and other objectives each year: • inspect the integrity of nests • assess protection/management needs of the site • obtain a GPS (global position system) location • determine site conditions • predator-proof the nest tree • collect blood samples from select locations • identify and collect prey items • inspect any eaglets for disease, parasites or deformities • band and/or radio-tag the young • determine annual productivity • collect addled eggs • interact with landowners and garner their support • enter new territory information into the NYS Natural Heritage Database The effort to keep up with this ever-expanding breeding population, and to keep accurate records of
each of their annual outcomes, is significant, and could not be done without a major cooperative effort involving a small, and extremely dedicated core group of volunteers and DEC staff, to whom the State of New York and its citizens owe a huge voice of “thanks”, for the time and effort expended on their behalf. As a “keystone” species representative of some of our most unique, complex and sensitive aquatic and upland ecosystems, as the eagle goes, so go a plethora of other species as well as some of our most cherished habitats. Thus, conservation of the bald eagle benefits us and our children in uncountable ways.
Nest visits or surveys were made to all of the occupied sites (192), in addition to visits to numerous
other inactive and suspected breeding sites. Only 32 (eaglets were banded this year, compared to 54 banded last year. Many of the successful nests could not be banded either because of chick age
(chicks too young or too old), lack of landowner permission, condition of the tree (un-climbable), or mostly due to a lack of time for a climbing/banding visit. This latter category becomes larger each year, as our nesting population continues to increase. As mentioned, nest-tree visits are now focused on new territories (ones in need of a predator guard or gps’ing) or remote territories (ones not easily covered or observed to determine their status). Established territories where productivity can be easily determined from the ground are often simply counted if time is limited. As always, prey remains were identified from all nests climbed, and 7 addled eggs were collected during nest-visits again in 2010 (6 in 2009).
a. Contaminant Sampling
As usual shed adult feathers were collected from within and below nests again this year, as available, as were eggs. All feathers will be analyzed for Hg as well as additional genetic markers to garner information on parentage and gender. All collected eggs were measured and weighed, contents extracted for later analysis, and shells dried, weighed and measured for shell-thickness. b. Nesting Failures and other Miscellaneous Breeding Information
Examining our 2010 nest failures (53), as mentioned, weather was a major factor this year, accounting for the documented failure of 9 nesting attempts and the suspected failure of 8 more. A total of 19 of our 192 pairs were classified as “occupied-failed”, meaning the pair built/decorated a nest, but did not lay egg(s). Another 34 of 173 pairs who actually laid eggs were classified as “active-failed”, meaning they laid egg(s) or hatched young, but failed to successfully fledge young. Some of these failures were new pairs attempting to breed for their first time (10 of 29). Unknown causes accounted

for most of the nest failures: in addition to the weather-nest-structure failures, intraspecific aggression (another eagle) is suspected to have been the cause of failure in 3 instances and likely in many more of the “unknown” cases and human disturbance is believed to be the reason for failure in 2 cases.
Thirty-two additional pairs were classified as “inactive”, meaning eagles previously occupied these
territories but no longer do, or could not be found this year, or moved out of New York State and nested elsewhere (i.e. to Pennsylvania along the “other” side of the Delaware River). In all, we tracked 224 bald eagle nesting territories throughout NY during 2009, up from 195 in 2009 and 169 in 2008. Eleven percent of our previously established pairs (21 of 192 occupied pairs) built/used new nests within their territories in 2010 (14% in 2009, 16% in 2008, 20% in 2007).
As previously mentioned, the trend of earlier egg-laying by New York State bald eagles is
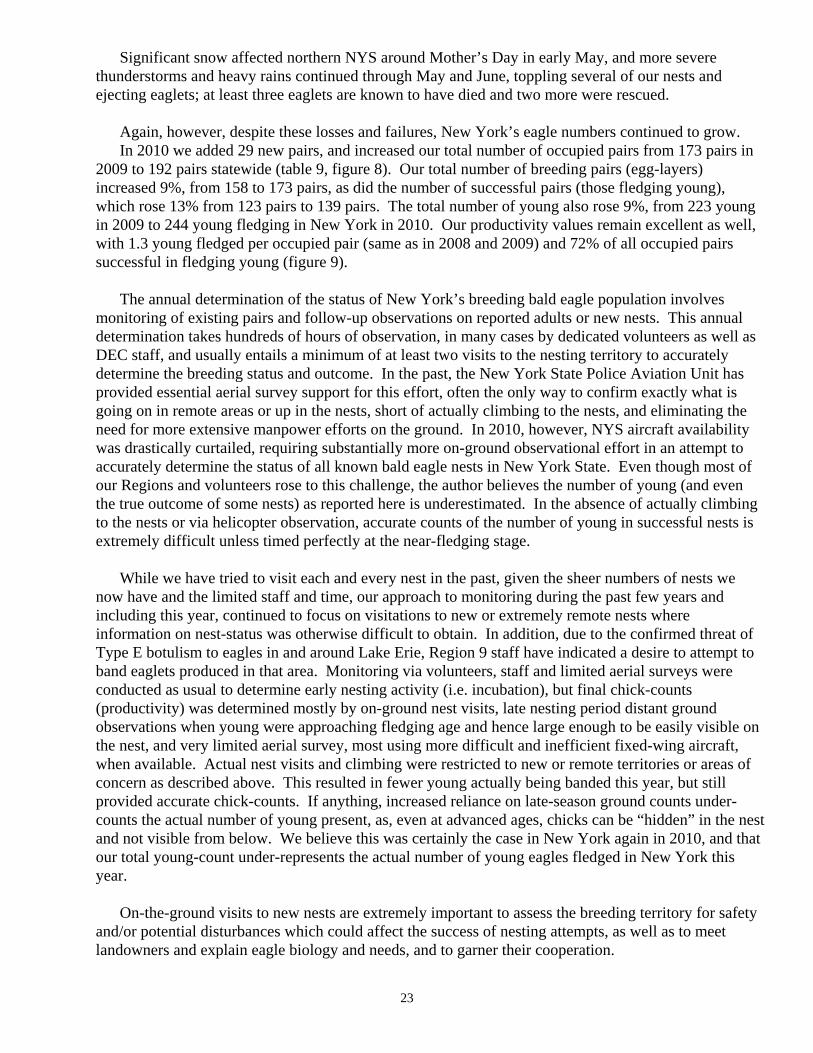
continuing, an observation being shared by other eagle researchers in North America. Many of our pairs now regularly lay eggs within the last two weeks of February, however the vast majority of our nesting pairs still lay eggs during March. Concerning successful nests and productivity, 54% of all our successful nests this year fledged two young (49% in 2009), 35% fledged one young (same as 2009), and 11% fledged three young (16% in 2009) (figure 10). Our productivity parameters of number of young per occupied pair and number of young per successful pair were again well above 1.0 young/pair, indicative of a healthy and still-growing population (figure 11).
6 March 2010, NY#115, Mud Lock: intruding sub-adult (suspected female) disrupts breeding attempt here in 2010. Photo: D. Racine
25

26
Table 9. New York State Bald Eagle Breeding Summary 2000-2010
2000
2001
2002 2003
2004
2005
2006
2007
2008
2009
2010
Number Territorial1 Pairs
51
65
70 75
84
92
110
1245
145
174
192
Number Occupied2 Pairs
51
62
70 75
84
92
110
1245
145
173
192
Number Breeding3 Pairs
43
56
60 68
79
86
101
1165
135
158
173
Number Successful4 Pairs
35
47
56 53
66
63
84
87
105
123
139
Percent of Occupied Pairs Successful
69
76
80 71
79
68
76
71
72
71
72
Number Young Produced (Fledged)
71
83
94 87
111
112
172
153
190
223
244
Young/Occupied Pair
1.35
1.34
1.34 1.16
1.32
1.22
1.56
1.24
1.31
1.29
1.27
Young/Breeding Pair
1.60
1.48
1.57 1.28
1.40
1.30
1.70
1.33
1.41
1.41
1.41
Young/Successful Pair
1.97
1.77
1.68 1.64 1.68 1.78 2.05 1.76
1.81
1.81 1.76
1 A territorial pair is defined by the presence of two potential breeding birds within suitable nesting habitat during the breeding season where some sign of pair bonding or nesting is also evident (e.g. copulation, stick-carrying, attempt at nest-building, etc.).
2 An occupied pair is defined by the presence of a recently decorated nest and two potential breeding birds during the breeding season. 3 A breeding pair is defined by a pair of birds within a nesting territory where evidence indicates that eggs were laid (such as eggs, young, incubation, or
eggshell fragments). "Breeding pair" replaces the old term "active nest."
4 A successful pair is defined as one which produces one or more young that reaches fledgling age.
5 One additional pair is included in these totals (NY#83, Waddington), known to be active/breeding, but final outcome unknown, so all other calculations do not include this extra pair.

Figure 8.
Figure 9.
27
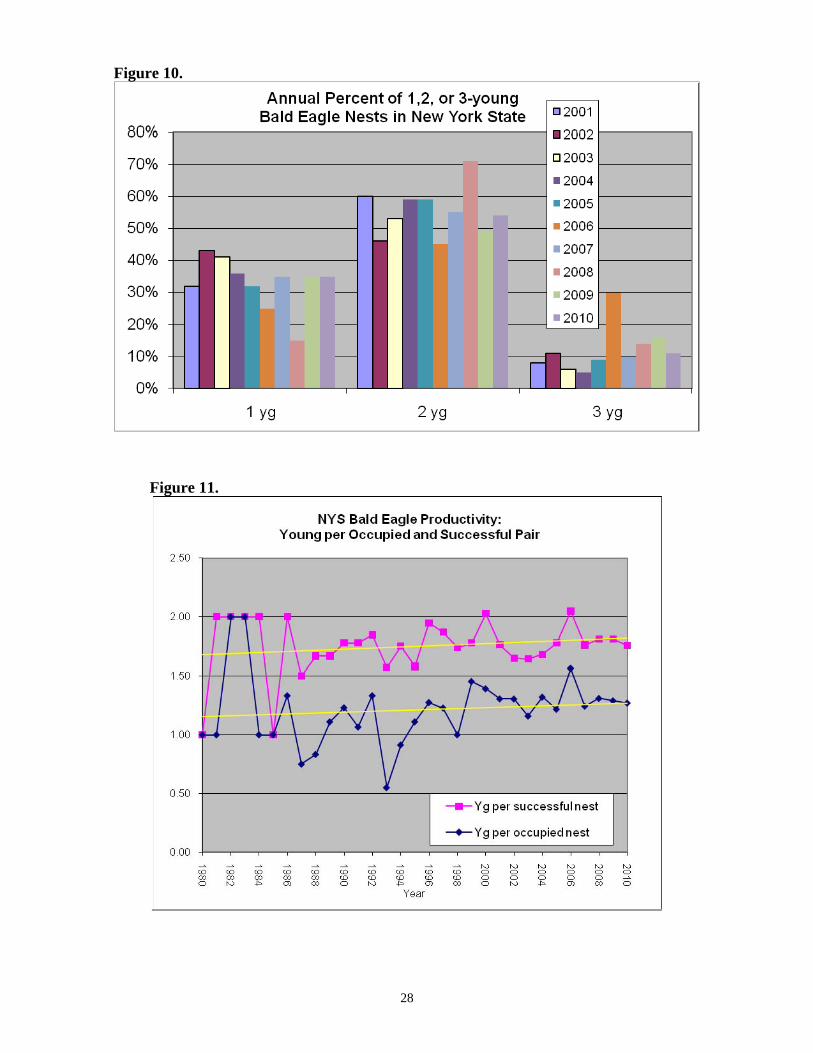
Figure 10.
Figure 11.
28
29
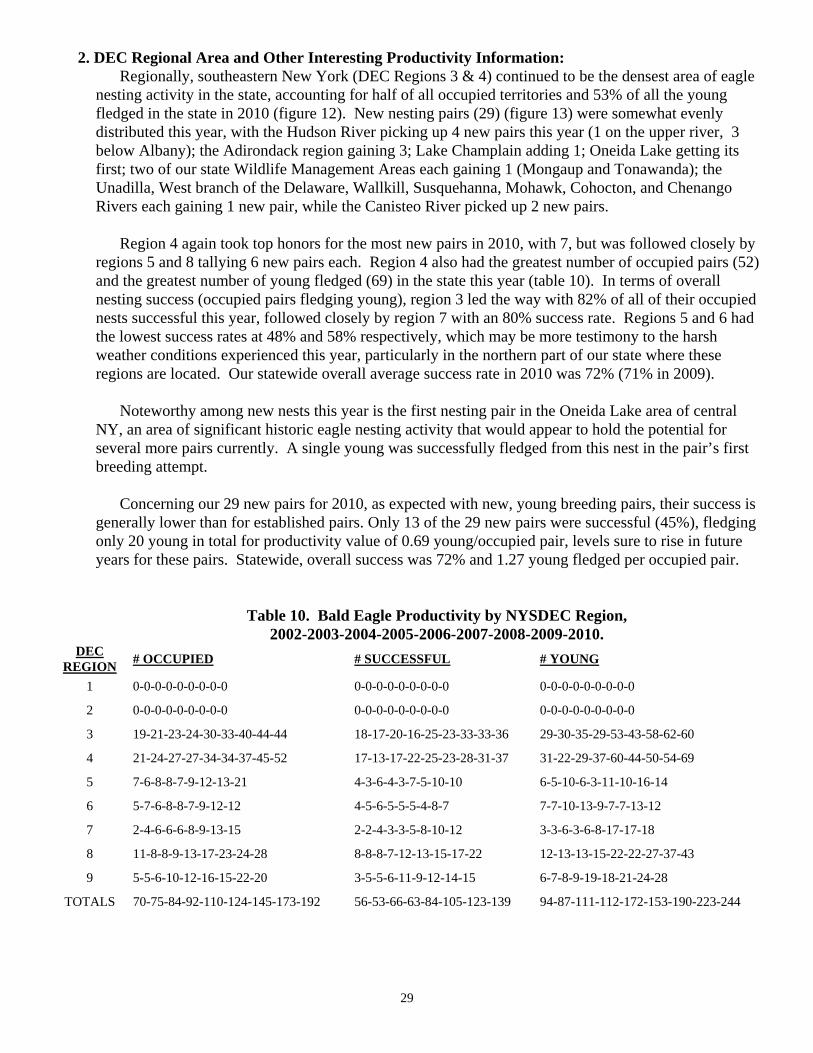
2. DEC Regional Area and Other Interesting Productivity Information: Regionally, southeastern New York (DEC Regions 3 & 4) continued to be the densest area of eagle
nesting activity in the state, accounting for half of all occupied territories and 53% of all the young fledged in the state in 2010 (figure 12). New nesting pairs (29) (figure 13) were somewhat evenly distributed this year, with the Hudson River picking up 4 new pairs this year (1 on the upper river, 3 below Albany); the Adirondack region gaining 3; Lake Champlain adding 1; Oneida Lake getting its first; two of our state Wildlife Management Areas each gaining 1 (Mongaup and Tonawanda); the Unadilla, West branch of the Delaware, Wallkill, Susquehanna, Mohawk, Cohocton, and Chenango Rivers each gaining 1 new pair, while the Canisteo River picked up 2 new pairs.
Region 4 again took top honors for the most new pairs in 2010, with 7, but was followed closely by
regions 5 and 8 tallying 6 new pairs each. Region 4 also had the greatest number of occupied pairs (52) and the greatest number of young fledged (69) in the state this year (table 10). In terms of overall nesting success (occupied pairs fledging young), region 3 led the way with 82% of all of their occupied nests successful this year, followed closely by region 7 with an 80% success rate. Regions 5 and 6 had the lowest success rates at 48% and 58% respectively, which may be more testimony to the harsh weather conditions experienced this year, particularly in the northern part of our state where these regions are located. Our statewide overall average success rate in 2010 was 72% (71% in 2009).
Noteworthy among new nests this year is the first nesting pair in the Oneida Lake area of central
NY, an area of significant historic eagle nesting activity that would appear to hold the potential for several more pairs currently. A single young was successfully fledged from this nest in the pair’s first breeding attempt.
Concerning our 29 new pairs for 2010, as expected with new, young breeding pairs, their success is
generally lower than for established pairs. Only 13 of the 29 new pairs were successful (45%), fledging only 20 young in total for productivity value of 0.69 young/occupied pair, levels sure to rise in future years for these pairs. Statewide, overall success was 72% and 1.27 young fledged per occupied pair.
Table 10. Bald Eagle Productivity by NYSDEC Region, 2002-2003-2004-2005-2006-2007-2008-2009-2010.
DEC REGION # OCCUPIED # SUCCESSFUL # YOUNG
1 0-0-0-0-0-0-0-0-0 0-0-0-0-0-0-0-0-0 0-0-0-0-0-0-0-0-0
2 0-0-0-0-0-0-0-0-0 0-0-0-0-0-0-0-0-0 0-0-0-0-0-0-0-0-0
3 19-21-23-24-30-33-40-44-44 18-17-20-16-25-23-33-33-36 29-30-35-29-53-43-58-62-60
4 21-24-27-27-34-34-37-45-52 17-13-17-22-25-23-28-31-37 31-22-29-37-60-44-50-54-69
5 7-6-8-8-7-9-12-13-21 4-3-6-4-3-7-5-10-10 6-5-10-6-3-11-10-16-14
6 5-7-6-8-8-7-9-12-12 4-5-6-5-5-5-4-8-7 7-7-10-13-9-7-7-13-12
7 2-4-6-6-6-8-9-13-15 2-2-4-3-3-5-8-10-12 3-3-6-3-6-8-17-17-18
8 11-8-8-9-13-17-23-24-28 8-8-8-7-12-13-15-17-22 12-13-13-15-22-22-27-37-43
9 5-5-6-10-12-16-15-22-20 3-5-5-6-11-9-12-14-15 6-7-8-9-19-18-21-24-28
TOTALS 70-75-84-92-110-124-145-173-192 56-53-66-63-84-105-123-139 94-87-111-112-172-153-190-223-244
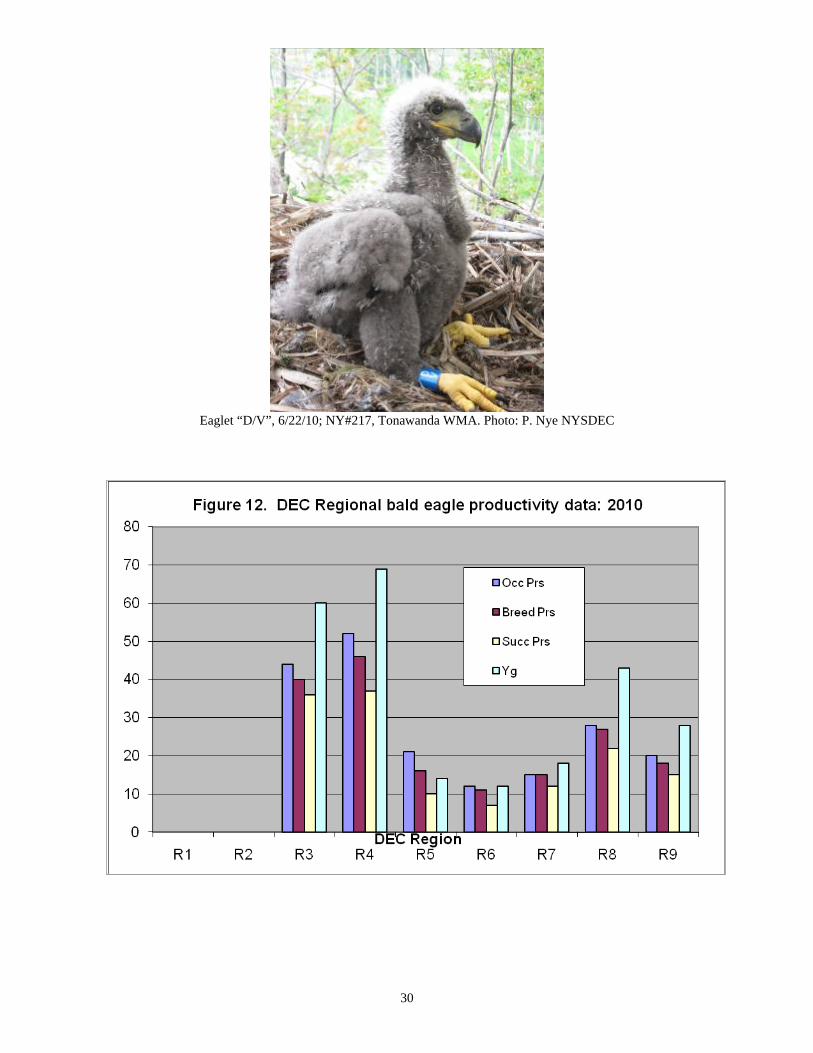
Eaglet “D/V”, 6/22/10; NY#217, Tonawanda WMA. Photo: P. Nye NYSDEC
Figure 12
30
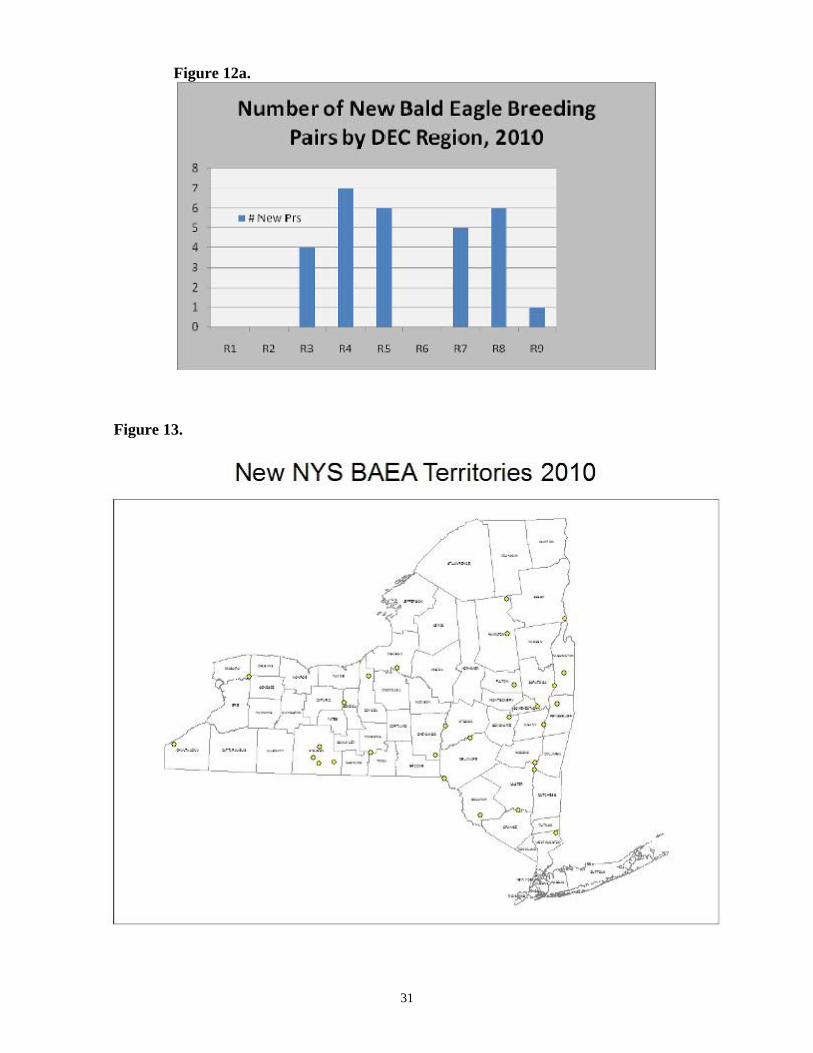
Figure 12a.
Figure 13.
31
a. Hudson River Our Hudson River (HR) breeding bald eagle population continued to grow in 2010, adding 4 new
pairs, and happily, production by the 27 occupied pairs jumped back up in 2010, with 1.11 young produced for each pair attempting to breed (only 0.96 in 2009). The total number of young fledged also increased from 2009, to 30 young (23 fledged in 2009) (table 11, figure 14). We confirmed one failure due to conspecifics and three others coming from new nesting pairs. Another nest was partially destroyed during a storm, ejecting two advanced aged fledgling, but both were cared for by the adults on the ground and went on to successfully fledge. We have seen considerable amounts of intraspecific interactions (eagles being affected by other eagles) along the Hudson, which may well be the cause in some of the other failures.
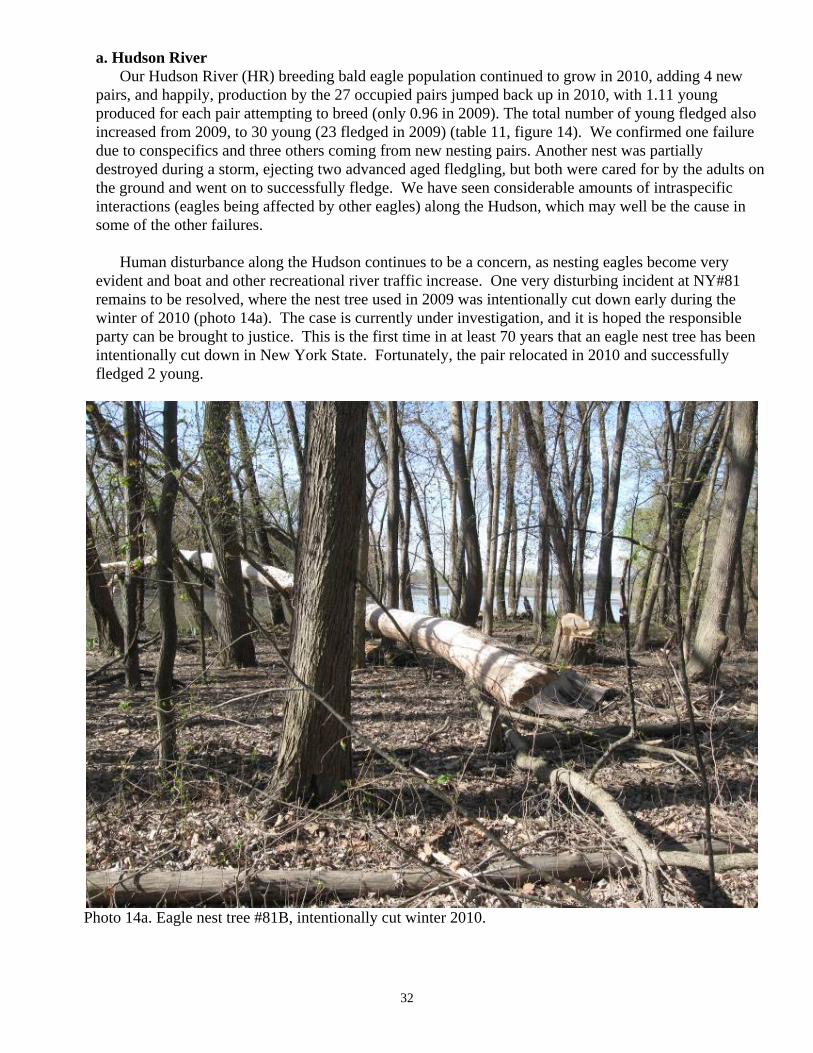
Human disturbance along the Hudson continues to be a concern, as nesting eagles become very
evident and boat and other recreational river traffic increase. One very disturbing incident at NY#81 remains to be resolved, where the nest tree used in 2009 was intentionally cut down early during the winter of 2010 (photo 14a). The case is currently under investigation, and it is hoped the responsible party can be brought to justice. This is the first time in at least 70 years that an eagle nest tree has been intentionally cut down in New York State. Fortunately, the pair relocated in 2010 and successfully fledged 2 young.
Photo 14a. Eagle nest tree #81B, intentionally cut winter 2010.
32
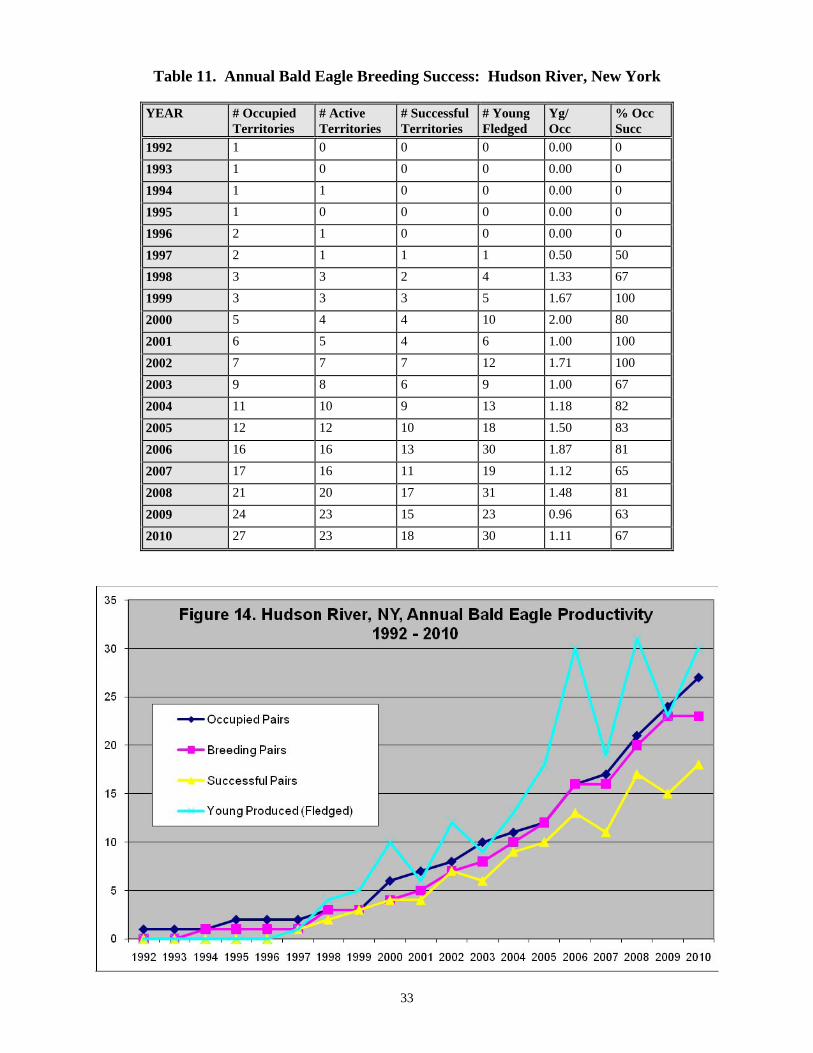
Table 11. Annual Bald Eagle Breeding Success: Hudson River, New York
YEAR # Occupied
Territories # Active Territories
# Successful Territories
# Young Fledged
Yg/ Occ
% Occ Succ
1992 1 0 0 0 0.00 0
1993 1 0 0 0 0.00 0
1994 1 1 0 0 0.00 0
1995 1 0 0 0 0.00 0
1996 2 1 0 0 0.00 0
1997 2 1 1 1 0.50 50
1998 3 3 2 4 1.33 67
1999 3 3 3 5 1.67 100
2000 5 4 4 10 2.00 80
2001 6 5 4 6 1.00 100
2002 7 7 7 12 1.71 100
2003 9 8 6 9 1.00 67
2004 11 10 9 13 1.18 82
2005 12 12 10 18 1.50 83
2006 16 16 13 30 1.87 81
2007 17 16 11 19 1.12 65
2008 21 20 17 31 1.48 81
2009 24 23 15 23 0.96 63
2010 27 23 18 30 1.11 67
Figure 14
33
34
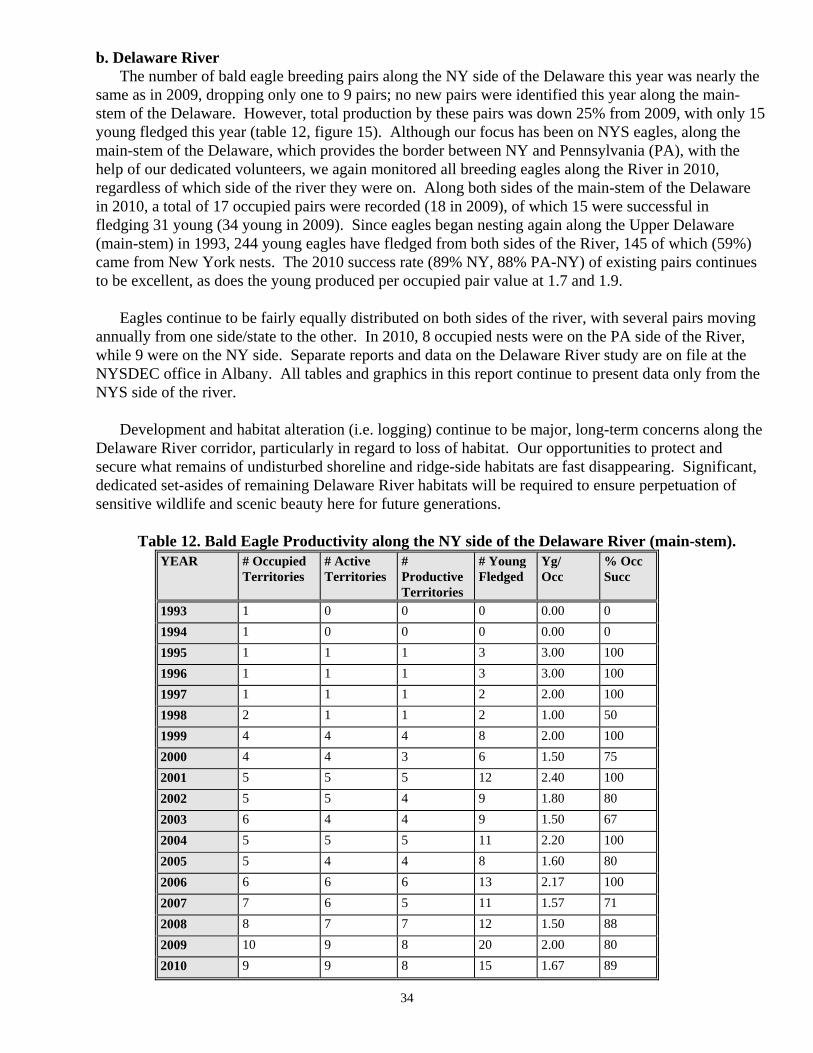
b. Delaware River The number of bald eagle breeding pairs along the NY side of the Delaware this year was nearly the
same as in 2009, dropping only one to 9 pairs; no new pairs were identified this year along the main-stem of the Delaware. However, total production by these pairs was down 25% from 2009, with only 15 young fledged this year (table 12, figure 15). Although our focus has been on NYS eagles, along the main-stem of the Delaware, which provides the border between NY and Pennsylvania (PA), with the help of our dedicated volunteers, we again monitored all breeding eagles along the River in 2010, regardless of which side of the river they were on. Along both sides of the main-stem of the Delaware in 2010, a total of 17 occupied pairs were recorded (18 in 2009), of which 15 were successful in fledging 31 young (34 young in 2009). Since eagles began nesting again along the Upper Delaware (main-stem) in 1993, 244 young eagles have fledged from both sides of the River, 145 of which (59%) came from New York nests. The 2010 success rate (89% NY, 88% PA-NY) of existing pairs continues to be excellent, as does the young produced per occupied pair value at 1.7 and 1.9.
Eagles continue to be fairly equally distributed on both sides of the river, with several pairs moving
annually from one side/state to the other. In 2010, 8 occupied nests were on the PA side of the River, while 9 were on the NY side. Separate reports and data on the Delaware River study are on file at the NYSDEC office in Albany. All tables and graphics in this report continue to present data only from the NYS side of the river.
Development and habitat alteration (i.e. logging) continue to be major, long-term concerns along the
Delaware River corridor, particularly in regard to loss of habitat. Our opportunities to protect and secure what remains of undisturbed shoreline and ridge-side habitats are fast disappearing. Significant, dedicated set-asides of remaining Delaware River habitats will be required to ensure perpetuation of sensitive wildlife and scenic beauty here for future generations.
Table 12. Bald Eagle Productivity along the NY side of the Delaware River (main-stem).
YEAR # Occupied Territories
# Active Territories
# Productive Territories
# Young Fledged
Yg/ Occ
% Occ Succ
1993 1 0 0 0 0.00 0 1994 1 0 0 0 0.00 0 1995 1 1 1 3 3.00 100 1996 1 1 1 3 3.00 100 1997 1 1 1 2 2.00 100 1998 2 1 1 2 1.00 50 1999 4 4 4 8 2.00 100 2000 4 4 3 6 1.50 75 2001 5 5 5 12 2.40 100 2002 5 5 4 9 1.80 80 2003 6 4 4 9 1.50 67 2004 5 5 5 11 2.20 100 2005 5 4 4 8 1.60 80 2006 6 6 6 13 2.17 100 2007 7 6 5 11 1.57 71 2008 8 7 7 12 1.50 88 2009 10 9 8 20 2.00 80 2010 9 9 8 15 1.67 89

Figure 15
NYS Summary: Annual Bald Eagle Breeding Success: Figure 16
35
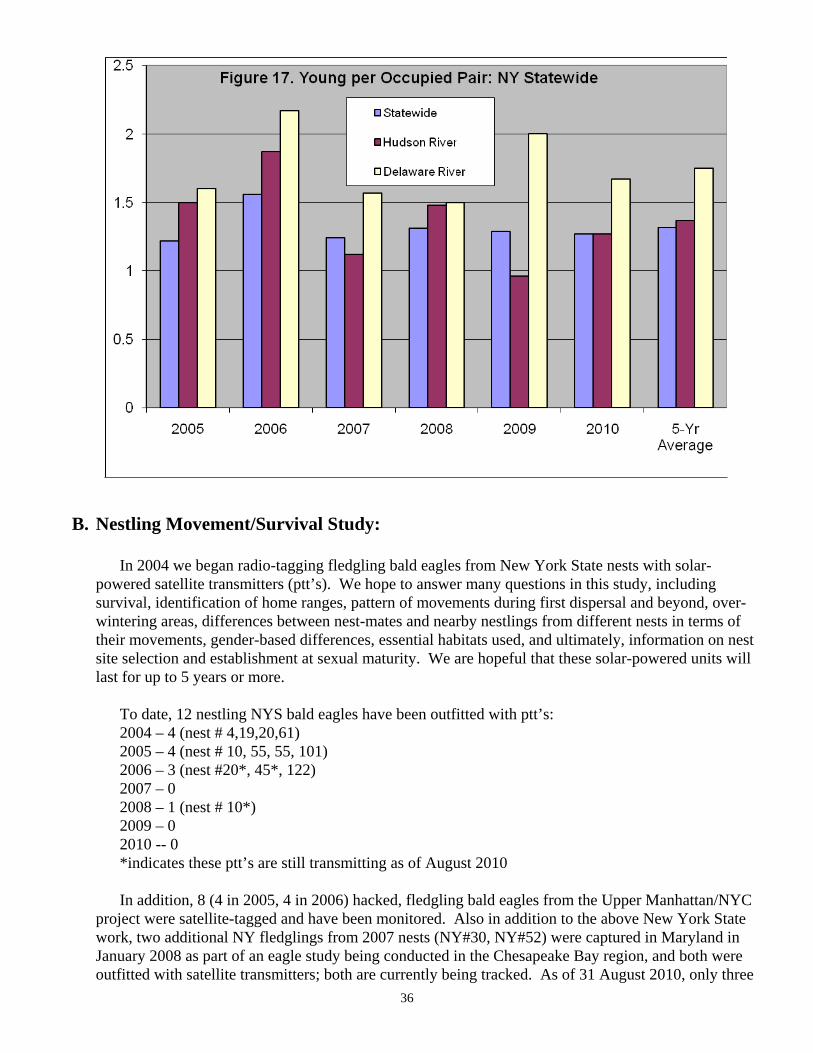
Figure 17
B. Nestling Movement/Survival Study:
In 2004 we began radio-tagging fledgling bald eagles from New York State nests with solar-powered satellite transmitters (ptt’s). We hope to answer many questions in this study, including survival, identification of home ranges, pattern of movements during first dispersal and beyond, over-wintering areas, differences between nest-mates and nearby nestlings from different nests in terms of their movements, gender-based differences, essential habitats used, and ultimately, information on nest site selection and establishment at sexual maturity. We are hopeful that these solar-powered units will last for up to 5 years or more.
To date, 12 nestling NYS bald eagles have been outfitted with ptt’s: 2004 – 4 (nest # 4,19,20,61) 2005 – 4 (nest # 10, 55, 55, 101) 2006 – 3 (nest #20*, 45*, 122) 2007 – 0 2008 – 1 (nest # 10*) 2009 – 0 2010 -- 0 *indicates these ptt’s are still transmitting as of August 2010 In addition, 8 (4 in 2005, 4 in 2006) hacked, fledgling bald eagles from the Upper Manhattan/NYC
project were satellite-tagged and have been monitored. Also in addition to the above New York State work, two additional NY fledglings from 2007 nests (NY#30, NY#52) were captured in Maryland in January 2008 as part of an eagle study being conducted in the Chesapeake Bay region, and both were outfitted with satellite transmitters; both are currently being tracked. As of 31 August 2010, only three
36

37
of these 12 NYS nestling eagles are still transmitting, the same three as in 2009, meaning that the rest of these eagles have either died or their radios have quit functioning. Two units from 2006 and one from 2008 continue to transmit. At this time, two of these birds remain in NY, and one is in PA just below the Delaware River. None of the eight NYC hacked birds are transmitting.
A joint paper on fledgling bald eagle movements as determined from satellite telemetry is currently
being prepared with Bird Studies Canada. C. Observations of Banded Eagles:
Volunteers and other random observers reported on 52 different color-banded bald eagles so far this year whose origin could be identified via their unique alphanumeric bands, including 42 New York eagles and 10 eagles from other states observed here in New York. All but one of these color-banded eagles were observed within New York; one New York banded eagle was identified in PA, a bird from 2005. Out-of-state eagles identified in New York so far in 2010 included 7 from MA, 2 from CT, and 1 from ME. New York-banded eagles were well distributed regarding year-banded, with the oldest observation of an eagle from year 1995:
Year of banding and Number of NYS Bald Eagles Observed from that year, 2010.
Year # of eagles observed 1995 1 1996 1 2000 1 2001 1 2002 1 2003 2 2004 4 2005 6 2006 9 2007 8 2008 6 2009 1
D. Recoveries:
Each year, numerous eagles are recovered in NYS debilitated or dead. During the current reporting period, 1 January - 31 December 2009, 45 bald eagles were recovered in New York State, double the usual number of annual recoveries. Seven of these eagles were recovered alive, one of which was successfully rehabilitated and released with considerable help and personal attention from very caring folks such as our cooperating veterinarians Dr. William Saleen and Dr. Ed Becker, rehabilitators Bill and Stephanie Streeter, Cindy Page, Kathy Michell, and many other concerned folks who recovered, aided, and notified us, including many DEC regional staff and staff of New York City DEP, who went out of their way to recover and transport these birds. Two other eagles remain in captivity and in rehabilitation.
38
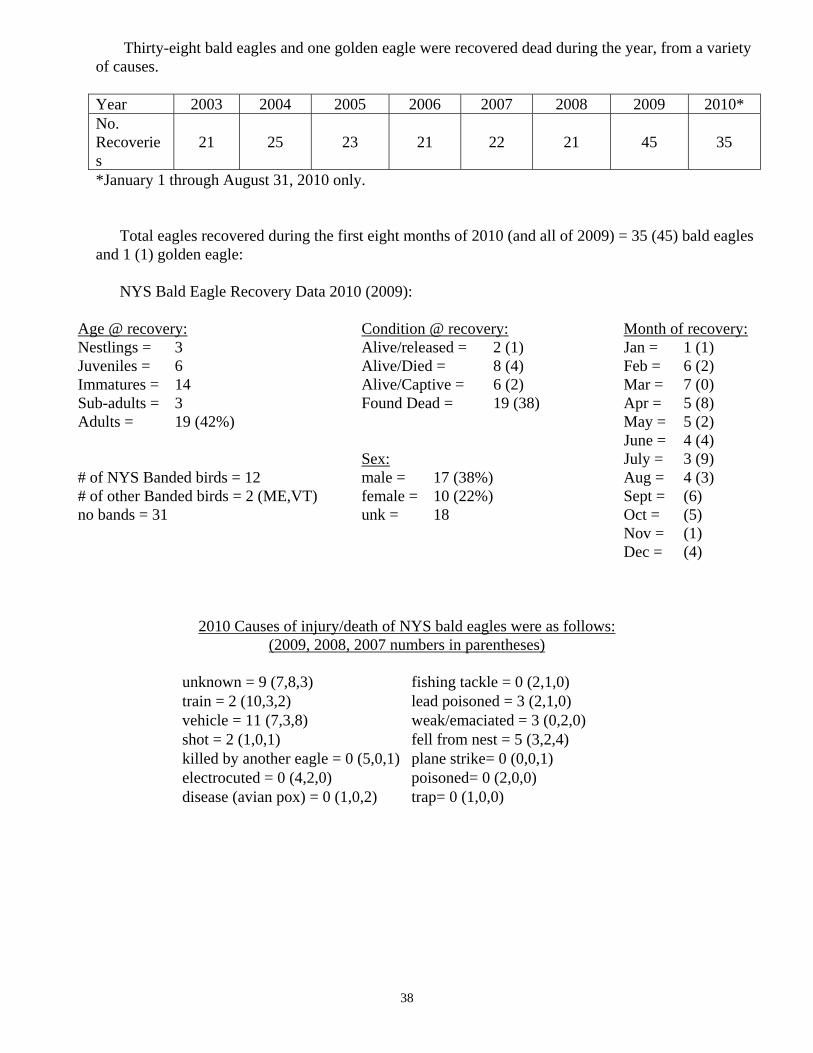
Thirty-eight bald eagles and one golden eagle were recovered dead during the year, from a variety of causes. Year 2003 2004 2005 2006 2007 2008 2009 2010* No. Recoveries
21 25 23 21 22 21 45 35
*January 1 through August 31, 2010 only.
Total eagles recovered during the first eight months of 2010 (and all of 2009) = 35 (45) bald eagles and 1 (1) golden eagle:
NYS Bald Eagle Recovery Data 2010 (2009):
Age @ recovery: Nestlings = 3 Juveniles = 6 Immatures = 14 Sub-adults = 3 Adults = 19 (42%) # of NYS Banded birds = 12 # of other Banded birds = 2 (ME,VT) no bands = 31
Condition @ recovery: Alive/released = 2 (1) Alive/Died = 8 (4) Alive/Captive = 6 (2) Found Dead = 19 (38)
Sex: male = 17 (38%) female = 10 (22%) unk = 18
Month of recovery: Jan = 1 (1) Feb = 6 (2) Mar = 7 (0) Apr = 5 (8) May = 5 (2) June = 4 (4) July = 3 (9) Aug = 4 (3) Sept = (6) Oct = (5) Nov = (1) Dec = (4)
2010 Causes of injury/death of NYS bald eagles were as follows:
(2009, 2008, 2007 numbers in parentheses)
unknown = 9 (7,8,3) fishing tackle = 0 (2,1,0) train = 2 (10,3,2) lead poisoned = 3 (2,1,0) vehicle = 11 (7,3,8) weak/emaciated = 3 (0,2,0) shot = 2 (1,0,1) fell from nest = 5 (3,2,4) killed by another eagle = 0 (5,0,1) plane strike= 0 (0,0,1) electrocuted = 0 (4,2,0) poisoned= 0 (2,0,0) disease (avian pox) = 0 (1,0,2) trap= 0 (1,0,0)
39
Noteworthy among these recoveries continues to be the number of eagles killed by vehicles in New York, a trend we are likely to see continue, as our eagle population continues to expand. Eagles regularly scavenge along RR tracks and roadways, often resulting in collisions. Also continuing to be noteworthy are deaths or impairment due to lead poisoning, a growing concern not only for eagles but for all scavenging raptors that should be addressed.
The single golden eagle recovered this year (so far) was an unbanded adult bird, female, found dead
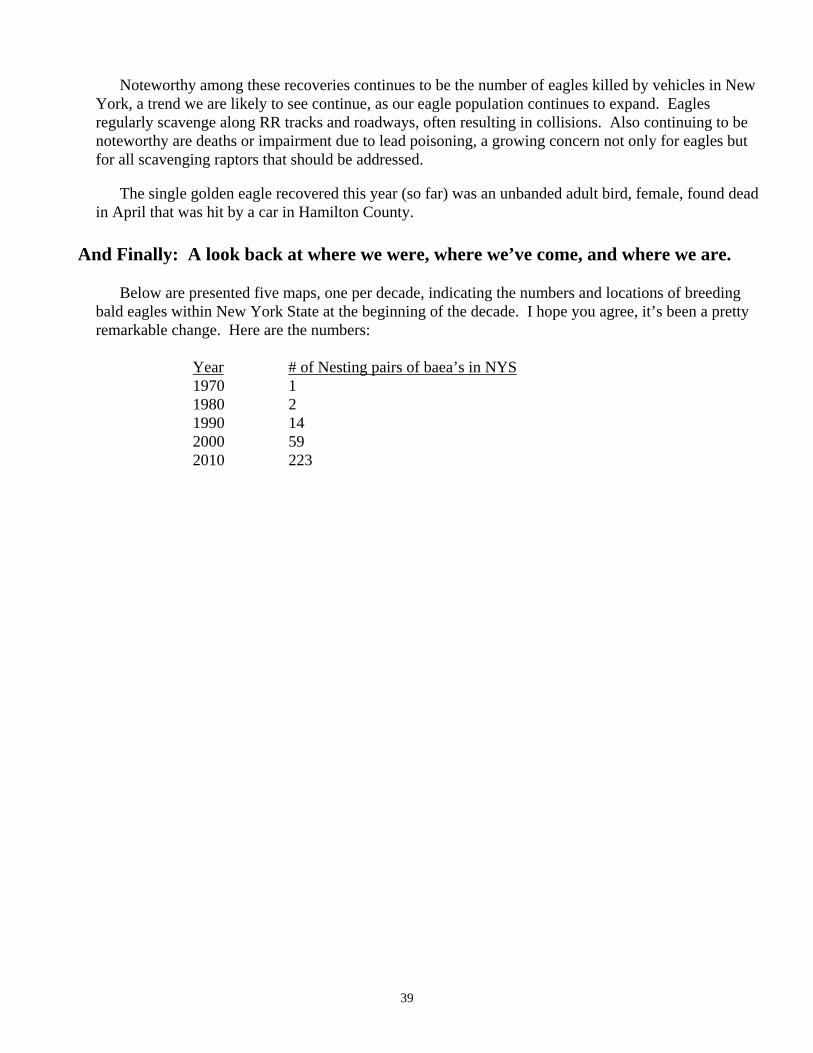
in April that was hit by a car in Hamilton County. And Finally: A look back at where we were, where we’ve come, and where we are.
Below are presented five maps, one per decade, indicating the numbers and locations of breeding bald eagles within New York State at the beginning of the decade. I hope you agree, it’s been a pretty remarkable change. Here are the numbers:
Year # of Nesting pairs of baea’s in NYS 1970 1 1980 2 1990 14 2000 59 2010 223
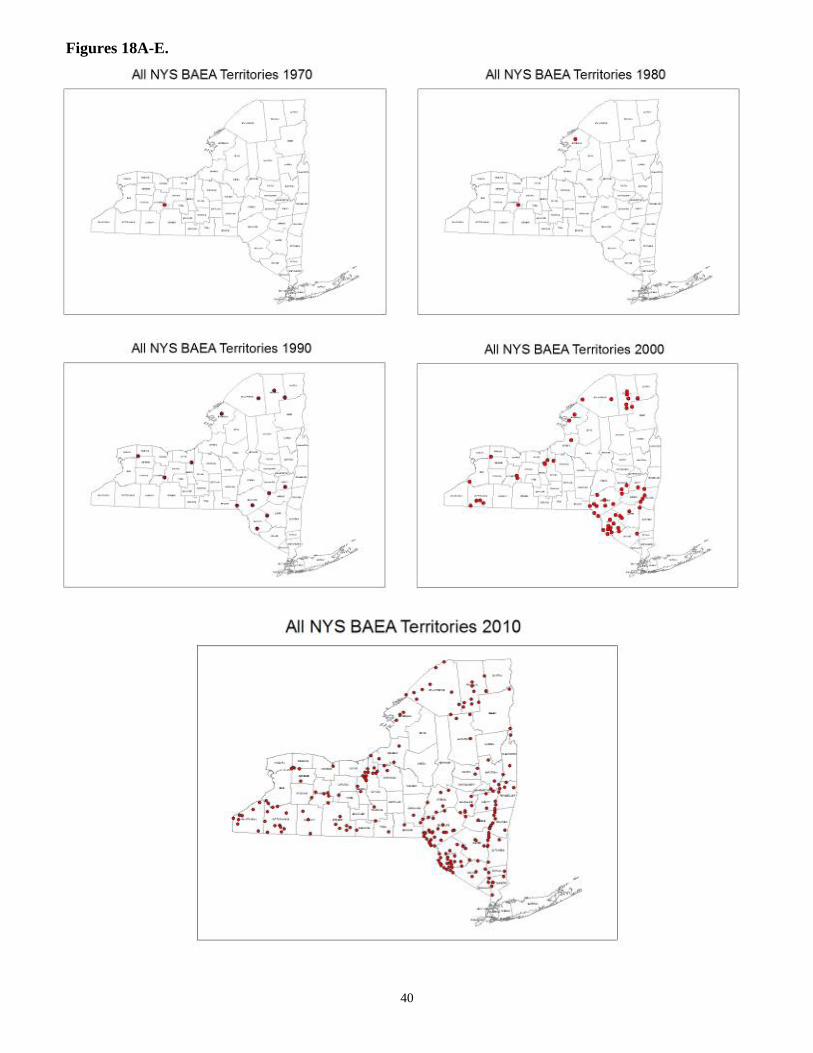
Figures 18A-E.
40
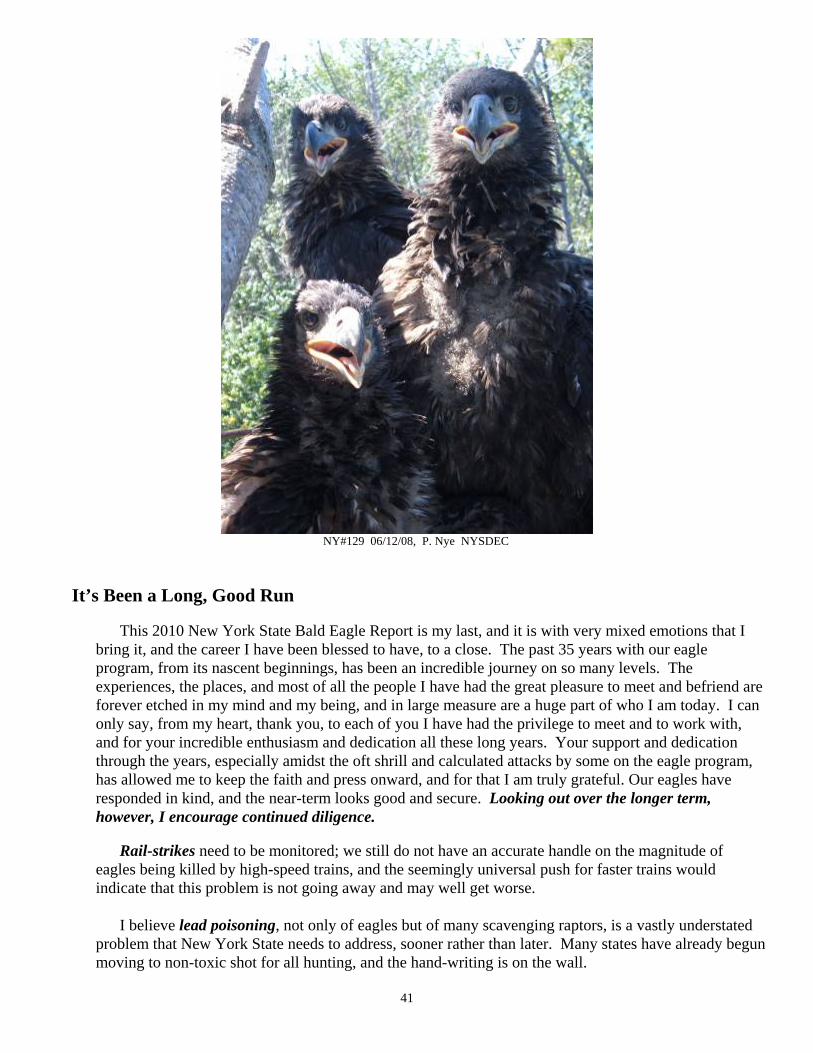
NY#129 06/12/08, P. Nye NYSDEC
It’s Been a Long, Good Run
This 2010 New York State Bald Eagle Report is my last, and it is with very mixed emotions that I
bring it, and the career I have been blessed to have, to a close. The past 35 years with our eagle program, from its nascent beginnings, has been an incredible journey on so many levels. The experiences, the places, and most of all the people I have had the great pleasure to meet and befriend are forever etched in my mind and my being, and in large measure are a huge part of who I am today. I can only say, from my heart, thank you, to each of you I have had the privilege to meet and to work with, and for your incredible enthusiasm and dedication all these long years. Your support and dedication through the years, especially amidst the oft shrill and calculated attacks by some on the eagle program, has allowed me to keep the faith and press onward, and for that I am truly grateful. Our eagles have responded in kind, and the near-term looks good and secure. Looking out over the longer term, however, I encourage continued diligence.
Rail-strikes need to be monitored; we still do not have an accurate handle on the magnitude of
eagles being killed by high-speed trains, and the seemingly universal push for faster trains would indicate that this problem is not going away and may well get worse.
I believe lead poisoning, not only of eagles but of many scavenging raptors, is a vastly understated
problem that New York State needs to address, sooner rather than later. Many states have already begun moving to non-toxic shot for all hunting, and the hand-writing is on the wall.
41
And finally, the crush of humanity moving into and affecting more and more of our remaining open space will not stop and will be accelerating. Given the resounding success of the bald eagle restoration program, there will be (and has been already) a call to delist the bald eagle from our state threatened species list. My fear in that action is that we will lose the only current nexus we now have in bringing landowners and developers to the table to discuss eagle management and habitat protection needs. Without the “listing” hook, I fear many nesting territories will be negatively impacted without our knowledge, and we then must be hopeful that sheer numbers ameliorate these losses.
On the plus side, in 2010, for the first time, open-bait sets for trapping, a cause of numerous raptor-
captures and injuries, have been banned in new regulations, a major, positive step for New York State raptors.
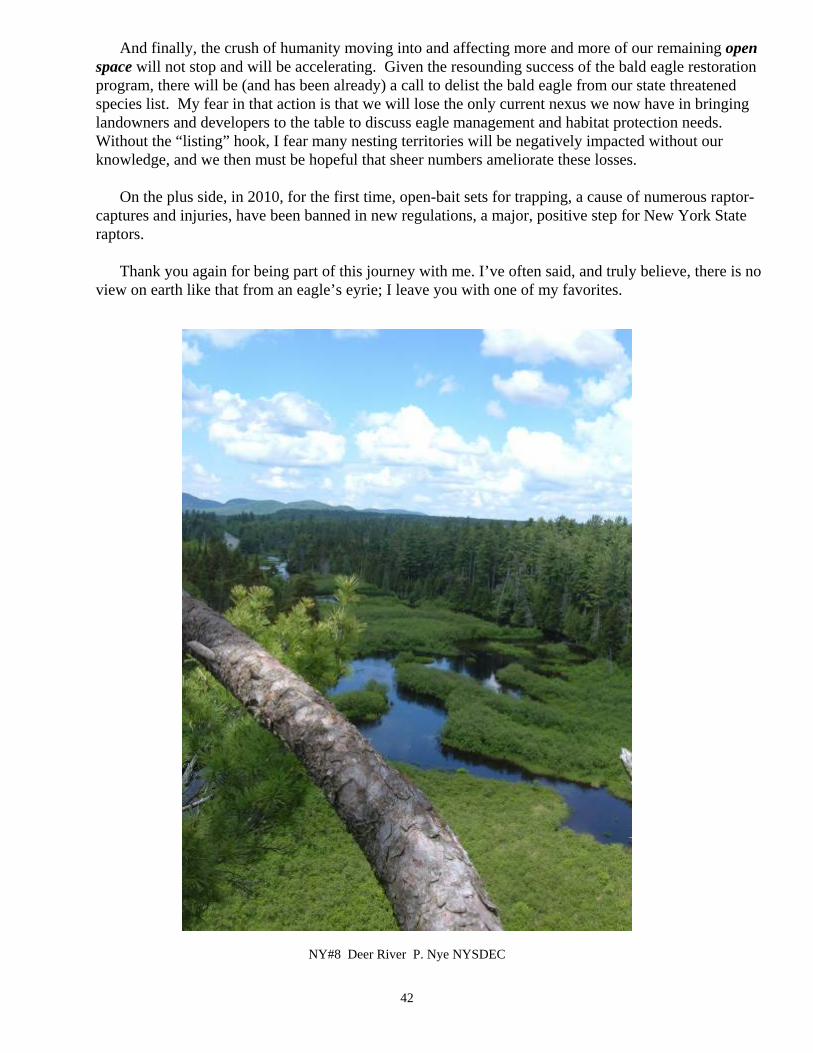
Thank you again for being part of this journey with me. I’ve often said, and truly believe, there is no
view on earth like that from an eagle’s eyrie; I leave you with one of my favorites.
NY#8 Deer River P. Nye NYSDEC
42
Acknowledgements Sincere thanks again are due the many, extremely dedicated regional DEC staff and volunteers who help
keep track of New York’s eagles, both summer and winter, each year. Without these folks’ tireless dedication and countless hours, most of this data-gathering would not be possible.
Special recognition again this year goes to DEC and volunteer staff Glenn Hewitt (CO), Scott
VanArsdale (R4), Joe Racette (R5), Blanche Town (R6), Bonnie Parton and Lance Clark (R7), Mike Allen (R8 retired), Jim Eckler and Frank Morlock (R8), Ken Roblee and staff Gary Klock, Bob Lichorat, and Greg Ecker (R9), Kathy Maloney (R4 volunteer), Kathy Michell and Scott Rando (R3 volunteers), and Doug Traudt and Kate Zvokel (Hudson River volunteers) for their role in leg work, banding, monitoring and landowner contacts. Without their time and very capable help this year and vital ground observations, complete nest monitoring and information would not have been possible, especially so this year given the removal of considerable aerial support.
Recognition and special thanks are also due the following folks on our New York State Eagle Team,
without whose enthusiasm, dedication, and time, all of these great results would not be possible! HUGE thank-you’s to our 2010 “crew”: -Ed McGowan and Melissa Gillmer, OPRHP
-Ed Becker -Lori McKean and The Eagle Institute gang -Anne Cooke -Bill Moore -Major Day -Chris Nadareski, Mike Reid and Paul Oehrlein,
NYC Dept. of Environmental Protection -Keith D. @ Big Wolf -Larry Federman -Scott Rando -Bob Garrison and Bob Marx -Doug Racine -Amy Greher -Mike Risinit -Don Hamilton, National Park Service -Don Root, City of Rochester -Seneca Nation of Indians -Jean Soprano -Jim Kilgore -Doug Traudt and Kate Zvokel, Biological Survey -Tom Lake NYSDEC -Vicki Vosburgh -Linda “stick” LaPan - Marybeth Warburton -Dave Lindemann -Gene Weinstein -Kathy Maloney -Dennis Wischman -Kathy Michell
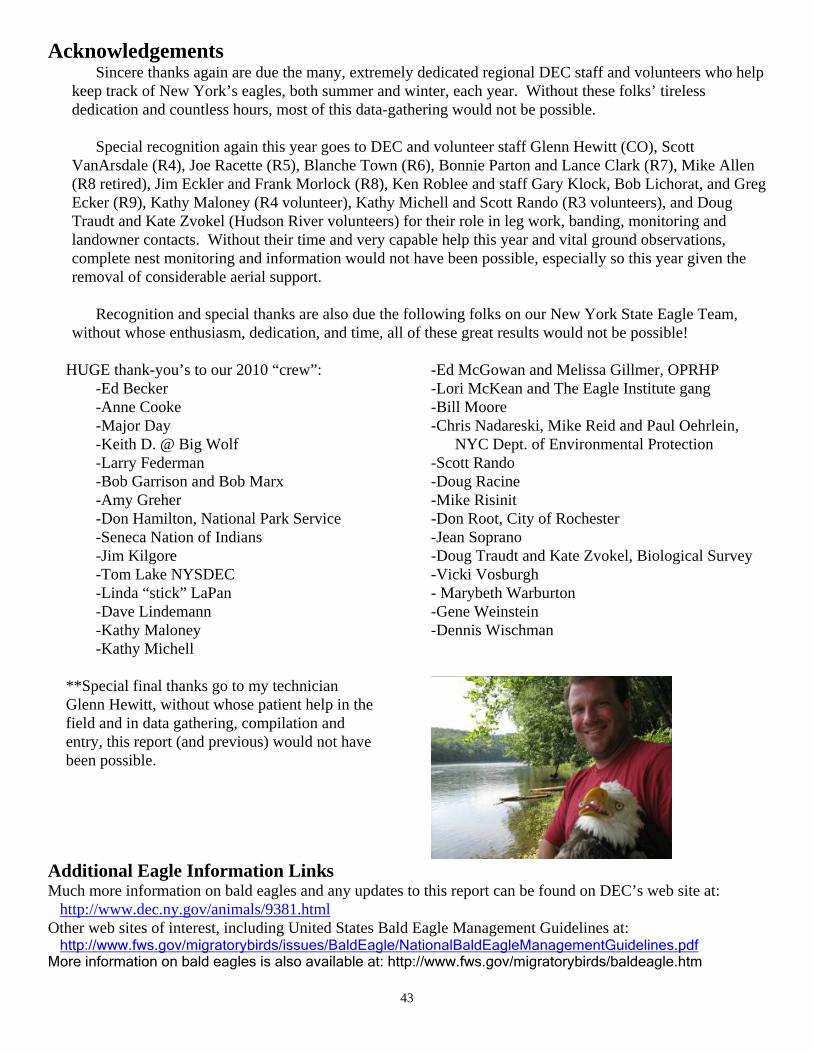
**Special final thanks go to my technician
Glenn Hewitt, without whose patient help in the field and in data gathering, compilation and entry, this report (and previous) would not have been possible.
Additional Eagle Information Links Much more information on bald eagles and any updates to this report can be found on DEC’s web site at:
http://www.dec.ny.gov/animals/9381.html Other web sites of interest, including United States Bald Eagle Management Guidelines at:
http://www.fws.gov/migratorybirds/issues/BaldEagle/NationalBaldEagleManagementGuidelines.pdf More information on bald eagles is also available at: http://www.fws.gov/migratorybirds/baldeagle.htm
43