new york state examination in grade 4 elementary-level ... · 2014 field test analysis, equating...
TRANSCRIPT
New York State Examination in Grade 4 Elementary-Level Science
2014 Field Test Analysis, Equating Procedure, and Scaling of
Operational Test Forms
Technical Report
Prepared for the New York State Education Department by Pearson
January 2015

Copyright
Developed and published under contract with the New York State Education Department by Pearson.
Copyright © 2014 by the New York State Education Department.

Prepared for NYSED by Pearson i
Table of Contents
Table of Contents ............................................................................................................. i
List of Tables ................................................................................................................... iii
List of Figures .................................................................................................................. iii
Section I: Introduction ...................................................................................................... 1
PURPOSE ................................................................................................................................................ 1
Section II: Field Test Analysis ......................................................................................... 1
FILE PROCESSING AND DATA CLEANUP ............................................................................................ 2
CLASSICAL ANALYSIS ........................................................................................................................... 2 Item Difficulty ........................................................................................................................................ 3 Item Discrimination ............................................................................................................................... 3 Test Reliability ...................................................................................................................................... 4 Scoring Reliability ................................................................................................................................. 4 Inter-rater Agreement ........................................................................................................................... 5 Constructed-Response Item Means and Standard Deviations ............................................................ 6 Intraclass Correlation............................................................................................................................ 6 Weighted Kappa ................................................................................................................................... 7
ITEM RESPONSE THEORY (IRT) AND THE CALIBRATION AND EQUATING OF THE FIELD TEST 7 Item Calibration .................................................................................................................................... 9 Item Fit Evaluation .............................................................................................................................. 10
DIFFERENTIAL ITEM FUNCTIONING................................................................................................... 11 The Mantel Chi-Square and Standardized Mean Difference ............................................................. 12 Multiple-Choice Items ......................................................................................................................... 13 The Odds Ratio .................................................................................................................................. 13 The Delta Scale .................................................................................................................................. 14 DIF Classification for MC Items .......................................................................................................... 14 DIF Classification for CR Items .......................................................................................................... 14
Section III: Equating Procedure ..................................................................................... 15
RANDOMLY EQUIVALENT GROUP EQUATING DESIGN .................................................................. 15
Section IV: Scaling of Operational Test Forms .............................................................. 17
References .................................................................................................................... 21
Appendix A: Classical Item Analysis ............................................................................. 23
Appendix B: Inter-rater Consistency – Point Differences Between First and Second Reads ............................................................................................................................ 31
Appendix C: Additional Measures of Inter-rater Reliability and Agreement ................... 33

Prepared for NYSED by Pearson ii
Appendix D: Partial-Credit Model Item Analysis ............................................................ 36
Appendix E: DIF Statistics ............................................................................................. 42
Appendix F: Operational Test Maps .............................................................................. 48
Appendix G: Scoring Tables .......................................................................................... 50

Prepared for NYSED by Pearson iii
List of Tables Table 1. Need/Resource Capacity Category Definitions ................................................. 1 Table 2. Classical Item Analysis Summary ..................................................................... 4 Table 3. Test and Scoring Reliability ............................................................................... 5 Table 4. Criteria to Evaluate Mean-Square Fit Statistics ............................................... 10 Table 5. Partial-Credit Model Item Analysis Summary .................................................. 11 Table 6. DIF Classification for MC Items ....................................................................... 14 Table 7. DIF Classification for CR Items ....................................................................... 14 Table 8. Initial Mean Abilities and Equating Constants.................................................. 17
List of Figures Figure 1. 2 × t Contingency Table at the kth of K Levels. ............................................... 12

Prepared for NYSED by Pearson 1
Section I: Introduction
PURPOSE The purpose of this report is to document the psychometric properties of the
New York State Examination in Grade 4 Elementary-Level Science. In addition, this report documents the procedures used to analyze the results of the field test and to equate and scale the operational test forms.
Section II: Field Test Analysis
In May 2014, prospective items for the New York State Examination in Grade 4 Elementary-Level Science were field tested. The results of this testing were used to evaluate item quality. Only items with acceptable statistical characteristics can be selected for use on operational tests.
Representative student samples for participation in this testing were selected to
mirror the demographics of the student population that is expected to take the operational test. The Need/Resource Capacity Categories in Table 1 were used as variables in the sampling plan. Table 1. Need/Resource Capacity Category Definitions
Need/Resource Capacity (N/RC) Category Definition
High N/RC Districts: New York City New York City
Large Cities Buffalo, Rochester, Syracuse, Yonkers
Urban/Suburban All districts at or above the 70th percentile on the index with at least 100 students per square mile or enrollment greater than 2500
Rural All districts at or above the 70th percentile on the index with fewer than 50 students per square mile or enrollment of fewer than 2500
Average N/RC Districts All districts between the 20th and 70th percentiles on the index
Low N/RC Districts All districts below the 20th percentile on the index
Charter Schools Each charter school is a district
Prepared for NYSED by Pearson 2
FILE PROCESSING AND DATA CLEANUP The assessment utilizes both multiple-choice (MC) and constructed-response (CR)
item types in order to more fully assess student ability. Multiple field test (FT) forms were given during this administration to allow for a large number of items to be field tested without placing an undue burden on the students participating in the field test; each student took only a small subset of the items being field tested. The NEW YORK STATE EDUCATION DEPARTMENT (NYSED) handled all scanning of MC responses and scoring of CR responses along with the composition of the student data file in-house and with other external vendors. After all scoring and scanning activities had been completed and the student data file built, it was supplied to Pearson and contained student MC responses and CR scores. In addition, the New York State Education Department (NYSED) also created and supplied a test map file that documented the items on each of the FT forms and a student data file layout that contained the position of every field within the student data file. Upon receipt of these files, Pearson staff checked the data, test map, and layout for consistency. Any anomalies were referred to the NYSED for resolution. After these had been resolved and corrected as necessary, final processing of the data file took place. This processing included the identification and deletion of invalid student test records through the application of a set of predefined exclusion rules1. The original student data file received from the NYSED contained 13,103 records; the final field test data file contained 13,038 records.
Within the final data file used in the field test analyses, MC responses were scored
according to the item keys contained in the test map; correct responses received a score of 1 while incorrect responses received a score of 0. CR item scores were taken directly from the student data file, with the exception that out-of-range scores were assigned scores of 0. For Item Response Theory (IRT) calibrations, blanks (i.e., missing data; not omits) were also scored as 0.
In addition to the scored data, the final data file also contained the unscored student
responses and scores. Unscored data was used to calculate the percentage of students who selected the various answer choices for the MC items or the percentage of students who received each achievable score point for the CR items. The frequency of students leaving items blank was also calculated. The scored data were used for all other analyses.
CLASSICAL ANALYSIS Classical Test Theory assumes that any observed test score x is composed of both
true score t and error score e. This assumption is expressed as follows:
x = t + e
1 These exclusion rules flagged records without both an MC and a CR component, records with invalid or out-of-range form numbers, records without any responses, and duplicate records. These records were dropped prior to analysis.

Prepared for NYSED by Pearson 3
All test scores are composed of both a true and an error component. For example, the choice of test items or administration conditions might influence student responses, making a student’s observed score higher or lower than the student’s true ability would warrant. This error component is random and uncorrelated with (i.e., unrelated to) the student’s true score. Across an infinitely large number of administrations, the mean of the error scores would be zero. Thus, the best estimate of a student’s true score for any test administration (or their expected score given their [unobservable] true level of ability or true score) is that student’s observed score. This expectation is expressed as follows:
E(x) = t
Item difficulties, point-biserial correlations, reliability estimates, and various statistics related to rater agreement have been calculated and are summarized in the following section.
Item Difficulty Item difficulty is typically defined as the average of scores for a given item. For MC
items, this value (commonly referred to as a p-value) ranges from 0 to 1. For CR items, this value ranges from 0 to the maximum possible score. In order to place all item means on a common metric (ranging from 0 to 1), CR item means were divided by the maximum points possible for the item.
Item Discrimination Item discrimination is defined as the correlation between a score on a given test
question and the overall raw test score. These correlations are Pearson correlation coefficients. For MC items, it is also known as the point-biserial correlation.
Table 2 presents a summary of the classical item analysis for each of the field test
forms. The first three columns from the left identify the form number, the number of students who took each form, and the number of items on each field test form, respectively. The remaining columns are divided into two sections (Item Difficulty and Discrimination). Recall that for CR items, item means were divided by the maximum number of points possible in order to place them in the same metric as the MC items. Sixteen items had difficulties that were greater than 0.90 and two items had correlations that were less than 0.25. In addition to the summary information provided in Table 2, further classical item statistics are provided in Appendix A.

Prepared for NYSED by Pearson 4
Table 2. Classical Item Analysis Summary
Form N-Count No. of Items
Item Difficulty Item Discrimination
<0.50 0.50 to 0.90 >0.90 <0.25 0.25 to
0.50 >0.50
501 793 25 2 23 0 0 19 6 502 836 11 1 8 0 0 4 5 503 829 11 5 4 0 0 5 4 504 826 11 1 9 1 0 9 2 505 842 11 3 8 0 0 11 0 506 836 10 2 5 1 0 2 6 507 827 12 3 8 1 1 10 1 508 810 12 3 8 1 0 11 1 509 831 11 1 8 2 1 9 1 510 809 12 2 8 2 0 10 2 511 820 12 2 6 1 0 8 1 512 795 12 2 9 1 0 6 6 513 767 12 4 8 0 0 7 5 514 801 11 1 7 3 0 9 2 515 821 12 0 8 2 0 6 4 516 795 11 3 5 1 0 5 4
For some forms, the item counts in the “Item Difficulty” and “Item Discrimination” columns may not sum to the value in the “No. of Items” column due to DNS (Do Not Score) items.
Test Reliability Reliability is the consistency of the results obtained from a measurement with
respect to time or between items or subjects that constitute a test. As such, test reliability can be estimated in a variety of ways. Internal consistency indices are a measure of how consistently examinees respond to items within a test. Two factors influence estimates of internal consistency: (1) test length and (2) homogeneity of the items. In general, the more items on the examination, the higher the reliability and the more similar the items, the higher the reliability.
Table 3 contains the internal consistency statistics for each of the field test forms
under the heading “Test Reliability.” These statistics ranged from 0.46 to 0.70. It should be noted that the field test forms (with the exception of the anchor Form [501]) were all considerably shorter than operational test forms typically are. Because operational tests are composed of more items, they would be expected to have higher reliabilities than do these field test forms.
Scoring Reliability One concern with CR items is the reliability of the scoring process (i.e., consistency
of the score assignment). CR items must be read by scorers who assign scores based on a comparison between the rubric and student responses. Consistency between

Prepared for NYSED by Pearson 5
scorers is a critical part of the reliability of the assessment. To track scorer consistency, approximately 10% of the test booklets are scored a second time (these are termed “second read scores”) and compared to the original set of scores (also known as “first read scores”).
As an overall measure of scoring reliability, the Pearson correlation coefficient
between the first and second scores for all CR items with second read scores was computed for each form. This statistic is often used as an overall indicator of scoring reliability, and it generally ranges from 0 to 1. Table 3 contains these values in the column headed “Scoring Reliability.” They ranged from 0.73 to 0.95, indicating a high degree of reliability. Table 3. Test and Scoring Reliability
Form Number Test Reliability Scoring Reliability 501 0.83 N/A 502 0.66 0.95 503 0.58 0.85 504 0.57 0.91 505 0.48 0.95 506 0.60 0.73 507 0.57 0.95 508 0.61 0.90 509 0.56 0.83 510 0.63 0.92 511 0.46 0.88 512 0.70 0.87 513 0.66 0.85 514 0.57 0.84 515 0.63 0.82 516 0.60 0.87
Scoring reliability was not able to be calculated for Form 501 as it was composed exclusively of MC items.
Inter-rater Agreement For each CR item, the difference between the first and second reads was tracked
and the number of times each possible difference between the scores occurred was tabulated. These values were then used to calculate the percentage of times each possible difference occurred. When examining inter-rater agreement statistics, it should be kept in mind that the maximum number of points per item varies, as shown in the “Score Points” column. Blank cells in the table indicate out-of-range differences (e.g., It is impossible for two raters to differ by more than one point in their scores on an item with a maximum possible score of one; cells in the table other than –1, 0, and 1 would therefore be blanked out.).

Prepared for NYSED by Pearson 6
Appendix B contains the proportion of occurrence of these differences for each CR
item. All items had a maximum point value of one. Appendix C contains additional summary information regarding the first and second reads, including the percentage of first and second scores that were exact or adjacent matches. Nonadjacent scores were not possible for the remaining one-point items.
Constructed-Response Item Means and Standard Deviations Appendix C also contains the mean and standard deviation of the first and second
scores for each CR item. The largest difference between the item means for the first and second read scores was 0.1, and there were minimal differences between the standard deviation statistics.
Intraclass Correlation In addition, Appendix C contains the intraclass correlations for the items. These
correlations are calculated using a formulation given by Shrout and Fleiss (1979). Specifically, they described six different models based on various configurations of judges and targets (in this case, papers that are being scored). For this assessment, the purpose of the statistic is to describe the reliability of single ratings, and each paper is scored by two judges who are randomly assigned from the larger pool of judges, and who score multiple papers. This description fits their “Case 1.” Further, they distinguish between situations where the score assigned to the paper is that of a single rater versus that when the score is the mean of k raters. Since the students’ operational scores are those from single (i.e., the first) raters, the proper intraclass correlation in this instance is termed by Shrout and Fleiss as “ICC(1,1).” It will be referred to herein simply as the “intraclass correlation” (ICC).
While the ICC is a bona fide correlation coefficient, it differs from a regular correlation coefficient in that its value remains the same, regardless of how the raters are ordered. A regular Pearson correlation coefficient would change values if, for example, half of the second raters were switched to the first position, while the ICC would maintain a consistent value. Because the papers were randomly assigned to the judges, ordering is arbitrary, and thus the ICC is a more appropriate measure of reliability than the Pearson correlation coefficient in this situation. The ICC ranges from zero (the scores given by the two judges are unrelated) to one (the scores from the two judges match perfectly); negative values are possible, but rare, and have essentially the same meaning as values of zero. It should also be noted that the ICC can be affected by low degrees of variance in the scores being related, similar to the way that regular Pearson correlation coefficients are affected. ICCs for items where almost every examinee achieved the same score point (e.g., an extremely easy dichotomous item where almost every examinee was able to answer it correctly) may have a low or negative ICC, even though almost all ratings by the judges matched exactly.
McGraw and Wong (1996, Table 4, p. 35) state that the ICC can be interpreted as “the degree of absolute agreement among measurements made on randomly selected objects. It estimates the correlation of any two measurements.” Since it is a correlation

Prepared for NYSED by Pearson 7
coefficient, its square indicates the percent of variance in the scores that is accounted for by the relationship between the two sets of scores (i.e., the two measurements). In this case, these scores are those of the pair of judges. ICC values greater than 0.60 indicate that at least 36% (0.602) of the variation in the scores given by the raters is accounted for by variations in the responses to the items that are being scored (e.g., variations in the ability being measured) rather than by variations caused by a combination of differences in the severity of the judges, interactions between judge severity and the items, and random error (e.g., variations exterior to the ability being measured). It is generally preferred that items have ICCs at this level or higher. Fifty-two out of fifty-four items had ICCs that were above 0.60. Consistent with other information provided in the table, these values indicate a high level of scoring reliability for almost all of the items in the field test.
Weighted Kappa Weighted Kappa (Cohen, 1968) was also calculated for each item, based on the first
and second reads, and is included in Appendix C as well. This statistic is an estimate of the agreement of the score classifications over and above that which would be expected to occur by chance. Similar to the ICC, its value can range between zero (the scores given by the judges agree as often as would be expected by chance) and one (scores given by the judges agree perfectly). In addition, negative values are possible, but rare, and have the same interpretation as zero values. One set of guidelines for the evaluation of this statistic is (Fleiss, 1981):
• k > 0.75 denotes excellent reproducibility • 0.4 < k < 0.75 denotes good reproducibility • 0 < k < 0.4 denotes marginal reproducibility
The results show excellent reproducibility between the first and second reads for all but two items, and good reproducibility for those two. With the lowest kappa being equal to 0.42, there were no items displaying marginal reproducibility. The scoring reliability analyses offer strong evidence that the scoring of the CR items was performed in a highly reliable manner.
ITEM RESPONSE THEORY (IRT) AND THE CALIBRATION AND EQUATING OF THE FIELD TEST
While classical test theory-based statistical measures are useful for assessing the suitability of items for operational use (e.g., use as part of an assessment used to measure student ability and thus having real-world consequences for students, teachers, schools, and administrators), their values are dependent on both the psychometric properties of the items and the ability distributions of the samples upon which they are based. In other words, classical test theory-based statistics are sample-dependent statistics.

Prepared for NYSED by Pearson 8
In contrast, Item Response Theory (IRT)-based statistics are not dependent on the sample over which they are estimated—they are invariant across different samples (Hambleton, Swaminathan, & Rogers, 1991; Lord, 1980). This invariance allows student ability to be estimated on a common metric even if different sets of items are used (as with different test forms over different test administrations).
The process of estimating IRT-based item parameters is referred to as “item
calibration,” and the placing of these parameters on a common metric or scale is termed “equating.” While one reason for the field testing of items is to allow their suitability for use in the operational measurement of student ability to be assessed, the data resulting from field testing is also used to place items on the scale of the operational test (i.e., they are equated to the operational metric). Once items are on this common metric, any form composed of items from this pool can be scaled (the process through which scale score equivalents for each achievable raw score are derived) and the resulting scale scores will be directly comparable to those from other administrations, even though the underlying test forms are composed of different sets of items.
There are several variations of IRT that differ mainly in the way item behavior is
modeled. The New York State Examination in Grade 4 Elementary Level Science uses the Rasch family of IRT statistics (Rasch, 1980; Masters, 1982) for calibration, scaling, and equating.
The most basic expression of the Rasch model is in the item characteristic curve. It
conceptualizes the probability of a correct response to an item as a function of the ability level and the item’s difficulty. The probability of a correct response is bounded by “1” (certainty of a correct response) and “0” (certainty of an incorrect response). The ability scale is theoretically unbounded. In practice, the ability scale ranges from approximately –4 to +4 logits. The relationship between examinee ability (θ,) item difficulty (Di), and probability of answering the item correctly (Pi) is shown in the equation below.
𝑃𝑖(𝜃) =exp (𝜃 − 𝐷𝑖)
1 + exp (𝜃 − 𝐷𝑖)
Examinee ability (θ) and item difficulty (Di) are on the same scale. This is useful for certain purposes. An examinee with an ability level equal to the item difficulty will have a 50% chance of answering the item correctly; if his or her ability level is higher than the item difficulty, then the probability of answering the item correctly is commensurately higher, and the converse is also true.
The Rasch Partial Credit Model (PCM) (Masters, 1982) is a direct extension of the dichotomous one-parameter IRT model above. For an item involving m score categories, the general expression for the probability of achieving a score of x on the item is given by

Prepared for NYSED by Pearson 9
𝑃𝑥(𝜃) =exp[∑ (𝜃 − 𝐷𝑘)𝑥
𝑘=0 ]∑ exp[∑ (𝜃 − 𝐷𝑘)ℎ
𝑘=0 ]𝑚ℎ=0
where
𝐷0 ≡ 0.0
In the above equation, Px is the probability of achieving a score of x given an ability of θ; m is the number of achievable score points minus one (note that the subscript k runs from 0 to m); and Dk is the step parameter for step k. The steps are numbered from 0 to the number of achievable score points minus one, and step 0 (D0) is defined as being equal to zero. Note that a four-point item, for example, usually has five achievable score points (0, 1, 2, 3, and 4), thus the step numbers usually mirror the achievable point values.
According to this model, the probability of an examinee scoring in a particular category (step) is the sum of the logit (log-odds) differences between θ and Dk of all the completed steps, divided by the sum of the differences of all the steps of an item. Thissen and Steinberg (1986) refer to this model as a divide-by-total model. The parameters estimated by this model are mi –1 threshold (difficulty) estimates and represent the points on the ability continuum where the probability of the examinee achieving score mi exceeds that of mi–1. The mean of these threshold estimates is used as an overall summary of the polytomous item’s difficulty.
If the number of achievable score points is one (i.e., the item is dichotomous), then the PCM reduces to the basic Rasch IRT model for dichotomous items. This means that dichotomous and polytomous items are being scaled using a common model and therefore can be calibrated, equated, and scaled together. It should be noted that the Rasch model assumes that all items have equal levels of discrimination and that there is no guessing on MC items. However, it is robust to violations of these assumptions, and items that violate these assumptions to a large degree are usually flagged for item-model misfit.
Item Calibration When interpreting IRT item parameters, it is important to remember that they do not
have an absolute scale—rather, their scale (in terms of mean and standard deviation) is purely arbitrary. It is conventional to set the mean of the item difficulties to zero when an assessment is scaled for the first time. Rasch IRT scales the theta measures in terms of logits, or “log-odds units.” The length of a logit varies from test to test, but generally the standard deviation of the item difficulties of a test scaled for the first time will be somewhere in the area of 0.6–0.8. While the item difficulties are invariant with respect to one another, the absolute level of difficulty represented by their mean is dependent on the overall difficulty of the group of items with which it was tested. In addition, there is no basis for assuming that the difficulty values are normally distributed around their mean—their distribution depends solely upon the intrinsic difficulties of the items themselves. Thus, if a particularly difficult set of items (relative to the set of items
Prepared for NYSED by Pearson 10
originally calibrated) was field tested, their overall mean would most probably be greater than zero, and their standard deviation would be considerably less than one. In addition, they would most probably not be normally distributed.
Rasch item difficulties generally range from –3.0 to 3.0, although very easy or very
difficult items can fall outside of this range. Items should not be discounted solely on the basis of their difficulty. A particular topic may require either a difficult or an easy item. Items are usually most useful if their difficulty is close to a cut score, as items provide the highest level of information at the ability level equal to their difficulty. Items with difficulties farther away from the cuts provide less information about students with abilities close to the cut scores (and hence are more susceptible to misclassification), but are still useful. In general, items should be selected for use based on their content, with their Rasch difficulty being only a secondary consideration.
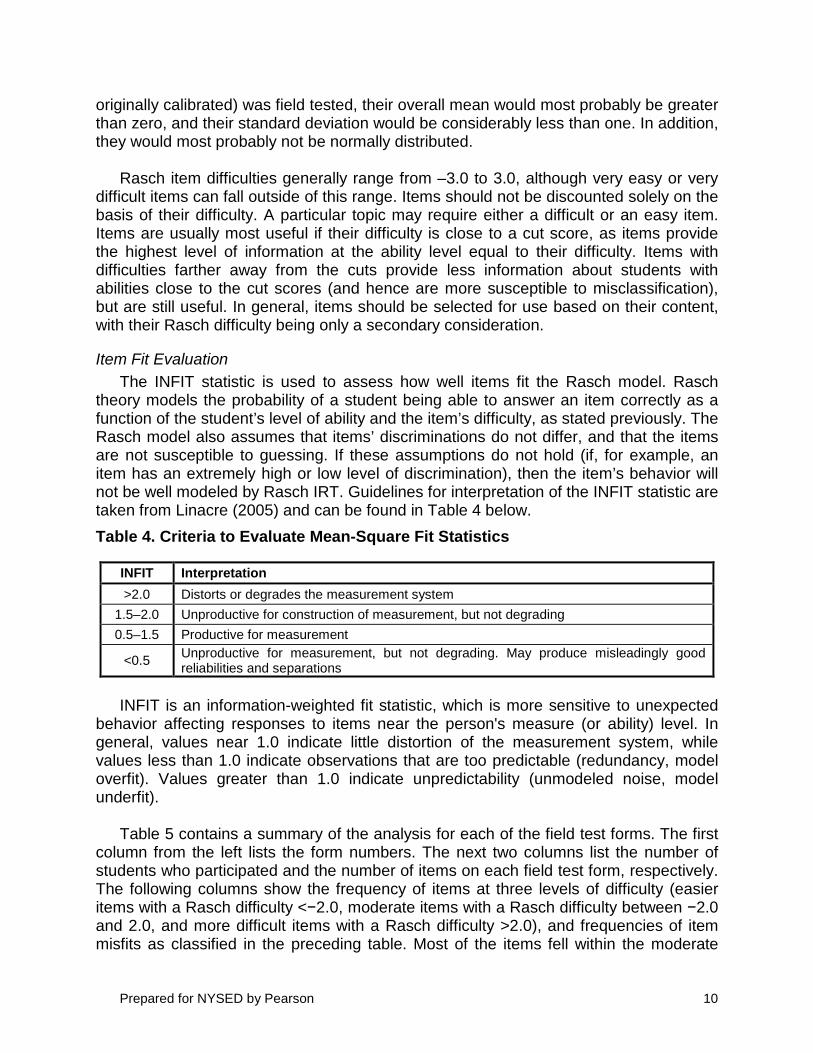
Item Fit Evaluation The INFIT statistic is used to assess how well items fit the Rasch model. Rasch
theory models the probability of a student being able to answer an item correctly as a function of the student’s level of ability and the item’s difficulty, as stated previously. The Rasch model also assumes that items’ discriminations do not differ, and that the items are not susceptible to guessing. If these assumptions do not hold (if, for example, an item has an extremely high or low level of discrimination), then the item’s behavior will not be well modeled by Rasch IRT. Guidelines for interpretation of the INFIT statistic are taken from Linacre (2005) and can be found in Table 4 below. Table 4. Criteria to Evaluate Mean-Square Fit Statistics
INFIT Interpretation >2.0 Distorts or degrades the measurement system
1.5–2.0 Unproductive for construction of measurement, but not degrading 0.5–1.5 Productive for measurement
<0.5 Unproductive for measurement, but not degrading. May produce misleadingly good reliabilities and separations
INFIT is an information-weighted fit statistic, which is more sensitive to unexpected
behavior affecting responses to items near the person's measure (or ability) level. In general, values near 1.0 indicate little distortion of the measurement system, while values less than 1.0 indicate observations that are too predictable (redundancy, model overfit). Values greater than 1.0 indicate unpredictability (unmodeled noise, model underfit).
Table 5 contains a summary of the analysis for each of the field test forms. The first
column from the left lists the form numbers. The next two columns list the number of students who participated and the number of items on each field test form, respectively. The following columns show the frequency of items at three levels of difficulty (easier items with a Rasch difficulty <−2.0, moderate items with a Rasch difficulty between −2.0 and 2.0, and more difficult items with a Rasch difficulty >2.0), and frequencies of item misfits as classified in the preceding table. Most of the items fell within the moderate

Prepared for NYSED by Pearson 11
−2.0 to +2.0 difficulty range, and there were no items with an INFIT statistic outside the range most productive for measurement. Item level results of the analysis can be found in Appendix D. Table 5. Partial-Credit Model Item Analysis Summary
Form N-Count
No. of Items
Rasch INFIT
<−2.0 −2.0 to 2.0 >2.0 <0.5 0.5 to
1.5 1.5 to
2.0 >2.0
501 793 25 0 24 1 0 25 0 0 502 836 11 0 8 1 0 9 0 0 503 829 11 0 8 1 0 9 0 0 504 826 11 0 10 1 0 11 0 0 505 842 11 0 9 2 0 11 0 0 506 836 10 0 8 0 0 8 0 0 507 827 12 0 11 1 0 12 0 0 508 810 12 0 12 0 0 12 0 0 509 831 11 1 9 1 0 11 0 0 510 809 12 1 10 1 0 12 0 0 511 820 12 1 8 0 0 9 0 0 512 795 12 1 9 2 0 12 0 0 513 767 12 0 11 1 0 12 0 0 514 801 11 0 10 1 0 11 0 0 515 821 12 0 10 0 0 10 0 0 516 795 11 0 7 2 0 9 0 0
For some forms, the item counts in the “Rasch” and “INFIT” columns may not sum to the value in the “No. of Items” column due to DNS (Do Not Score) items.
DIFFERENTIAL ITEM FUNCTIONING Differential Item Functioning (DIF) occurs when members of a particular group have
a different probability of success than members of another group with the same level of ability for reasons unrelated to the academic skill or construct being measured. For example, items testing English grammar skills may be more difficult for LEP students as opposed to non-LEP students, but such differences are likely due to the fact that the item measures an academic skill related to English language proficiency. Such items would not be considered to be functioning differentially.

Prepared for NYSED by Pearson 12
The Mantel Chi-Square and Standardized Mean Difference
The Mantel χ2 is a conditional mean comparison of the ordered-response categories for reference and focal groups combined over values of the matching variable score. “Ordered” means that a response earning a score of “1” on an item is better than a response earning a score of “0” or “2” is better than “1,” and so on. “Conditional,” on the other hand, refers to the comparison of members from the two groups who received the same score on the matching variable, that is, the total test score in our analysis.
Group Item Score Total y1 y2 … yT Reference nR1k nR2k … nRtk nR+k Focal nF1k nF2k … nFtk nF+k Total n+1k n+2k … n+tk n++k
Figure 1. 2 × t Contingency Table at the kth of K Levels. Figure 1 (from Zwick, Donoghue, & Grima, 1993).shows a 2 × t contingency table at
the kth of K levels, where t represents the number of response categories and k represents the number of levels of the matching variable. The values y1, y2, … yT represent the t scores that can be gained on the item. The values nFtk and nRtk represent the numbers of focal and reference groups who are at the kth level of the matching variable and gain an item score of yt. The “+” indicates the total number over a particular index (Zwick et al., 1993). The Mantel statistic is defined as the following formula:
∑∑∑
−
=
kk
kk
kk
FVar
FEFMantel
)(
)(2
2χ
in which Fk represents the sum of scores for the focal group at the kth level of the matching variable and is defined as follows:
∑=t
Ftktk nyF
The expectation of Fk under the null hypothesis is
∑++
+=t
Ftktk
kFk ny
nnFE )(
The variance of Fk under the null hypothesis is as follows:
−
−= ++++
++++
++ ∑∑ 222 )()(
)1()( tk
tttk
ttk
kk
kFkRk nynyn
nnnnFVar
Under H0, the Mantel statistic has a chi-square distribution with one degree of freedom. In DIF applications, rejecting H0 suggests that the students of the reference and focal groups who are similar in overall test performance tend to differ in their mean performance on the item. For dichotomous items, the statistic is identical to the Mantel-Haenszel (MH) (1959) statistic without the continuity correction (Zwick et al., 1993).

Prepared for NYSED by Pearson 13
A summary statistic to accompany the Mantel approach is the standardized mean difference (SMD) between the reference and focal groups proposed by Dorans and Schmitt (1991). This statistic compares the means of the reference and focal groups, adjusting for differences in the distribution of the reference and focal group members across the values of the matching variable. The SMD has the following form:
∑∑ −=k
RkFkk
FkFk mpmpSMD
in which
++
+=F
kFFk n
np
is the proportion of the focal group members who are at the kth level of the matching variable;
∑+
=
tFtktkF
Fk nynm 1
is the mean item score of the focal group members at the kth level; and mRk is the analogous value for the reference group. As can be seen from the equation above, the SMD is the difference between the unweighted item mean of the focal group and the weighted item mean of the reference group. The weights for the reference group are applied to make the weighted number of the reference-group students the same as in the focal group within the same level of ability. A negative SMD value implies that the focal group has a lower mean item score than the reference group, conditional on the matching variable.
Multiple-Choice Items
For the MC items, the MH odds ratio (converted to the ETS delta scale [D]) is used to classify items into one of three categories of DIF.
The Odds Ratio
The odds of a correct response (proportion passing divided by proportion failing) are P/Q or P/(1−P). The odds ratio is the odds of a correct response of the reference group divided by the odds of a correct response of the focal group. For a given item, the odds ratio is defined as follows:
𝛼𝑀𝐻 =𝑃𝑟 𝑄𝑟⁄𝑃𝑓 𝑄𝑓⁄
and the corresponding null hypothesis is that the odds of getting the item correct are equal for the two groups. Thus, the odds ratio is equal to 1:
𝛼𝑀𝐻 =𝑃𝑟 𝑄𝑟⁄𝑃𝑓 𝑄𝑓⁄ = 1

Prepared for NYSED by Pearson 14
The Delta Scale
To make the odds ratio symmetrical around zero with its range being in the interval −∞ to +∞, the odds ratio is transformed into a log odds ratio according to this equation:
βMH = ln(αMH) This simple natural logarithm transformation of the odds ratio is symmetrical around
zero. This DIF measure is a signed index; a positive value signifies DIF in favor of the reference group, a negative value indicates DIF in favor of the focal group, and zero has the interpretation of equal odds of success on the item. βMH also has the advantage of a linear relationship to other interval scale metrics (Camilli & Shepard, 1994). βMH is placed on the ETS delta scale (D) using the following equation:
D = – 2.35βMH
DIF Classification for MC Items
Table 6 depicts DIF classifications for MC items. Classification depends on the delta (D) value and the significance of its difference from zero (p < 0.05). The criteria are derived from those used by the National Assessment of Educational Progress (Allen, Carlson, & Zelenak, 1999) in the development of their assessments. Table 6. DIF Classification for MC Items
Category Description Criterion A No DIF D not significantly different from zero or |D| < 1.0 B Moderate DIF 1.0 ≤ |D| < 1.5 or not otherwise A or C C High DIF D is significantly different from zero and |D| ≥ 1.5
DIF Classification for CR Items
The SMD is divided by the total group item standard deviation to obtain an effect-size value for the SMD (ESSMD). The value of ESSMD and the significance of the Mantel χ2 statistic (p < 0.05) are used to determine the DIF category of the item as depicted in Table 7 below. Table 7. DIF Classification for CR Items
Category Description Criterion AA No DIF Non-significant Mantel χ2 or |ESSMD| ≤ 0.17 BB Moderate DIF Significant Mantel χ2 and 0.17 < |ESSMD| ≤ 0.25 CC High DIF Significant Mantel χ2 and 0.25 < |ESSMD| Reliable DIF results are dependent on the number of examinees in both the focal
and reference groups. Clauser and Mazor (1998) state that a minimum of 200 to 250 examinees per group is sufficient to provide reliable results. Some testing organizations require as many as 300 to 400 examinees per group (Zwick, 2012) in some applications. For field testing, the sample sizes were such that only comparisons based on gender (males vs. females) were possible. Even for gender, sample sizes were only moderately large, and so the results should be interpreted with caution.

Prepared for NYSED by Pearson 15
The DIF statistics for gender are shown in Appendix E. MC items in DIF categories “B” and “C” and CR items in categories “BB” and “CC” were flagged. These flags are shown in the “DIF Category” column (“A” and “AA” category items will have blank cells here). The “Favored Group” column indicates which gender is favored for items that are flagged.
Section III: Equating Procedure
Students particpating in the 2014 field test administration for the New York State Examination in Grade 4 Elementary-Level Science received one of 16 test forms (numbered 501–516). Form 501 was the anchor form for the equating, and was an intact form that had been administered in the prior year. Because the form had been previously administered, its items had known parameters on the operational scale. The remaining test forms were composed of items that had not been administered to New York State students. Test forms were spiraled within classrooms, so that students had an equal chance of receiving any of the 16 forms, depending solely on their ordinal position within the classroom. In essence, students were randomly assigned to test forms, forming randomly equivalent groups taking each of the forms. Appendices A and D (with the classical and Rasch IRT item level statistics) may be consulted to determine the characteristics of the items (e.g., item type and maximum number of points possible) that made up each form.
RANDOMLY EQUIVALENT GROUP EQUATING DESIGN The equating analyses were based on the assumption that the groups taking the
different forms had equivalent ability distributions and means. Given the random assignment of forms to examinees, this was a reasonable assumption. The initial step in the analyses was to calibrate all forms, both the anchor form and the remaining field test forms. All forms were calibrated using Winsteps, version 3.60 (Linacre, 2005).
The anchor form calibration began with all anchor item difficulty parameters fixed to
their known values from the previous year. Because it is possible for item parameters to “drift” (shift their difficulties relative to one another), a stability check was integrated into the analysis.
Winsteps provides an item level statistic, termed “displacement.” Linacre (2011,
p. 545) describes this statistic as:
…the size of the change in the parameter estimate that would be observed in the next estimation iteration if this parameter was free (unanchored) and all other parameter estimates were anchored at their current values. For a parameter (item or person) that is anchored in the main estimation, (the displacement value) indicates the size of disagreement between an estimate based on the current data and the anchor value.

Prepared for NYSED by Pearson 16
This statistic was used to identify items with difficulties that had shifted, relative to the difficulties of the other items on the form. After the intial calibration run, the Winsteps displacement values for all anchor form items were examined for absolute values greater than 0.30. If present, the item with the largest absolute displacement value was removed from anchored status, but remained on the test form. Its difficulty value was subsequently reestimated relative to the difficulties of the remaining anchored items. The Winsteps calibration was then rerun with the reduced anchor set, after which the displacement values were again checked for absolute values in excess of 0.30. If another was found, it was also removed from anchored status and the calibration rerun. This iterative procedure continued until all anchored items had displacements of 0.30 or less. Four items were identified as having drifted for the 2014 analyses.
After a stable anchor item set had been identified, the mean of the ability estimates
of the students who took the anchor form was computed.2 This mean ability was then used as the target ability for the forms with the field test items. Because the groups taking the different forms were randomly equivalent and thus had the same mean ability, adjustment of the parameters of the field test items on any form to values that produced an ability distribution for students who had taken the form with a mean equal to the target ability from the anchor form would result in the parameters for the field test items on that form being equated to the scale of the anchor form, which was also the operational scale.
The equated mean ability estimate for Form 501 was 1.47. This value became the
target mean ability estimate for the field test forms. At this point in the analyses, the calibration of the anchor form was complete. The
next step was the initial calibration of the field test forms. This was a “free” calibration, meaning that the item parameters were not constrained in any way. This initial calibration produced a set of Rasch difficulty parameters for the items on each form. Also produced as a part of the Winsteps calibration was a set of person ability estimates for each form.
The next step was the computation of an equating constant for each form. Under
Rasch IRT, if all of the difficulty parameters on a form have a constant added to them, the ability estimates for examinees will also be changed from their previous values by the amount represented by that constant. Therefore, to adjust the item difficulty parameters such that the mean of the ability distribution is set equal to the target mean ability from the anchor form, an equating constant was calculated for each field test form by subtracting the field test form mean ability from the target mean ability. This value was then added to the Rasch difficulty parameter of all items on the field test form. These adjusted values were then used as anchors for a second Winsteps calibration of the field test form. The mean of the person ability values from this second calibration was computed and compared to the target mean. If the anchored field test mean ability 2 Because under Rasch IRT the ability of students with extreme scores (either zero or perfect scores) cannot be exactly computed (they are equal to −∞ and +∞, respectively), they were excluded from this and all other analyses for both the anchor and other field test forms.
Prepared for NYSED by Pearson 17
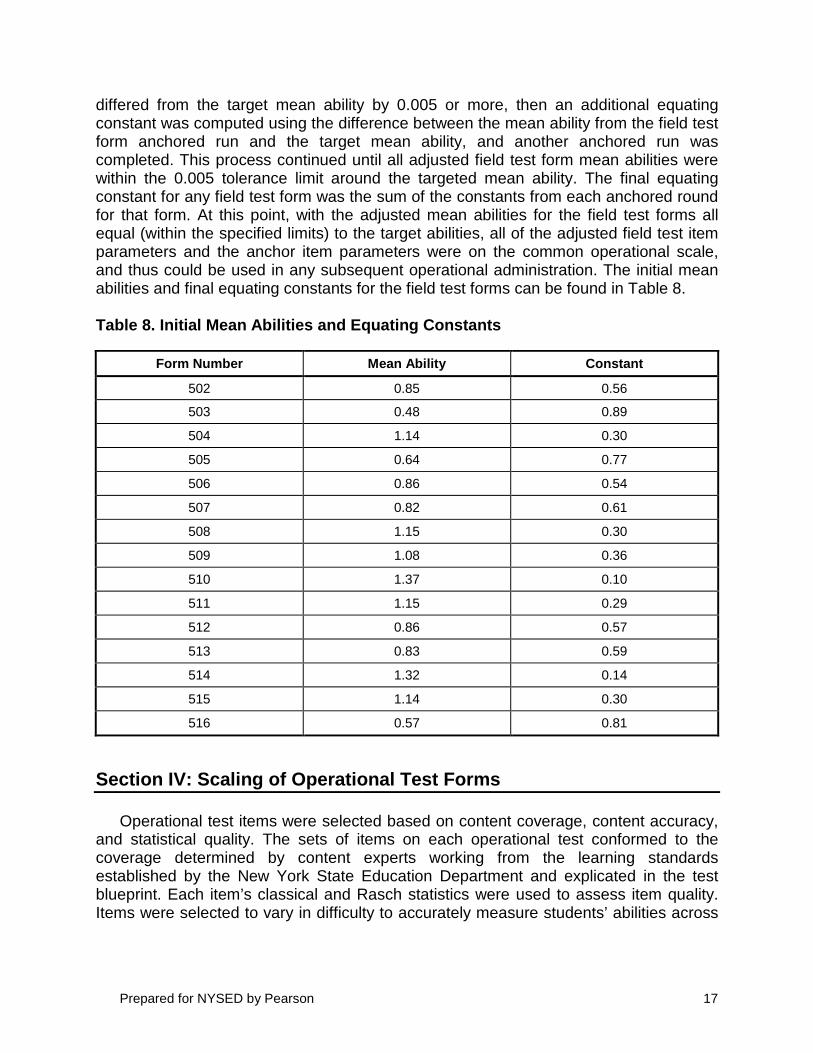
differed from the target mean ability by 0.005 or more, then an additional equating constant was computed using the difference between the mean ability from the field test form anchored run and the target mean ability, and another anchored run was completed. This process continued until all adjusted field test form mean abilities were within the 0.005 tolerance limit around the targeted mean ability. The final equating constant for any field test form was the sum of the constants from each anchored round for that form. At this point, with the adjusted mean abilities for the field test forms all equal (within the specified limits) to the target abilities, all of the adjusted field test item parameters and the anchor item parameters were on the common operational scale, and thus could be used in any subsequent operational administration. The initial mean abilities and final equating constants for the field test forms can be found in Table 8.
Table 8. Initial Mean Abilities and Equating Constants
Form Number Mean Ability Constant
502 0.85 0.56
503 0.48 0.89
504 1.14 0.30
505 0.64 0.77
506 0.86 0.54
507 0.82 0.61
508 1.15 0.30
509 1.08 0.36
510 1.37 0.10
511 1.15 0.29
512 0.86 0.57
513 0.83 0.59
514 1.32 0.14
515 1.14 0.30
516 0.57 0.81
Section IV: Scaling of Operational Test Forms
Operational test items were selected based on content coverage, content accuracy, and statistical quality. The sets of items on each operational test conformed to the coverage determined by content experts working from the learning standards established by the New York State Education Department and explicated in the test blueprint. Each item’s classical and Rasch statistics were used to assess item quality. Items were selected to vary in difficulty to accurately measure students’ abilities across

Prepared for NYSED by Pearson 18
the ability continuum. Appendix F contains the 2014 operational test maps for the June administration.
The assessment has two cut scores, which are set at the scale scores of 65 and 85. One of the primary considerations during test construction was to select items so as to minimize changes in the raw scores corresponding to these two scale scores. Maintaining a consistent mean Rasch difficulty level from administration to administration facilitates this. For this assessment, the target value for the mean Rasch difficulty was set at 0.118. It should be noted that the raw scores corresponding to the scale score cut scores may still fluctuate even, if the mean Rasch difficulty level is maintained at the target value, due to differences in the distributions of the Rasch difficulty values amongst the items from administration to administration.
The relationship between raw and scale scores is explicated in the scoring tables for
each administration. These tables can be found in Appendix G and cover the June administration. These tables are the end product of the following scaling procedure.
This assessment is equated to a base scale that is held constant from year to year
through the use of a calibrated item pool. The Rasch difficulties from the items’ initial administration in a previous year’s field test are used to equate the scale for the current administration to the base administration. For this examination, the base administration was the May 2005 administration. Scale scores from the 2014 administrations are on the same scale and can be directly compared to scale scores on all previous administrations back to and including the May 2005 administration.
When the base administration was concluded, the initial raw score-to-scale score
relationship was established. Four raw scores were fixed at specific scale scores. Scale scores of 0 and 100 were fixed to correspond to the minimum and maximum possible raw scores. In addition, a standard setting had been held to determine the passing and passing with distinction cut scores in the raw score metric. The scale score points of 65 and 85 were set to correspond to those raw score cuts. A third-degree polynomial is required in order to fit a line exactly to four arbitrary points (e.g., the raw scores corresponding to the four critical scale scores of 0, 65, 85, and 100). The general form of this best-fitting line is:
SS = m3*RS3 + m2*RS2 + m1*RS + m0
where SS is the scaled score, RS is the raw score, and m0 through m3 are the transformation constants that convert the raw score into the scale score (Please note that m0 will always be equal to zero in this application since a raw score of zero corresponds to a scale score of zero.). The above relationship and the values of m1 to m3 specific to this subject were then used to determine the scale scores corresponding to the remainder of the raw scores on the examination. This initial relationship between the raw and scale scores became the base scale.

Prepared for NYSED by Pearson 19
The Rasch difficulty parameters for the items on the base form were used to derive a raw score to Rasch student ability (theta score) relationship. This allowed the relationship between the Rasch theta score and the scale score to be known, mediated through their common relationship with the raw scores.
In succeeding years, each test form was selected from the pool of items that had
been tested in previous years’ field tests, each of which had known Rasch item difficulty parameter(s). These known parameters were used to construct the relationship between the raw and Rasch theta scores for that particular form. Because the Rasch difficulty parameters are all on a common scale, the Rasch theta scores were also on a common scale with previously administered forms. The remaining step in the scaling process was to find the scale score equivalent for the Rasch theta score corresponding to each raw score point on the new form, using the theta-to-scale score relationship established in the base year. This was done via linear interpolation.
This process results in a relationship between the raw scores on the form and the
overall scale scores. The scale scores corresponding to each raw score are then rounded to the nearest integer for reporting on the conversion chart (posted at the close of each administration). The only exceptions are for the minimum and maximum raw scores and the raw scores that correspond to the scaled cut scores of 65 and 85.
The minimum (zero) and maximum possible raw scores are assigned scale scores
of 0 and 100, respectively. In the event that there are raw scores less than the maximum with scale scores that round to 100, their scale scores are set equal to 99. A similar process is followed with the minimum score; if any raw scores other than zero have scale scores that round to zero, their scale scores are instead set equal to one.
With regard to the cuts, if two or more scale scores round to either 65 or 85, the
lowest raw score’s scale score is set equal to a 65 or 85 and the scale scores corresponding to the higher raw scores are set to 66 or 86 as appropriate. If no scale score rounds to either of these two critical cuts, then the raw score with the largest scale score that is less than the cut is set equal to the cut. The overarching principle when two raw scores both round to either scale score cut is that the lower of the raw scores is always assigned to be equal to the cut so that students are never penalized for this ambiguity.
The New York State Examination in Grade 4 Elementary-Level Science is composed
of both a written and a lab (or performance) component. The lab component remains constant from year to year, while the written component is refreshed with each successive administration. Only the written component was addressed in the present report. Students taking the assessment receive two scale scores, one from each of the two components. The scale score from the performance component is similar to that of the written component in that it ranges from 0 to 100, and was subjected to a standard setting that determined the raw score points that were fixed to the scale scores of 65 and 85. A student’s final scale score on the assessment is a weighted sum of his or her written and performance scale scores, and is determined via the following formula:

Prepared for NYSED by Pearson 20
SSTotal = 0.25*SSPerformance + 0.75*SSWritten
where SSTotal is the total scale score and SSPerformance and SSWritten are the scale scores from the performance and written components of the test, respectively.

Prepared for NYSED by Pearson 21
References
Allen, N. L., Carlson, J. E., & Zelenak, C. A. (1999). The NAEP 1996 technical report. Washington, DC: National Center for Education Statistics.
Clauser, B. E., & Mazor, K. M. (1998). Using statistical procedures to identify
differentially functioning test items. Educational Measurement: Issues and Practice, 17(1), 31–44.
Cohen, J. (1968). Weighted kappa: Nominal scale agreement with provision for scaled
disagreement or partial credit. Psychological Bulletin, 70, 213–220. Cronbach, L. J. (1951). Coefficient alpha and the internal structure of tests.
Psychometrika, 16(3), 297–334. Dorans, N. J., & Schmitt, A. P. (1991). Constructed-response and differential item
functioning: A pragmatic approach (ETS Research Report No. 91-49). Princeton, NJ: Educational Testing Service.
Fleiss, J. L. (1981). Statistical methods for rates and proportions. 2nd ed. New York:
John Wiley. Hambleton, R. K, Swaminathan, H., & Rogers, H. J. (1991). Fundamentals of item
response theory. Newbury Park, CA: Sage Publications, Inc. Linacre, J. M. (2005). WINSTEPS Rasch measurement computer program and manual
(PDF file) v 3.60. Chicago: Winsteps.com Linacre, J. M. (2011). A user's guide to WINSTEPS MINISTEP Rasch-model computer
programs: Program manual 3.73.0 (PDF file). Chicago: Winsteps.com Lord, F. M. (1980). Applications of item response theory to practical testing problems.
Hillsdale, NJ: Lawrence Erlbaum Associates. Masters, G. N. (1982). A Rasch model for partial credit scoring. Psychometrika, 47,
149–174. McGraw, K. O., & Wong, S. P. (1996). Forming inferences about some intraclass
correlation coefficients, Psychological Methods, 1(1), 30–46. Rasch, G. (1980). Probabilistic models for some intelligence and attainment tests.
Chicago, IL: University of Chicago Press. Shrout, P. E., & Fleiss, J. L. (1979). Intraclass correlations: uses in assessing rater
reliability. Psychological Bulletin, 86, 420–428.

Prepared for NYSED by Pearson 22
Thissen, D., & Steinberg, L. (1986). A taxonomy of item response models. Psychometrika, 51, 567–577.
Zwick, R. (2012). A review of ETS differential item functioning assessment procedures: Flagging rules, minimum sample size requirements, and criterion refinement (ETS Research Report No. 12-08). Princeton, NJ: Educational Testing Service.
Zwick, R., Donoghue, J. R., & Grima, A. (1993). Assessment of differential item
functioning for performance tasks. Journal of Educational Measurement, 30, 233–251.

Prepared for NYSED by Pearson 23
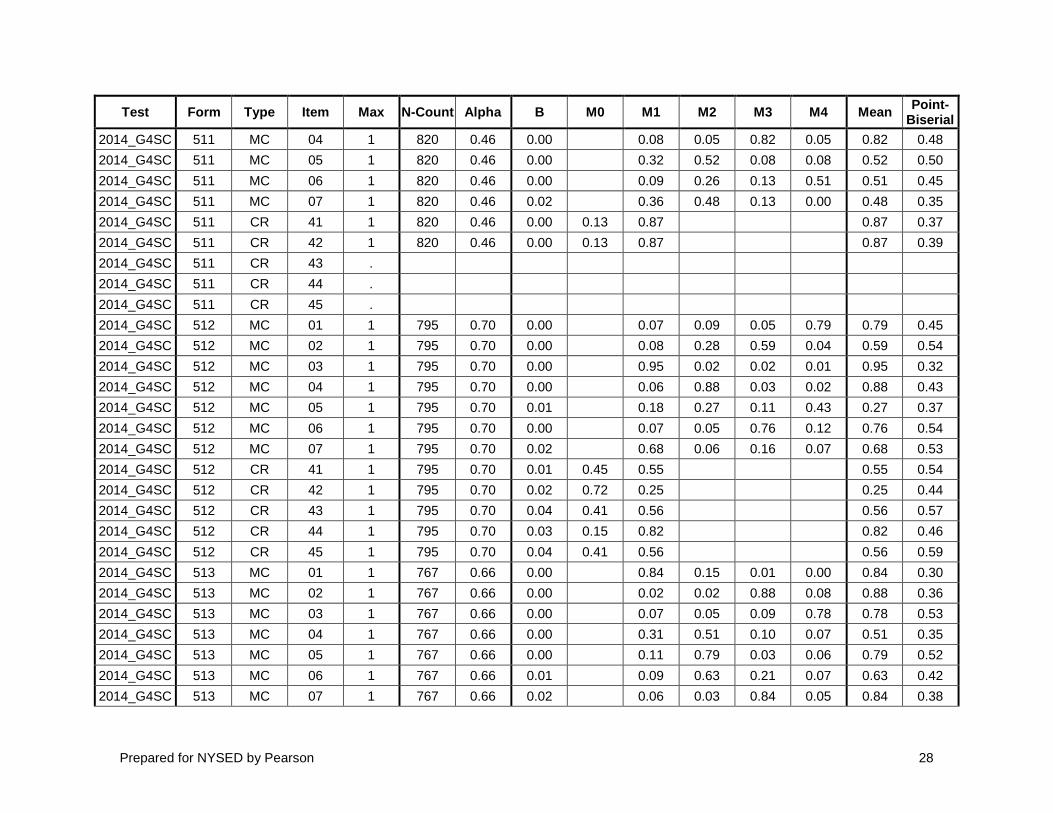
Appendix A: Classical Item Analysis In the following table, “Max” is the maximum number of possible points. “N-Count” refers to the number of student
records in the analysis. “Alpha” contains Cronbach's Coefficient α (since this is a test [form] level statistic, it has the same value for all items within each form). For MC items, “B” represents the proportion of students who left the item blank, and “M1” through “M4” are the proportions of students who selected each of the four answer choices. For CR items, “B” represents the proportion of students who left the item blank, and “M0” through “M4” are the proportions of students who received scores of 0 through 4. “Mean” is the average of the scores received by the students. The final (right) column contains the Point-Biserial correlation for each item. There may be some instances of items with missing statistics; this occurs when an item was not scored (DNS).
Test Form Type Item Max N-Count Alpha B M0 M1 M2 M3 M4 Mean Point-Biserial
2014_G4SC 501 MC 01 1 793 0.83 0.00 0.07 0.08 0.81 0.04 0.81 0.40 2014_G4SC 501 MC 02 1 793 0.83 0.00 0.09 0.85 0.02 0.04 0.85 0.44 2014_G4SC 501 MC 03 1 793 0.83 0.00 0.10 0.60 0.08 0.22 0.60 0.42 2014_G4SC 501 MC 04 1 793 0.83 0.00 0.25 0.62 0.07 0.06 0.62 0.39 2014_G4SC 501 MC 05 1 793 0.83 0.00 0.03 0.56 0.32 0.08 0.56 0.33 2014_G4SC 501 MC 06 1 793 0.83 0.00 0.02 0.03 0.83 0.12 0.83 0.48 2014_G4SC 501 MC 07 1 793 0.83 0.00 0.34 0.13 0.43 0.10 0.43 0.32 2014_G4SC 501 MC 08 1 793 0.83 0.01 0.32 0.64 0.01 0.02 0.64 0.38 2014_G4SC 501 MC 09 1 793 0.83 0.01 0.05 0.81 0.02 0.12 0.81 0.40 2014_G4SC 501 MC 10 1 793 0.83 0.01 0.90 0.03 0.03 0.03 0.90 0.54 2014_G4SC 501 MC 11 1 793 0.83 0.01 0.17 0.04 0.73 0.06 0.73 0.50 2014_G4SC 501 MC 12 1 793 0.83 0.01 0.79 0.13 0.07 0.01 0.79 0.42 2014_G4SC 501 MC 13 1 793 0.83 0.01 0.05 0.19 0.08 0.67 0.67 0.43 2014_G4SC 501 MC 14 1 793 0.83 0.01 0.65 0.09 0.18 0.07 0.65 0.53 2014_G4SC 501 MC 15 1 793 0.83 0.01 0.87 0.03 0.04 0.05 0.87 0.48 2014_G4SC 501 MC 16 1 793 0.83 0.01 0.08 0.04 0.07 0.81 0.81 0.55 2014_G4SC 501 MC 17 1 793 0.83 0.01 0.04 0.02 0.90 0.03 0.90 0.50

Prepared for NYSED by Pearson 24
Test Form Type Item Max N-Count Alpha B M0 M1 M2 M3 M4 Mean Point-Biserial
2014_G4SC 501 MC 18 1 793 0.83 0.01 0.80 0.06 0.05 0.08 0.80 0.52 2014_G4SC 501 MC 19 1 793 0.83 0.01 0.11 0.76 0.04 0.07 0.76 0.50 2014_G4SC 501 MC 20 1 793 0.83 0.01 0.01 0.09 0.79 0.10 0.79 0.31 2014_G4SC 501 MC 21 1 793 0.83 0.02 0.10 0.03 0.09 0.76 0.76 0.47 2014_G4SC 501 MC 22 1 793 0.83 0.02 0.03 0.90 0.02 0.04 0.90 0.49 2014_G4SC 501 MC 23 1 793 0.83 0.02 0.08 0.05 0.04 0.81 0.81 0.52 2014_G4SC 501 MC 24 1 793 0.83 0.04 0.16 0.49 0.15 0.17 0.49 0.45 2014_G4SC 501 MC 25 1 793 0.83 0.06 0.03 0.02 0.12 0.77 0.77 0.52 2014_G4SC 502 MC 01 1 836 0.66 0.00 0.02 0.08 0.07 0.82 0.82 0.53 2014_G4SC 502 MC 02 1 836 0.66 0.00 0.54 0.03 0.05 0.37 0.37 0.50 2014_G4SC 502 MC 03 1 836 0.66 0.00 0.84 0.08 0.03 0.04 0.84 0.50 2014_G4SC 502 MC 04 1 836 0.66 0.00 0.05 0.12 0.16 0.67 0.67 0.51 2014_G4SC 502 MC 05 1 836 0.66 0.00 0.15 0.06 0.07 0.72 0.72 0.53 2014_G4SC 502 MC 06 1 836 0.66 0.01 0.05 0.04 0.86 0.04 0.86 0.50 2014_G4SC 502 CR 41 . 2014_G4SC 502 CR 42 . 2014_G4SC 502 CR 43 1 836 0.66 0.02 0.36 0.62 0.62 0.55 2014_G4SC 502 CR 44 1 836 0.66 0.02 0.31 0.67 0.67 0.45 2014_G4SC 502 CR 45 1 836 0.66 0.02 0.36 0.62 0.62 0.59 2014_G4SC 503 MC 01 1 829 0.58 0.00 0.88 0.02 0.05 0.04 0.88 0.40 2014_G4SC 503 MC 02 1 829 0.58 0.00 0.08 0.42 0.14 0.35 0.42 0.44 2014_G4SC 503 MC 03 1 829 0.58 0.00 0.28 0.49 0.20 0.03 0.49 0.52 2014_G4SC 503 MC 04 1 829 0.58 0.00 0.06 0.88 0.05 0.01 0.88 0.45 2014_G4SC 503 MC 05 1 829 0.58 0.01 0.19 0.05 0.72 0.03 0.72 0.47 2014_G4SC 503 MC 06 1 829 0.58 0.02 0.69 0.11 0.14 0.03 0.69 0.46 2014_G4SC 503 CR 41 1 829 0.58 0.01 0.65 0.34 0.34 0.52 2014_G4SC 503 CR 42 1 829 0.58 0.01 0.53 0.46 0.46 0.51 2014_G4SC 503 CR 43 .

Prepared for NYSED by Pearson 25
Test Form Type Item Max N-Count Alpha B M0 M1 M2 M3 M4 Mean Point-Biserial
2014_G4SC 503 CR 44 . 2014_G4SC 503 CR 45 1 829 0.58 0.01 0.60 0.39 0.39 0.53 2014_G4SC 504 MC 01 1 826 0.57 0.00 0.08 0.05 0.79 0.08 0.79 0.39 2014_G4SC 504 MC 02 1 826 0.57 0.00 0.23 0.37 0.25 0.16 0.25 0.39 2014_G4SC 504 MC 03 1 826 0.57 0.00 0.21 0.08 0.03 0.67 0.67 0.43 2014_G4SC 504 MC 04 1 826 0.57 0.00 0.13 0.26 0.60 0.00 0.60 0.52 2014_G4SC 504 MC 05 1 826 0.57 0.00 0.07 0.84 0.01 0.07 0.84 0.37 2014_G4SC 504 MC 06 1 826 0.57 0.01 0.04 0.07 0.03 0.85 0.85 0.50 2014_G4SC 504 MC 07 1 826 0.57 0.03 0.01 0.01 0.94 0.01 0.94 0.36 2014_G4SC 504 CR 41 1 826 0.57 0.01 0.45 0.54 0.54 0.42 2014_G4SC 504 CR 42 1 826 0.57 0.02 0.12 0.86 0.86 0.50 2014_G4SC 504 CR 43 1 826 0.57 0.05 0.15 0.80 0.80 0.37 2014_G4SC 504 CR 44 1 826 0.57 0.02 0.40 0.58 0.58 0.56 2014_G4SC 505 MC 01 1 842 0.48 0.00 0.60 0.13 0.19 0.07 0.60 0.48 2014_G4SC 505 MC 02 1 842 0.48 0.00 0.02 0.64 0.03 0.31 0.64 0.48 2014_G4SC 505 MC 03 1 842 0.48 0.00 0.10 0.02 0.84 0.04 0.84 0.42 2014_G4SC 505 MC 04 1 842 0.48 0.00 0.15 0.83 0.01 0.01 0.83 0.33 2014_G4SC 505 MC 05 1 842 0.48 0.00 0.61 0.07 0.28 0.03 0.61 0.34 2014_G4SC 505 MC 06 1 842 0.48 0.00 0.03 0.05 0.68 0.24 0.68 0.39 2014_G4SC 505 MC 07 1 842 0.48 0.01 0.23 0.10 0.29 0.38 0.38 0.33 2014_G4SC 505 MC 08 1 842 0.48 0.03 0.16 0.13 0.34 0.34 0.34 0.44 2014_G4SC 505 CR 41 1 842 0.48 0.00 0.18 0.82 0.82 0.40 2014_G4SC 505 CR 42 1 842 0.48 0.02 0.78 0.20 0.20 0.45 2014_G4SC 505 CR 43 1 842 0.48 0.02 0.10 0.88 0.88 0.36 2014_G4SC 506 MC 01 1 836 0.60 0.00 0.11 0.85 0.03 0.02 0.85 0.52 2014_G4SC 506 MC 02 1 836 0.60 0.00 0.47 0.07 0.16 0.31 0.47 0.52 2014_G4SC 506 MC 03 1 836 0.60 0.00 0.48 0.31 0.14 0.07 0.48 0.43 2014_G4SC 506 MC 04 1 836 0.60 0.00 0.00 0.03 0.06 0.91 0.91 0.44

Prepared for NYSED by Pearson 26
Test Form Type Item Max N-Count Alpha B M0 M1 M2 M3 M4 Mean Point-Biserial
2014_G4SC 506 MC 05 1 836 0.60 0.00 0.15 0.68 0.10 0.06 0.68 0.59 2014_G4SC 506 MC 06 1 836 0.60 0.01 0.76 0.16 0.06 0.00 0.76 0.54 2014_G4SC 506 CR 41 . 2014_G4SC 506 CR 42 . 2014_G4SC 506 CR 43 1 836 0.60 0.00 0.27 0.73 0.73 0.52 2014_G4SC 506 CR 44 1 836 0.60 0.01 0.48 0.52 0.52 0.56 2014_G4SC 507 MC 01 1 827 0.57 0.00 0.08 0.01 0.03 0.89 0.89 0.23 2014_G4SC 507 MC 02 1 827 0.57 0.00 0.19 0.13 0.23 0.44 0.44 0.52 2014_G4SC 507 MC 03 1 827 0.57 0.00 0.51 0.14 0.20 0.14 0.51 0.46 2014_G4SC 507 MC 04 1 827 0.57 0.00 0.38 0.39 0.19 0.03 0.38 0.40 2014_G4SC 507 MC 05 1 827 0.57 0.00 0.66 0.13 0.15 0.06 0.66 0.41 2014_G4SC 507 MC 06 1 827 0.57 0.00 0.01 0.95 0.02 0.02 0.95 0.32 2014_G4SC 507 MC 07 1 827 0.57 0.01 0.19 0.03 0.08 0.68 0.68 0.46 2014_G4SC 507 MC 08 1 827 0.57 0.03 0.04 0.06 0.06 0.81 0.81 0.39 2014_G4SC 507 CR 41 1 827 0.57 0.00 0.14 0.86 0.86 0.42 2014_G4SC 507 CR 42 1 827 0.57 0.02 0.20 0.78 0.78 0.48 2014_G4SC 507 CR 43 1 827 0.57 0.02 0.85 0.13 0.13 0.39 2014_G4SC 507 CR 44 1 827 0.57 0.01 0.46 0.52 0.52 0.50 2014_G4SC 508 MC 01 1 810 0.61 0.00 0.05 0.09 0.82 0.04 0.82 0.45 2014_G4SC 508 MC 02 1 810 0.61 0.00 0.72 0.14 0.11 0.02 0.72 0.46 2014_G4SC 508 MC 03 1 810 0.61 0.00 0.04 0.57 0.04 0.35 0.57 0.49 2014_G4SC 508 MC 04 1 810 0.61 0.00 0.02 0.11 0.81 0.06 0.81 0.43 2014_G4SC 508 MC 05 1 810 0.61 0.01 0.15 0.27 0.45 0.12 0.45 0.40 2014_G4SC 508 MC 06 1 810 0.61 0.00 0.06 0.86 0.04 0.03 0.86 0.43 2014_G4SC 508 MC 07 1 810 0.61 0.01 0.02 0.01 0.94 0.02 0.94 0.32 2014_G4SC 508 CR 41 1 810 0.61 0.01 0.51 0.49 0.49 0.42 2014_G4SC 508 CR 42 1 810 0.61 0.00 0.22 0.78 0.78 0.43 2014_G4SC 508 CR 43 1 810 0.61 0.02 0.08 0.90 0.90 0.44

Prepared for NYSED by Pearson 27
Test Form Type Item Max N-Count Alpha B M0 M1 M2 M3 M4 Mean Point-Biserial
2014_G4SC 508 CR 44 1 810 0.61 0.01 0.37 0.62 0.62 0.43 2014_G4SC 508 CR 45 1 810 0.61 0.03 0.57 0.40 0.40 0.55 2014_G4SC 509 MC 01 1 831 0.56 0.00 0.12 0.68 0.11 0.10 0.68 0.50 2014_G4SC 509 MC 02 1 831 0.56 0.00 0.01 0.02 0.96 0.01 0.96 0.36 2014_G4SC 509 MC 03 1 831 0.56 0.00 0.02 0.50 0.22 0.26 0.50 0.50 2014_G4SC 509 MC 04 1 831 0.56 0.00 0.02 0.02 0.03 0.93 0.93 0.40 2014_G4SC 509 MC 05 1 831 0.56 0.00 0.06 0.03 0.02 0.88 0.88 0.48 2014_G4SC 509 MC 06 1 831 0.56 0.00 0.62 0.05 0.20 0.12 0.62 0.50 2014_G4SC 509 MC 07 1 831 0.56 0.01 0.04 0.06 0.88 0.02 0.88 0.43 2014_G4SC 509 MC 08 1 831 0.56 0.02 0.12 0.15 0.60 0.11 0.60 0.55 2014_G4SC 509 CR 41 1 831 0.56 0.00 0.93 0.07 0.07 0.00 2014_G4SC 509 CR 42 1 831 0.56 0.01 0.48 0.51 0.51 0.49 2014_G4SC 509 CR 43 1 831 0.56 0.01 0.38 0.61 0.61 0.42 2014_G4SC 510 MC 01 1 809 0.63 0.00 0.97 0.01 0.00 0.01 0.97 0.25 2014_G4SC 510 MC 02 1 809 0.63 0.00 0.06 0.68 0.11 0.14 0.68 0.48 2014_G4SC 510 MC 03 1 809 0.63 0.00 0.04 0.15 0.36 0.44 0.44 0.44 2014_G4SC 510 MC 04 1 809 0.63 0.00 0.07 0.90 0.01 0.01 0.90 0.38 2014_G4SC 510 MC 05 1 809 0.63 0.00 0.06 0.06 0.02 0.86 0.86 0.41 2014_G4SC 510 MC 06 1 809 0.63 0.00 0.82 0.08 0.09 0.01 0.82 0.50 2014_G4SC 510 MC 07 1 809 0.63 0.01 0.73 0.12 0.02 0.11 0.73 0.46 2014_G4SC 510 CR 41 1 809 0.63 0.00 0.24 0.75 0.75 0.44 2014_G4SC 510 CR 42 1 809 0.63 0.00 0.18 0.81 0.81 0.48 2014_G4SC 510 CR 43 1 809 0.63 0.01 0.60 0.39 0.39 0.59 2014_G4SC 510 CR 44 1 809 0.63 0.02 0.08 0.91 0.91 0.34 2014_G4SC 510 CR 45 1 809 0.63 0.03 0.46 0.51 0.51 0.51 2014_G4SC 511 MC 01 1 820 0.46 0.00 0.22 0.19 0.12 0.46 0.46 0.49 2014_G4SC 511 MC 02 1 820 0.46 0.00 0.08 0.04 0.77 0.10 0.77 0.58 2014_G4SC 511 MC 03 1 820 0.46 0.00 0.96 0.02 0.01 0.00 0.96 0.33
Prepared for NYSED by Pearson 28
Test Form Type Item Max N-Count Alpha B M0 M1 M2 M3 M4 Mean Point-Biserial
2014_G4SC 511 MC 04 1 820 0.46 0.00 0.08 0.05 0.82 0.05 0.82 0.48 2014_G4SC 511 MC 05 1 820 0.46 0.00 0.32 0.52 0.08 0.08 0.52 0.50 2014_G4SC 511 MC 06 1 820 0.46 0.00 0.09 0.26 0.13 0.51 0.51 0.45 2014_G4SC 511 MC 07 1 820 0.46 0.02 0.36 0.48 0.13 0.00 0.48 0.35 2014_G4SC 511 CR 41 1 820 0.46 0.00 0.13 0.87 0.87 0.37 2014_G4SC 511 CR 42 1 820 0.46 0.00 0.13 0.87 0.87 0.39 2014_G4SC 511 CR 43 . 2014_G4SC 511 CR 44 . 2014_G4SC 511 CR 45 . 2014_G4SC 512 MC 01 1 795 0.70 0.00 0.07 0.09 0.05 0.79 0.79 0.45 2014_G4SC 512 MC 02 1 795 0.70 0.00 0.08 0.28 0.59 0.04 0.59 0.54 2014_G4SC 512 MC 03 1 795 0.70 0.00 0.95 0.02 0.02 0.01 0.95 0.32 2014_G4SC 512 MC 04 1 795 0.70 0.00 0.06 0.88 0.03 0.02 0.88 0.43 2014_G4SC 512 MC 05 1 795 0.70 0.01 0.18 0.27 0.11 0.43 0.27 0.37 2014_G4SC 512 MC 06 1 795 0.70 0.00 0.07 0.05 0.76 0.12 0.76 0.54 2014_G4SC 512 MC 07 1 795 0.70 0.02 0.68 0.06 0.16 0.07 0.68 0.53 2014_G4SC 512 CR 41 1 795 0.70 0.01 0.45 0.55 0.55 0.54 2014_G4SC 512 CR 42 1 795 0.70 0.02 0.72 0.25 0.25 0.44 2014_G4SC 512 CR 43 1 795 0.70 0.04 0.41 0.56 0.56 0.57 2014_G4SC 512 CR 44 1 795 0.70 0.03 0.15 0.82 0.82 0.46 2014_G4SC 512 CR 45 1 795 0.70 0.04 0.41 0.56 0.56 0.59 2014_G4SC 513 MC 01 1 767 0.66 0.00 0.84 0.15 0.01 0.00 0.84 0.30 2014_G4SC 513 MC 02 1 767 0.66 0.00 0.02 0.02 0.88 0.08 0.88 0.36 2014_G4SC 513 MC 03 1 767 0.66 0.00 0.07 0.05 0.09 0.78 0.78 0.53 2014_G4SC 513 MC 04 1 767 0.66 0.00 0.31 0.51 0.10 0.07 0.51 0.35 2014_G4SC 513 MC 05 1 767 0.66 0.00 0.11 0.79 0.03 0.06 0.79 0.52 2014_G4SC 513 MC 06 1 767 0.66 0.01 0.09 0.63 0.21 0.07 0.63 0.42 2014_G4SC 513 MC 07 1 767 0.66 0.02 0.06 0.03 0.84 0.05 0.84 0.38

Prepared for NYSED by Pearson 29
Test Form Type Item Max N-Count Alpha B M0 M1 M2 M3 M4 Mean Point-Biserial
2014_G4SC 513 CR 41 1 767 0.66 0.01 0.52 0.47 0.47 0.57 2014_G4SC 513 CR 42 1 767 0.66 0.01 0.60 0.39 0.39 0.48 2014_G4SC 513 CR 43 1 767 0.66 0.02 0.50 0.47 0.47 0.58 2014_G4SC 513 CR 44 1 767 0.66 0.03 0.51 0.46 0.46 0.54 2014_G4SC 513 CR 45 1 767 0.66 0.02 0.20 0.77 0.77 0.49 2014_G4SC 514 MC 01 1 801 0.57 0.00 0.13 0.66 0.12 0.08 0.66 0.46 2014_G4SC 514 MC 02 1 801 0.57 0.00 0.11 0.35 0.40 0.14 0.40 0.39 2014_G4SC 514 MC 03 1 801 0.57 0.00 0.54 0.02 0.35 0.08 0.54 0.51 2014_G4SC 514 MC 04 1 801 0.57 0.00 0.02 0.17 0.08 0.74 0.74 0.40 2014_G4SC 514 MC 05 1 801 0.57 0.00 0.12 0.04 0.05 0.78 0.78 0.43 2014_G4SC 514 MC 06 1 801 0.57 0.00 0.13 0.57 0.06 0.23 0.57 0.48 2014_G4SC 514 MC 07 1 801 0.57 0.03 0.03 0.09 0.03 0.82 0.82 0.39 2014_G4SC 514 CR 41 1 801 0.57 0.01 0.19 0.80 0.80 0.51 2014_G4SC 514 CR 42 1 801 0.57 0.01 0.06 0.93 0.93 0.39 2014_G4SC 514 CR 43 1 801 0.57 0.01 0.07 0.92 0.92 0.45 2014_G4SC 514 CR 44 1 801 0.57 0.01 0.06 0.93 0.93 0.44 2014_G4SC 515 MC 01 1 821 0.63 0.00 0.06 0.85 0.03 0.06 0.85 0.39 2014_G4SC 515 MC 02 1 821 0.63 0.00 0.01 0.74 0.10 0.14 0.74 0.53 2014_G4SC 515 MC 03 1 821 0.63 0.00 0.03 0.03 0.69 0.25 0.69 0.44 2014_G4SC 515 MC 04 1 821 0.63 0.00 0.19 0.13 0.51 0.17 0.51 0.48 2014_G4SC 515 MC 05 1 821 0.63 0.00 0.56 0.06 0.15 0.22 0.56 0.59 2014_G4SC 515 MC 06 1 821 0.63 0.00 0.06 0.02 0.19 0.73 0.73 0.63 2014_G4SC 515 MC 07 1 821 0.63 0.00 0.54 0.24 0.13 0.08 0.54 0.39 2014_G4SC 515 MC 08 1 821 0.63 0.04 0.14 0.04 0.65 0.14 0.65 0.51 2014_G4SC 515 CR 41 1 821 0.63 0.00 0.06 0.93 0.93 0.45 2014_G4SC 515 CR 42 1 821 0.63 0.01 0.05 0.94 0.94 0.42 2014_G4SC 515 CR 43 . 2014_G4SC 515 CR 44 .

Prepared for NYSED by Pearson 30
Test Form Type Item Max N-Count Alpha B M0 M1 M2 M3 M4 Mean Point-Biserial
2014_G4SC 516 MC 01 1 795 0.60 0.00 0.73 0.01 0.24 0.02 0.73 0.48 2014_G4SC 516 MC 02 1 795 0.60 0.00 0.36 0.17 0.19 0.27 0.36 0.53 2014_G4SC 516 MC 03 1 795 0.60 0.00 0.04 0.02 0.03 0.91 0.91 0.42 2014_G4SC 516 MC 04 1 795 0.60 0.00 0.03 0.09 0.85 0.03 0.85 0.42 2014_G4SC 516 MC 05 1 795 0.60 0.01 0.10 0.09 0.26 0.54 0.54 0.49 2014_G4SC 516 CR 41 . 2014_G4SC 516 CR 42 . 2014_G4SC 516 CR 43 1 795 0.60 0.02 0.30 0.68 0.68 0.59 2014_G4SC 516 CR 44 1 795 0.60 0.01 0.32 0.67 0.67 0.45 2014_G4SC 516 CR 45 1 795 0.60 0.02 0.55 0.43 0.43 0.53 2014_G4SC 516 CR 46 1 795 0.60 0.03 0.69 0.28 0.28 0.52

Prepared for NYSED by Pearson 31
Appendix B: Inter-rater Consistency – Point Differences Between First and Second Reads
The first three columns from the left contain the form ID, item sequence number, and number of score points for each item. The remaining columns contain the percentage of times each possible difference between the first and second raters’ scores occurred. Blank cells indicate out-of-range differences (e.g., differences greater than the maximum possible given the point value of that particular item).
Form Item Score Points
Difference (First Read Minus Second Read) –1 0 1
502 43 1 3% 93% 4% 502 44 1 1% 99% 0% 502 45 1 3% 97% 0% 503 41 1 3% 93% 4% 503 42 1 4% 92% 4% 503 45 1 0% 100% 0% 504 41 1 2% 95% 2% 504 42 1 0% 100% 0% 504 43 1 4% 94% 3% 504 44 1 3% 96% 1% 505 41 1 1% 94% 5% 505 42 1 0% 100% 0% 505 43 1 0% 100% 0% 506 43 1 6% 88% 6% 506 44 1 4% 88% 9% 507 41 1 0% 100% 0% 507 42 1 1% 99% 0% 507 43 1 1% 93% 6% 507 44 1 0% 100% 0% 508 41 1 1% 99% 0% 508 42 1 5% 95% 0% 508 43 1 0% 100% 0% 508 44 1 11% 87% 2% 508 45 1 4% 96% 0% 509 41 1 1% 98% 1% 509 42 1 4% 82% 15% 509 43 1 2% 96% 1% 510 41 1 3% 96% 1% 510 42 1 0% 100% 0% 510 43 1 5% 92% 3%

Prepared for NYSED by Pearson 32
Form Item Score Points
Difference (First Read Minus Second Read) –1 0 1
510 44 1 0% 97% 3% 510 45 1 0% 99% 1% 511 41 1 0% 99% 1% 511 42 1 12% 88% 0% 512 41 1 4% 89% 7% 512 42 1 4% 92% 4% 512 43 1 1% 96% 3% 512 44 1 3% 95% 3% 512 45 1 3% 96% 1% 513 41 1 1% 97% 1% 513 42 1 6% 88% 5% 513 43 1 4% 88% 8% 513 44 1 4% 94% 3% 513 45 1 3% 95% 3% 514 41 1 0% 95% 5% 514 42 1 0% 100% 0% 514 43 1 0% 97% 3% 514 44 1 1% 99% 0% 515 41 1 1% 99% 0% 515 42 1 1% 99% 0% 516 43 1 4% 90% 6% 516 44 1 1% 99% 0% 516 45 1 6% 93% 1% 516 46 1 1% 97% 1%

Prepared for NYSED by Pearson 33
Appendix C: Additional Measures of Inter-rater Reliability and Agreement The first four columns from the left contain the form ID, item sequence number, number of score points, and the total
count of items receiving a first and second read. In the fifth column the percent of exact matches between the first and second scores is provided. The following column (“Adj.”) is the percentage of the first and second scores with a difference of −1 or 1. “Total” is the sum of Exact and Adjacent matches (e.g., the two prior columns).
Form Item Score Points
Total N-Count
Agreement (%) Raw Score Mean Raw Score Standard Deviation Intraclass
Corr. Weighted
Kappa Exact Adj. Total First Read Second
Read First Read Second Read
502 43 1 76 93.4% 6.6% 100.0% 0.7 0.7 0.46 0.47 0.85 0.85 502 44 1 76 98.7% 1.3% 100.0% 0.7 0.7 0.47 0.47 0.97 0.97 502 45 1 76 97.4% 2.6% 100.0% 0.7 0.7 0.48 0.47 0.94 0.94 503 41 1 74 93.2% 6.8% 100.0% 0.4 0.4 0.49 0.48 0.86 0.86 503 42 1 74 91.9% 8.1% 100.0% 0.5 0.5 0.50 0.50 0.84 0.84 503 45 1 74 100.0% 0.0% 100.0% 0.5 0.5 0.50 0.50 1.00 1.00 504 41 1 81 95.1% 4.9% 100.0% 0.5 0.5 0.50 0.50 0.90 0.90 504 42 1 80 100.0% 0.0% 100.0% 0.9 0.9 0.30 0.30 1.00 1.00 504 43 1 79 93.7% 6.3% 100.0% 0.9 0.9 0.35 0.33 0.73 0.73 504 44 1 80 96.3% 3.8% 100.0% 0.6 0.6 0.50 0.49 0.92 0.92 505 41 1 80 93.8% 6.3% 100.0% 0.9 0.8 0.35 0.38 0.77 0.76 505 42 1 78 100.0% 0.0% 100.0% 0.3 0.3 0.45 0.45 1.00 1.00 505 43 1 79 100.0% 0.0% 100.0% 0.8 0.8 0.36 0.36 1.00 1.00 506 43 1 84 88.1% 11.9% 100.0% 0.8 0.8 0.43 0.43 0.68 0.67 506 44 1 82 87.8% 12.2% 100.0% 0.6 0.5 0.49 0.50 0.75 0.75 507 41 1 71 100.0% 0.0% 100.0% 1.0 1.0 0.20 0.20 1.00 1.00 507 42 1 71 98.6% 1.4% 100.0% 0.9 0.9 0.28 0.26 0.90 0.90 507 43 1 71 93.0% 7.0% 100.0% 0.2 0.2 0.40 0.36 0.76 0.76 507 44 1 71 100.0% 0.0% 100.0% 0.6 0.6 0.49 0.49 1.00 1.00

Prepared for NYSED by Pearson 34
Form Item Score Points
Total N-Count
Agreement (%) Raw Score Mean Raw Score Standard Deviation Intraclass
Corr. Weighted
Kappa Exact Adj. Total First Read Second
Read First Read Second Read
508 41 1 82 98.8% 1.2% 100.0% 0.5 0.5 0.50 0.50 0.98 0.98 508 42 1 82 95.1% 4.9% 100.0% 0.8 0.8 0.42 0.38 0.85 0.85 508 43 1 82 100.0% 0.0% 100.0% 0.9 0.9 0.24 0.24 1.00 1.00 508 44 1 82 86.6% 13.4% 100.0% 0.5 0.6 0.50 0.49 0.73 0.73 508 45 1 81 96.3% 3.7% 100.0% 0.4 0.4 0.49 0.50 0.92 0.92 509 41 1 82 97.6% 2.4% 100.0% 0.1 0.1 0.24 0.24 0.79 0.79 509 42 1 82 81.7% 18.3% 100.0% 0.5 0.4 0.50 0.50 0.64 0.64 509 43 1 82 96.3% 3.7% 100.0% 0.6 0.6 0.48 0.48 0.92 0.92 510 41 1 77 96.1% 3.9% 100.0% 0.8 0.8 0.42 0.41 0.89 0.88 510 42 1 78 100.0% 0.0% 100.0% 0.9 0.9 0.29 0.29 1.00 1.00 510 43 1 78 92.3% 7.7% 100.0% 0.5 0.5 0.50 0.50 0.85 0.85 510 44 1 76 97.4% 2.6% 100.0% 1.0 0.9 0.16 0.22 0.66 0.65 510 45 1 76 98.7% 1.3% 100.0% 0.6 0.6 0.49 0.49 0.97 0.97 511 41 1 77 98.7% 1.3% 100.0% 0.9 0.9 0.32 0.34 0.94 0.94 511 42 1 76 88.2% 11.8% 100.0% 0.8 0.9 0.38 0.22 0.41 0.42 512 41 1 81 88.9% 11.1% 100.0% 0.6 0.5 0.50 0.50 0.78 0.78 512 42 1 78 92.3% 7.7% 100.0% 0.3 0.3 0.44 0.44 0.80 0.80 512 43 1 77 96.1% 3.9% 100.0% 0.5 0.5 0.50 0.50 0.92 0.92 512 44 1 77 94.8% 5.2% 100.0% 0.8 0.8 0.39 0.39 0.83 0.83 512 45 1 78 96.2% 3.8% 100.0% 0.5 0.6 0.50 0.50 0.92 0.92 513 41 1 77 97.4% 2.6% 100.0% 0.5 0.5 0.50 0.50 0.95 0.95 513 42 1 77 88.3% 11.7% 100.0% 0.4 0.4 0.49 0.50 0.76 0.76 513 43 1 77 88.3% 11.7% 100.0% 0.5 0.5 0.50 0.50 0.77 0.77 513 44 1 77 93.5% 6.5% 100.0% 0.5 0.6 0.50 0.50 0.87 0.87 513 45 1 77 94.8% 5.2% 100.0% 0.8 0.8 0.38 0.38 0.82 0.81 514 41 1 73 94.5% 5.5% 100.0% 0.8 0.8 0.39 0.43 0.83 0.83

Prepared for NYSED by Pearson 35
Form Item Score Points
Total N-Count
Agreement (%) Raw Score Mean Raw Score Standard Deviation Intraclass
Corr. Weighted
Kappa Exact Adj. Total First Read Second
Read First Read Second Read
514 42 1 73 100.0% 0.0% 100.0% 1.0 1.0 0.20 0.20 1.00 1.00 514 43 1 73 97.3% 2.7% 100.0% 1.0 1.0 0.12 0.20 0.49 0.49 514 44 1 72 98.6% 1.4% 100.0% 0.9 1.0 0.23 0.20 0.85 0.85 515 41 1 80 98.8% 1.3% 100.0% 0.9 1.0 0.24 0.22 0.88 0.88 515 42 1 80 98.8% 1.3% 100.0% 0.9 1.0 0.24 0.22 0.88 0.88 516 43 1 70 90.0% 10.0% 100.0% 0.6 0.6 0.50 0.50 0.80 0.79 516 44 1 71 98.6% 1.4% 100.0% 0.7 0.7 0.46 0.45 0.97 0.97 516 45 1 71 93.0% 7.0% 100.0% 0.4 0.5 0.50 0.50 0.86 0.86 516 46 1 70 97.1% 2.9% 100.0% 0.3 0.3 0.45 0.45 0.93 0.93

Prepared for NYSED by Pearson 36
Appendix D: Partial-Credit Model Item Analysis The first five columns from the left contain the test name, form name, item type, item
number on the form, and maximum points possible for the item. The sixth column contains the number of students that the item was administered to. The remaining five columns contain the Rasch Item Difficulty, step difficulties (for multi-point items only), and the INFIT Rasch model fit statistic. Items without statistics are DNS (Do Not Score) status items.
Test Form Type Item Max N-Count RID INFIT
2014_G4SC 501 MC 01 1 793 −0.3200 1.07 2014_G4SC 501 MC 02 1 793 −0.7400 1.07 2014_G4SC 501 MC 03 1 793 0.9800 1.05 2014_G4SC 501 MC 04 1 793 0.9600 1.07 2014_G4SC 501 MC 05 1 793 1.0300 1.20 2014_G4SC 501 MC 06 1 793 −0.3798 0.95 2014_G4SC 501 MC 07 1 793 2.0900 1.19 2014_G4SC 501 MC 08 1 793 0.5600 1.19 2014_G4SC 501 MC 09 1 793 −0.2193 1.05 2014_G4SC 501 MC 10 1 793 −0.9100 0.73 2014_G4SC 501 MC 11 1 793 0.4100 0.92 2014_G4SC 501 MC 12 1 793 −0.0882 1.04 2014_G4SC 501 MC 13 1 793 0.8600 1.02 2014_G4SC 501 MC 14 1 793 0.7840 0.92 2014_G4SC 501 MC 15 1 793 −0.9000 1.01 2014_G4SC 501 MC 16 1 793 −0.0600 0.81 2014_G4SC 501 MC 17 1 793 −1.0600 0.81 2014_G4SC 501 MC 18 1 793 −0.2000 0.90 2014_G4SC 501 MC 19 1 793 0.0900 0.96 2014_G4SC 501 MC 20 1 793 0.1300 1.08 2014_G4SC 501 MC 21 1 793 0.2700 0.92 2014_G4SC 501 MC 22 1 793 −0.9900 0.81 2014_G4SC 501 MC 23 1 793 −0.5600 1.07 2014_G4SC 501 MC 24 1 793 1.3200 1.01 2014_G4SC 501 MC 25 1 793 0.0200 0.93 2014_G4SC 502 MC 01 1 836 −0.2268 0.94 2014_G4SC 502 MC 02 1 836 2.3722 1.04 2014_G4SC 502 MC 03 1 836 −0.4367 0.93 2014_G4SC 502 MC 04 1 836 0.7476 1.04 2014_G4SC 502 MC 05 1 836 0.4315 0.98 2014_G4SC 502 MC 06 1 836 −0.5909 0.91

Prepared for NYSED by Pearson 37
Test Form Type Item Max N-Count RID INFIT
2014_G4SC 502 CR 41 . 2014_G4SC 502 CR 42 . 2014_G4SC 502 CR 43 1 836 0.9993 0.99 2014_G4SC 502 CR 44 1 836 0.7137 1.13 2014_G4SC 502 CR 45 1 836 1.0188 0.93 2014_G4SC 503 MC 01 1 829 −0.8876 0.97 2014_G4SC 503 MC 02 1 829 1.7900 1.09 2014_G4SC 503 MC 03 1 829 1.4762 0.98 2014_G4SC 503 MC 04 1 829 −0.8876 0.91 2014_G4SC 503 MC 05 1 829 0.2829 1.01 2014_G4SC 503 MC 06 1 829 0.4271 1.04 2014_G4SC 503 CR 41 1 829 2.2008 0.97 2014_G4SC 503 CR 42 1 829 1.6174 1.01 2014_G4SC 503 CR 43 . 2014_G4SC 503 CR 44 . 2014_G4SC 503 CR 45 1 829 1.9728 0.96 2014_G4SC 504 MC 01 1 826 −0.0543 1.07 2014_G4SC 504 MC 02 1 826 2.8754 1.08 2014_G4SC 504 MC 03 1 826 0.6190 1.06 2014_G4SC 504 MC 04 1 826 0.9932 0.96 2014_G4SC 504 MC 05 1 826 −0.4866 1.03 2014_G4SC 504 MC 06 1 826 −0.5482 0.87 2014_G4SC 504 MC 07 1 826 −1.6671 0.92 2014_G4SC 504 CR 41 1 826 1.2799 1.09 2014_G4SC 504 CR 42 1 826 −0.6121 0.88 2014_G4SC 504 CR 43 1 826 −0.1288 1.07 2014_G4SC 504 CR 44 1 826 1.0655 0.89 2014_G4SC 505 MC 01 1 842 0.9595 0.95 2014_G4SC 505 MC 02 1 842 0.7569 0.94 2014_G4SC 505 MC 03 1 842 −0.4006 0.91 2014_G4SC 505 MC 04 1 842 −0.3469 0.99 2014_G4SC 505 MC 05 1 842 0.8759 1.10 2014_G4SC 505 MC 06 1 842 0.5397 1.03 2014_G4SC 505 MC 07 1 842 1.9592 1.13 2014_G4SC 505 MC 08 1 842 2.1507 1.00 2014_G4SC 505 CR 41 1 842 −0.2526 0.94 2014_G4SC 505 CR 42 1 842 2.9962 0.94 2014_G4SC 505 CR 43 1 842 −0.8127 0.93 2014_G4SC 506 MC 01 1 836 −0.5086 0.95 2014_G4SC 506 MC 02 1 836 1.7556 1.02

Prepared for NYSED by Pearson 38
Test Form Type Item Max N-Count RID INFIT
2014_G4SC 506 MC 03 1 836 1.6765 1.16 2014_G4SC 506 MC 04 1 836 −1.1648 0.96 2014_G4SC 506 MC 05 1 836 0.6165 0.92 2014_G4SC 506 MC 06 1 836 0.1468 0.96 2014_G4SC 506 CR 41 . 2014_G4SC 506 CR 42 . 2014_G4SC 506 CR 43 1 836 0.3319 1.01 2014_G4SC 506 CR 44 1 836 1.4953 0.97 2014_G4SC 507 MC 01 1 827 −0.9291 1.09 2014_G4SC 507 MC 02 1 827 1.6702 0.93 2014_G4SC 507 MC 03 1 827 1.3499 1.01 2014_G4SC 507 MC 04 1 827 1.9775 1.08 2014_G4SC 507 MC 05 1 827 0.6270 1.06 2014_G4SC 507 MC 06 1 827 −1.8517 0.94 2014_G4SC 507 MC 07 1 827 0.4937 0.99 2014_G4SC 507 MC 08 1 827 −0.3129 1.00 2014_G4SC 507 CR 41 1 827 −0.6510 0.93 2014_G4SC 507 CR 42 1 827 −0.0951 0.92 2014_G4SC 507 CR 43 1 827 3.7151 0.93 2014_G4SC 507 CR 44 1 827 1.2747 0.96 2014_G4SC 508 MC 01 1 810 −0.3096 0.97 2014_G4SC 508 MC 02 1 810 0.3155 1.00 2014_G4SC 508 MC 03 1 810 1.1151 0.98 2014_G4SC 508 MC 04 1 810 −0.2542 1.01 2014_G4SC 508 MC 05 1 810 1.7218 1.10 2014_G4SC 508 MC 06 1 810 −0.6928 0.95 2014_G4SC 508 MC 07 1 810 −1.6245 0.95 2014_G4SC 508 CR 41 1 810 1.5292 1.08 2014_G4SC 508 CR 42 1 810 −0.0051 1.01 2014_G4SC 508 CR 43 1 810 −1.0260 0.91 2014_G4SC 508 CR 44 1 810 0.8499 1.06 2014_G4SC 508 CR 45 1 810 1.9554 0.88 2014_G4SC 509 MC 01 1 831 0.4505 0.98 2014_G4SC 509 MC 02 1 831 −2.2394 0.97 2014_G4SC 509 MC 03 1 831 1.3286 0.97 2014_G4SC 509 MC 04 1 831 −1.6756 0.89 2014_G4SC 509 MC 05 1 831 −1.0043 0.91 2014_G4SC 509 MC 06 1 831 0.7285 0.98 2014_G4SC 509 MC 07 1 831 −0.9663 0.97 2014_G4SC 509 MC 08 1 831 0.8260 0.91

Prepared for NYSED by Pearson 39
Test Form Type Item Max N-Count RID INFIT
2014_G4SC 509 CR 41 1 831 4.3802 1.26 2014_G4SC 509 CR 42 1 831 1.2935 1.00 2014_G4SC 509 CR 43 1 831 0.7835 1.09 2014_G4SC 510 MC 01 1 809 −2.5058 1.02 2014_G4SC 510 MC 02 1 809 0.6482 1.02 2014_G4SC 510 MC 03 1 809 1.9337 1.13 2014_G4SC 510 MC 04 1 809 −1.0009 0.98 2014_G4SC 510 MC 05 1 809 −0.5847 1.00 2014_G4SC 510 MC 06 1 809 −0.2311 0.91 2014_G4SC 510 MC 07 1 809 0.3686 1.02 2014_G4SC 510 CR 41 1 809 0.2076 1.04 2014_G4SC 510 CR 42 1 809 −0.2027 0.95 2014_G4SC 510 CR 43 1 809 2.1573 0.88 2014_G4SC 510 CR 44 1 809 −1.1093 1.02 2014_G4SC 510 CR 45 1 809 1.5579 1.00 2014_G4SC 511 MC 01 1 820 1.7016 0.99 2014_G4SC 511 MC 02 1 820 0.0865 0.83 2014_G4SC 511 MC 03 1 820 −2.0624 0.90 2014_G4SC 511 MC 04 1 820 −0.2513 0.93 2014_G4SC 511 MC 05 1 820 1.4283 0.99 2014_G4SC 511 MC 06 1 820 1.4688 1.04 2014_G4SC 511 MC 07 1 820 1.6022 1.19 2014_G4SC 511 CR 41 1 820 −0.6883 1.02 2014_G4SC 511 CR 42 1 820 −0.6765 1.00 2014_G4SC 511 CR 43 . 2014_G4SC 511 CR 44 . 2014_G4SC 511 CR 45 . 2014_G4SC 512 MC 01 1 795 −0.2183 1.04 2014_G4SC 512 MC 02 1 795 0.9595 0.98 2014_G4SC 512 MC 03 1 795 −2.0385 1.02 2014_G4SC 512 MC 04 1 795 −1.0464 0.96 2014_G4SC 512 MC 05 1 795 2.7757 1.20 2014_G4SC 512 MC 06 1 795 −0.0149 0.91 2014_G4SC 512 MC 07 1 795 0.4716 0.98 2014_G4SC 512 CR 41 1 795 1.2178 0.99 2014_G4SC 512 CR 42 1 795 2.8613 1.09 2014_G4SC 512 CR 43 1 795 1.1652 0.94 2014_G4SC 512 CR 44 1 795 −0.4613 1.00 2014_G4SC 512 CR 45 1 795 1.1455 0.91 2014_G4SC 513 MC 01 1 767 −0.4775 1.14

Prepared for NYSED by Pearson 40
Test Form Type Item Max N-Count RID INFIT
2014_G4SC 513 MC 02 1 767 −0.8480 1.00 2014_G4SC 513 MC 03 1 767 −0.0687 0.89 2014_G4SC 513 MC 04 1 767 1.4267 1.21 2014_G4SC 513 MC 05 1 767 −0.1500 0.90 2014_G4SC 513 MC 06 1 767 0.8390 1.09 2014_G4SC 513 MC 07 1 767 −0.5102 1.03 2014_G4SC 513 CR 41 1 767 1.6137 0.90 2014_G4SC 513 CR 42 1 767 2.0309 1.01 2014_G4SC 513 CR 43 1 767 1.5943 0.90 2014_G4SC 513 CR 44 1 767 1.6526 0.94 2014_G4SC 513 CR 45 1 767 −0.0074 0.94 2014_G4SC 514 MC 01 1 801 0.7565 1.02 2014_G4SC 514 MC 02 1 801 2.0934 1.14 2014_G4SC 514 MC 03 1 801 1.3665 0.99 2014_G4SC 514 MC 04 1 801 0.3443 1.07 2014_G4SC 514 MC 05 1 801 0.0626 1.01 2014_G4SC 514 MC 06 1 801 1.2171 1.00 2014_G4SC 514 MC 07 1 801 −0.2483 1.04 2014_G4SC 514 CR 41 1 801 −0.0651 0.91 2014_G4SC 514 CR 42 1 801 −1.3950 0.89 2014_G4SC 514 CR 43 1 801 −1.2229 0.87 2014_G4SC 514 CR 44 1 801 −1.3351 0.86 2014_G4SC 515 MC 01 1 821 −0.4681 1.06 2014_G4SC 515 MC 02 1 821 0.3084 0.95 2014_G4SC 515 MC 03 1 821 0.6435 1.10 2014_G4SC 515 MC 04 1 821 1.5849 1.02 2014_G4SC 515 MC 05 1 821 1.3183 0.90 2014_G4SC 515 MC 06 1 821 0.4216 0.81 2014_G4SC 515 MC 07 1 821 1.4176 1.19 2014_G4SC 515 MC 08 1 821 0.8597 1.01 2014_G4SC 515 CR 41 1 821 −1.4853 0.81 2014_G4SC 515 CR 42 1 821 −1.5955 0.87 2014_G4SC 515 CR 43 . 2014_G4SC 515 CR 44 . 2014_G4SC 516 MC 01 1 795 0.2270 1.02 2014_G4SC 516 MC 02 1 795 2.1554 0.97 2014_G4SC 516 MC 03 1 795 −1.3318 0.89 2014_G4SC 516 MC 04 1 795 −0.6387 0.97 2014_G4SC 516 MC 05 1 795 1.2792 1.06 2014_G4SC 516 CR 41 .

Prepared for NYSED by Pearson 41
Test Form Type Item Max N-Count RID INFIT
2014_G4SC 516 CR 42 . 2014_G4SC 516 CR 43 1 795 0.5267 0.87 2014_G4SC 516 CR 44 1 795 0.5962 1.10 2014_G4SC 516 CR 45 1 795 1.8104 1.00 2014_G4SC 516 CR 46 1 795 2.6801 0.99

Prepared for NYSED by Pearson 42
Appendix E: DIF Statistics The first four columns from the left contain the test name, form ID, item type, and
item sequence number within the form. The next three columns contain the Mantel-Haenszel DIF statistical values (note that the MH Delta statistic cannot be calculated for CR items). The final two columns will only have values if the item displays possible moderate or severe DIF; if so, the degree of DIF (B/BB = moderate; C/CC = severe) and the favored group will be shown. Items without statistics are DNS (Do Not Score) status items.
Test Form Type Item MH Delta MH Chi-Sq
Effect Size
DIF Category
Favored Group
2014_G4SC 501 MC 01 0.53 1.20 0.07 2014_G4SC 501 MC 02 −1.94 11.51 −0.21 C M 2014_G4SC 501 MC 03 0.43 1.19 0.07 2014_G4SC 501 MC 04 0.74 3.40 0.11 2014_G4SC 501 MC 05 −0.34 0.83 −0.07 2014_G4SC 501 MC 06 1.14 4.75 0.14 B F 2014_G4SC 501 MC 07 −0.71 3.77 −0.12 2014_G4SC 501 MC 08 −0.08 0.04 0.00 2014_G4SC 501 MC 09 0.32 0.42 0.03 2014_G4SC 501 MC 10 −0.03 0.00 −0.02 2014_G4SC 501 MC 11 −0.29 0.42 −0.04 2014_G4SC 501 MC 12 −0.49 1.15 −0.07 2014_G4SC 501 MC 13 0.79 3.73 0.12 2014_G4SC 501 MC 14 −0.33 0.58 −0.03 2014_G4SC 501 MC 15 0.87 1.98 0.07 2014_G4SC 501 MC 16 0.68 1.59 0.09 2014_G4SC 501 MC 17 1.70 4.92 0.11 2014_G4SC 501 MC 18 −0.26 0.25 −0.02 2014_G4SC 501 MC 19 −0.69 2.22 −0.08 2014_G4SC 501 MC 20 0.16 0.13 0.04 2014_G4SC 501 MC 21 −1.12 5.57 −0.16 B M 2014_G4SC 501 MC 22 0.77 1.21 0.06 2014_G4SC 501 MC 23 −0.03 0.00 0.01 2014_G4SC 501 MC 24 −0.23 0.34 −0.04 2014_G4SC 501 MC 25 0.12 0.06 0.01 2014_G4SC 502 MC 01 −0.97 3.42 −0.12 2014_G4SC 502 MC 02 −0.40 0.98 −0.06 2014_G4SC 502 MC 03 0.48 0.77 0.04 2014_G4SC 502 MC 04 −0.17 0.18 −0.04 2014_G4SC 502 MC 05 −0.11 0.07 −0.02 2014_G4SC 502 MC 06 −0.47 0.64 −0.04

Prepared for NYSED by Pearson 43
Test Form Type Item MH Delta MH Chi-Sq
Effect Size
DIF Category
Favored Group
2014_G4SC 502 CR 41 2014_G4SC 502 CR 42 2014_G4SC 502 CR 43 2.32 −0.09 2014_G4SC 502 CR 44 2.27 0.12 2014_G4SC 502 CR 45 3.90 0.12 2014_G4SC 503 MC 01 −1.33 4.99 −0.14 B M 2014_G4SC 503 MC 02 0.04 0.01 0.00 2014_G4SC 503 MC 03 −0.42 1.20 −0.07 2014_G4SC 503 MC 04 0.66 1.14 0.07 2014_G4SC 503 MC 05 0.65 2.32 0.09 2014_G4SC 503 MC 06 0.47 1.30 0.08 2014_G4SC 503 CR 41 1.07 −0.06 2014_G4SC 503 CR 42 1.51 −0.08 2014_G4SC 503 CR 43 2014_G4SC 503 CR 44 2014_G4SC 503 CR 45 0.93 −0.05 2014_G4SC 504 MC 01 −0.22 0.25 −0.04 2014_G4SC 504 MC 02 −0.04 0.01 0.00 2014_G4SC 504 MC 03 −0.84 4.49 −0.13 2014_G4SC 504 MC 04 0.71 3.09 0.10 2014_G4SC 504 MC 05 −0.32 0.41 −0.04 2014_G4SC 504 MC 06 −0.46 0.65 −0.05 2014_G4SC 504 MC 07 0.82 0.95 0.06 2014_G4SC 504 CR 41 0.10 0.02 2014_G4SC 504 CR 42 1.86 0.08 2014_G4SC 504 CR 43 0.51 0.05 2014_G4SC 504 CR 44 0.16 −0.03 2014_G4SC 505 MC 01 −0.07 0.03 −0.02 2014_G4SC 505 MC 02 0.13 0.11 0.02 2014_G4SC 505 MC 03 0.99 3.72 0.12 2014_G4SC 505 MC 04 1.25 6.84 0.18 B F 2014_G4SC 505 MC 05 0.32 0.77 0.06 2014_G4SC 505 MC 06 −1.27 11.00 −0.23 B M 2014_G4SC 505 MC 07 −0.25 0.47 −0.05 2014_G4SC 505 MC 08 −0.77 3.78 −0.12 2014_G4SC 505 CR 41 4.07 0.14 2014_G4SC 505 CR 42 4.09 −0.12 2014_G4SC 505 CR 43 3.30 0.13 2014_G4SC 506 MC 01 0.66 1.41 0.08 2014_G4SC 506 MC 02 1.18 8.66 0.17 B F

Prepared for NYSED by Pearson 44
Test Form Type Item MH Delta MH Chi-Sq
Effect Size
DIF Category
Favored Group
2014_G4SC 506 MC 03 −0.36 0.94 −0.05 2014_G4SC 506 MC 04 0.31 0.21 0.02 2014_G4SC 506 MC 05 −0.91 4.41 −0.13 2014_G4SC 506 MC 06 0.36 0.59 0.04 2014_G4SC 506 CR 41 2014_G4SC 506 CR 42 2014_G4SC 506 CR 43 1.80 0.08 2014_G4SC 506 CR 44 8.48 −0.16 2014_G4SC 507 MC 01 0.58 1.15 0.08 2014_G4SC 507 MC 02 −0.90 5.19 −0.14 2014_G4SC 507 MC 03 0.10 0.07 0.02 2014_G4SC 507 MC 04 0.56 2.19 0.10 2014_G4SC 507 MC 05 −1.07 7.99 −0.19 B M 2014_G4SC 507 MC 06 −0.58 0.50 −0.04 2014_G4SC 507 MC 07 0.75 3.45 0.12 2014_G4SC 507 MC 08 −0.05 0.01 0.00 2014_G4SC 507 CR 41 6.61 0.17 2014_G4SC 507 CR 42 5.38 0.14 2014_G4SC 507 CR 43 0.23 −0.03 2014_G4SC 507 CR 44 5.25 −0.15 2014_G4SC 508 MC 01 0.07 0.02 0.02 2014_G4SC 508 MC 02 −1.36 9.76 −0.21 B M 2014_G4SC 508 MC 03 0.04 0.01 −0.01 2014_G4SC 508 MC 04 −0.47 0.95 −0.04 2014_G4SC 508 MC 05 −0.28 0.56 −0.05 2014_G4SC 508 MC 06 0.86 2.34 0.13 2014_G4SC 508 MC 07 −0.43 0.30 −0.02 2014_G4SC 508 CR 41 4.81 −0.15 2014_G4SC 508 CR 42 0.00 0.01 2014_G4SC 508 CR 43 10.33 0.21 BB F 2014_G4SC 508 CR 44 4.68 0.12 2014_G4SC 508 CR 45 3.20 0.11 2014_G4SC 509 MC 01 0.05 0.01 0.01 2014_G4SC 509 MC 02 1.16 1.51 0.08 2014_G4SC 509 MC 03 −0.10 0.07 −0.01 2014_G4SC 509 MC 04 −1.39 3.23 −0.10 2014_G4SC 509 MC 05 0.44 0.53 0.04 2014_G4SC 509 MC 06 −0.72 3.30 −0.11 2014_G4SC 509 MC 07 1.17 4.09 0.12 B F 2014_G4SC 509 MC 08 −1.14 7.51 −0.16 B M

Prepared for NYSED by Pearson 45
Test Form Type Item MH Delta MH Chi-Sq
Effect Size
DIF Category
Favored Group
2014_G4SC 509 CR 41 0.41 0.05 2014_G4SC 509 CR 42 0.01 0.00 2014_G4SC 509 CR 43 6.40 0.16 2014_G4SC 510 MC 01 1.97 2.95 0.15 2014_G4SC 510 MC 02 0.48 1.36 0.06 2014_G4SC 510 MC 03 −0.41 1.18 −0.08 2014_G4SC 510 MC 04 0.93 2.22 0.10 2014_G4SC 510 MC 05 2.06 13.50 0.26 C F 2014_G4SC 510 MC 06 −0.99 3.55 −0.12 2014_G4SC 510 MC 07 0.12 0.07 0.03 2014_G4SC 510 CR 41 1.12 −0.07 2014_G4SC 510 CR 42 1.06 −0.08 2014_G4SC 510 CR 43 1.79 −0.08 2014_G4SC 510 CR 44 1.02 0.07 2014_G4SC 510 CR 45 0.53 −0.03 2014_G4SC 511 MC 01 −0.11 0.09 −0.01 2014_G4SC 511 MC 02 −0.27 0.29 −0.04 2014_G4SC 511 MC 03 −0.37 0.11 −0.01 2014_G4SC 511 MC 04 1.18 5.34 0.14 B F 2014_G4SC 511 MC 05 −0.25 0.45 −0.04 2014_G4SC 511 MC 06 −1.16 9.79 −0.19 B M 2014_G4SC 511 MC 07 −0.04 0.02 −0.01 2014_G4SC 511 CR 41 1.62 0.09 2014_G4SC 511 CR 42 3.98 −0.13 2014_G4SC 511 CR 43 2014_G4SC 511 CR 44 2014_G4SC 511 CR 45 2014_G4SC 512 MC 01 −0.66 1.90 −0.09 2014_G4SC 512 MC 02 −0.32 0.58 −0.05 2014_G4SC 512 MC 03 −1.04 1.39 −0.06 2014_G4SC 512 MC 04 0.34 0.30 0.04 2014_G4SC 512 MC 05 −0.23 0.29 −0.04 2014_G4SC 512 MC 06 0.37 0.58 0.04 2014_G4SC 512 MC 07 −0.34 0.63 −0.05 2014_G4SC 512 CR 41 2.22 0.09 2014_G4SC 512 CR 42 1.04 0.07 2014_G4SC 512 CR 43 2.07 −0.09 2014_G4SC 512 CR 44 0.52 0.05 2014_G4SC 512 CR 45 1.33 0.07 2014_G4SC 513 MC 01 −0.39 0.59 −0.06

Prepared for NYSED by Pearson 46
Test Form Type Item MH Delta MH Chi-Sq
Effect Size
DIF Category
Favored Group
2014_G4SC 513 MC 02 −0.17 0.08 −0.02 2014_G4SC 513 MC 03 −0.02 0.00 −0.01 2014_G4SC 513 MC 04 0.28 0.58 0.05 2014_G4SC 513 MC 05 1.22 5.46 0.16 B F 2014_G4SC 513 MC 06 −0.19 0.23 −0.02 2014_G4SC 513 MC 07 1.05 3.86 0.14 B F 2014_G4SC 513 CR 41 6.59 −0.15 2014_G4SC 513 CR 42 0.03 0.01 2014_G4SC 513 CR 43 0.19 −0.03 2014_G4SC 513 CR 44 2.36 −0.10 2014_G4SC 513 CR 45 2.67 0.10 2014_G4SC 514 MC 01 0.26 0.42 0.05 2014_G4SC 514 MC 02 −0.07 0.04 −0.01 2014_G4SC 514 MC 03 −0.69 3.05 −0.12 2014_G4SC 514 MC 04 −0.18 0.17 −0.03 2014_G4SC 514 MC 05 0.54 1.38 0.08 2014_G4SC 514 MC 06 −0.29 0.52 −0.05 2014_G4SC 514 MC 07 −0.39 0.63 −0.05 2014_G4SC 514 CR 41 0.70 0.06 2014_G4SC 514 CR 42 4.40 0.13 2014_G4SC 514 CR 43 3.36 0.10 2014_G4SC 514 CR 44 1.54 −0.07 2014_G4SC 515 MC 01 0.32 0.36 0.03 2014_G4SC 515 MC 02 0.07 0.02 0.01 2014_G4SC 515 MC 03 0.58 2.06 0.11 2014_G4SC 515 MC 04 −0.03 0.01 −0.01 2014_G4SC 515 MC 05 −0.15 0.13 −0.02 2014_G4SC 515 MC 06 −0.45 0.86 −0.05 2014_G4SC 515 MC 07 0.89 5.78 0.16 2014_G4SC 515 MC 08 −1.41 11.79 −0.21 B M 2014_G4SC 515 CR 41 1.64 0.07 2014_G4SC 515 CR 42 3.52 0.13 2014_G4SC 515 CR 43 2014_G4SC 515 CR 44 2014_G4SC 516 MC 01 0.55 1.62 0.09 2014_G4SC 516 MC 02 0.02 0.00 0.01 2014_G4SC 516 MC 03 −1.13 2.44 −0.09 2014_G4SC 516 MC 04 −0.39 0.55 −0.04 2014_G4SC 516 MC 05 −0.70 3.42 −0.13 2014_G4SC 516 CR 41

Prepared for NYSED by Pearson 47
Test Form Type Item MH Delta MH Chi-Sq
Effect Size
DIF Category
Favored Group
2014_G4SC 516 CR 42 2014_G4SC 516 CR 43 0.33 −0.04 2014_G4SC 516 CR 44 0.05 −0.02 2014_G4SC 516 CR 45 0.33 −0.04 2014_G4SC 516 CR 46 5.27 0.14
DIF category meanings: A/AA = negligible, B/BB = moderate, C/CC = severe.
Favored group meanings: F = Female, M = Male.

Prepared for NYSED by Pearson 48
Appendix F: Operational Test Maps June 2014
Pos Item Type
Max Points Weight Std Key
Idea PI Mean Point-Biserial RID INFIT
1 MC 1 1 1 - S 2.1 0.85 0.57 -0.3179 0.86 2 MC 1 1 4 PS 1.1a 0.64 0.44 0.8787 1.08 3 MC 1 1 4 PS 2.1a 0.81 0.40 -0.1612 1.04 4 MC 1 1 4 PS 3.2a 0.76 0.40 0.2784 1.11 5 MC 1 1 4 PS 2.1d 0.54 0.34 1.2976 1.14 6 MC 1 1 4 PS 2.1d 0.78 0.40 0.0772 1.00 7 MC 1 1 4 PS 2.1d 0.50 0.48 1.4871 0.99 8 MC 1 1 4 PS 3.1b 0.90 0.56 -0.8117 0.83 9 MC 1 1 4 PS 3.2b 0.85 0.40 -0.3395 0.98
10 MC 1 1 4 PS 5.1d 0.63 0.43 1.1619 1.18 11 MC 1 1 4 PS 4.1c 0.84 0.46 -0.3555 0.95 12 MC 1 1 4 PS 4.2b 0.86 0.37 -0.5652 1.01 13 MC 1 1 4 PS 3.1c 0.88 0.34 -1.0500 0.97 14 MC 1 1 4 PS 4.1d 0.50 0.52 1.5737 0.97 15 MC 1 1 4 PS 5.1f 0.73 0.50 0.2723 0.99 16 MC 1 1 4 PS 5.1f 0.85 0.45 -0.6179 0.97 17 MC 1 1 4 LE 2.2a 0.68 0.60 0.7353 0.85 18 MC 1 1 4 LE 5.2c 0.86 0.47 -0.5011 0.94 19 MC 1 1 4 LE 4.2a 0.82 0.44 -0.1761 0.97 20 MC 1 1 4 LE 3.1b 0.48 0.5 1.1900 23 MC 1 1 4 LE 4.1b 0.80 0.37 -0.0339 1.11 24 MC 1 1 4 LE 5.2e 0.91 0.47 -1.0390 0.89 25 MC 1 1 4 LE 1.2a 0.65 0.47 0.7678 0.97 26 MC 1 1 4 LE 5.1b 0.89 0.20 -1.4600 27 MC 1 1 4 LE 3.1a 0.90 0.51 -0.9279 0.85 28 MC 1 1 4 LE 6.1e 0.67 0.45 0.2500 0.99 21 MC 1 1 4 LE 4.1e 0.94 0.36 -1.5772 0.94 22 MC 1 1 4 LE 5.2e 0.79 0.53 0.1479 0.96 29 MC 1 1 6 - KI 2 0.75 0.45 0.2401 1.02 30 MC 1 1 6 - KI 2 0.68 0.55 0.6049 0.91 31 CR 1 1 4 PS 2.1e 0.79 0.41 0.0273 1.05 32 CR 1 1 1 - S 3.2 0.81 0.46 -0.2497 0.94 33 CR 1 1 1 - S 3.1a 0.74 0.44 0.2385 0.99 34 CR 1 1 4 PS 5.2b 0.59 0.51 1.0454 1.01 35 CR 1 1 4 PS 1.1a 0.62 0.58 1.2378 0.95

Prepared for NYSED by Pearson 49
Pos Item Type
Max Points Weight Std Key
Idea PI Mean Point-Biserial RID INFIT
36 CR 1 1 4 PS 2.1c 0.50 0.51 1.7166 0.98 37 CR 1 1 4 PS 2.1c 0.69 0.51 0.6641 0.97 38 CR 1 1 4 LE 3.1c 0.71 0.50 0.3732 0.98 39 CR 1 1 4 PS 3.1d 0.62 0.54 0.9896 0.94 40 CR 1 1 1 - M 3.1a 0.86 0.43 -0.6056 0.95 41 CR 1 1 4 LE 6.2b 0.78 0.50 0.0302 0.94 42 CR 1 1 4 LE 1.1d 0.79 0.50 -0.0727 0.91 43 CR 1 1 4 LE 5.2a 0.86 0.39 -0.4889 0.96 44 CR 1 1 4 LE 3.1b 0.53 0.54 1.3387 0.92 45 CR 1 1 4 LE 7.1c 0.87 0.41 -0.5957 1.01

Prepared for NYSED by Pearson 50
Appendix G: Scoring Tables
June 2014
Raw Score Ability Scale
Score 0 −5.175 0.000 1 −3.944 2.168 2 −3.213 4.347 3 −2.768 6.574 4 −2.442 8.850 5 −2.179 11.176 6 −1.957 13.536 7 −1.762 15.940 8 −1.587 18.370 9 −1.428 20.842
10 −1.280 23.347 11 −1.142 25.874
Raw Score Ability Scale
Score 12 −1.011 28.411 13 −0.886 30.982 14 −0.767 33.567 15 −0.651 36.155 16 −0.539 38.747 17 −0.429 41.343 18 −0.322 43.935 19 −0.216 46.521 20 −0.112 49.093 21 −0.008 51.635 22 0.095 54.166 23 0.198 56.673
Raw Score Ability Scale
Score 24 0.301 59.143 25 0.404 61.567 26 0.509 63.955 27 0.615 66.300 28 0.723 68.603 29 0.833 70.860 30 0.945 73.062 31 1.062 75.214 32 1.182 77.313 33 1.307 79.358 34 1.439 81.351 35 1.578 83.286
Raw Score Ability Scale
Score 36 1.726 85.173 37 1.886 87.000 38 2.061 88.775 39 2.256 90.481 40 2.479 92.145 41 2.742 93.759 42 3.068 95.329 43 3.513 96.864 44 4.244 98.380 45 5.474 100.000