new york state felony processing report indictment … · new york state felony processing report...
TRANSCRIPT
Division of Criminal Justice Services
Criminal Justice Statistical Report Andrew M. Cuomo Michael C. Green Governor Executive Deputy Commissioner
Felony Processing Report Series
Issued May 2013
New York State
Felony Processing Report Indictment through Disposition
January – December 2012 This report provides summary information related to the processing of felony cases in New York State’s superior courts and complies with the reporting requirement found in Section 837-a of the Executive Law which requires DCJS to collect and analyze statistical information on felony indictments and superior court informations (SCI) and on the disposition of those cases. The source of the data used in this report is a Felony Processing File which is derived from New York State’s Computerized Criminal History (CCH) database. Reports issued prior to 2009 relied on data from the DCJS Indictment Statistical System, which has since been discontinued. Care should be exercised when comparing current statistics to statistics in the ISS-based reports. Other criminal justice statistical and research reports are available on the DCJS website http://www.criminaljustice.ny.gov/crimnet/pubs.htm Office of Justice Research and Performance Theresa Salo, Deputy Commissioner

Division of Criminal Justice Services Felony Processing Report Series
January – December 2012 This report presents statistics concerning the processing of felony cases in New York State’s superior courts (see Criminal Procedure Law 10.10 and 10.20 for a description of the jurisdiction of superior courts). The report complies with a reporting requirement found in Section 837-a of the Executive Law (originally imposed as part of Chapter 603 of the Laws of 1973) that the Division of Criminal Justice Services (DCJS) collect and analyze statistical information on felony indictments and superior court informations (SCI) and on the dispositions of these felony cases. Beyond complying with the reporting requirement, the intent of this statewide report, and similar reports for 66 prosecutors’ offices in the state, is to supply useful and timely information to criminal justice practitioners and policy makers. The source of the data used in this report is a “felony processing file” derived from New York State’s criminal history records database, known as the Computerized Criminal History (CCH) system, which is maintained by DCJS. CCH is based on information concerning fingerprintable arrests (defined in New York State Criminal Procedure Law 160.10) transmitted to DCJS by law enforcement agencies in the State. In addition to information concerning the arrests, CCH contains information on the processing of the arrests by courts, local probation departments, some local jails, and the State Department of Corrections and Community Supervision (formerly the State Department of Correctional Services and the State Division of Parole). The unit of count in the felony processing file and in the statistical tables in this report is the “defendant-indictment.” When more than one defendant is charged in one indictment or SCI, each defendant is counted separately. If one defendant is charged in multiple indictments or SCIs, each indictment or SCI is counted separately. More than one indictment or SCI can be linked to a single arrest event and multiple arrests can be combined into one indictment or SCI. If an indictment or SCI is superseded by another, both are counted. Cases in the felony processing file and in this report’s statistical tables are categorized based on the most serious charge found in the indictment or SCI. For example, if a defendant is charged, in one indictment, with criminal possession of a controlled substance in the third degree (a Class B felony) and criminal possession of stolen property in the third degree (a Class D felony), the case would be categorized as a Class B drug felony. The current felony processing file contains information about superior court cases opened from 2006 to the present and about cases closed from 2006 to the present that were opened at any time. The file replaces the Indictment Statistical System (ISS) database that was used to produce felony processing statistics from 1973 until 2008. ISS was a stand-alone database populated by data submitted to DCJS by prosecutors.
NYS Division of Criminal Justice Services 1 May 2013
The felony processing file identifies the county in which the prosecution takes place as well as the prosecutor’s office that prosecutes the case. The latter includes the 62 county District Attorneys, the New York City Office of Special Narcotics Prosecutor (OSNP), and three units within the State’s Attorney General’s Office. OSNP prosecutes cases in New York County (Manhattan) Supreme Court, but the cases the Office prosecutes can originate in any of New York City’s five boroughs. In 2012, approximately 65 percent of cases prosecuted by OSNP originated in New York County. The prosecutorial units within the State’s Attorney General’s Office have state-wide jurisdiction. Some of the statistical tables contain information on cases opened in superior court in 2010. Other tables contain information on cases that reached final disposition in 2010. Cases in these tables may be for indictments or SCIs from the same year or from previous years. The superior court arraignment date is used to determine when the case was opened in superior court. The sentence date is the final disposition date for cases that ended with a conviction. For cases that end in a non-conviction disposition, the date of that disposition (acquittal, dismissal, etc.), is considered to be the date of final disposition.
NYS Division of Criminal Justice Services 2 May 2013
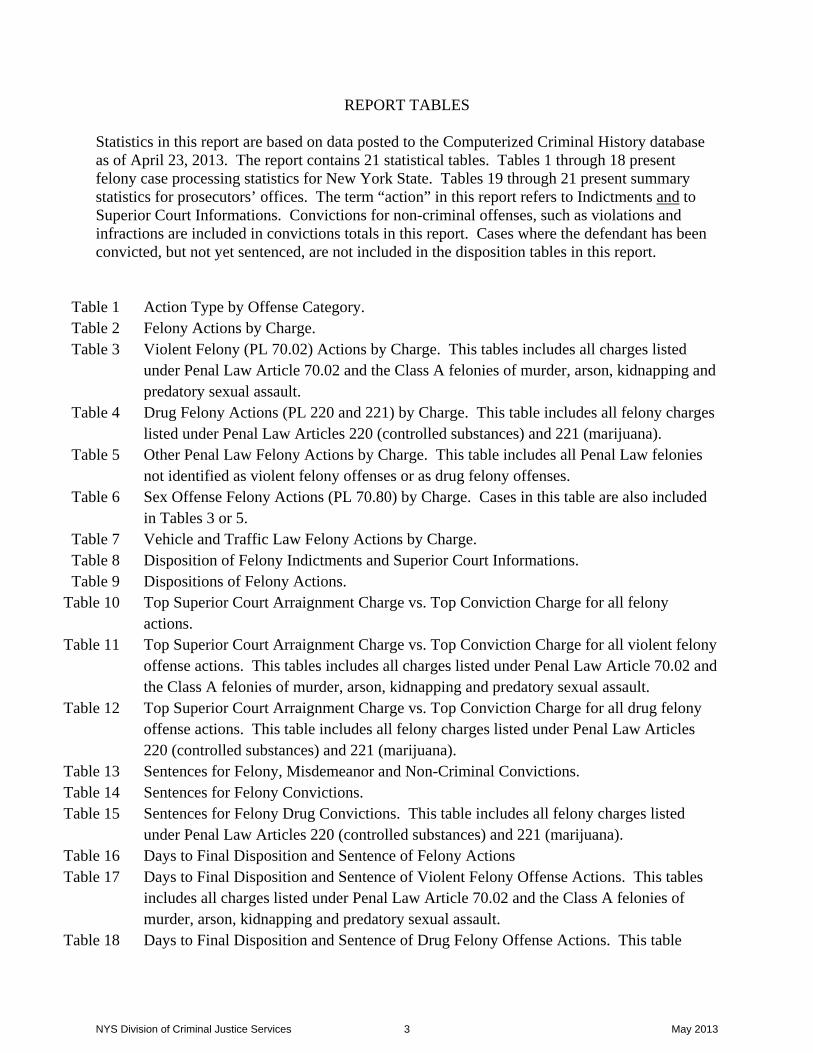
REPORT TABLES Statistics in this report are based on data posted to the Computerized Criminal History database as of April 23, 2013. The report contains 21 statistical tables. Tables 1 through 18 present felony case processing statistics for New York State. Tables 19 through 21 present summary statistics for prosecutors’ offices. The term “action” in this report refers to Indictments and to Superior Court Informations. Convictions for non-criminal offenses, such as violations and infractions are included in convictions totals in this report. Cases where the defendant has been convicted, but not yet sentenced, are not included in the disposition tables in this report.
Table 1 Action Type by Offense Category. Table 2 Felony Actions by Charge. Table 3 Violent Felony (PL 70.02) Actions by Charge. This tables includes all charges listed
under Penal Law Article 70.02 and the Class A felonies of murder, arson, kidnapping and predatory sexual assault.
Table 4 Drug Felony Actions (PL 220 and 221) by Charge. This table includes all felony charges listed under Penal Law Articles 220 (controlled substances) and 221 (marijuana).
Table 5 Other Penal Law Felony Actions by Charge. This table includes all Penal Law felonies not identified as violent felony offenses or as drug felony offenses.
Table 6 Sex Offense Felony Actions (PL 70.80) by Charge. Cases in this table are also included in Tables 3 or 5.
Table 7 Vehicle and Traffic Law Felony Actions by Charge. Table 8 Disposition of Felony Indictments and Superior Court Informations. Table 9 Dispositions of Felony Actions.
Table 10 Top Superior Court Arraignment Charge vs. Top Conviction Charge for all felony actions.
Table 11 Top Superior Court Arraignment Charge vs. Top Conviction Charge for all violent felony offense actions. This tables includes all charges listed under Penal Law Article 70.02 and the Class A felonies of murder, arson, kidnapping and predatory sexual assault.
Table 12 Top Superior Court Arraignment Charge vs. Top Conviction Charge for all drug felony offense actions. This table includes all felony charges listed under Penal Law Articles 220 (controlled substances) and 221 (marijuana).
Table 13 Sentences for Felony, Misdemeanor and Non-Criminal Convictions. Table 14 Sentences for Felony Convictions. Table 15 Sentences for Felony Drug Convictions. This table includes all felony charges listed
under Penal Law Articles 220 (controlled substances) and 221 (marijuana). Table 16 Days to Final Disposition and Sentence of Felony Actions Table 17 Days to Final Disposition and Sentence of Violent Felony Offense Actions. This tables
includes all charges listed under Penal Law Article 70.02 and the Class A felonies of murder, arson, kidnapping and predatory sexual assault.
Table 18 Days to Final Disposition and Sentence of Drug Felony Offense Actions. This table
NYS Division of Criminal Justice Services 3 May 2013

includes all felony charges listed under Penal Law Articles 220 (controlled substances) and 221 (marijuana).
Table 19 Felony Actions by Office Table 20 Dispositions of Felony Actions by Office Table 21 Convictions from Felony Actions by Office.
NYS Division of Criminal Justice Services 4 May 2013
Superior Court Cases Other Actions
Indictments Informations Unknown Total No BillReturn
Lower CourtRemove
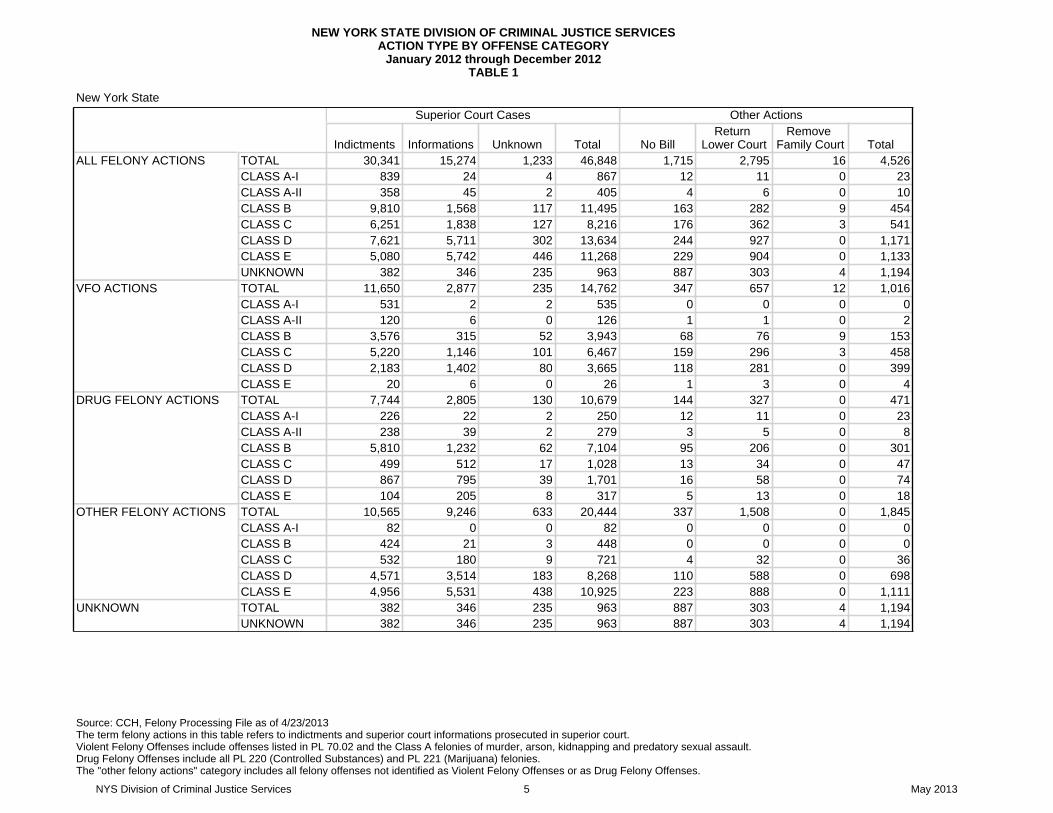
Family Court TotalALL FELONY ACTIONS TOTAL 30,341 15,274 1,233 46,848 1,715 2,795 16 4,526
CLASS A-I 839 24 4 867 12 11 0 23CLASS A-II 358 45 2 405 4 6 0 10CLASS B 9,810 1,568 117 11,495 163 282 9 454CLASS C 6,251 1,838 127 8,216 176 362 3 541CLASS D 7,621 5,711 302 13,634 244 927 0 1,171CLASS E 5,080 5,742 446 11,268 229 904 0 1,133UNKNOWN 382 346 235 963 887 303 4 1,194
VFO ACTIONS TOTAL 11,650 2,877 235 14,762 347 657 12 1,016CLASS A-I 531 2 2 535 0 0 0 0CLASS A-II 120 6 0 126 1 1 0 2CLASS B 3,576 315 52 3,943 68 76 9 153CLASS C 5,220 1,146 101 6,467 159 296 3 458CLASS D 2,183 1,402 80 3,665 118 281 0 399CLASS E 20 6 0 26 1 3 0 4
DRUG FELONY ACTIONS TOTAL 7,744 2,805 130 10,679 144 327 0 471CLASS A-I 226 22 2 250 12 11 0 23CLASS A-II 238 39 2 279 3 5 0 8CLASS B 5,810 1,232 62 7,104 95 206 0 301CLASS C 499 512 17 1,028 13 34 0 47CLASS D 867 795 39 1,701 16 58 0 74CLASS E 104 205 8 317 5 13 0 18
OTHER FELONY ACTIONS TOTAL 10,565 9,246 633 20,444 337 1,508 0 1,845CLASS A-I 82 0 0 82 0 0 0 0CLASS B 424 21 3 448 0 0 0 0CLASS C 532 180 9 721 4 32 0 36CLASS D 4,571 3,514 183 8,268 110 588 0 698CLASS E 4,956 5,531 438 10,925 223 888 0 1,111
UNKNOWN TOTAL 382 346 235 963 887 303 4 1,194UNKNOWN 382 346 235 963 887 303 4 1,194
Source: CCH, Felony Processing File as of 4/23/2013The term felony actions in this table refers to indictments and superior court informations prosecuted in superior court.Violent Felony Offenses include offenses listed in PL 70.02 and the Class A felonies of murder, arson, kidnapping and predatory sexual assault.Drug Felony Offenses include all PL 220 (Controlled Substances) and PL 221 (Marijuana) felonies.The "other felony actions" category includes all felony offenses not identified as Violent Felony Offenses or as Drug Felony Offenses.
NEW YORK STATE DIVISION OF CRIMINAL JUSTICE SERVICESACTION TYPE BY OFFENSE CATEGORY
January 2012 through December 2012TABLE 1
New York State
NYS Division of Criminal Justice Services 5 May 2013

Q1 2012 Q2 2012 Q3 2012 Q4 2012 TOTAL
PL 105-CONSPIRACY 143 83 136 88 450 1.0%
PL 120-ASSAULT 903 877 978 838 3,596 7.7%
PL 125.27-MURDER 1 20 14 17 19 70 0.1%
PL 125-HOMICIDE 196 174 191 195 756 1.6%
PL 130-SEX OFF 411 426 397 350 1,584 3.4%
PL 135-KIDNAPPING 24 29 27 36 116 0.2%
PL 140-BURGLARY 1,538 1,411 1,338 1,362 5,649 12.1%
PL 145-MISCHIEF 142 171 146 134 593 1.3%
PL 150-ARSON 55 49 70 44 218 0.5%
PL 155-LARCENY 980 952 858 846 3,636 7.8%
PL 160-ROBBERY 1,513 1,286 1,232 1,186 5,217 11.1%
PL 165-OTHER THEFT 224 201 186 171 782 1.7%
PL 170-FORGERY 307 329 301 270 1,207 2.6%
PL 200-BRIBERY 13 9 3 2 27 0.1%
PL 205-ESCAPE 75 64 72 63 274 0.6%
PL 215-JUDICIAL 350 309 301 243 1,203 2.6%
PL 220-CONT SUBS 2,726 2,778 2,354 2,230 10,088 21.5%
PL 221-MARIJUANA 179 173 136 103 591 1.3%
PL 225-GAMBLING 2 1 3 3 9 0.0%
PL 265-WEAPONS 693 640 650 632 2,615 5.6%
OTHER PL FELONIES 405 386 370 333 1,494 3.2%
DWI VTL FELONIES 1,120 1,196 1,062 997 4,375 9.3%
OTHER VTL FELONIES 218 199 203 187 807 1.7%
OTHER FELONIES 140 138 127 123 528 1.1%
MISSING 250 236 227 250 963 2.1%
TOTAL 12,627 12,131 11,385 10,705 46,848 100.0%
Source: CCH, Felony Processing File as of 4/23/2013The term felony actions in this table refers to indictments and superior court informations prosecuted in superior court.
New York State
NEW YORK STATE DIVISION OF CRIMINAL JUSTICE SERVICESFELONY ACTIONS BY CHARGE
Quarter 1 2012 through Quarter 4 2012TABLE 2
NYS Division of Criminal Justice Services 6 May 2013
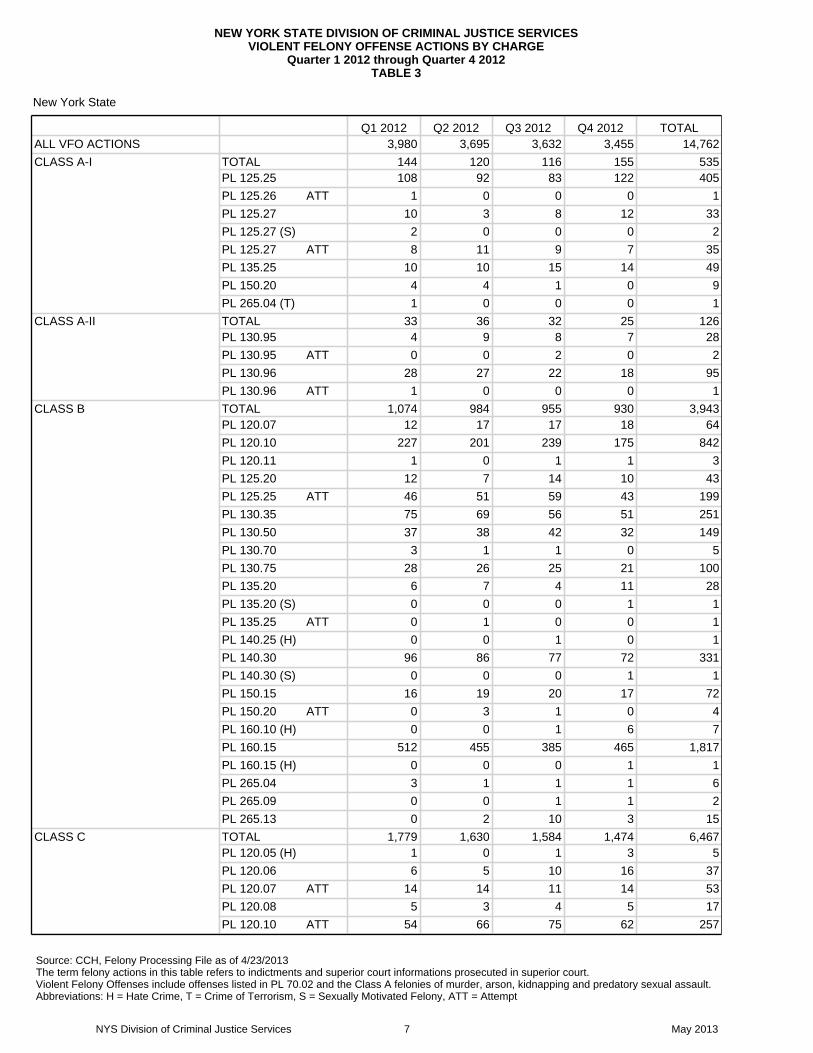
Q1 2012 Q2 2012 Q3 2012 Q4 2012 TOTALALL VFO ACTIONS 3,980 3,695 3,632 3,455 14,762
CLASS A-I TOTAL 144 120 116 155 535PL 125.25 108 92 83 122 405
PL 125.26 ATT 1 0 0 0 1
PL 125.27 10 3 8 12 33
PL 125.27 (S) 2 0 0 0 2
PL 125.27 ATT 8 11 9 7 35
PL 135.25 10 10 15 14 49
PL 150.20 4 4 1 0 9
PL 265.04 (T) 1 0 0 0 1
CLASS A-II TOTAL 33 36 32 25 126PL 130.95 4 9 8 7 28
PL 130.95 ATT 0 0 2 0 2
PL 130.96 28 27 22 18 95
PL 130.96 ATT 1 0 0 0 1
CLASS B TOTAL 1,074 984 955 930 3,943PL 120.07 12 17 17 18 64
PL 120.10 227 201 239 175 842
PL 120.11 1 0 1 1 3
PL 125.20 12 7 14 10 43
PL 125.25 ATT 46 51 59 43 199
PL 130.35 75 69 56 51 251
PL 130.50 37 38 42 32 149
PL 130.70 3 1 1 0 5
PL 130.75 28 26 25 21 100
PL 135.20 6 7 4 11 28
PL 135.20 (S) 0 0 0 1 1
PL 135.25 ATT 0 1 0 0 1
PL 140.25 (H) 0 0 1 0 1
PL 140.30 96 86 77 72 331
PL 140.30 (S) 0 0 0 1 1
PL 150.15 16 19 20 17 72
PL 150.20 ATT 0 3 1 0 4
PL 160.10 (H) 0 0 1 6 7
PL 160.15 512 455 385 465 1,817
PL 160.15 (H) 0 0 0 1 1
PL 265.04 3 1 1 1 6
PL 265.09 0 0 1 1 2
PL 265.13 0 2 10 3 15
CLASS C TOTAL 1,779 1,630 1,584 1,474 6,467PL 120.05 (H) 1 0 1 3 5
PL 120.06 6 5 10 16 37
PL 120.07 ATT 14 14 11 14 53
PL 120.08 5 3 4 5 17
PL 120.10 ATT 54 66 75 62 257
Source: CCH, Felony Processing File as of 4/23/2013 The term felony actions in this table refers to indictments and superior court informations prosecuted in superior court. Violent Felony Offenses include offenses listed in PL 70.02 and the Class A felonies of murder, arson, kidnapping and predatory sexual assault. Abbreviations: H = Hate Crime, T = Crime of Terrorism, S = Sexually Motivated Felony, ATT = Attempt
NEW YORK STATE DIVISION OF CRIMINAL JUSTICE SERVICESVIOLENT FELONY OFFENSE ACTIONS BY CHARGE
Quarter 1 2012 through Quarter 4 2012TABLE 3
New York State
NYS Division of Criminal Justice Services 7 May 2013

Q1 2012 Q2 2012 Q3 2012 Q4 2012 TOTALCLASS C PL 120.10 (H) ATT 0 0 1 0 1
PL 120.11 ATT 0 2 1 3 6
PL 120.18 (T) 0 0 0 1 1
PL 121.13 0 1 0 1 2
PL 130.35 ATT 9 7 7 5 28
PL 130.45 (T) 0 1 0 0 1
PL 130.50 ATT 3 5 6 4 18
PL 130.67 1 3 3 2 9
PL 130.75 ATT 0 1 0 0 1
PL 135.20 ATT 0 2 2 0 4
PL 140.25 647 611 553 516 2,327
PL 140.30 ATT 3 3 5 2 13
PL 150.15 ATT 8 1 5 2 16
PL 160.10 524 427 417 380 1,748
PL 160.10 (S) 0 0 1 0 1
PL 160.10 (H) ATT 0 1 1 0 2
PL 160.15 ATT 65 49 57 49 220
PL 265.03 439 427 424 408 1,698
PL 265.12 0 1 0 1 2
CLASS D TOTAL 944 918 937 866 3,665PL 120.02 2 3 1 3 9
PL 120.05 432 423 463 390 1,708
PL 120.05 (S) 1 0 0 0 1
PL 120.06 ATT 3 0 0 0 3
PL 120.08 ATT 1 0 0 0 1
PL 120.18 5 5 4 10 24
PL 120.60 4 1 0 0 5
PL 121.12 46 46 35 21 148
PL 121.12 (S) 0 0 1 0 1
PL 130.30 49 57 44 47 197
PL 130.45 11 16 19 9 55
PL 130.65 57 65 71 69 262
PL 130.66 0 1 0 0 1
PL 130.67 ATT 0 0 1 0 1
PL 130.80 17 16 15 9 57
PL 140.25 ATT 112 94 103 135 444
PL 160.10 ATT 107 107 100 84 398
PL 215.16 2 0 3 1 6
PL 240.60 2 3 3 1 9
PL 240.62 0 2 0 0 2
PL 265.02 16 14 11 19 60
PL 265.03 ATT 63 53 55 49 220
PL 265.11 11 9 7 14 41
PL 265.12 ATT 1 0 0 0 1
PL 490.20 (T) 2 3 1 5 11
Source: CCH, Felony Processing File as of 4/23/2013 The term felony actions in this table refers to indictments and superior court informations prosecuted in superior court. Violent Felony Offenses include offenses listed in PL 70.02 and the Class A felonies of murder, arson, kidnapping and predatory sexual assault. Abbreviations: H = Hate Crime, T = Crime of Terrorism, S = Sexually Motivated Felony, ATT = Attempt
NEW YORK STATE DIVISION OF CRIMINAL JUSTICE SERVICESVIOLENT FELONY OFFENSE ACTIONS BY CHARGE
Quarter 1 2012 through Quarter 4 2012TABLE 3
New York State
NYS Division of Criminal Justice Services 8 May 2013

Q1 2012 Q2 2012 Q3 2012 Q4 2012 TOTALCLASS E TOTAL 6 7 8 5 26
PL 130.53 1 1 3 1 6
PL 130.65-A 0 0 1 1 2
PL 240.55 2 3 4 2 11
PL 240.61 3 1 0 0 4
PL 265.02 ATT 0 2 0 1 3
Source: CCH, Felony Processing File as of 4/23/2013 The term felony actions in this table refers to indictments and superior court informations prosecuted in superior court. Violent Felony Offenses include offenses listed in PL 70.02 and the Class A felonies of murder, arson, kidnapping and predatory sexual assault. Abbreviations: H = Hate Crime, T = Crime of Terrorism, S = Sexually Motivated Felony, ATT = Attempt
NEW YORK STATE DIVISION OF CRIMINAL JUSTICE SERVICESVIOLENT FELONY OFFENSE ACTIONS BY CHARGE
Quarter 1 2012 through Quarter 4 2012TABLE 3
New York State
NYS Division of Criminal Justice Services 9 May 2013
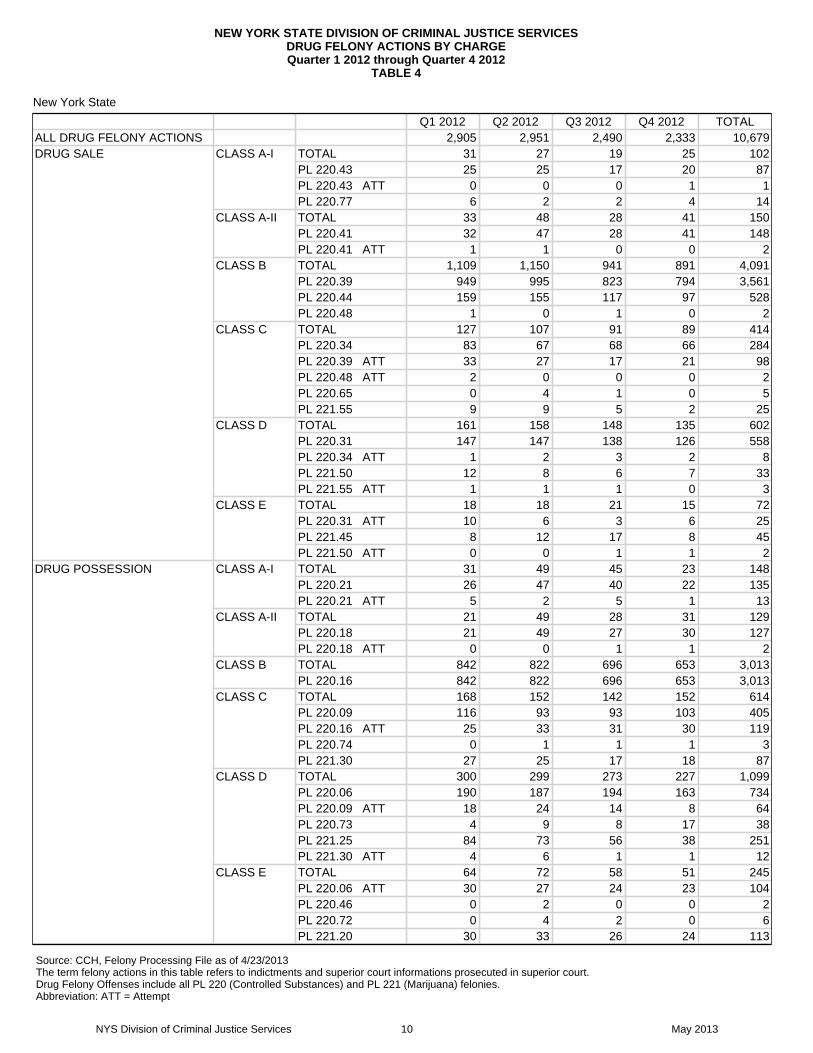
Q1 2012 Q2 2012 Q3 2012 Q4 2012 TOTALALL DRUG FELONY ACTIONS 2,905 2,951 2,490 2,333 10,679DRUG SALE CLASS A-I TOTAL 31 27 19 25 102
PL 220.43 25 25 17 20 87PL 220.43 ATT 0 0 0 1 1PL 220.77 6 2 2 4 14
CLASS A-II TOTAL 33 48 28 41 150PL 220.41 32 47 28 41 148PL 220.41 ATT 1 1 0 0 2
CLASS B TOTAL 1,109 1,150 941 891 4,091PL 220.39 949 995 823 794 3,561PL 220.44 159 155 117 97 528PL 220.48 1 0 1 0 2
CLASS C TOTAL 127 107 91 89 414PL 220.34 83 67 68 66 284PL 220.39 ATT 33 27 17 21 98PL 220.48 ATT 2 0 0 0 2PL 220.65 0 4 1 0 5PL 221.55 9 9 5 2 25
CLASS D TOTAL 161 158 148 135 602PL 220.31 147 147 138 126 558PL 220.34 ATT 1 2 3 2 8PL 221.50 12 8 6 7 33PL 221.55 ATT 1 1 1 0 3
CLASS E TOTAL 18 18 21 15 72PL 220.31 ATT 10 6 3 6 25PL 221.45 8 12 17 8 45PL 221.50 ATT 0 0 1 1 2
DRUG POSSESSION CLASS A-I TOTAL 31 49 45 23 148PL 220.21 26 47 40 22 135PL 220.21 ATT 5 2 5 1 13
CLASS A-II TOTAL 21 49 28 31 129PL 220.18 21 49 27 30 127PL 220.18 ATT 0 0 1 1 2
CLASS B TOTAL 842 822 696 653 3,013PL 220.16 842 822 696 653 3,013
CLASS C TOTAL 168 152 142 152 614PL 220.09 116 93 93 103 405PL 220.16 ATT 25 33 31 30 119PL 220.74 0 1 1 1 3PL 221.30 27 25 17 18 87
CLASS D TOTAL 300 299 273 227 1,099PL 220.06 190 187 194 163 734PL 220.09 ATT 18 24 14 8 64PL 220.73 4 9 8 17 38PL 221.25 84 73 56 38 251PL 221.30 ATT 4 6 1 1 12
CLASS E TOTAL 64 72 58 51 245PL 220.06 ATT 30 27 24 23 104PL 220.46 0 2 0 0 2PL 220.72 0 4 2 0 6PL 221.20 30 33 26 24 113
Source: CCH, Felony Processing File as of 4/23/2013 The term felony actions in this table refers to indictments and superior court informations prosecuted in superior court. Drug Felony Offenses include all PL 220 (Controlled Substances) and PL 221 (Marijuana) felonies. Abbreviation: ATT = Attempt
NEW YORK STATE DIVISION OF CRIMINAL JUSTICE SERVICESDRUG FELONY ACTIONS BY CHARGEQuarter 1 2012 through Quarter 4 2012
TABLE 4
New York State
NYS Division of Criminal Justice Services 10 May 2013

Q1 2012 Q2 2012 Q3 2012 Q4 2012 TOTALALL DRUG FELONY ACTIONS 2,905 2,951 2,490 2,333 10,679DRUG POSSESSION CLASS E PL 221.25 ATT 4 6 6 4 20
Source: CCH, Felony Processing File as of 4/23/2013 The term felony actions in this table refers to indictments and superior court informations prosecuted in superior court. Drug Felony Offenses include all PL 220 (Controlled Substances) and PL 221 (Marijuana) felonies. Abbreviation: ATT = Attempt
NEW YORK STATE DIVISION OF CRIMINAL JUSTICE SERVICESDRUG FELONY ACTIONS BY CHARGEQuarter 1 2012 through Quarter 4 2012
TABLE 4
New York State
NYS Division of Criminal Justice Services 11 May 2013
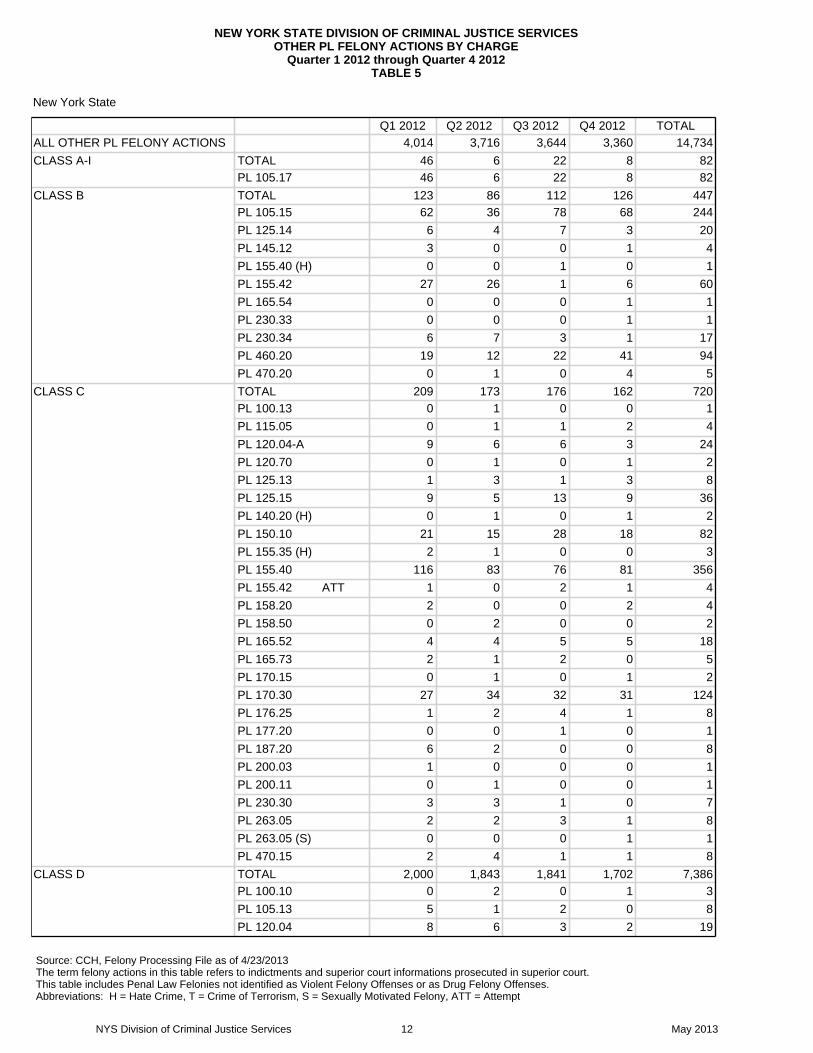
Q1 2012 Q2 2012 Q3 2012 Q4 2012 TOTALALL OTHER PL FELONY ACTIONS 4,014 3,716 3,644 3,360 14,734
CLASS A-I TOTAL 46 6 22 8 82PL 105.17 46 6 22 8 82
CLASS B TOTAL 123 86 112 126 447PL 105.15 62 36 78 68 244
PL 125.14 6 4 7 3 20
PL 145.12 3 0 0 1 4
PL 155.40 (H) 0 0 1 0 1
PL 155.42 27 26 1 6 60
PL 165.54 0 0 0 1 1
PL 230.33 0 0 0 1 1
PL 230.34 6 7 3 1 17
PL 460.20 19 12 22 41 94
PL 470.20 0 1 0 4 5
CLASS C TOTAL 209 173 176 162 720PL 100.13 0 1 0 0 1
PL 115.05 0 1 1 2 4
PL 120.04-A 9 6 6 3 24
PL 120.70 0 1 0 1 2
PL 125.13 1 3 1 3 8
PL 125.15 9 5 13 9 36
PL 140.20 (H) 0 1 0 1 2
PL 150.10 21 15 28 18 82
PL 155.35 (H) 2 1 0 0 3
PL 155.40 116 83 76 81 356
PL 155.42 ATT 1 0 2 1 4
PL 158.20 2 0 0 2 4
PL 158.50 0 2 0 0 2
PL 165.52 4 4 5 5 18
PL 165.73 2 1 2 0 5
PL 170.15 0 1 0 1 2
PL 170.30 27 34 32 31 124
PL 176.25 1 2 4 1 8
PL 177.20 0 0 1 0 1
PL 187.20 6 2 0 0 8
PL 200.03 1 0 0 0 1
PL 200.11 0 1 0 0 1
PL 230.30 3 3 1 0 7
PL 263.05 2 2 3 1 8
PL 263.05 (S) 0 0 0 1 1
PL 470.15 2 4 1 1 8
CLASS D TOTAL 2,000 1,843 1,841 1,702 7,386PL 100.10 0 2 0 1 3
PL 105.13 5 1 2 0 8
PL 120.04 8 6 3 2 19
Source: CCH, Felony Processing File as of 4/23/2013 The term felony actions in this table refers to indictments and superior court informations prosecuted in superior court. This table includes Penal Law Felonies not identified as Violent Felony Offenses or as Drug Felony Offenses. Abbreviations: H = Hate Crime, T = Crime of Terrorism, S = Sexually Motivated Felony, ATT = Attempt
NEW YORK STATE DIVISION OF CRIMINAL JUSTICE SERVICESOTHER PL FELONY ACTIONS BY CHARGE
Quarter 1 2012 through Quarter 4 2012TABLE 5
New York State
NYS Division of Criminal Justice Services 12 May 2013

Q1 2012 Q2 2012 Q3 2012 Q4 2012 TOTALCLASS D PL 120.05 (H) ATT 2 0 0 0 2
PL 120.25 42 47 57 43 189
PL 120.60 0 0 0 1 1
PL 120.70 0 1 0 0 1
PL 120.70 ATT 0 0 0 1 1
PL 125.12 10 9 5 3 27
PL 130.30 3 1 0 1 5
PL 130.45 0 1 0 0 1
PL 135.35 0 0 1 1 2
PL 135.65 5 5 3 6 19
PL 140.17 0 0 1 0 1
PL 140.20 603 548 502 570 2,223
PL 140.20 (S) 2 0 0 0 2
PL 140.20 (H) ATT 0 0 1 0 1
PL 145.10 56 57 48 54 215
PL 145.20 3 0 2 3 8
PL 150.10 ATT 1 4 8 3 16
PL 155.35 336 342 309 294 1,281
PL 155.40 ATT 1 1 5 1 8
PL 158.15 17 20 21 20 78
PL 160.05 226 185 222 153 786
PL 160.05 (S) 1 0 0 0 1
PL 165.08 0 0 2 0 2
PL 165.50 58 43 48 32 181
PL 170.10 69 60 62 41 232
PL 170.25 178 195 178 160 711
PL 170.30 ATT 2 2 1 0 5
PL 170.40 10 12 5 2 29
PL 175.25 5 0 8 1 14
PL 176.20 6 6 16 11 39
PL 178.20 0 0 1 0 1
PL 190.80 33 22 34 34 123
PL 190.80-A 15 13 23 9 60
PL 200.00 8 8 1 1 18
PL 200.10 2 0 0 1 3
PL 205.15 1 1 2 2 6
PL 205.25 56 53 61 50 220
PL 205.65 1 2 0 6 9
PL 210.15 10 10 5 3 28
PL 215.00 3 4 1 3 11
PL 215.05 0 0 0 1 1
PL 215.52 25 28 29 33 115
PL 215.57 18 9 17 11 55
PL 230.25 10 9 3 3 25
PL 230.30 ATT 0 1 0 0 1
PL 235.22 0 2 8 5 15
Source: CCH, Felony Processing File as of 4/23/2013 The term felony actions in this table refers to indictments and superior court informations prosecuted in superior court. This table includes Penal Law Felonies not identified as Violent Felony Offenses or as Drug Felony Offenses. Abbreviations: H = Hate Crime, T = Crime of Terrorism, S = Sexually Motivated Felony, ATT = Attempt
NEW YORK STATE DIVISION OF CRIMINAL JUSTICE SERVICESOTHER PL FELONY ACTIONS BY CHARGE
Quarter 1 2012 through Quarter 4 2012TABLE 5
New York State
NYS Division of Criminal Justice Services 13 May 2013
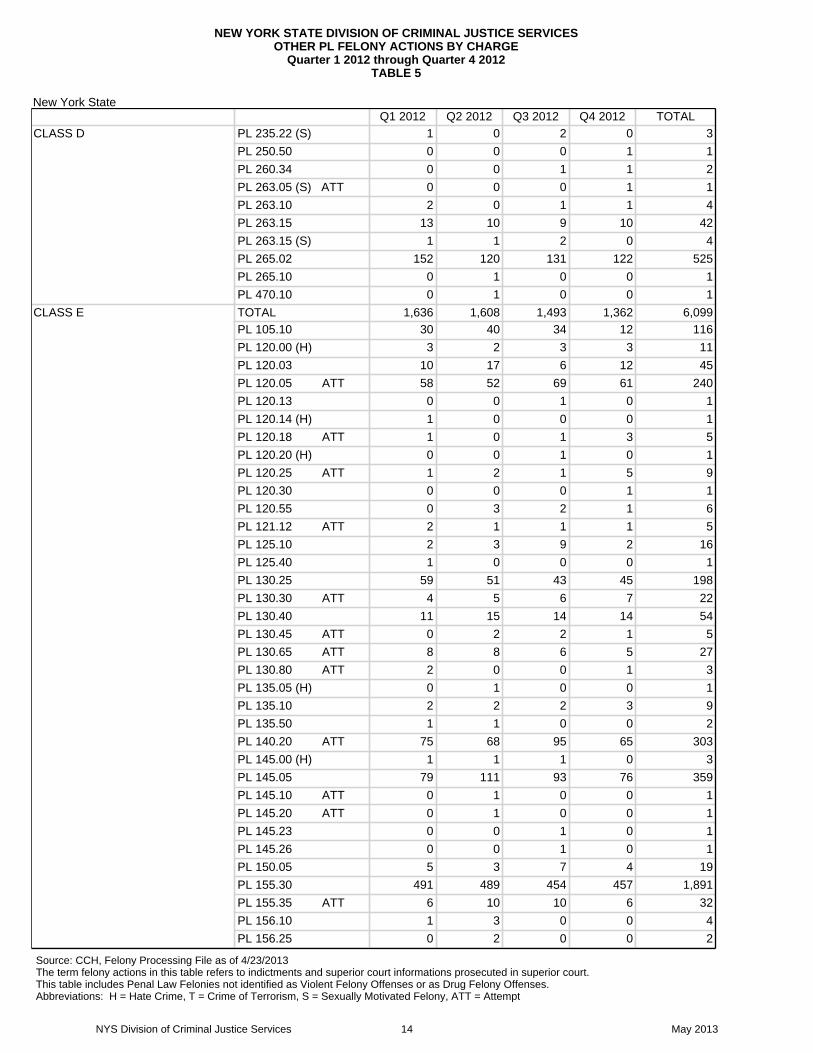
Q1 2012 Q2 2012 Q3 2012 Q4 2012 TOTALCLASS D PL 235.22 (S) 1 0 2 0 3
PL 250.50 0 0 0 1 1
PL 260.34 0 0 1 1 2
PL 263.05 (S) ATT 0 0 0 1 1
PL 263.10 2 0 1 1 4
PL 263.15 13 10 9 10 42
PL 263.15 (S) 1 1 2 0 4
PL 265.02 152 120 131 122 525
PL 265.10 0 1 0 0 1
PL 470.10 0 1 0 0 1
CLASS E TOTAL 1,636 1,608 1,493 1,362 6,099PL 105.10 30 40 34 12 116
PL 120.00 (H) 3 2 3 3 11
PL 120.03 10 17 6 12 45
PL 120.05 ATT 58 52 69 61 240
PL 120.13 0 0 1 0 1
PL 120.14 (H) 1 0 0 0 1
PL 120.18 ATT 1 0 1 3 5
PL 120.20 (H) 0 0 1 0 1
PL 120.25 ATT 1 2 1 5 9
PL 120.30 0 0 0 1 1
PL 120.55 0 3 2 1 6
PL 121.12 ATT 2 1 1 1 5
PL 125.10 2 3 9 2 16
PL 125.40 1 0 0 0 1
PL 130.25 59 51 43 45 198
PL 130.30 ATT 4 5 6 7 22
PL 130.40 11 15 14 14 54
PL 130.45 ATT 0 2 2 1 5
PL 130.65 ATT 8 8 6 5 27
PL 130.80 ATT 2 0 0 1 3
PL 135.05 (H) 0 1 0 0 1
PL 135.10 2 2 2 3 9
PL 135.50 1 1 0 0 2
PL 140.20 ATT 75 68 95 65 303
PL 145.00 (H) 1 1 1 0 3
PL 145.05 79 111 93 76 359
PL 145.10 ATT 0 1 0 0 1
PL 145.20 ATT 0 1 0 0 1
PL 145.23 0 0 1 0 1
PL 145.26 0 0 1 0 1
PL 150.05 5 3 7 4 19
PL 155.30 491 489 454 457 1,891
PL 155.35 ATT 6 10 10 6 32
PL 156.10 1 3 0 0 4
PL 156.25 0 2 0 0 2
Source: CCH, Felony Processing File as of 4/23/2013 The term felony actions in this table refers to indictments and superior court informations prosecuted in superior court. This table includes Penal Law Felonies not identified as Violent Felony Offenses or as Drug Felony Offenses. Abbreviations: H = Hate Crime, T = Crime of Terrorism, S = Sexually Motivated Felony, ATT = Attempt
NEW YORK STATE DIVISION OF CRIMINAL JUSTICE SERVICESOTHER PL FELONY ACTIONS BY CHARGE
Quarter 1 2012 through Quarter 4 2012TABLE 5
New York State
NYS Division of Criminal Justice Services 14 May 2013

Q1 2012 Q2 2012 Q3 2012 Q4 2012 TOTALCLASS E PL 156.30 0 0 1 0 1
PL 158.10 9 11 8 11 39
PL 160.05 ATT 78 62 48 48 236
PL 165.06 3 2 3 3 11
PL 165.10 13 8 9 10 40
PL 165.45 136 141 114 116 507
PL 165.50 ATT 4 1 0 0 5
PL 165.72 4 1 3 4 12
PL 170.10 ATT 1 4 5 4 14
PL 170.25 ATT 16 18 16 25 75
PL 170.70 4 3 2 6 15
PL 175.10 23 17 14 14 68
PL 175.35 61 55 33 29 178
PL 175.40 1 0 0 0 1
PL 176.15 3 1 4 4 12
PL 177.10 0 0 1 0 1
PL 190.26 3 1 2 1 7
PL 190.40 1 0 1 2 4
PL 190.65 15 14 11 10 50
PL 190.79 16 19 17 18 70
PL 190.80-A ATT 0 1 0 1 2
PL 190.86 0 1 0 0 1
PL 200.00 ATT 1 0 0 0 1
PL 200.25 1 0 2 0 3
PL 205.10 2 3 3 0 8
PL 205.15 ATT 0 1 0 0 1
PL 205.17 2 0 0 0 2
PL 205.25 ATT 13 3 3 3 22
PL 205.60 0 1 3 2 6
PL 210.10 3 3 1 0 7
PL 215.00 ATT 1 1 0 1 3
PL 215.11 0 2 6 6 14
PL 215.15 7 11 10 4 32
PL 215.16 ATT 1 0 0 0 1
PL 215.40 16 15 15 10 56
PL 215.51 225 203 188 139 755
PL 215.52 ATT 0 1 0 0 1
PL 215.56 52 35 32 34 153
PL 225.10 2 1 2 3 8
PL 225.20 0 0 1 0 1
PL 230.25 ATT 3 0 1 1 5
PL 235.21 0 2 2 3 7
PL 235.22 ATT 7 6 12 2 27
PL 240.30 (H) 1 0 0 0 1
PL 240.31 3 1 1 0 5
PL 240.32 7 8 3 4 22
Source: CCH, Felony Processing File as of 4/23/2013 The term felony actions in this table refers to indictments and superior court informations prosecuted in superior court. This table includes Penal Law Felonies not identified as Violent Felony Offenses or as Drug Felony Offenses. Abbreviations: H = Hate Crime, T = Crime of Terrorism, S = Sexually Motivated Felony, ATT = Attempt
NEW YORK STATE DIVISION OF CRIMINAL JUSTICE SERVICESOTHER PL FELONY ACTIONS BY CHARGE
Quarter 1 2012 through Quarter 4 2012TABLE 5
New York State
NYS Division of Criminal Justice Services 15 May 2013

Q1 2012 Q2 2012 Q3 2012 Q4 2012 TOTALCLASS E PL 240.46 1 6 1 2 10
PL 240.60 ATT 0 1 0 0 1
PL 250.05 2 0 1 0 3
PL 250.45 11 16 16 14 57
PL 250.60 1 0 0 0 1
PL 255.25 2 3 0 2 7
PL 260.00 0 0 0 1 1
PL 260.32 1 0 1 3 5
PL 263.11 2 5 2 4 13
PL 263.15 ATT 0 3 0 0 3
PL 263.16 14 11 20 18 63
PL 265.02 ATT 6 10 10 13 39
PL 265.11 ATT 1 0 0 0 1
PL 270.30 1 0 0 1 2
PL 275.40 2 2 2 1 7
Source: CCH, Felony Processing File as of 4/23/2013 The term felony actions in this table refers to indictments and superior court informations prosecuted in superior court. This table includes Penal Law Felonies not identified as Violent Felony Offenses or as Drug Felony Offenses. Abbreviations: H = Hate Crime, T = Crime of Terrorism, S = Sexually Motivated Felony, ATT = Attempt
NEW YORK STATE DIVISION OF CRIMINAL JUSTICE SERVICESOTHER PL FELONY ACTIONS BY CHARGE
Quarter 1 2012 through Quarter 4 2012TABLE 5
New York State
NYS Division of Criminal Justice Services 16 May 2013

Q1 2012 Q2 2012 Q3 2012 Q4 2012 TOTAL
ALL SEX OFFENSE FELONY ACTIONS 419 427 403 354 1,603
CLASS A-I TOTAL 2 0 0 0 2
PL 125.27 (S) 2 0 0 0 2
CLASS A-II TOTAL 33 36 32 25 126
PL 130.95 4 9 8 7 28
PL 130.95 ATT 0 0 2 0 2
PL 130.96 28 27 22 18 95
PL 130.96 ATT 1 0 0 0 1
CLASS B TOTAL 143 134 124 106 507
PL 130.35 75 69 56 51 251
PL 130.50 37 38 42 32 149
PL 130.70 3 1 1 0 5
PL 130.75 28 26 25 21 100
PL 135.20 (S) 0 0 0 1 1
PL 140.30 (S) 0 0 0 1 1
CLASS C TOTAL 13 17 17 12 59
PL 130.35 ATT 9 7 7 5 28
PL 130.45 (T) 0 1 0 0 1
PL 130.50 ATT 3 5 6 4 18
PL 130.67 1 3 3 2 9
PL 130.75 ATT 0 1 0 0 1
PL 160.10 (S) 0 0 1 0 1
PL 263.05 (S) 0 0 0 1 1
CLASS D TOTAL 143 158 155 136 592
PL 120.05 (S) 1 0 0 0 1
PL 121.12 (S) 0 0 1 0 1
PL 130.30 52 58 44 48 202
PL 130.45 11 17 19 9 56
PL 130.65 57 65 71 69 262
PL 130.66 0 1 0 0 1
PL 130.67 ATT 0 0 1 0 1
PL 130.80 17 16 15 9 57
PL 140.20 (S) 2 0 0 0 2
PL 160.05 (S) 1 0 0 0 1
PL 235.22 (S) 1 0 2 0 3
PL 263.05 (S) ATT 0 0 0 1 1
PL 263.15 (S) 1 1 2 0 4
CLASS E TOTAL 85 82 75 75 317
PL 130.25 59 51 43 45 198
PL 130.30 ATT 4 5 6 7 22
PL 130.40 11 15 14 14 54
PL 130.45 ATT 0 2 2 1 5
PL 130.53 1 1 3 1 6
PL 130.65 ATT 8 8 6 5 27
Source: CCH, Felony Processing File as of 4/23/2013 The term felony actions in this table refers to indictments and superior court informations prosecuted in superior court. Felony Sex Offenses include offenses listed in PL 70.80. Abbreviations: H = Hate Crime, T = Crime of Terrorism, S = Sexually Motivated Felony, ATT = Attempt
NEW YORK STATE DIVISION OF CRIMINAL JUSTICE SERVICESSEX OFFENSE FELONY ACTIONS BY CHARGE
Quarter 1 2012 through Quarter 4 2012TABLE 6
New York State
NYS Division of Criminal Justice Services 17 May 2013
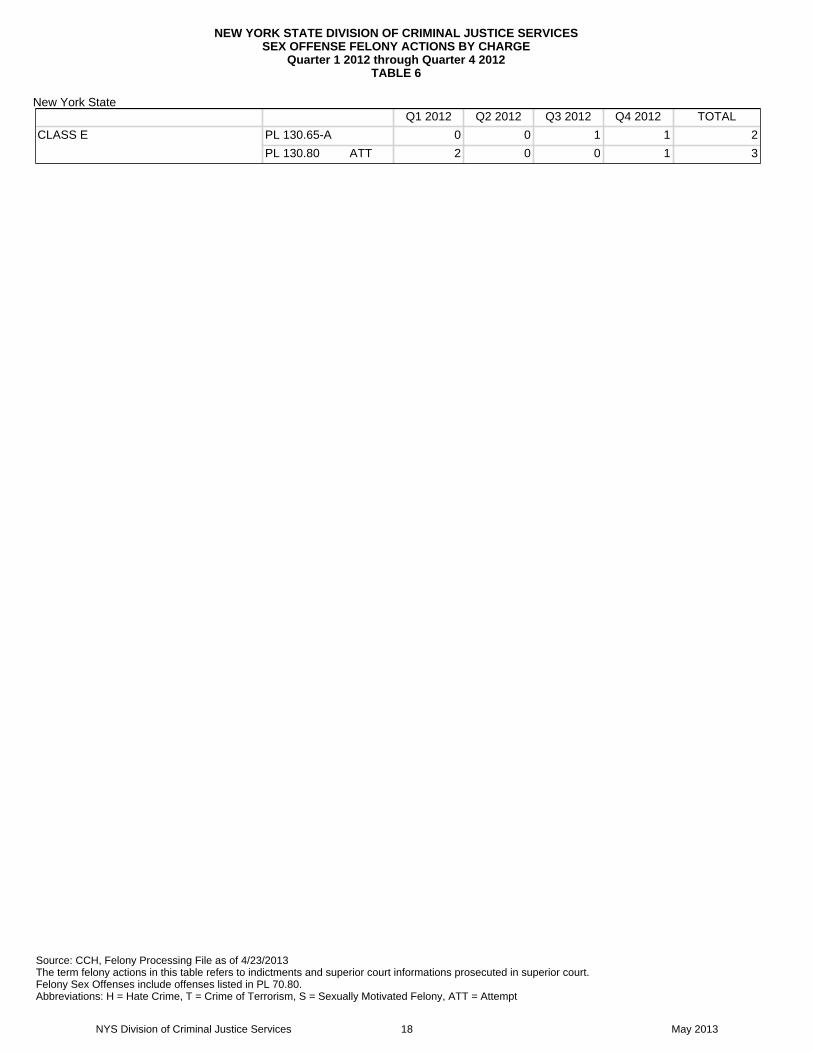
Q1 2012 Q2 2012 Q3 2012 Q4 2012 TOTAL
CLASS E PL 130.65-A 0 0 1 1 2
PL 130.80 ATT 2 0 0 1 3
Source: CCH, Felony Processing File as of 4/23/2013 The term felony actions in this table refers to indictments and superior court informations prosecuted in superior court. Felony Sex Offenses include offenses listed in PL 70.80. Abbreviations: H = Hate Crime, T = Crime of Terrorism, S = Sexually Motivated Felony, ATT = Attempt
NEW YORK STATE DIVISION OF CRIMINAL JUSTICE SERVICESSEX OFFENSE FELONY ACTIONS BY CHARGE
Quarter 1 2012 through Quarter 4 2012TABLE 6
New York State
NYS Division of Criminal Justice Services 18 May 2013
Q1 2012 Q2 2012 Q3 2012 Q4 2012 TOTAL
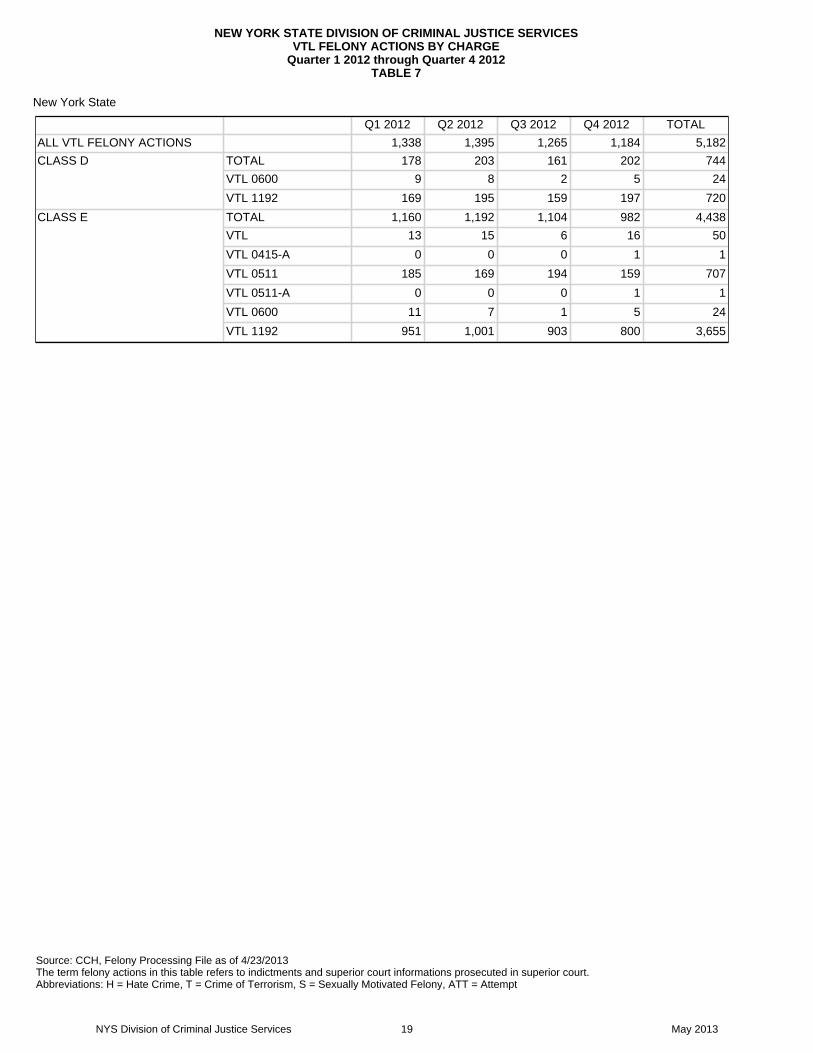
ALL VTL FELONY ACTIONS 1,338 1,395 1,265 1,184 5,182
CLASS D TOTAL 178 203 161 202 744
VTL 0600 9 8 2 5 24
VTL 1192 169 195 159 197 720
CLASS E TOTAL 1,160 1,192 1,104 982 4,438
VTL 13 15 6 16 50
VTL 0415-A 0 0 0 1 1
VTL 0511 185 169 194 159 707
VTL 0511-A 0 0 0 1 1
VTL 0600 11 7 1 5 24
VTL 1192 951 1,001 903 800 3,655
Source: CCH, Felony Processing File as of 4/23/2013 The term felony actions in this table refers to indictments and superior court informations prosecuted in superior court. Abbreviations: H = Hate Crime, T = Crime of Terrorism, S = Sexually Motivated Felony, ATT = Attempt
NEW YORK STATE DIVISION OF CRIMINAL JUSTICE SERVICESVTL FELONY ACTIONS BY CHARGE
Quarter 1 2012 through Quarter 4 2012TABLE 7
New York State
NYS Division of Criminal Justice Services 19 May 2013

Indictments Informations Unknown Total
ALL FELONY ACTIONS TOTAL 30,574 15,369 1,282 47,225 100.0%
Convicted - Plea 22,887 13,000 712 36,599 77.5%
Convicted - Verdict 1,414 9 16 1,439 3.0%
Adjudicated - Youthful Offender 2,078 1,532 55 3,665 7.8%
Covered by, Consolidated, Superseded 1,157 431 287 1,875 4.0%
Diverted and Dismissed 119 311 3 433 0.9%
Dismissed 2,200 57 186 2,443 5.2%
Acquitted 558 11 5 574 1.2%
Other 161 18 18 197 0.4%
VFO ACTIONS TOTAL 11,948 2,981 274 15,203 100.0%
Convicted - Plea 7,626 2,126 103 9,855 64.8%
Convicted - Verdict 907 7 10 924 6.1%
Adjudicated - Youthful Offender 1,521 721 13 2,255 14.8%
Covered by, Consolidated, Superseded 457 114 80 651 4.3%
Diverted and Dismissed 18 1 0 19 0.1%
Dismissed 964 6 59 1,029 6.8%
Acquitted 382 4 3 389 2.6%
Other 73 2 6 81 0.5%
DRUG FELONY ACTIONS TOTAL 7,611 3,082 178 10,871 100.0%
Convicted - Plea 6,328 2,704 83 9,115 83.8%
Convicted - Verdict 122 0 0 122 1.1%
Adjudicated - Youthful Offender 144 89 10 243 2.2%
Covered by, Consolidated, Superseded 225 22 38 285 2.6%
Diverted and Dismissed 84 249 1 334 3.1%
Dismissed 613 15 41 669 6.2%
Acquitted 66 0 0 66 0.6%
Other 29 3 5 37 0.3%
OTHER FELONY ACTIONS TOTAL 10,755 8,882 621 20,258 100.0%
Convicted - Plea 8,789 7,812 396 16,997 83.9%
Convicted - Verdict 375 2 6 383 1.9%
Adjudicated - Youthful Offender 403 663 30 1,096 5.4%
Covered by, Consolidated, Superseded 444 292 136 872 4.3%
Diverted and Dismissed 17 60 1 78 0.4%
Dismissed 570 35 48 653 3.2%
Acquitted 103 7 1 111 0.5%
Other 54 11 3 68 0.3%
UNKNOWN TOTAL 260 424 209 893 100.0%
Convicted - Plea 144 358 130 632 70.8%
Convicted - Verdict 10 0 0 10 1.1%
Adjudicated - Youthful Offender 10 59 2 71 8.0%
Covered by, Consolidated, Superseded 31 3 33 67 7.5%
Diverted and Dismissed 0 1 1 2 0.2%
Dismissed 53 1 38 92 10.3%
Acquitted 7 0 1 8 0.9%
Other 5 2 4 11 1.2%
Source: CCH, Felony Processing File as of 4/23/2013This table does not include cases where the defendant has been convicted, but not yet sentenced.Diverted and dismissed dispositions began in 2006 and not all are reported to DCJS.This table includes convictions to felonies, misdemeanors, and non-criminal offenses such as violations and infractions.
New York State
NEW YORK STATE DIVISION OF CRIMINAL JUSTICE SERVICESDISPOSITION OF FELONY INDICTMENTS AND SCIs
January 2012 through December 2012TABLE 8
NYS Division of Criminal Justice Services 20 May 2013

Total Disposed
ConvictedGuilty Plea
ConvictedGuilty Verdict
AdjudicatedY. O.
Covered by, Consolidated, Superseded
Diverted and Dismissed Dismissed Acquitted Other
PL 105-CONSPIRACY 403 308 4 6 10 0 67 4 4
PL 120-ASSAULT 3,581 2,637 202 263 84 7 229 136 23
PL 125.27-MURDER 1 58 32 19 0 4 0 3 0 0
PL 125-HOMICIDE 878 500 198 31 32 0 53 61 3
PL 130-SEX OFF 1,663 1,210 122 87 73 0 107 48 16
PL 135-KIDNAPPING 122 86 7 3 7 1 13 5 0
PL 140-BURGLARY 5,482 4,016 152 726 397 20 122 30 19
PL 145-MISCHIEF 582 399 8 91 61 0 17 4 2
PL 150-ARSON 202 149 9 18 6 0 8 10 2
PL 155-LARCENY 3,693 3,061 68 223 146 33 139 10 13
PL 160-ROBBERY 5,451 3,174 178 1,515 171 11 304 86 12
PL 165-OTHER THEFT 795 592 8 82 70 6 32 4 1
PL 170-FORGERY 1,146 956 8 28 79 14 51 4 6
PL 200-BRIBERY 34 29 0 0 1 0 2 1 1
PL 205-ESCAPE 284 237 6 3 14 0 21 2 1
PL 215-JUDICIAL 1,196 983 19 20 106 1 55 10 2
PL 220-CONT SUBS 10,261 8,602 113 232 262 325 626 65 36
PL 221-MARIJUANA 610 513 9 11 23 9 43 1 1
PL 225-GAMBLING 10 8 1 0 0 0 0 0 1
PL 265-WEAPONS 2,782 1,986 114 196 105 4 304 54 19
OTHER PL FELONIES 1,562 1,323 30 49 54 0 87 14 5
DWI VTL FELONIES 4,236 3,969 144 4 55 0 33 14 17
OTHER VTL FELONIES 754 694 5 4 34 0 13 2 2
OTHER FELONIES 547 503 5 2 14 0 22 1 0
MISSING 893 632 10 71 67 2 92 8 11
TOTAL 47,225 36,599 1,439 3,665 1,875 433 2,443 574 197
Source: CCH, Felony Processing File as of 4/23/2013This table does not include cases where the defendant has been convicted, but not yet sentenced.Diverted and dismissed dispositions began in 2006 and not all are reported to DCJS.This table includes convictions to felonies, misdemeanors, and non-criminal offenses such as violations and infractions.
NEW YORK STATE DIVISION OF CRIMINAL JUSTICE SERVICESDISPOSITIONS OF FELONY ACTIONSJanuary 2012 through December 2012
TABLE 9
New York State
NYS Division of Criminal Justice Services 21 May 2013

TOP ARRAIGNMENT CHARGE
TOP CONVICTION CHARGE Class A Class B Class C Class D Class E TOTALS
CLASS A FELONY 374 33.7% 45 0.4% 1 0.0% 2 0.0% 0 0.0% 422 1.0%
CLASS B FELONY 530 47.7% 4,375 43.1% 57 0.8% 57 0.5% 13 0.1% 5,032 12.3%
CLASS C FELONY 89 8.0% 1,709 16.9% 3,312 44.7% 74 0.6% 20 0.2% 5,204 12.7%
CLASS D FELONY 54 4.9% 1,742 17.2% 2,428 32.8% 7,669 62.9% 95 0.9% 11,988 29.2%
CLASS E FELONY 20 1.8% 378 3.7% 382 5.2% 1,970 16.2% 7,864 77.6% 10,614 25.9%
MISDEMEANORS 38 3.4% 1,765 17.4% 1,104 14.9% 2,187 17.9% 1,950 19.2% 7,044 17.2%
NON-CRIMINAL OFFENSES 6 0.5% 128 1.3% 126 1.7% 228 1.9% 198 2.0% 686 1.7%
TOTAL 1,111 100.0% 10,142 100.0% 7,410 100.0% 12,187 100.0% 10,140 100.0% 40,990 100.0%
SAME OFFENSE 250 22.5% 3,712 36.6% 3,028 40.9% 7,093 58.2% 7,028 69.3% 21,111 51.5%
SAME ARTICLE 706 63.5% 5,134 50.6% 3,348 45.2% 3,332 27.3% 2,269 22.4% 14,789 36.1%
DIFFERENT ARTICLE 155 14.0% 1,296 12.8% 1,034 14.0% 1,762 14.5% 843 8.3% 5,090 12.4%
TOTAL 1,111 100.0% 10,142 100.0% 7,410 100.0% 12,187 100.0% 10,140 100.0% 40,990 100.0%
Source: CCH, Felony Processing File as of 4/23/2013This table does not include cases where the defendant has been convicted, but not yet sentenced.The term felony actions in this table refers to indictments and superior court informations prosecuted in superior court.This table includes convictions to felonies, misdemeanors, and non-criminal offenses such as violations and infractions.
NEW YORK STATE DIVISION OF CRIMINAL JUSTICE SERVICESTOP SUPERIOR COURT ARRAIGNMENT CHARGE VS TOP CONVICTION CHARGE
(INCLUDES YOUTHFUL OFFENDER ADJUDICATIONS)ALL FELONY ACTIONS
January 2012 through December 2012TABLE 10
New York State
NYS Division of Criminal Justice Services 22 May 2013

TOP ARRAIGNMENT CHARGE
TOP CONVICTION CHARGE Class A Class B Class C Class D Class E TOTALS
CLASS A FELONY 190 33.4% 6 0.2% 1 0.0% 2 0.1% 0 0.0% 199 1.5%
CLASS B FELONY 279 49.0% 1,340 39.0% 41 0.7% 25 0.8% 0 0.0% 1,685 12.9%
CLASS C FELONY 54 9.5% 573 16.7% 2,325 40.8% 19 0.6% 0 0.0% 2,971 22.8%
CLASS D FELONY 28 4.9% 964 28.0% 2,176 38.2% 1,977 59.8% 0 0.0% 5,145 39.5%
CLASS E FELONY 11 1.9% 207 6.0% 261 4.6% 550 16.6% 15 75.0% 1,044 8.0%
MISDEMEANORS 7 1.2% 310 9.0% 792 13.9% 647 19.6% 4 20.0% 1,760 13.5%
NON-CRIMINAL OFFENSES 0 0.0% 40 1.2% 102 1.8% 87 2.6% 1 5.0% 230 1.8%
TOTAL 569 100.0% 3,440 100.0% 5,698 100.0% 3,307 100.0% 20 100.0% 13,034 100.0%
SAME OFFENSE 160 28.1% 1,104 32.1% 2,064 36.2% 1,832 55.4% 15 75.0% 5,175 39.7%
SAME ARTICLE 307 54.0% 1,533 44.6% 2,781 48.8% 975 29.5% 5 25.0% 5,601 43.0%
DIFFERENT ARTICLE 102 17.9% 803 23.3% 853 15.0% 500 15.1% 0 0.0% 2,258 17.3%
TOTAL 569 100.0% 3,440 100.0% 5,698 100.0% 3,307 100.0% 20 100.0% 13,034 100.0%
Source: CCH, Felony Processing File as of 4/23/2013This table does not include cases where the defendant has been convicted, but not yet sentenced.The term felony actions in this table refers to indictments and superior court informations prosecuted in superior court.This table includes convictions to felonies, misdemeanors, and non-criminal offenses such as violations and infractions.
NEW YORK STATE DIVISION OF CRIMINAL JUSTICE SERVICESTOP SUPERIOR COURT ARRAIGNMENT CHARGE VS TOP CONVICTION CHARGE
(INCLUDES YOUTHFUL OFFENDER ADJUDICATIONS)ALL VIOLENT FELONY OFFENSE ACTIONS
January 2012 through December 2012TABLE 11
New York State
NYS Division of Criminal Justice Services 23 May 2013

TOP ARRAIGNMENT CHARGE
TOP CONVICTION CHARGE Class A Class B Class C Class D Class E TOTALS
CLASS A FELONY 180 36.6% 32 0.5% 0 0.0% 0 0.0% 0 0.0% 212 2.2%
CLASS B FELONY 226 45.9% 2,877 45.7% 14 1.4% 18 1.3% 0 0.0% 3,135 33.1%
CLASS C FELONY 29 5.9% 1,060 16.9% 619 63.2% 16 1.1% 1 0.4% 1,725 18.2%
CLASS D FELONY 20 4.1% 733 11.7% 108 11.0% 912 63.4% 0 0.0% 1,773 18.7%
CLASS E FELONY 4 0.8% 98 1.6% 56 5.7% 145 10.1% 216 76.9% 519 5.5%
MISDEMEANORS 27 5.5% 1,405 22.3% 170 17.4% 299 20.8% 51 18.1% 1,952 20.6%
NON-CRIMINAL OFFENSES 6 1.2% 84 1.3% 12 1.2% 49 3.4% 13 4.6% 164 1.7%
TOTAL 492 100.0% 6,289 100.0% 979 100.0% 1,439 100.0% 281 100.0% 9,480 100.0%
SAME OFFENSE 87 17.7% 2,481 39.4% 606 61.9% 868 60.3% 216 76.9% 4,258 44.9%
SAME ARTICLE 374 76.0% 3,496 55.6% 337 34.4% 487 33.8% 54 19.2% 4,748 50.1%
DIFFERENT ARTICLE 31 6.3% 312 5.0% 36 3.7% 84 5.8% 11 3.9% 474 5.0%
TOTAL 492 100.0% 6,289 100.0% 979 100.0% 1,439 100.0% 281 100.0% 9,480 100.0%
Source: CCH, Felony Processing File as of 4/23/2013This table does not include cases where the defendant has been convicted, but not yet sentenced.The term felony actions in this table refers to indictments and superior court informations prosecuted in superior court.This table includes convictions to felonies, misdemeanors, and non-criminal offenses such as violations and infractions.
NEW YORK STATE DIVISION OF CRIMINAL JUSTICE SERVICESTOP SUPERIOR COURT ARRAIGNMENT CHARGE VS TOP CONVICTION CHARGE
(INCLUDES YOUTHFUL OFFENDER ADJUDICATIONS)ALL DRUG FELONY ACTIONS
January 2012 through December 2012TABLE 12
New York State
NYS Division of Criminal Justice Services 24 May 2013

Indictments Informations Unknown TOTAL
FELONY TOTAL 20,790 12,543 535 33,868 81.2%
MISDEMEANOR TOTAL 5,009 1,906 229 7,144 17.1%
NON-CRIMINAL TOTAL 581 92 19 692 1.7%
ALL FELONY ACTIONS TOTAL 26,380 14,541 783 41,704 100.0%
Prison 11,315 4,209 220 15,744 37.8%
Direct to Parole 123 81 2 206 0.5%
Jail 5,144 2,369 295 7,808 18.7%
Jail + Probation 2,348 2,591 54 4,993 12.0%
Probation 4,283 3,915 126 8,324 20.0%
Fine 126 7 1 134 0.3%
Cond Discharge 2,975 1,334 82 4,391 10.5%
Uncond Discharge 45 26 2 73 0.2%
Other 21 9 1 31 0.1%
VFO ACTIONS TOTAL 10,054 2,854 126 13,034 100.0%
Prison 5,711 1,235 54 7,000 53.7%
Direct to Parole 4 8 0 12 0.1%
Jail 1,620 363 25 2,008 15.4%
Jail + Probation 703 528 7 1,238 9.5%
Probation 1,161 595 20 1,776 13.6%
Fine 8 0 0 8 0.1%
Cond Discharge 832 122 20 974 7.5%
Uncond Discharge 9 3 0 12 0.1%
Other 6 0 0 6 0.0%
DRUG FELONY ACTIONS
TOTAL 6,594 2,793 93 9,480 100.0%
Prison 2,858 898 40 3,796 40.0%
Direct to Parole 38 16 0 54 0.6%
Jail 1,289 504 26 1,819 19.2%
Jail + Probation 416 242 3 661 7.0%
Probation 1,040 604 17 1,661 17.5%
Fine 33 1 0 34 0.4%
Cond Discharge 903 521 7 1,431 15.1%
Uncond Discharge 10 4 0 14 0.1%
Other 7 3 0 10 0.1%
OTHER FELONY ACTIONS
TOTAL 9,567 8,477 432 18,476 100.0%
Prison 2,686 1,959 99 4,744 25.7%
Source: CCH, Felony Processing File as of 4/23/2013The term felony actions in this table refers to indictments and superior court informations prosecuted in superior court.This table does not include cases where the defendant has been convicted, but not yet sentenced.Direct to Parole (CPL 410.91) sentences are also known as Willard sentences.
NEW YORK STATE DIVISION OF CRIMINAL JUSTICE SERVICESSENTENCES FOR CONVICTIONS AND YOUTHFUL OFFENDER ADJUDICATIONS
January 2012 through December 2012TABLE 13
New York State
NYS Division of Criminal Justice Services 25 May 2013

Indictments Informations Unknown TOTAL
OTHER FELONY ACTIONS
Direct to Parole 81 51 2 134 0.7%
Jail 2,169 1,423 185 3,777 20.4%
Jail + Probation 1,221 1,756 36 3,013 16.3%
Probation 2,066 2,593 59 4,718 25.5%
Fine 84 4 0 88 0.5%
Cond Discharge 1,228 667 48 1,943 10.5%
Uncond Discharge 25 18 2 45 0.2%
Other 7 6 1 14 0.1%
UNKNOWN TOTAL 165 417 132 714 100.0%
Prison 60 117 27 204 28.6%
Direct to Parole 0 6 0 6 0.8%
Jail 66 79 59 204 28.6%
Jail + Probation 8 65 8 81 11.3%
Probation 16 123 30 169 23.7%
Fine 1 2 1 4 0.6%
Cond Discharge 12 24 7 43 6.0%
Uncond Discharge 1 1 0 2 0.3%
Other 1 0 0 1 0.1%
Source: CCH, Felony Processing File as of 4/23/2013The term felony actions in this table refers to indictments and superior court informations prosecuted in superior court.This table does not include cases where the defendant has been convicted, but not yet sentenced.Direct to Parole (CPL 410.91) sentences are also known as Willard sentences.
NEW YORK STATE DIVISION OF CRIMINAL JUSTICE SERVICESSENTENCES FOR CONVICTIONS AND YOUTHFUL OFFENDER ADJUDICATIONS
January 2012 through December 2012TABLE 13
New York State
NYS Division of Criminal Justice Services 26 May 2013

PRISONDIRECT TO
PAROLE JAILJAIL +
PROBATION PROBATION OTHER TOTAL
PL 105-CONSPIRACY 122 0 22 14 30 5 193
PL 120-ASSAULT 1,281 0 354 363 293 47 2,338
PL 125.27-MURDER 1 21 0 0 0 0 0 21
PL 125-HOMICIDE 559 0 4 26 15 1 605
PL 130-SEX OFF 738 0 108 186 146 10 1,188
PL 135-KIDNAPPING 31 0 3 6 8 2 50
PL 140-BURGLARY 2,438 54 509 671 692 51 4,415
PL 145-MISCHIEF 80 3 57 52 81 20 293
PL 150-ARSON 80 2 15 27 23 2 149
PL 155-LARCENY 834 42 400 344 785 145 2,550
PL 160-ROBBERY 2,197 7 610 442 747 137 4,140
PL 165-OTHER THEFT 287 8 111 79 135 28 648
PL 170-FORGERY 280 19 141 102 204 30 776
PL 200-BRIBERY 5 0 3 5 5 0 18
PL 205-ESCAPE 179 0 20 13 10 0 222
PL 215-JUDICIAL 358 5 224 128 85 10 810
PL 220-CONT SUBS 3,751 55 1,321 561 1,240 163 7,091
PL 221-MARIJUANA 77 0 73 67 134 21 372
PL 225-GAMBLING 0 0 3 1 3 21 28
PL 265-WEAPONS 1,484 1 310 134 191 16 2,136
OTHER PL FELONIES 393 3 123 159 276 114 1,068
DWI VTL FELONIES 405 7 647 1,147 1,258 171 3,635
OTHER VTL FELONIES 60 0 267 85 129 42 583
OTHER FELONIES 84 0 249 52 77 75 537
TOTAL CONVICTIONS 15,744 206 5,574 4,664 6,567 1111 33,866
Source: CCH, Felony Processing File as of 4/23/2013
New York State
NEW YORK STATE DIVISION OF CRIMINAL JUSTICE SERVICESSENTENCE FOR FELONY CONVICTIONS AND YOUTHFUL OFFENDER ADJUDICATIONS
January 2012 through December 2012TABLE 14
NYS Division of Criminal Justice Services 27 May 2013

PRISONDIRECT TO
PAROLE JAILJAIL +
PROBATION PROBATION OTHER
TOTAL
DRUG SALE CLASS A-I PL 220.43 14 0 0 0 0 0 14
PL 220.43 ATT 1 0 0 0 0 0 1
PL 220.77 1 0 0 0 0 0 1
CLASS A-II PL 220.41 80 0 0 0 0 0 80
PL 220.41 ATT 2 0 0 0 0 0 2
CLASS B PL 220.39 1,036 7 274 129 278 28 1,752
PL 220.44 83 1 14 1 14 0 113
CLASS C PL 220.34 132 1 72 21 42 3 271
PL 220.39 ATT 287 5 120 68 80 15 575
PL 220.44 ATT 2 0 0 0 0 0 2
PL 220.48 ATT 0 0 0 0 2 0 2
PL 220.65 0 0 1 1 0 0 2
PL 221.55 4 0 4 2 1 0 11
CLASS D PL 220.31 266 2 205 53 140 32 698
PL 220.34 ATT 10 0 1 3 7 1 22
PL 221.50 6 0 0 1 2 0 9
PL 221.55 ATT 0 0 2 1 2 0 5
CLASS E PL 220.31 ATT 59 0 11 14 18 5 107
PL 221.45 10 0 5 8 9 1 33
PL 221.50 ATT 3 0 0 1 1 0 5
DRUG POSSESSION CLASS A-I PL 220.21 18 0 0 0 0 0 18
PL 220.21 ATT 1 0 0 0 0 0 1
CLASS A-II PL 220.18 101 0 0 0 1 0 102
PL 220.18 ATT 4 0 0 0 0 0 4
CLASS B PL 220.16 786 17 172 108 238 23 1,344
CLASS C PL 220.09 165 6 99 24 99 14 407
PL 220.16 ATT 211 6 90 41 82 6 436
PL 221.30 15 0 10 5 10 3 43
CLASS D PL 220.06 334 7 175 56 153 24 749
PL 220.09 ATT 53 2 32 10 39 3 139
PL 220.73 9 0 5 5 1 0 20
PL 221.25 15 0 21 23 40 8 107
PL 221.30 ATT 5 0 5 1 7 0 18
CLASS E PL 220.06 ATT 90 1 49 21 45 9 215
PL 220.46 2 0 0 1 0 0 3
PL 220.72 2 0 1 3 1 0 7
PL 220.73 ATT 2 0 0 2 0 0 4
PL 221.20 13 0 19 17 47 8 104
PL 221.25 ATT 6 0 7 8 15 1 37
TOTAL DRUG SALE 1,996 16 709 303 596 85 3,705
TOTAL DRUG POSSESSION 1,832 39 685 325 778 99 3,758
TOTAL DRUGS CLASS A-I 35 0 0 0 0 0 35
CLASS A-II 187 0 0 0 1 0 188
CLASS B 1,905 25 460 238 530 51 3,209
Source: CCH, Felony Processing File as of 4/23/2013
New York State
NEW YORK STATE DIVISION OF CRIMINAL JUSTICE SERVICES SENTENCES FOR FELONY DRUG CONVICTIONS AND YOUTHFUL OFFENDER ADJUDICATIONS
January 2012 through December 2012 TABLE 15
NYS Division of Criminal Justice Services 28 May 2013

PRISONDIRECT TO
PAROLE JAILJAIL +
PROBATION PROBATION OTHER
TOTAL
CLASS C 816 18 396 162 316 41 1,749
CLASS D 698 11 446 153 391 68 1,767
CLASS E 187 1 92 75 136 24 515
TOTAL 3,828 55 1,394 628 1,374 184 7,463
Source: CCH, Felony Processing File as of 4/23/2013
New York State
NEW YORK STATE DIVISION OF CRIMINAL JUSTICE SERVICES SENTENCES FOR FELONY DRUG CONVICTIONS AND YOUTHFUL OFFENDER ADJUDICATIONS
January 2012 through December 2012 TABLE 15
NYS Division of Criminal Justice Services 29 May 2013

Arraignment to Final Disposition Time
Valid N Minimum Median Mean Maximum
ALL CASES TOTAL DISPOSED 47,219 1 174 307 13,848
Convicted - Plea 36,599 1 162 281 13,848
Convicted - Verdict 1,439 26 377 515 5,876
Adjudicated - Youthful Offender 3,665 1 176 297 10,454
Covered by, Consolidated, Superseded 1,869 1 76 135 8,715
Diverted and Dismissed 433 189 606 677 2,354
Dismissed 2,443 1 253 544 13,578
Acquitted 574 1 366 512 12,708
Other 197 1 315 1,135 11,341
INDICTMENTS TOTAL DISPOSED 30,568 1 231 366 13,848
Convicted - Plea 22,887 1 218 337 13,848
Convicted - Verdict 1,414 26 374 506 5,855
Adjudicated - Youthful Offender 2,078 1 269 380 10,454
Covered by, Consolidated, Superseded 1,151 1 112 181 8,715
Diverted and Dismissed 119 189 875 865 2,354
Dismissed 2,200 1 265 547 13,578
Acquitted 558 22 365 515 12,708
Other 161 1 331 1,063 11,341
INFORMATIONS TOTAL DISPOSED 15,369 1 78 187 8,903
Convicted - Plea 13,000 1 76 181 8,903
Convicted - Verdict 9 64 225 494 1,514
Adjudicated - Youthful Offender 1,532 1 84 178 8,291
Covered by, Consolidated, Superseded 431 1 1 45 1,415
Diverted and Dismissed 311 325 562 607 1,991
Dismissed 57 1 378 630 6,246
Acquitted 11 1 233 268 538
Other 18 1 130 359 2,927
UNKNOWN TOTAL DISPOSED 1,282 1 113 332 11,127
Convicted - Plea 712 1 134 299 4,986
Convicted - Verdict 16 63 738 1,323 5,876
Adjudicated - Youthful Offender 55 1 176 460 2,132
Covered by, Consolidated, Superseded 287 1 70 86 710
Diverted and Dismissed 3 341 560 549 746
Dismissed 186 1 111 484 11,127
Acquitted 5 316 709 729 1,289
Other 18 1 241 2,553 10,000
Source: CCH, Felony Processing File as of 4/23/2013The term felony actions in this table refers to indictments and superior court informations prosecuted in superior court.Final disposition is the date of sentence for cases that ended in a conviction and the date of disposition for cases that ended in a non-conviction.This table does not include cases where the defendant has been convicted, but not yet sentenced.This table includes convictions to felonies, misdemeanors and non-criminal offenses such as violations and infractions.
NEW YORK STATE DIVISION OF CRIMINAL JUSTICE SERVICESDAYS TO FINAL DISPOSITION OF FELONY ACTIONS
January 2012 through December 2012TABLE 16
New York State
NYS Division of Criminal Justice Services 30 May 2013

Arraignment to Final Disposition Time
Valid N Minimum Median Mean Maximum
ALL CASES TOTAL DISPOSED 15,199 1 238 357 11,341
Convicted - Plea 9,855 1 218 323 9,658
Convicted - Verdict 924 47 436 581 5,855
Adjudicated - Youthful Offender 2,255 1 225 327 5,125
Covered by, Consolidated, Superseded 647 1 106 162 1,468
Diverted and Dismissed 19 189 617 658 1,186
Dismissed 1,029 1 358 522 10,493
Acquitted 389 1 393 516 3,599
Other 81 1 548 1,287 11,341
INDICTMENTS TOTAL DISPOSED 11,944 1 288 412 11,341
Convicted - Plea 7,626 1 267 378 9,658
Convicted - Verdict 907 47 433 575 5,855
Adjudicated - Youthful Offender 1,521 1 297 398 5,125
Covered by, Consolidated, Superseded 453 1 144 200 1,468
Diverted and Dismissed 18 189 603 647 1,186
Dismissed 964 1 379 538 10,493
Acquitted 382 22 395 518 3,599
Other 73 16 548 1,274 11,341
INFORMATIONS TOTAL DISPOSED 2,981 1 65 138 4,194
Convicted - Plea 2,126 1 64 127 4,194
Convicted - Verdict 7 64 232 579 1,514
Adjudicated - Youthful Offender 721 1 90 174 1,743
Covered by, Consolidated, Superseded 114 1 1 54 1,069
Diverted and Dismissed 1 855 855 855 855
Dismissed 6 91 148 190 415
Acquitted 4 1 12 64 233
Other 2 1 1,464 1,464 2,927
UNKNOWN TOTAL DISPOSED 274 1 126 322 4,404
Convicted - Plea 103 1 227 329 1,645
Convicted - Verdict 10 63 825 1,123 4,144
Adjudicated - Youthful Offender 13 11 603 513 1,535
Covered by, Consolidated, Superseded 80 1 87 103 638
Diverted and Dismissed 0
Dismissed 59 1 111 298 4,225
Acquitted 3 316 709 771 1,289
Other 6 203 616 1,384 4,404
Source: CCH, Felony Processing File as of 4/23/2013The term felony actions in this table refers to indictments and superior court informations prosecuted in superior court.Final disposition is the date of sentence for cases that ended in a conviction and the date of disposition for cases that ended in a non-conviction.This table does not include cases where the defendant has been convicted, but not yet sentenced.Violent Felony Offenses include offenses listed in PL 70.02 and the Class A felonies of murder, arson, kidnapping and predatory sexual assault.This table includes convictions to felonies, misdemeanors and non-criminal offenses such as violations and infractions.
NEW YORK STATE DIVISION OF CRIMINAL JUSTICE SERVICESDAYS TO FINAL DISPOSITION OF VIOLENT FELONY OFFENSE ACTIONS
January 2012 through December 2012TABLE 17
New York State
NYS Division of Criminal Justice Services 31 May 2013
Arraignment to Final Disposition Time
Valid N Minimum Median Mean Maximum
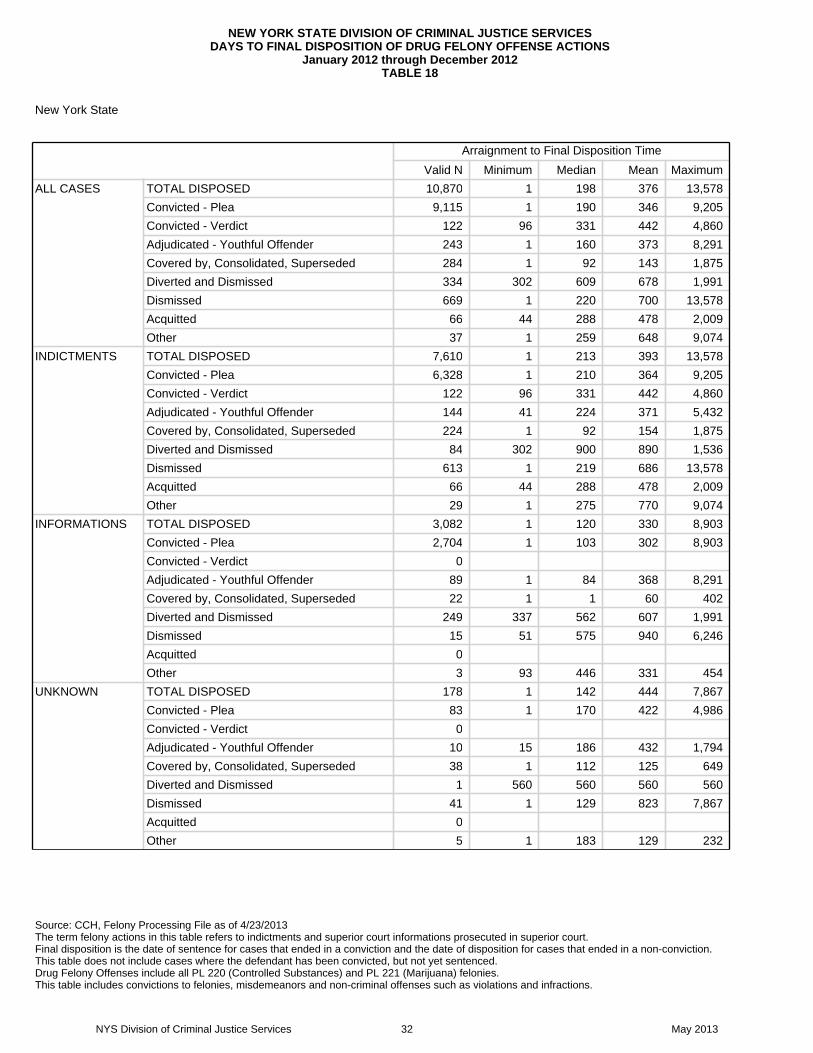
ALL CASES TOTAL DISPOSED 10,870 1 198 376 13,578
Convicted - Plea 9,115 1 190 346 9,205
Convicted - Verdict 122 96 331 442 4,860
Adjudicated - Youthful Offender 243 1 160 373 8,291
Covered by, Consolidated, Superseded 284 1 92 143 1,875
Diverted and Dismissed 334 302 609 678 1,991
Dismissed 669 1 220 700 13,578
Acquitted 66 44 288 478 2,009
Other 37 1 259 648 9,074
INDICTMENTS TOTAL DISPOSED 7,610 1 213 393 13,578
Convicted - Plea 6,328 1 210 364 9,205
Convicted - Verdict 122 96 331 442 4,860
Adjudicated - Youthful Offender 144 41 224 371 5,432
Covered by, Consolidated, Superseded 224 1 92 154 1,875
Diverted and Dismissed 84 302 900 890 1,536
Dismissed 613 1 219 686 13,578
Acquitted 66 44 288 478 2,009
Other 29 1 275 770 9,074
INFORMATIONS TOTAL DISPOSED 3,082 1 120 330 8,903
Convicted - Plea 2,704 1 103 302 8,903
Convicted - Verdict 0
Adjudicated - Youthful Offender 89 1 84 368 8,291
Covered by, Consolidated, Superseded 22 1 1 60 402
Diverted and Dismissed 249 337 562 607 1,991
Dismissed 15 51 575 940 6,246
Acquitted 0
Other 3 93 446 331 454
UNKNOWN TOTAL DISPOSED 178 1 142 444 7,867
Convicted - Plea 83 1 170 422 4,986
Convicted - Verdict 0
Adjudicated - Youthful Offender 10 15 186 432 1,794
Covered by, Consolidated, Superseded 38 1 112 125 649
Diverted and Dismissed 1 560 560 560 560
Dismissed 41 1 129 823 7,867
Acquitted 0
Other 5 1 183 129 232
Source: CCH, Felony Processing File as of 4/23/2013The term felony actions in this table refers to indictments and superior court informations prosecuted in superior court.Final disposition is the date of sentence for cases that ended in a conviction and the date of disposition for cases that ended in a non-conviction.This table does not include cases where the defendant has been convicted, but not yet sentenced.Drug Felony Offenses include all PL 220 (Controlled Substances) and PL 221 (Marijuana) felonies.This table includes convictions to felonies, misdemeanors and non-criminal offenses such as violations and infractions.
NEW YORK STATE DIVISION OF CRIMINAL JUSTICE SERVICESDAYS TO FINAL DISPOSITION OF DRUG FELONY OFFENSE ACTIONS
January 2012 through December 2012TABLE 18
New York State
NYS Division of Criminal Justice Services 32 May 2013

Q1 2012 Q2 2012 Q3 2012 Q4 2012 TOTAL
Albany County DA Office 291 285 252 289 1,117
Allegany County DA Office 21 37 39 24 121
Bronx County DA Office 1,219 1,058 888 888 4,053
Broome County DA Office 191 165 164 146 666
Cattaraugus County DA Office 88 105 98 88 379
Cayuga County DA Office 65 82 76 71 294
Chautauqua County DA Office 105 125 100 103 433
Chemung County DA Office 77 79 84 89 329
Chenango County DA Office 49 43 38 38 168
Clinton County DA Office 86 58 68 94 306
Columbia County DA Office 19 41 23 24 107
Cortland County DA Office 69 47 44 47 207
Delaware County DA Office 21 22 31 44 118
Dutchess County DA Office 117 140 96 105 458
Erie County DA Office 442 452 438 398 1,730
Essex County DA Office 19 21 23 16 79
Franklin County DA Office 27 32 69 52 180
Fulton County DA Office 39 27 47 48 161
Genesee County DA Office 76 76 54 76 282
Greene County DA Office 26 21 36 18 101
Hamilton County DA Office 7 3 7 2 19
Herkimer County DA Office 43 54 33 53 183
Jefferson County DA Office 105 112 85 76 378
Kings County DA Office 1,457 1,435 1,511 1,274 5,677
Lewis County DA Office 19 19 18 16 72
Livingston County DA Office 55 49 49 54 207
Madison County DA Office 40 57 20 55 172
Monroe County DA Office 565 525 524 463 2,077
Montgomery County DA Office 31 36 32 21 120
Nassau County DA Office 514 436 477 427 1,854
New York County DA Office 1,471 1,376 1,335 1,243 5,425
Niagara County DA Office 125 119 122 86 452
Oneida County DA Office 212 198 207 209 826
Onondaga County DA Office 374 394 344 339 1,451
Ontario County DA Office 138 91 95 90 414
Orange County DA Office 243 175 188 191 797
Orleans County DA Office 42 35 38 22 137
Source: CCH, Felony Processing File as of 4/23/2013The term felony actions in this table refers to indictments and superior court informations prosecuted in superior court cases.
NEW YORK STATE DIVISION OF CRIMINAL JUSTICE SERVICESFELONY ACTIONS BY OFFICE
Quarter 1 2012 through Quarter 4 2012TABLE 19
NYS Division of Criminal Justice Services 33 May 2013
Q1 2012 Q2 2012 Q3 2012 Q4 2012 TOTAL
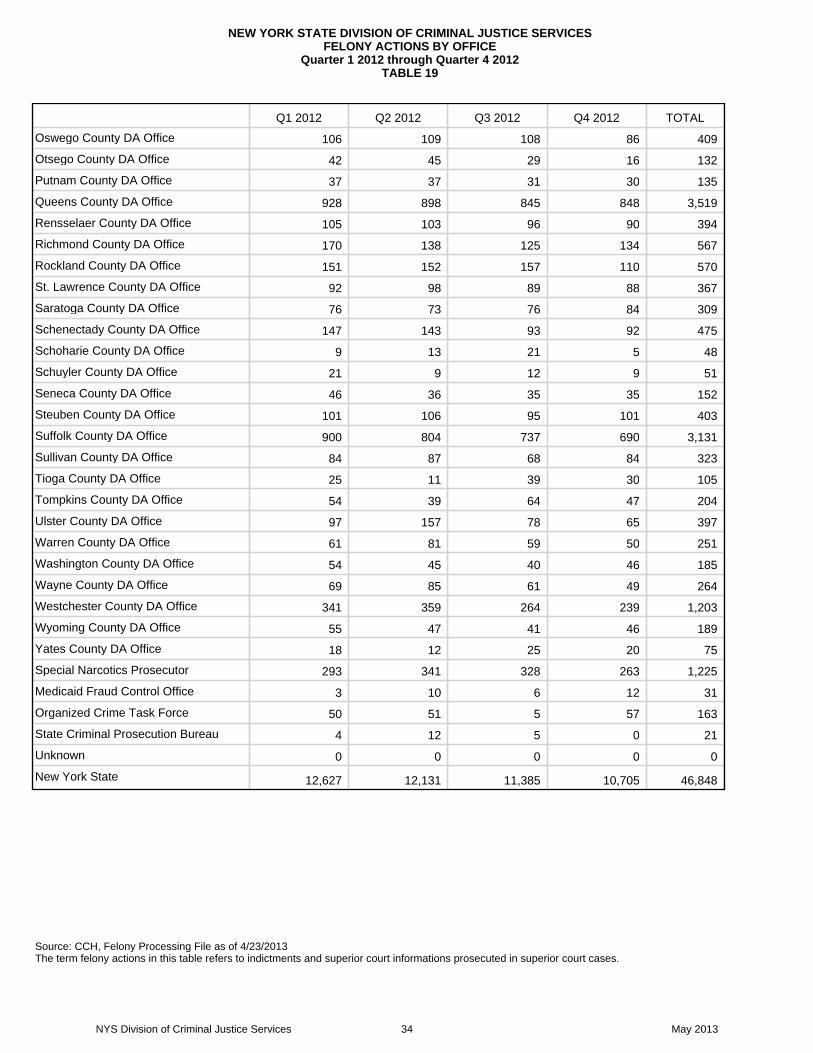
Oswego County DA Office 106 109 108 86 409
Otsego County DA Office 42 45 29 16 132
Putnam County DA Office 37 37 31 30 135
Queens County DA Office 928 898 845 848 3,519
Rensselaer County DA Office 105 103 96 90 394
Richmond County DA Office 170 138 125 134 567
Rockland County DA Office 151 152 157 110 570
St. Lawrence County DA Office 92 98 89 88 367
Saratoga County DA Office 76 73 76 84 309
Schenectady County DA Office 147 143 93 92 475
Schoharie County DA Office 9 13 21 5 48
Schuyler County DA Office 21 9 12 9 51
Seneca County DA Office 46 36 35 35 152
Steuben County DA Office 101 106 95 101 403
Suffolk County DA Office 900 804 737 690 3,131
Sullivan County DA Office 84 87 68 84 323
Tioga County DA Office 25 11 39 30 105
Tompkins County DA Office 54 39 64 47 204
Ulster County DA Office 97 157 78 65 397
Warren County DA Office 61 81 59 50 251
Washington County DA Office 54 45 40 46 185
Wayne County DA Office 69 85 61 49 264
Westchester County DA Office 341 359 264 239 1,203
Wyoming County DA Office 55 47 41 46 189
Yates County DA Office 18 12 25 20 75
Special Narcotics Prosecutor 293 341 328 263 1,225
Medicaid Fraud Control Office 3 10 6 12 31
Organized Crime Task Force 50 51 5 57 163
State Criminal Prosecution Bureau 4 12 5 0 21
Unknown 0 0 0 0 0
New York State 12,627 12,131 11,385 10,705 46,848
Source: CCH, Felony Processing File as of 4/23/2013The term felony actions in this table refers to indictments and superior court informations prosecuted in superior court cases.
NEW YORK STATE DIVISION OF CRIMINAL JUSTICE SERVICESFELONY ACTIONS BY OFFICE
Quarter 1 2012 through Quarter 4 2012TABLE 19
NYS Division of Criminal Justice Services 34 May 2013
Q1 2012 Q2 2012 Q3 2012 Q4 2012 TOTAL
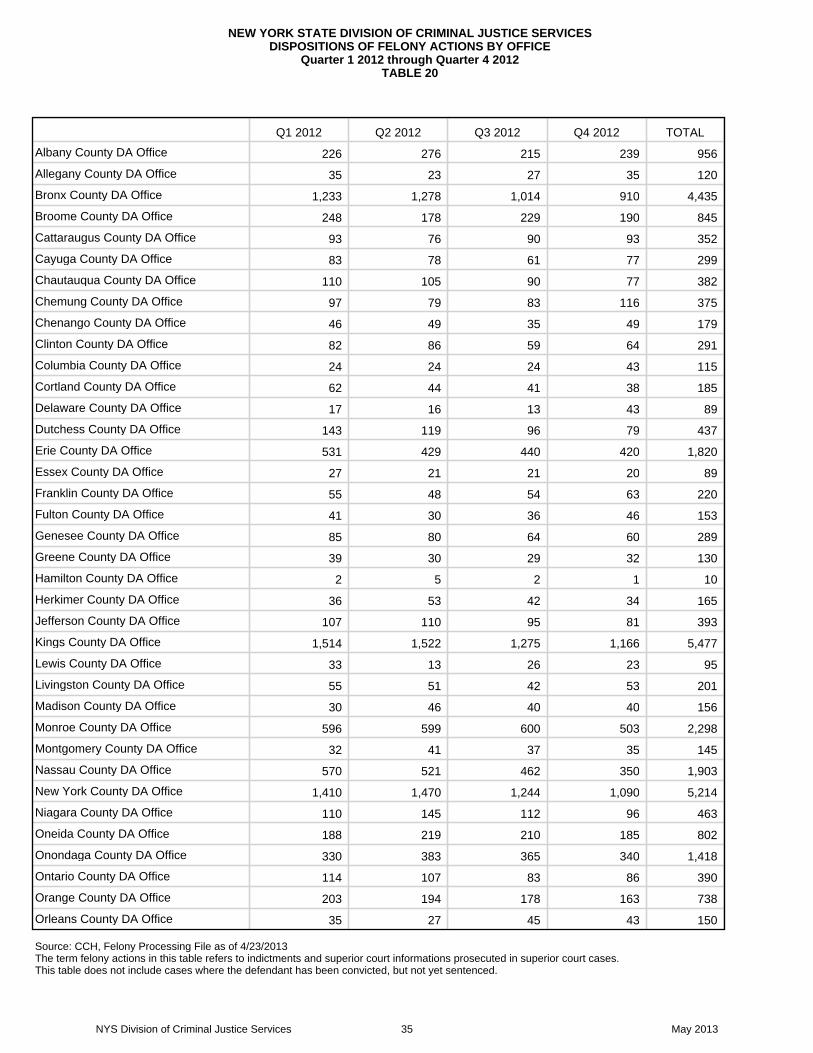
Albany County DA Office 226 276 215 239 956
Allegany County DA Office 35 23 27 35 120
Bronx County DA Office 1,233 1,278 1,014 910 4,435
Broome County DA Office 248 178 229 190 845
Cattaraugus County DA Office 93 76 90 93 352
Cayuga County DA Office 83 78 61 77 299
Chautauqua County DA Office 110 105 90 77 382
Chemung County DA Office 97 79 83 116 375
Chenango County DA Office 46 49 35 49 179
Clinton County DA Office 82 86 59 64 291
Columbia County DA Office 24 24 24 43 115
Cortland County DA Office 62 44 41 38 185
Delaware County DA Office 17 16 13 43 89
Dutchess County DA Office 143 119 96 79 437
Erie County DA Office 531 429 440 420 1,820
Essex County DA Office 27 21 21 20 89
Franklin County DA Office 55 48 54 63 220
Fulton County DA Office 41 30 36 46 153
Genesee County DA Office 85 80 64 60 289
Greene County DA Office 39 30 29 32 130
Hamilton County DA Office 2 5 2 1 10
Herkimer County DA Office 36 53 42 34 165
Jefferson County DA Office 107 110 95 81 393
Kings County DA Office 1,514 1,522 1,275 1,166 5,477
Lewis County DA Office 33 13 26 23 95
Livingston County DA Office 55 51 42 53 201
Madison County DA Office 30 46 40 40 156
Monroe County DA Office 596 599 600 503 2,298
Montgomery County DA Office 32 41 37 35 145
Nassau County DA Office 570 521 462 350 1,903
New York County DA Office 1,410 1,470 1,244 1,090 5,214
Niagara County DA Office 110 145 112 96 463
Oneida County DA Office 188 219 210 185 802
Onondaga County DA Office 330 383 365 340 1,418
Ontario County DA Office 114 107 83 86 390
Orange County DA Office 203 194 178 163 738
Orleans County DA Office 35 27 45 43 150
Source: CCH, Felony Processing File as of 4/23/2013The term felony actions in this table refers to indictments and superior court informations prosecuted in superior court cases.This table does not include cases where the defendant has been convicted, but not yet sentenced.
NEW YORK STATE DIVISION OF CRIMINAL JUSTICE SERVICESDISPOSITIONS OF FELONY ACTIONS BY OFFICE
Quarter 1 2012 through Quarter 4 2012TABLE 20
NYS Division of Criminal Justice Services 35 May 2013

Q1 2012 Q2 2012 Q3 2012 Q4 2012 TOTAL
Oswego County DA Office 104 85 95 88 372
Otsego County DA Office 36 53 21 39 149
Putnam County DA Office 33 33 22 31 119
Queens County DA Office 985 938 802 736 3,461
Rensselaer County DA Office 88 100 95 100 383
Richmond County DA Office 249 164 136 136 685
Rockland County DA Office 171 164 131 135 601
St. Lawrence County DA Office 90 97 98 81 366
Saratoga County DA Office 95 75 80 76 326
Schenectady County DA Office 127 111 148 108 494
Schoharie County DA Office 5 22 10 6 43
Schuyler County DA Office 5 11 8 14 38
Seneca County DA Office 25 41 29 23 118
Steuben County DA Office 89 99 87 69 344
Suffolk County DA Office 881 813 709 654 3,057
Sullivan County DA Office 92 82 77 74 325
Tioga County DA Office 41 36 16 41 134
Tompkins County DA Office 46 43 59 48 196
Ulster County DA Office 100 82 114 107 403
Warren County DA Office 67 53 62 65 247
Washington County DA Office 47 48 26 38 159
Wayne County DA Office 84 70 89 63 306
Westchester County DA Office 415 355 349 306 1,425
Wyoming County DA Office 45 55 48 48 196
Yates County DA Office 11 19 19 26 75
Special Narcotics Prosecutor 327 321 292 253 1,193
Medicaid Fraud Control Office 14 12 8 4 38
Organized Crime Task Force 58 50 42 25 175
State Criminal Prosecution Bureau 7 2 4 5 18
Unknown 0 0 0 0 0
New York State 12,979 12,609 11,255 10,382 47,225
Source: CCH, Felony Processing File as of 4/23/2013The term felony actions in this table refers to indictments and superior court informations prosecuted in superior court cases.This table does not include cases where the defendant has been convicted, but not yet sentenced.
NEW YORK STATE DIVISION OF CRIMINAL JUSTICE SERVICESDISPOSITIONS OF FELONY ACTIONS BY OFFICE
Quarter 1 2012 through Quarter 4 2012TABLE 20
NYS Division of Criminal Justice Services 36 May 2013
Q1 2012 Q2 2012 Q3 2012 Q4 2012 TOTAL
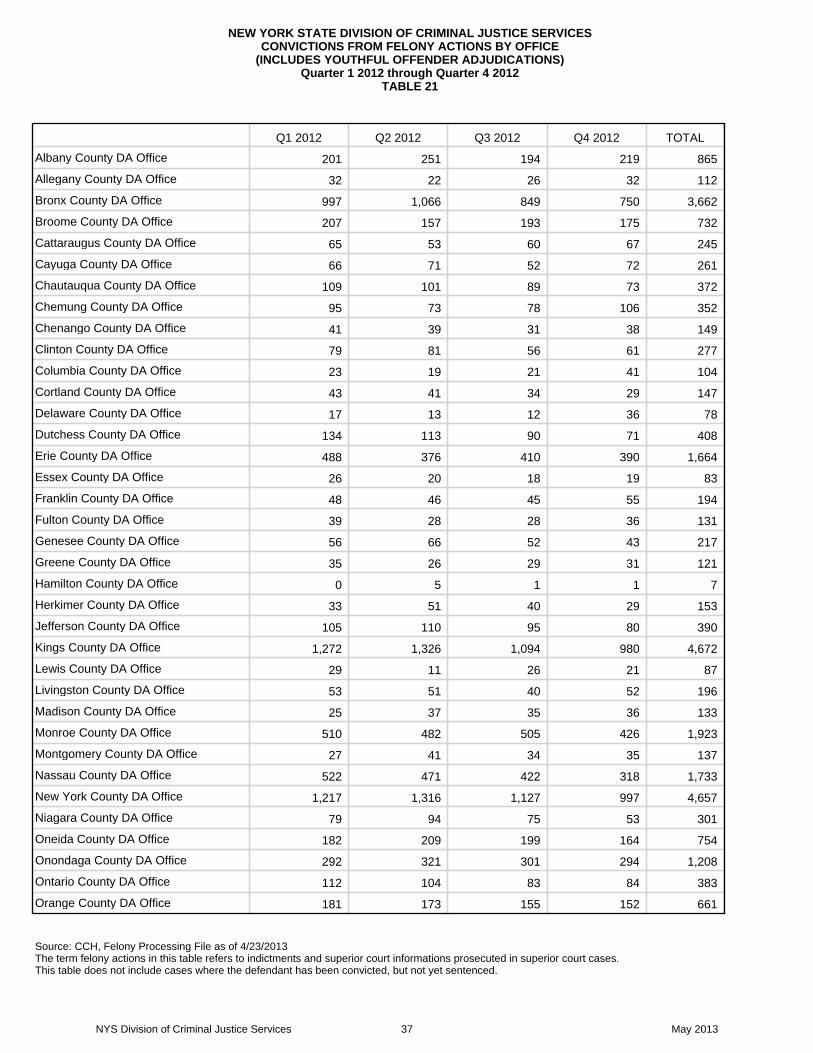
Albany County DA Office 201 251 194 219 865
Allegany County DA Office 32 22 26 32 112
Bronx County DA Office 997 1,066 849 750 3,662
Broome County DA Office 207 157 193 175 732
Cattaraugus County DA Office 65 53 60 67 245
Cayuga County DA Office 66 71 52 72 261
Chautauqua County DA Office 109 101 89 73 372
Chemung County DA Office 95 73 78 106 352
Chenango County DA Office 41 39 31 38 149
Clinton County DA Office 79 81 56 61 277
Columbia County DA Office 23 19 21 41 104
Cortland County DA Office 43 41 34 29 147
Delaware County DA Office 17 13 12 36 78
Dutchess County DA Office 134 113 90 71 408
Erie County DA Office 488 376 410 390 1,664
Essex County DA Office 26 20 18 19 83
Franklin County DA Office 48 46 45 55 194
Fulton County DA Office 39 28 28 36 131
Genesee County DA Office 56 66 52 43 217
Greene County DA Office 35 26 29 31 121
Hamilton County DA Office 0 5 1 1 7
Herkimer County DA Office 33 51 40 29 153
Jefferson County DA Office 105 110 95 80 390
Kings County DA Office 1,272 1,326 1,094 980 4,672
Lewis County DA Office 29 11 26 21 87
Livingston County DA Office 53 51 40 52 196
Madison County DA Office 25 37 35 36 133
Monroe County DA Office 510 482 505 426 1,923
Montgomery County DA Office 27 41 34 35 137
Nassau County DA Office 522 471 422 318 1,733
New York County DA Office 1,217 1,316 1,127 997 4,657
Niagara County DA Office 79 94 75 53 301
Oneida County DA Office 182 209 199 164 754
Onondaga County DA Office 292 321 301 294 1,208
Ontario County DA Office 112 104 83 84 383
Orange County DA Office 181 173 155 152 661
Source: CCH, Felony Processing File as of 4/23/2013The term felony actions in this table refers to indictments and superior court informations prosecuted in superior court cases.This table does not include cases where the defendant has been convicted, but not yet sentenced.
NEW YORK STATE DIVISION OF CRIMINAL JUSTICE SERVICESCONVICTIONS FROM FELONY ACTIONS BY OFFICE
(INCLUDES YOUTHFUL OFFENDER ADJUDICATIONS)Quarter 1 2012 through Quarter 4 2012
TABLE 21
NYS Division of Criminal Justice Services 37 May 2013

Q1 2012 Q2 2012 Q3 2012 Q4 2012 TOTAL
Orleans County DA Office 32 25 42 36 135
Oswego County DA Office 61 63 66 71 261
Otsego County DA Office 28 35 16 28 107
Putnam County DA Office 30 32 20 29 111
Queens County DA Office 905 866 738 666 3,175
Rensselaer County DA Office 67 74 78 84 303
Richmond County DA Office 215 146 115 113 589
Rockland County DA Office 159 158 126 130 573
St. Lawrence County DA Office 78 82 83 63 306
Saratoga County DA Office 93 73 77 70 313
Schenectady County DA Office 112 97 132 94 435
Schoharie County DA Office 5 22 8 3 38
Schuyler County DA Office 5 11 8 13 37
Seneca County DA Office 21 38 26 23 108
Steuben County DA Office 80 88 75 60 303
Suffolk County DA Office 841 783 677 621 2,922
Sullivan County DA Office 81 81 76 65 303
Tioga County DA Office 39 35 15 38 127
Tompkins County DA Office 38 38 49 44 169
Ulster County DA Office 79 73 108 105 365
Warren County DA Office 64 51 62 65 242
Washington County DA Office 45 42 24 34 145
Wayne County DA Office 71 57 64 55 247
Westchester County DA Office 403 340 333 284 1,360
Wyoming County DA Office 39 48 41 42 170
Yates County DA Office 11 18 17 24 70
Special Narcotics Prosecutor 293 275 234 213 1,015
Medicaid Fraud Control Office 9 11 6 4 30
Organized Crime Task Force 52 48 37 20 157
State Criminal Prosecution Bureau 7 2 4 5 18
Unknown 0 0 0 0 0
New York State 11,403 11,176 9,956 9,168 41,703
Source: CCH, Felony Processing File as of 4/23/2013The term felony actions in this table refers to indictments and superior court informations prosecuted in superior court cases.This table does not include cases where the defendant has been convicted, but not yet sentenced.
NEW YORK STATE DIVISION OF CRIMINAL JUSTICE SERVICESCONVICTIONS FROM FELONY ACTIONS BY OFFICE
(INCLUDES YOUTHFUL OFFENDER ADJUDICATIONS)Quarter 1 2012 through Quarter 4 2012
TABLE 21
NYS Division of Criminal Justice Services 38 May 2013