new york state regents examination in chemistrynew york state regents examination in chemistry 2017...
TRANSCRIPT
New York State Regents Examination in Chemistry
2017 Technical Report
Prepared for the New York State Education Department by Pearson
March 2018
Copyright
Developed and published under contract with the New York State Education Department by Pearson.
Copyright © 2018 by the New York State Education Department.
Secure Materials. All rights reserved. No part of this document may be reproduced or transmitted by any means. Use of these materials is expressly limited to the New York State Education Department.
Prepared for NYSED by Pearson i
Contents
COPYRIGHT ...................................................................................................................................................................... II
CHAPTER 1: INTRODUCTION ............................................................................................................................................. 1
1.1 INTRODUCTION ................................................................................................................................................................... 1 1.2 PURPOSES OF THE EXAM ....................................................................................................................................................... 1 1.3 TARGET POPULATION (STANDARD 7.2) ................................................................................................................................... 2
CHAPTER 2: CLASSICAL ITEM STATISTICS (STANDARD 4.10) ............................................................................................. 3
2.1 ITEM DIFFICULTY ................................................................................................................................................................. 3 2.2 ITEM DISCRIMINATION ......................................................................................................................................................... 4 2.3 DISCRIMINATION ON DIFFICULTY SCATTER PLOT ........................................................................................................................ 7 2.4 OBSERVATIONS AND INTERPRETATIONS ................................................................................................................................... 7
CHAPTER 3: IRT CALIBRATIONS, EQUATING, AND SCALING (STANDARDS 2, AND 4.10) .................................................... 8
3.1 DESCRIPTION OF THE RASCH MODEL ....................................................................................................................................... 8 3.2 SOFTWARE AND ESTIMATION ALGORITHM ............................................................................................................................... 9 3.3 CHARACTERISTICS OF THE TESTING POPULATION ....................................................................................................................... 9 3.4. ITEM DIFFICULTY-STUDENT PERFORMANCE MAPS .................................................................................................................... 9 3.5 CHECKING RASCH ASSUMPTIONS .......................................................................................................................................... 10 Unidimensionality ............................................................................................................................................................. 10 Local Independence ........................................................................................................................................................... 12 Item Fit .............................................................................................................................................................................. 14
3.6 SCALING OF OPERATIONAL TEST FORMS ................................................................................................................................ 15
CHAPTER 4: RELIABILITY (STANDARD 2) ..........................................................................................................................18
4.1 RELIABILITY INDICES (STANDARD 2.20) ................................................................................................................................. 18 Coefficient Alpha ............................................................................................................................................................... 19
4.2 STANDARD ERROR OF MEASUREMENT (STANDARDS 2.13, 2.14, 2.15) ...................................................................................... 19 Traditional Standard Error of Measurement ..................................................................................................................... 19 Traditional Standard Error of Measurement Confidence Intervals ................................................................................... 20 Conditional Standard Error of Measurement .................................................................................................................... 20 Conditional Standard Error of Measurement Confidence Intervals .................................................................................. 21 Conditional Standard Error of Measurement Characteristics ........................................................................................... 22 Results and Observations .................................................................................................................................................. 22
4.3 DECISION CONSISTENCY AND ACCURACY (STANDARD 2.16) ...................................................................................................... 23 4.4 GROUP MEANS (STANDARD 2.17) ....................................................................................................................................... 25 4.5 STATE PERCENTILE RANKINGS .............................................................................................................................................. 26
CHAPTER 5: VALIDITY (STANDARD 1) ..............................................................................................................................28
5.1 EVIDENCE BASED ON TEST CONTENT ..................................................................................................................................... 28 Content Validity ................................................................................................................................................................ 29 Item Development Process ................................................................................................................................................ 29 Item Review Process .......................................................................................................................................................... 31
5.2 EVIDENCE BASED ON RESPONSE PROCESSES ........................................................................................................................... 32 Administration and Scoring ............................................................................................................................................... 32 Statistical Analysis............................................................................................................................................................. 34
5.3 EVIDENCE BASED ON INTERNAL STRUCTURE ........................................................................................................................... 34 Item Difficulty .................................................................................................................................................................... 35 Item Discrimination ........................................................................................................................................................... 35 Differential Item Functioning ............................................................................................................................................ 35
Prepared for NYSED by Pearson ii
IRT Model Fit ..................................................................................................................................................................... 36 Test Reliability ................................................................................................................................................................... 36 Classification Consistency and Accuracy ........................................................................................................................... 36 Dimensionality .................................................................................................................................................................. 37
5.4 EVIDENCE BASED ON RELATIONS TO OTHER VARIABLES ............................................................................................................ 37 5.5 EVIDENCE BASED ON TESTING CONSEQUENCES ....................................................................................................................... 37
REFERENCES ....................................................................................................................................................................39
APPENDIX A: OPERATIONAL TEST MAPS .........................................................................................................................43
APPENDIX B: RAW-TO-THETA-TO-SCALE SCORE CONVERSION TABLES ............................................................................52
APPENDIX C: ITEM WRITING GUIDELINES ........................................................................................................................55
APPENDIX D: TABLES AND FIGURES FOR AUGUST 2016 ADMINISTRATION .....................................................................58
APPENDIX E: TABLES AND FIGURES FOR JANUARY 2017 ADMINISTRATION ....................................................................66

Prepared for NYSED by Pearson iii
List of Tables
TABLE 1 TOTAL EXAMINEE POPULATION: REGENTS EXAMINATION IN CHEMISTRY ...................................................................................... 2 TABLE 2 MULTIPLE-CHOICE ITEM ANALYSIS SUMMARY: REGENTS EXAMINATION IN CHEMISTRY ................................................................... 4 TABLE 3 CONSTRUCTED-RESPONSE ITEM ANALYSIS SUMMARY: REGENTS EXAMINATION IN CHEMISTRY ......................................................... 6 TABLE 4 DESCRIPTIVE STATISTICS IN P-VALUE AND POINT-BISERIAL CORRELATION: REGENTS EXAMINATION IN CHEMISTRY ................................ 7 TABLE 5 SUMMARY OF ITEM RESIDUAL CORRELATIONS: REGENTS EXAMINATION IN CHEMISTRY ................................................................. 14 TABLE 6 SUMMARY OF INFIT MEAN SQUARE STATISTICS: REGENTS EXAMINATION IN CHEMISTRY .............................................................. 15 TABLE 7 RELIABILITIES AND STANDARD ERRORS OF MEASUREMENT: REGENTS EXAMINATION IN CHEMISTRY ................................................ 20 TABLE 8 DECISION CONSISTENCY AND ACCURACY RESULTS: REGENTS EXAMINATION IN CHEMISTRY ............................................................ 25 TABLE 9 GROUP MEANS: REGENTS EXAMINATION IN CHEMISTRY ......................................................................................................... 26 TABLE 10 STATE PERCENTILE RANKING FOR RAW SCORE: REGENTS EXAMINATION IN CHEMISTRY ............................................................... 27 TABLE 11 TEST BLUEPRINT, REGENTS EXAMINATION IN CHEMISTRY ...................................................................................................... 29
List of Figures
FIGURE 1 SCATTER PLOT: REGENTS EXAMINATION IN CHEMISTRY ........................................................................................................... 7 FIGURE 2 STUDENT PERFORMANCE MAP: REGENTS EXAMINATION IN CHEMISTRY ................................................................................... 10 FIGURE 3 SCREE PLOT: REGENTS EXAMINATION IN CHEMISTRY ............................................................................................................ 12 FIGURE 4 CONDITIONAL STANDARD ERROR PLOT: REGENTS EXAMINATION IN CHEMISTRY ......................................................................... 23 FIGURE 5 PSEUDO-DECISION TABLE FOR TWO HYPOTHETICAL CATEGORIES ............................................................................................ 24 FIGURE 6 PSEUDO-DECISION TABLE FOR FOUR HYPOTHETICAL CATEGORIES ........................................................................................... 24 FIGURE 7 NEW YORK STATE EDUCATION DEPARTMENT TEST DEVELOPMENT PROCESS ............................................................................. 30
Prepared for NYSED by Pearson 1
Chapter 1: Introduction
1.1 INTRODUCTION
This technical report for the Regents Examination in Chemistry will provide New York State with documentation on the purpose of the Regents Examination, scoring information, evidence of both reliability and validity of the exams, scaling information, and guidelines and reporting information for the August 2016, January 2017, and June 2017 administrations. Chapters 1–5 detail results for the June 2017 administration. Results for the August 2016 and January 2017 administrations are provided in Appendices D and E, respectively. As the Standards for Education and Psychological Testing discusses in Standard 7, “The objective of the documentation is to provide test users with the information needed to help them assess the nature and quality of the test, the resulting scores, and the interpretations based on the test scores” (American Educational Research Association [AERA], American Psychological Association [APA], & National Council on Measurement in Education [NCME], 2014, p.123).1 Please note that a technical report, by design, addresses technical documentation of a testing program; other aspects of a testing program (content standards, scoring guides, guide to test interpretation, equating, etc.) are thoroughly addressed and referenced in supporting documents.
The Regents Examination in Chemistry is given to students enrolled in New York State
schools in August, January, and June. The examination is based on the Chemistry Core Curriculum, which is based on New York State Learning Standards for Chemistry.
1.2 PURPOSES OF THE EXAM
The Regents Examination in Chemistry measures examinee achievement against the New York State (NYS) learning standards. The exam is prepared by teacher examination committees and New York State Education Department (NYSED) subject matter and testing specialists, and it provides teachers and students with important information about student learning and performance against the established curriculum standards. Results of this exam may be used to identify student strengths and needs, in order to guide classroom teaching and learning. The exams also provide students, parents, counselors, administrators, and college admissions officers with objective and easily understood achievement information that may be used to inform empirically based educational and vocational decisions about students. As a state-provided objective benchmark, the Regents Examination in Chemistry is intended for use in satisfying state testing requirements for students who have finished a course in Chemistry. A passing score on the exam counts toward requirements for a high school diploma as described in the New York State diploma requirements: http://www.nysed.gov/common/nysed/files/programs/curriculum-instruction/currentdiplomarequirements2.pdf. Results of the Regents Examination in Chemistry may also be used to satisfy various locally established requirements throughout the state.
1 References to specific Standards will be placed in parentheses throughout the technical report to provide further context for each section.
Prepared for NYSED by Pearson 2
1.3 TARGET POPULATION (STANDARD 7.2)
The examinee population for the Regents Examination in Chemistry is composed of students who have completed a course in Chemistry.
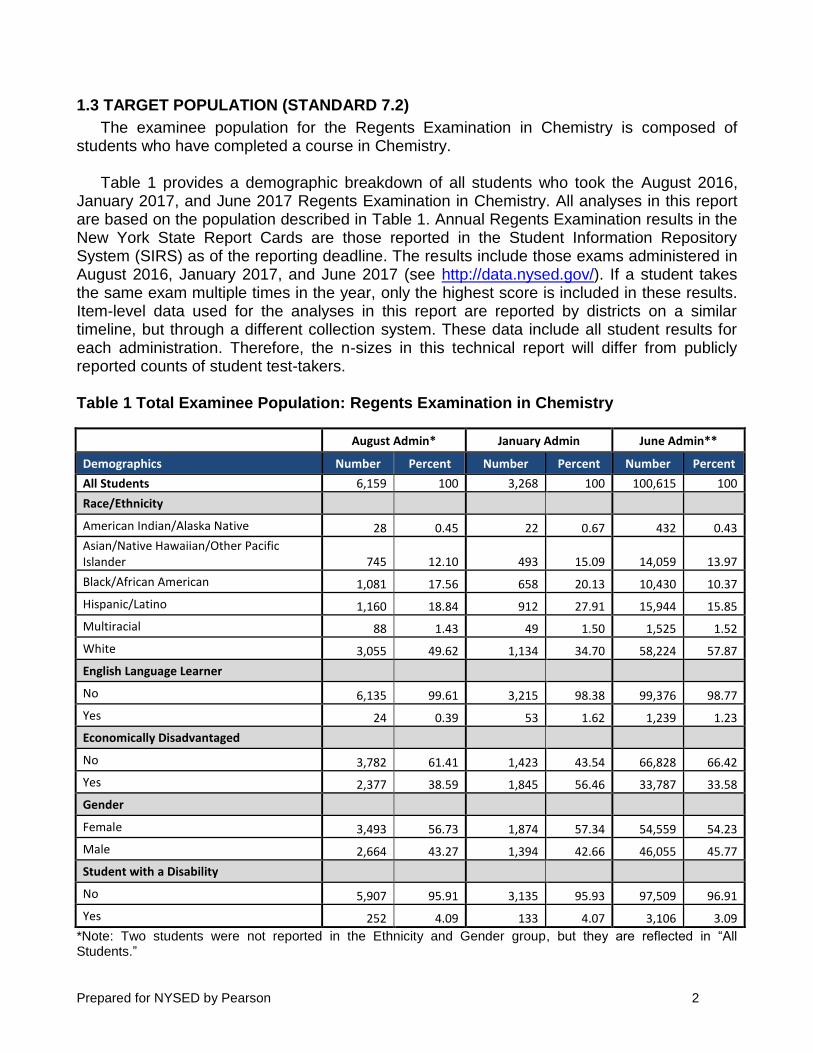
Table 1 provides a demographic breakdown of all students who took the August 2016,
January 2017, and June 2017 Regents Examination in Chemistry. All analyses in this report are based on the population described in Table 1. Annual Regents Examination results in the New York State Report Cards are those reported in the Student Information Repository System (SIRS) as of the reporting deadline. The results include those exams administered in August 2016, January 2017, and June 2017 (see http://data.nysed.gov/). If a student takes the same exam multiple times in the year, only the highest score is included in these results. Item-level data used for the analyses in this report are reported by districts on a similar timeline, but through a different collection system. These data include all student results for each administration. Therefore, the n-sizes in this technical report will differ from publicly reported counts of student test-takers.
Table 1 Total Examinee Population: Regents Examination in Chemistry
August Admin* January Admin June Admin**
Demographics Number Percent Number Percent Number Percent
All Students 6,159 100 3,268 100 100,615 100
Race/Ethnicity
American Indian/Alaska Native 28 0.45 22 0.67 432 0.43
Asian/Native Hawaiian/Other Pacific Islander 745 12.10 493 15.09 14,059 13.97
Black/African American 1,081 17.56 658 20.13 10,430 10.37
Hispanic/Latino 1,160 18.84 912 27.91 15,944 15.85
Multiracial 88 1.43 49 1.50 1,525 1.52
White 3,055 49.62 1,134 34.70 58,224 57.87
English Language Learner
No 6,135 99.61 3,215 98.38 99,376 98.77
Yes 24 0.39 53 1.62 1,239 1.23
Economically Disadvantaged
No 3,782 61.41 1,423 43.54 66,828 66.42
Yes 2,377 38.59 1,845 56.46 33,787 33.58
Gender
Female 3,493 56.73 1,874 57.34 54,559 54.23
Male 2,664 43.27 1,394 42.66 46,055 45.77
Student with a Disability
No 5,907 95.91 3,135 95.93 97,509 96.91
Yes 252 4.09 133 4.07 3,106 3.09
*Note: Two students were not reported in the Ethnicity and Gender group, but they are reflected in “All Students.”

Prepared for NYSED by Pearson 3
**Note: One student was not reported in the Ethnicity and Gender group, but that student is reflected in “All Students.”
Chapter 2: Classical Item Statistics (Standard 4.10) This chapter provides an overview of the two most familiar item-level statistics obtained
from classical item analysis: item difficulty and item discrimination. The following results pertain only to the operational Regents Examination in Chemistry items.
2.1 ITEM DIFFICULTY
At the most general level, an item’s difficulty is indicated by its mean score in some specified group (e.g., grade level).
=
=n
iix
nx
1
1
In the mean score formula above, the individual item scores (xi) are summed and then
divided by the total number of students (n). For multiple-choice (MC) items, student scores are represented by 0s and 1s (0 = wrong, 1 = right). With 0–1 scoring, the equation above also represents the number of students correctly answering the item divided by the total number of students. Therefore, this is also the proportion correct for the item, or the p-value. In theory, p-values can range from 0.00 to 1.00 on the proportion-correct scale.2 For example, if an MC item has a p-value of 0.89, it means that 89 percent of the students answered the item correctly. Additionally, this value might also suggest that the item was relatively easy and/or that the students who attempted the item were relatively high achievers. For constructed-response (CR) items, mean scores can range from the minimum possible score (usually zero) to the maximum possible score. To facilitate average score comparability across MC and CR items, mean item performance for CR items is divided by the maximum score possible so that the p-values for all items are reported as a ratio from 0.0 to 1.0.
Although the p-value statistic does not consider individual student ability in its
computation, it provides a useful view of overall item difficulty, and can provide an early and simple indication of items that are too difficult for the population of students taking the examination. Items with very high or very low p-values receive added scrutiny during all follow-up analyses, including item response theory analyses that factor student ability into estimates of item difficulty. Such items may be removed from the item pool during the test development process, as field testing typically reveals that they add very little measurement information. Items for the June 2017 Regents Examination in Chemistry show a range of p-values consistent with the targeted exam difficulty. Item p-values, presented in Table 2 and Table 3 for multiple-choice and constructed-response items, respectively, range from 0.31 to 0.97, with a mean of 0.71. Table 2 and Table 3 also show a standard deviation (SD) of item score and item mean (Table 3 only).
2 For MC items with four response options, pure random guessing would lead to an expected p-value of 0.25.
Prepared for NYSED by Pearson 4
2.2 ITEM DISCRIMINATION
At the most general level, estimates of item discrimination indicate an item’s ability to differentiate between high and low performance on an item. It is expected that students who perform well on the Regents Examination in Chemistry would be more likely to answer any given item correctly, while low-performing students (i.e., those who perform poorly on the exam overall) would be more likely to answer the same item incorrectly. Pearson’s product-moment correlation coefficient (also commonly referred to as a point-biserial correlation) between item scores and test scores is used to indicate discrimination (Pearson, 1896). The correlation coefficient can range from −1.0 to +1.0. If high-scoring students tend to get the item right while low-scoring students do not, the correlation between the item score and the total test score will be both positive and noticeably large in its magnitude (i.e., above zero), meaning that the item is likely discriminating well between high- and low-performing students. Point-biserials are computed for each answer option, including correct and incorrect options (commonly referred to as “distractors”). Finally, point-biserial values for each distractor are an important part of the analysis. The point-biserial values on the distractors are typically negative. Positive values can indicate that higher-performing students are selecting an incorrect answer or that the item key for the correct answer should be checked.
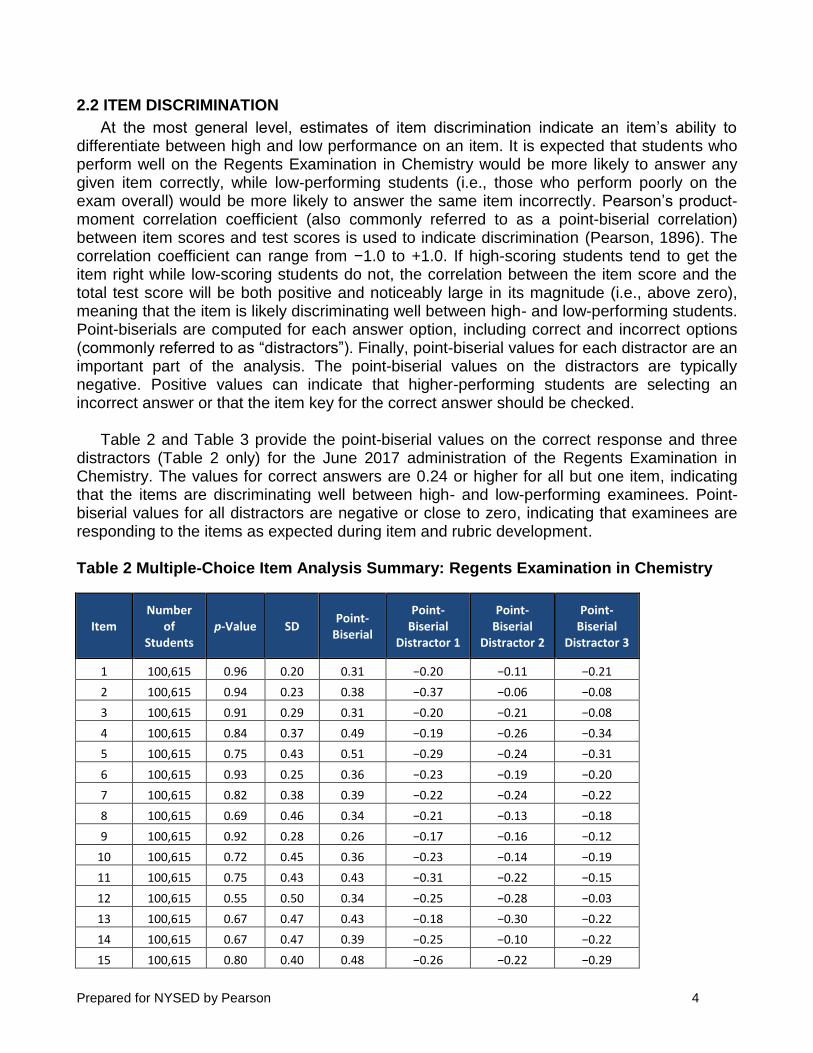
Table 2 and Table 3 provide the point-biserial values on the correct response and three
distractors (Table 2 only) for the June 2017 administration of the Regents Examination in Chemistry. The values for correct answers are 0.24 or higher for all but one item, indicating that the items are discriminating well between high- and low-performing examinees. Point-biserial values for all distractors are negative or close to zero, indicating that examinees are responding to the items as expected during item and rubric development.
Table 2 Multiple-Choice Item Analysis Summary: Regents Examination in Chemistry
Item Number
of Students
p-Value SD Point-
Biserial
Point-Biserial
Distractor 1
Point-Biserial
Distractor 2
Point-Biserial
Distractor 3
1 100,615 0.96 0.20 0.31 −0.20 −0.11 −0.21
2 100,615 0.94 0.23 0.38 −0.37 −0.06 −0.08
3 100,615 0.91 0.29 0.31 −0.20 −0.21 −0.08
4 100,615 0.84 0.37 0.49 −0.19 −0.26 −0.34
5 100,615 0.75 0.43 0.51 −0.29 −0.24 −0.31
6 100,615 0.93 0.25 0.36 −0.23 −0.19 −0.20
7 100,615 0.82 0.38 0.39 −0.22 −0.24 −0.22
8 100,615 0.69 0.46 0.34 −0.21 −0.13 −0.18
9 100,615 0.92 0.28 0.26 −0.17 −0.16 −0.12
10 100,615 0.72 0.45 0.36 −0.23 −0.14 −0.19
11 100,615 0.75 0.43 0.43 −0.31 −0.22 −0.15
12 100,615 0.55 0.50 0.34 −0.25 −0.28 −0.03
13 100,615 0.67 0.47 0.43 −0.18 −0.30 −0.22
14 100,615 0.67 0.47 0.39 −0.25 −0.10 −0.22
15 100,615 0.80 0.40 0.48 −0.26 −0.22 −0.29

Prepared for NYSED by Pearson 5
Item Number
of Students
p-Value SD Point-
Biserial
Point-Biserial
Distractor 1
Point-Biserial
Distractor 2
Point-Biserial
Distractor 3
16 100,615 0.97 0.18 0.28 −0.15 −0.17 −0.15
17 100,615 0.90 0.30 0.37 −0.20 −0.19 −0.23
18 100,615 0.88 0.33 0.33 −0.21 −0.17 −0.19
19 100,615 0.74 0.44 0.46 −0.25 −0.20 −0.26
20 100,615 0.74 0.44 0.39 −0.27 −0.19 −0.15
21 100,615 0.81 0.39 0.32 −0.14 −0.22 −0.18
22 100,615 0.66 0.48 0.37 −0.17 −0.16 −0.30
23 100,615 0.63 0.48 0.49 −0.33 −0.27 −0.14
24 100,615 0.58 0.49 0.38 −0.37 −0.01 −0.29
25 100,615 0.88 0.33 0.27 −0.19 −0.20 −0.12
26 100,615 0.77 0.42 0.38 −0.23 −0.23 −0.19
27 100,615 0.63 0.48 0.42 −0.23 −0.20 −0.21
28 100,615 0.86 0.35 0.49 −0.32 −0.24 −0.24
29 100,615 0.73 0.45 0.45 −0.25 −0.29 −0.15
30 100,615 0.81 0.39 0.36 −0.22 −0.18 −0.21
31 100,615 0.87 0.34 0.43 −0.14 −0.27 −0.28
32 100,615 0.85 0.36 0.46 −0.34 −0.21 −0.18
33 100,615 0.71 0.45 0.41 −0.18 −0.23 −0.23
34 100,615 0.69 0.46 0.51 −0.15 −0.42 −0.19
35 100,615 0.64 0.48 0.24 −0.14 −0.10 −0.13
36 100,615 0.76 0.43 0.53 −0.41 −0.24 −0.14
37 100,615 0.68 0.47 0.49 −0.15 −0.32 −0.26
38 100,615 0.83 0.38 0.41 −0.27 −0.24 −0.18
39 100,615 0.44 0.50 0.37 −0.14 −0.12 −0.22
40 100,615 0.53 0.50 0.41 −0.21 −0.25 −0.11
41 100,615 0.89 0.31 0.34 −0.26 −0.16 −0.14
42 100,615 0.69 0.46 0.34 −0.16 −0.20 −0.16
43 100,615 0.77 0.42 0.38 −0.23 −0.20 −0.19
44 100,615 0.79 0.41 0.35 −0.17 −0.21 −0.21
45 100,615 0.37 0.48 0.36 −0.20 −0.17 −0.08
46 100,615 0.67 0.47 0.52 −0.24 −0.27 −0.29
47 100,615 0.78 0.42 0.45 −0.30 −0.25 −0.14
48 100,615 0.54 0.50 0.47 −0.16 −0.25 −0.24
49 100,615 0.87 0.34 0.30 −0.11 −0.16 −0.22
50 100,615 0.45 0.50 −0.03 −0.09 0.07 0.00

Prepared for NYSED by Pearson 6
Table 3 Constructed-Response Item Analysis Summary: Regents Examination in Chemistry
Item Min. score
Max. score
Number of
Students Mean SD p-Value
Point-Biserial
51 0 1 100,615 0.85 0.35 0.85 0.46
52 0 1 100,615 0.75 0.44 0.75 0.51
53 0 1 100,615 0.72 0.45 0.72 0.51
54 0 1 100,615 0.91 0.29 0.91 0.44
55 0 1 100,615 0.61 0.49 0.61 0.50
56 0 1 100,615 0.76 0.43 0.76 0.43
57 0 1 100,615 0.83 0.38 0.83 0.43
58 0 1 100,615 0.64 0.48 0.64 0.47
59 0 1 100,615 0.57 0.49 0.57 0.47
60 0 1 100,615 0.68 0.47 0.68 0.43
61 0 1 100,615 0.64 0.48 0.64 0.56
62 0 1 100,615 0.80 0.40 0.80 0.53
63 0 1 100,615 0.38 0.49 0.38 0.52
64 0 1 100,615 0.86 0.34 0.86 0.45
65 0 1 100,615 0.54 0.50 0.54 0.42
66 0 1 100,615 0.72 0.45 0.72 0.42
67 0 1 100,615 0.65 0.48 0.65 0.53
68 0 1 100,615 0.83 0.38 0.83 0.42
69 0 1 100,615 0.70 0.46 0.70 0.56
70 0 1 100,615 0.78 0.41 0.78 0.52
71 0 1 100,615 0.61 0.49 0.61 0.57
72 0 1 100,615 0.70 0.46 0.70 0.55
73 0 1 100,615 0.70 0.46 0.70 0.56
74 0 1 100,615 0.76 0.43 0.76 0.53
75 0 1 100,615 0.69 0.46 0.69 0.43
76 0 1 100,615 0.51 0.50 0.51 0.58
77 0 1 100,615 0.71 0.46 0.71 0.55
78 0 1 100,615 0.55 0.50 0.55 0.55
79 0 1 100,615 0.52 0.50 0.52 0.61
80 0 1 100,615 0.53 0.50 0.53 0.48
81 0 1 100,615 0.41 0.49 0.41 0.52
82 0 1 100,615 0.55 0.50 0.55 0.59
83 0 1 100,615 0.31 0.46 0.31 0.43
84 0 1 100,615 0.88 0.32 0.88 0.48
85 0 1 100,615 0.47 0.50 0.47 0.59

Prepared for NYSED by Pearson 7
2.3 DISCRIMINATION ON DIFFICULTY SCATTER PLOT
Figure 1 shows a scatter plot of item discrimination values (y-axis) and item difficulty values (x-axis). The distributions of p-value and point-biserials, including mean, minimum, Q1, median, Q3, and maximum, are also presented in Table 4.
Figure 1 Scatter Plot: Regents Examination in Chemistry
Table 4 Descriptive Statistics in p-value and Point-Biserial Correlation: Regents Examination in Chemistry
Statistics N Mean Min Q1 Median Q3 Max
p-value 85 0.71 0.31 0.63 0.72 0.83 0.97
Point-Biserial 85 0.43 − 0.03 0.37 0.43 0.51 0.61
2.4 OBSERVATIONS AND INTERPRETATIONS
The p-values for the MC items ranged from about 0.37 to 0.97, while the mean proportion-correct values for the CR items (Table 3) ranged from about 0.31 to 0.91. From the difficulty distributions illustrated in the plot, a wide range of item difficulties appeared on each exam, which was one test development goal.
Prepared for NYSED by Pearson 8
Chapter 3: IRT Calibrations, Equating, and Scaling (Standards 2, and 4.10)
The item response theory (IRT) model used for the Regents Examination in Chemistry is based on the work of Georg Rasch (Rasch, 1960). The Rasch model has a long-standing presence in applied testing programs. IRT has several advantages over classical test theory, and it has become the standard procedure for analyzing item response data in large-scale assessments. According to van der Linden and Hambleton (1997), “The central feature of IRT is the specification of a mathematical function relating the probability of an examinee’s response on a test item to an underlying ability.” Ability, in this sense, can be thought of as performance on the test and is defined as “the expected value of observed performance on the test of interest” (Hambleton, Swaminathan, and Roger, 1991). This performance value is
often referred to as . Performance and will be used interchangeably throughout the remainder of this report.
A fundamental advantage of IRT is that it links examinee performance and item difficulty
estimates and places them on the same scale, allowing for an evaluation of examinee performance that considers the difficulty of the test. This is particularly valuable for final test construction and test form equating, as it facilitates a fundamental attention to fairness for all examinees across items and test forms.
This chapter outlines the procedures used for calibrating the operational Regents
Examination in Chemistry items. Generally, item calibration is the process of assigning a difficulty, or item “location,” estimate to each item on an assessment so that all items are placed on a common scale. This chapter briefly introduces the Rasch model, reports the results from evaluations of the adequacy of the Rasch assumptions, and summarizes the Rasch item statistics.
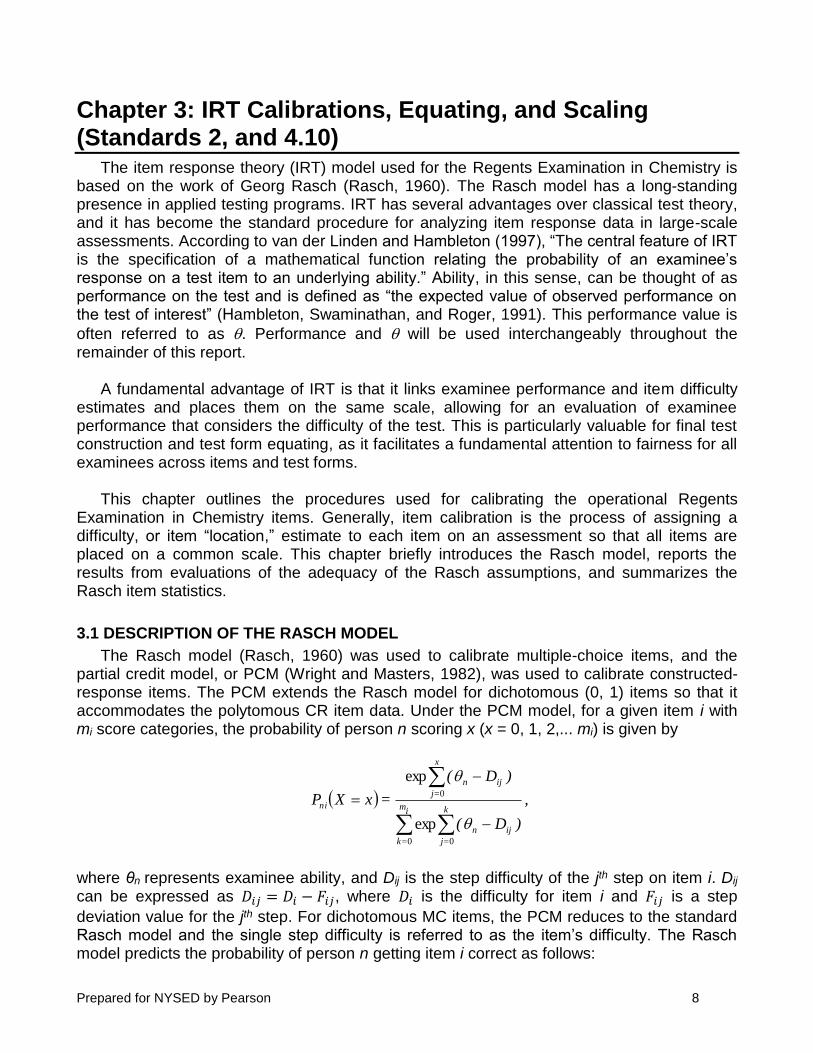
3.1 DESCRIPTION OF THE RASCH MODEL
The Rasch model (Rasch, 1960) was used to calibrate multiple-choice items, and the partial credit model, or PCM (Wright and Masters, 1982), was used to calibrate constructed-response items. The PCM extends the Rasch model for dichotomous (0, 1) items so that it accommodates the polytomous CR item data. Under the PCM model, for a given item i with mi score categories, the probability of person n scoring x (x = 0, 1, 2,... mi) is given by
( ) ,
)D(
)D(
=xXPi
m
=k
k
=j
ijn
x
=j
ijn
ni
−
−
=
0 0
0
exp
exp
where θn represents examinee ability, and Dij is the step difficulty of the jth step on item i. Dij can be expressed as 𝐷𝑖𝑗 = 𝐷𝑖 − 𝐹𝑖𝑗, where 𝐷𝑖 is the difficulty for item i and 𝐹𝑖𝑗 is a step
deviation value for the jth step. For dichotomous MC items, the PCM reduces to the standard Rasch model and the single step difficulty is referred to as the item’s difficulty. The Rasch model predicts the probability of person n getting item i correct as follows:

Prepared for NYSED by Pearson 9
( )( )( )
. exp 1
exp1
ijn
ijn
niD
D=XP
−+
−=
The Rasch model places both performance and item difficulty (estimated in terms of log-
odds or logits) on the same continuum. When the model assumptions are met, the Rasch model provides estimates of examinee performance and item difficulty that are theoretically invariant across random samples of the same examinee population.
3.2 SOFTWARE AND ESTIMATION ALGORITHM
Item calibration was implemented via the WINSTEPS 3.60 computer program (Wright and Linacre, 2015), which employs unconditional (UCON), joint maximum likelihood estimation (JMLE).
3.3 CHARACTERISTICS OF THE TESTING POPULATION
The data analyses reported here are based on all students who took the Regents Examination in Chemistry in the June 2017 administration. The characteristics of this population are provided in Table 1.
3.4. ITEM DIFFICULTY-STUDENT PERFORMANCE MAPS
The distributions of the Rasch item logits (item difficulty estimates) and student performance are shown on the item difficulty-student performance map presented in Figure 2. This graphic illustrates the location of student performance and item difficulty on the same scale, along with their respective distributions and cut scores (indicated by the horizontal dotted lines). The figure shows more difficult items and higher examinee performance at the top and lower performance and easier items at the bottom. Figure 2 also demonstrates that measurement precision tends to be higher at the critical cut scores, based on a concentration of items and students at these locations.

Prepared for NYSED by Pearson 10
Figure 2 Student Performance Map: Regents Examination in Chemistry
3.5 CHECKING RASCH ASSUMPTIONS
Since the Rasch model was the basis of all calibration, scoring, and scaling analyses associated with the Regents Examination in Chemistry, the validity of the inferences from these results depends on the degree to which the assumptions of the model were met and how well the model fits the test data. Therefore, it is important to check these assumptions. This section evaluates the dimensionality of the data, local item independence, and item fit. It should be noted that only operational items were analyzed, since they are the basis of student scores.
Unidimensionality
Rasch models assume that one dominant dimension determines the differences in students’ performances. Principal Components Analysis (PCA) can be used to assess the unidimensionality assumption. The purpose of the analysis is to verify if any other dominant components exist among the items. If any other dimensions are found, the unidimensionality assumption would be violated.
0 2000 4000 6000
Student Distribution
CR(35 Items)MC(50 Items)StudentCut Scores
8 6 4 2 0
Item Distribution
-6
-5
-4
-3
-2
-1
0
1
2
3
4
5
6Theta
Prepared for NYSED by Pearson 11
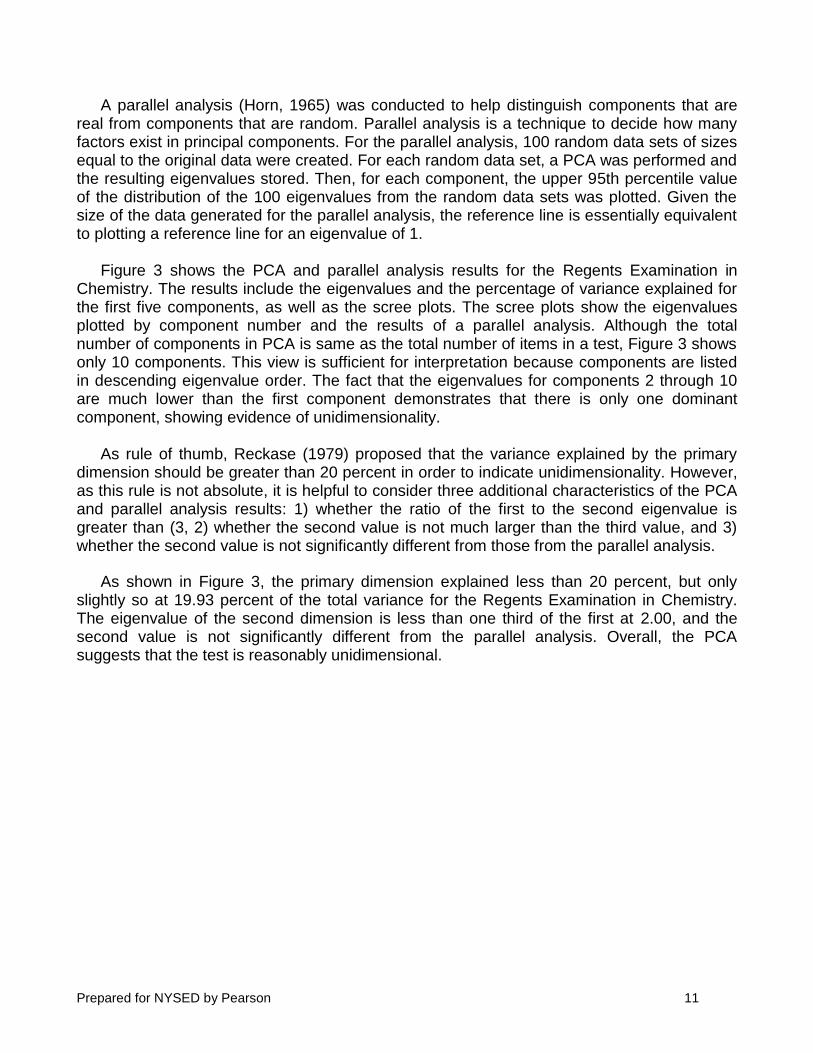
A parallel analysis (Horn, 1965) was conducted to help distinguish components that are real from components that are random. Parallel analysis is a technique to decide how many factors exist in principal components. For the parallel analysis, 100 random data sets of sizes equal to the original data were created. For each random data set, a PCA was performed and the resulting eigenvalues stored. Then, for each component, the upper 95th percentile value of the distribution of the 100 eigenvalues from the random data sets was plotted. Given the size of the data generated for the parallel analysis, the reference line is essentially equivalent to plotting a reference line for an eigenvalue of 1.
Figure 3 shows the PCA and parallel analysis results for the Regents Examination in
Chemistry. The results include the eigenvalues and the percentage of variance explained for the first five components, as well as the scree plots. The scree plots show the eigenvalues plotted by component number and the results of a parallel analysis. Although the total number of components in PCA is same as the total number of items in a test, Figure 3 shows only 10 components. This view is sufficient for interpretation because components are listed in descending eigenvalue order. The fact that the eigenvalues for components 2 through 10 are much lower than the first component demonstrates that there is only one dominant component, showing evidence of unidimensionality.
As rule of thumb, Reckase (1979) proposed that the variance explained by the primary
dimension should be greater than 20 percent in order to indicate unidimensionality. However, as this rule is not absolute, it is helpful to consider three additional characteristics of the PCA and parallel analysis results: 1) whether the ratio of the first to the second eigenvalue is greater than (3, 2) whether the second value is not much larger than the third value, and 3) whether the second value is not significantly different from those from the parallel analysis.
As shown in Figure 3, the primary dimension explained less than 20 percent, but only slightly so at 19.93 percent of the total variance for the Regents Examination in Chemistry. The eigenvalue of the second dimension is less than one third of the first at 2.00, and the second value is not significantly different from the parallel analysis. Overall, the PCA suggests that the test is reasonably unidimensional.

Prepared for NYSED by Pearson 12
Figure 3 Scree Plot: Regents Examination in Chemistry
Local Independence
Local independence (LI) is a fundamental assumption of IRT. This means that, for statistical purposes, an examinee’s response to any one item should not depend on the examinee’s response to any other item on the test. In formal statistical terms, a test X that is comprised of items X1, X2,…Xn is locally independent with respect to the latent variable θ if, for all x = (x1, x2,…xn) and θ,
( ) ( )=
===I
i
ii xXPP1
|| xX .
This formula essentially states that the probability of any pattern of responses across all
items (x), after conditioning on the examinee’s true score ( ) as measured by the test, should be equal to the product of the conditional probabilities across each item (i.e., the multiplication rule for independent events where the joint probabilities are equal to the product of the associated marginal probabilities).
The equation above shows the condition after satisfying the strong form of local independence. A weak form of local independence (WLI) is proposed by McDonald (1979). The distinction is important because many indicators of local dependency are actually framed by WLI. For WLI, the conditional covariances of all pairs of item responses, conditioned on the abilities, are assumed to be equal to zero. When this assumption is met, the joint probability of responses to an item pair, conditioned on the abilities, is the product of the probabilities of responses to these two items, as shown below. Based on the WLI, the following expression can be derived:
1 2 3 4 5 6 7 8 9 10
Component
0
1
2
3
4
5
6
7
8
9
10
11
12
13
14
15
16
17
18
Eig
en
va
lue
5 1.15 1.35
4 1.28 1.51
3 1.33 1.56
2 2.00 2.35
1 16.94 19.93
________________________________
Component Eigenvalue %Variance
ParallelPCA

Prepared for NYSED by Pearson 13
( ) ( ) ( ) |||, jjiijjii xXPxXPxXxXP ===== .
Marais and Andrich (2008) point out that local item dependence in the Rasch model can
occur in two ways that may be difficult to distinguish. The first way occurs when the assumption of unidimensionality is violated. Here, other nuisance dimensions besides a dominant dimension determine student performance (this can be called “trait dependence”). The second way occurs when responses to an item depend on responses to another item. This is a violation of statistical independence and can be called response dependence. By distinguishing the two sources of local dependence, one can see that, while local independence can be related to unidimensionality, the two are different assumptions and therefore require different tests.
Residual item correlations provided in WINSTEPS for each item pair were used to assess
the local dependence between the Regents Examination in Chemistry items. In general, these residuals are computed as follows. First, expected item performance based on the
Rasch model is determined using () and item parameter estimates. Next, deviations (residuals) between the examinees’ expected and observed performance are determined for each item. Finally, for each item pair, a correlation between the respective deviations is computed.
Three types of residual correlations are available in WINSTEPS: raw, standardized, and
logit. It is noted that the raw score residual correlation essentially corresponds to Yen’s Q3 index, a popular statistic used to assess local independence. The expected value for the Q3
statistic is approximately −1/(k − 1) when no local dependence exists, where k is test length (Yen, 1993). Thus, the expected Q3 values should be approximately −0.01 for the items on the exam. Index values that are greater than 0.20 indicate a degree of local dependence that probably should be examined by test developers (Chen & Thissen, 1997).
Since the three residual correlations are very similar, the default “standardized residual
correlation” in WINSTEPS was used for these analyses. Table 5 shows the summary statistics — mean, standard deviation, minimum, maximum, and several percentiles (P10, P25, P50, P75, P90) — for all the residual correlations for each test. The total number of item pairs (N) and the number of pairs with the absolute residual correlations greater than 0.20 are also reported in this table. There was only one item pair flagged with the absolute residual correlation greater than 0.20. The mean residual correlations were very slightly negative at −0.01. Most residual correlations were very small, suggesting that local item independence generally holds for the Regents Examination in Chemistry.

Prepared for NYSED by Pearson 14
Table 5 Summary of Item Residual Correlations: Regents Examination in Chemistry
Statistic Type Value
N 3570
Mean −0.01
SD 0.02
Minimum −0.13
P10 0.03
P25 −0.02
P50 −0.01
P75 0.00
P90 0.01
Maximum 0.39
>|0.20| 1
Item Fit
An important assumption of the Rasch model is that the data for each item fit the model. WINSTEPS provides two item fit statistics (INFIT and OUTFIT) for evaluating the degree to which the Rasch model predicts the observed item responses for a given set of test items. Each fit statistic can be expressed as a mean square (MnSq) statistic or on a standardized metric (Zstd with mean = 0 and variance = 1). MnSq values are more oriented toward practical significance, while Zstd values are more oriented toward statistical significance. INFIT MnSq values are the average of standardized residual variance (the difference between the observed score and the Rasch estimated score divided by the square root of the
Rasch model variance). The INFIT statistic is weighted by the ( ) relative to item difficulty. The expected MnSq value is 1.0 and can range from 0.0 to infinity. Deviation in excess of
the expected value can be interpreted as noise or lack of fit between the items and the model. Values lower than the expected value can be interpreted as item redundancy or overfitting items (too predictable, too much redundancy), and values greater than the expected value indicate underfitting items (too unpredictable, too much noise). Rules of thumb regarding “practically significant” MnSq values vary.
Table 6 presents the summary statistics of INFIT mean square statistics for the Regents
Examination in Chemistry, including the mean, standard deviation, and minimum and maximum values.
The number of items within a targeted range of [0.7, 1.3] is also reported in Table 6. The
mean INFIT value is 1.00, with all items falling in a targeted range of [0.7, 1.3]. As the range of [0.7, 1.3] is used as guide for ideal fit, fit values outside of the range are considered individually. These results indicate that the Rasch model fits the Regents Examination in Chemistry item data well.

Prepared for NYSED by Pearson 15
Table 6 Summary of INFIT Mean Square Statistics: Regents Examination in Chemistry
INFIT Mean Square
N Mean SD Min Max [0.7, 1.3]
Chemistry 85 1.00 0.11 0.83 1.65 [84/85]
Items for the Regents Examination in Chemistry were field tested in 2007–2010 and
2012–2016, and a separate technical report was produced for each year to document the full test development, scoring, scaling, and data analysis conducted.
3.6 SCALING OF OPERATIONAL TEST FORMS
Operational test items were selected based on content coverage, content accuracy, and statistical quality. The sets of items on each operational test conformed to the coverage determined by content experts working from the learning standards established by the New York State Education Department and explicated in the test blueprint. Each item’s classical and Rasch statistics were used to assess item quality. Items were selected to vary in difficulty to accurately measure students’ abilities across the ability continuum. Appendix A contains the operational test maps for the August 2016, January 2017, and June 2017 administrations. Note that statistics presented in the test maps were generated based on the field test data.
All Regents Examinations are pre-equated, meaning that the parameters used to derive the relationship between the raw and scale scores are estimated prior to the construction and administration of the operational form. These field tests are administered to as small a sample of students as possible to minimize the effect on student instructional time across the state. The small n-counts associated with such administrations are sufficient for reasonably accurate estimation of most items’ parameters.
The New York State Regents Examination in Chemistry has three cut scores, which are set at the scale scores of 55, 65, and 85. One of the primary considerations during test construction was to select items so as to minimize changes in the raw scores corresponding to these scale scores. Maintaining a consistent mean Rasch difficulty level from administration to administration facilitates this. For this assessment, the target value for the mean Rasch difficulty was set at −0.088. It should be noted that the raw scores corresponding to the scale score cut scores may still fluctuate, even if the mean Rasch difficulty level is maintained at the target value, due to differences in the distributions of the Rasch difficulty values among the items from administration to administration.
The relationship between raw and scale scores is explicated in the scoring tables for each
administration. These tables for the August 2016, January 2017, and June 2017 administrations can be found in Appendix B. These tables are the end product of the following scaling procedure.
All Regents Examinations are equated back to a base scale, which is held constant from
year to year. Specifically, they are equated to the base scale through the use of a calibrated item pool. The Rasch difficulties from the items’ initial administration in a previous year’s field test are used to equate the scale for the current administration to the base administration. For this examination, the base administration was the June 2004 administration. Scale scores
Prepared for NYSED by Pearson 16
from the August 2016, January 2017, and June 2017 administrations are on the same scale and can be directly compared to scale scores on all previous administrations back to the June 2004 administration.
When the base administration was concluded, the initial raw score to scale score
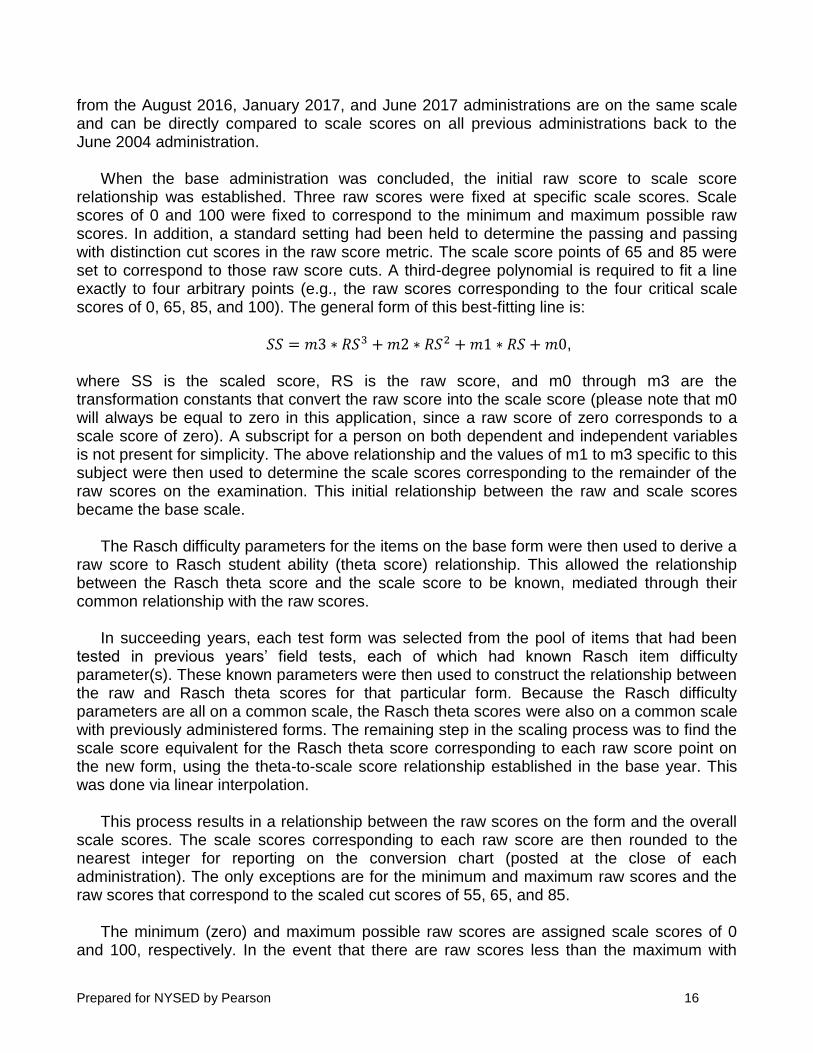
relationship was established. Three raw scores were fixed at specific scale scores. Scale scores of 0 and 100 were fixed to correspond to the minimum and maximum possible raw scores. In addition, a standard setting had been held to determine the passing and passing with distinction cut scores in the raw score metric. The scale score points of 65 and 85 were set to correspond to those raw score cuts. A third-degree polynomial is required to fit a line exactly to four arbitrary points (e.g., the raw scores corresponding to the four critical scale scores of 0, 65, 85, and 100). The general form of this best-fitting line is:
𝑆𝑆 = 𝑚3 ∗ 𝑅𝑆3 + 𝑚2 ∗ 𝑅𝑆2 + 𝑚1 ∗ 𝑅𝑆 + 𝑚0,
where SS is the scaled score, RS is the raw score, and m0 through m3 are the transformation constants that convert the raw score into the scale score (please note that m0 will always be equal to zero in this application, since a raw score of zero corresponds to a scale score of zero). A subscript for a person on both dependent and independent variables is not present for simplicity. The above relationship and the values of m1 to m3 specific to this subject were then used to determine the scale scores corresponding to the remainder of the raw scores on the examination. This initial relationship between the raw and scale scores became the base scale.
The Rasch difficulty parameters for the items on the base form were then used to derive a
raw score to Rasch student ability (theta score) relationship. This allowed the relationship between the Rasch theta score and the scale score to be known, mediated through their common relationship with the raw scores.
In succeeding years, each test form was selected from the pool of items that had been
tested in previous years’ field tests, each of which had known Rasch item difficulty parameter(s). These known parameters were then used to construct the relationship between the raw and Rasch theta scores for that particular form. Because the Rasch difficulty parameters are all on a common scale, the Rasch theta scores were also on a common scale with previously administered forms. The remaining step in the scaling process was to find the scale score equivalent for the Rasch theta score corresponding to each raw score point on the new form, using the theta-to-scale score relationship established in the base year. This was done via linear interpolation.
This process results in a relationship between the raw scores on the form and the overall
scale scores. The scale scores corresponding to each raw score are then rounded to the nearest integer for reporting on the conversion chart (posted at the close of each administration). The only exceptions are for the minimum and maximum raw scores and the raw scores that correspond to the scaled cut scores of 55, 65, and 85.
The minimum (zero) and maximum possible raw scores are assigned scale scores of 0
and 100, respectively. In the event that there are raw scores less than the maximum with
Prepared for NYSED by Pearson 17
scale scores that round to 100, their scale scores are set equal to 99. A similar process is followed with the minimum score; if any raw scores other than zero have scale scores that round to zero, their scale scores are instead set equal to one.
With regard to the cuts, if two or more scale scores round to 55, 65, or 85, the lowest raw
score’s scale score is set equal to 55, 65, or 85 and the scale scores corresponding to the higher raw scores are set to 56, 66, or 86 as appropriate. If no scale score rounds to these critical cuts, then the raw score with the largest scale score that is less than the cut is set equal to the cut. The overarching principle, when two raw scores both round to either scale score cut, is that the lower of the raw scores is always assigned to be equal to the cut so that students are never penalized for this ambiguity.

Prepared for NYSED by Pearson 18
Chapter 4: Reliability (Standard 2) Test reliability is a measure of the internal consistency of a test (Cronbach, 1951). It is a
measure of the extent to which the items on a test provide consistent information about student mastery of a domain. Reliability should ultimately demonstrate that examinee score estimates maximize consistency and therefore minimize error or, theoretically speaking, that examinees who take a test multiple times would get the same score each time.
According to the Standards for Educational and Psychological Testing, “A number of
factors can have significant effects on reliability/precision, and in some cases, these factors can lead to misinterpretations of test scores, if not taken into account” (AERA et al., 2014, p. 38). First, test length and the variability of observed scores can both influence reliability estimates. Tests with fewer items or with a lack of heterogeneity in scores tend to produce lower reliability estimates. Second, reliability is specifically concerned with random sources of error. Accordingly, the degree of inconsistency due to random error sources is what determines reliability: less consistency is associated with lower reliability, and more consistency is associated with higher reliability. Of course, systematic error sources also exist.
The remainder of this chapter discusses reliability results for the Regents Examination in
Chemistry and three additional statistical measures to address the multiple factors affecting an interpretation of the Exam’s reliability:
• standard errors of measurement
• decision consistency
• group means
4.1 RELIABILITY INDICES (STANDARD 2.20)
Classical test theory describes reliability as a measure of the internal consistency of test
scores. The reliability (𝜌𝑋2) is defined as the ratio of true score variance (𝜎𝑇
2) to the observed
score variance (𝜎𝑋2), as presented in the equation below. The total variance contains two
components: 1) the variance in true scores and 2) the variance due to the imperfections in
the measurement process (𝜎𝐸2). Put differently, total variance equals true score variance plus
error variance.3
Reliability coefficients indicate the degree to which differences in test scores reflect true
differences in the attribute being tested rather than random fluctuations. Total test score variance (i.e., individual differences) is partly due to real differences in the construct (true variance) and partly due to random error in the measurement process (error variance).
3 A covariance term is not required, as true scores and error are assumed to be uncorrelated in classical test theory.
22
2
2
22
ET
T
X
TX
+==

Prepared for NYSED by Pearson 19
Reliability coefficients range from 0.0 to 1.0. The index will be 0.0 if none of the test score variances is true. If all test score variances were true, the index would equal 1.0. Such scores would be pure random noise (i.e., all measurement error). If the index achieved a value of 1.0, scores would be perfectly consistent (i.e., contain no measurement error). Although values of 1.0 are never achieved in practice, it is clear that larger coefficients are more desirable because they indicate that the test scores are less influenced by random error.
Coefficient Alpha
Reliability is most often estimated using the formula for Coefficient Alpha, which provides a practical internal consistency index. It can be conceptualized as the extent to which an exchangeable set of items from the same domain would result in a similar rank ordering of students. Note that relative error is reflected in this index. Excessive variation in student performance from one sample of items to the next should be of particular concern for any achievement test user.
A general computational formula for Coefficient Alpha is as follows:
𝛼 = 𝑁
𝑁−1 (1 −
∑ 𝜎𝑌𝑖2𝑁
𝑖=1
𝜎𝑋2 ),
where N is the number of parts (items), 2σX is the variance of the observed total test scores,
and 2σYi is the variance of part i.
4.2 STANDARD ERROR OF MEASUREMENT (STANDARDS 2.13, 2.14, 2.15)
Reliability coefficients best reflect the extent to which measurement inconsistencies may be present or absent. The standard error of measurement (SEM) is another indicator of test score precision that is better suited for determining the effect of measurement inconsistencies for the scores obtained by individual examinees. This is particularly so for conditional SEMs (CSEMs), discussed further below.
Traditional Standard Error of Measurement
The standard error of measurement is defined as the standard deviation of the distribution of observed scores for students with identical true scores. Because the SEM is an index of the random variability in test scores in test score units, it represents important information for test score users. The SEM formula is provided below.
𝑆𝐸𝑀 = 𝑆𝐷√1 − 𝛼 This formula indicates that the value of the SEM depends on both the reliability coefficient
(the Coefficient Alpha, as detailed previously) and the standard deviation of test scores. If the reliability were equal to 0.00 (the lowest possible value), the SEM would be equal to the standard deviation of the test scores. If test reliability were equal to 1.00 (the highest possible value), the SEM would be 0.0. In other words, a perfectly reliable test has no measurement error (Harvill, 1991). Additionally, the value of the SEM takes the group variation (i.e., score
Prepared for NYSED by Pearson 20
standard deviation) into account. Consider that a SEM of 3 on a 10-point test would be very different from a SEM of 3 on a 100-point test.
Traditional Standard Error of Measurement Confidence Intervals
The SEM is an index of the random variability in test scores reported in actual score units, which is why it has such great utility for test score users. SEMs allow statements regarding the precision of individual test scores. SEMs help place “reasonable limits” (Gulliksen, 1950) around observed scores through construction of an approximate score band. Often referred to as confidence intervals, these bands are constructed by taking the observed scores, X, and adding and subtracting a multiplicative factor of the SEM. As an example, students with a given true score will have observed scores that fall between ±1 SEM about two-thirds of the time.4 For ±2 SEM confidence intervals, this increases to about 95 percent.
The Coefficient Alpha and associated SEM for the Regents Examination in Chemistry are
provided in Table 7.
Table 7 Reliabilities and Standard Errors of Measurement: Regents Examination in Chemistry
Subject Coefficient
Alpha SEM
Chemistry 0.95 3.58
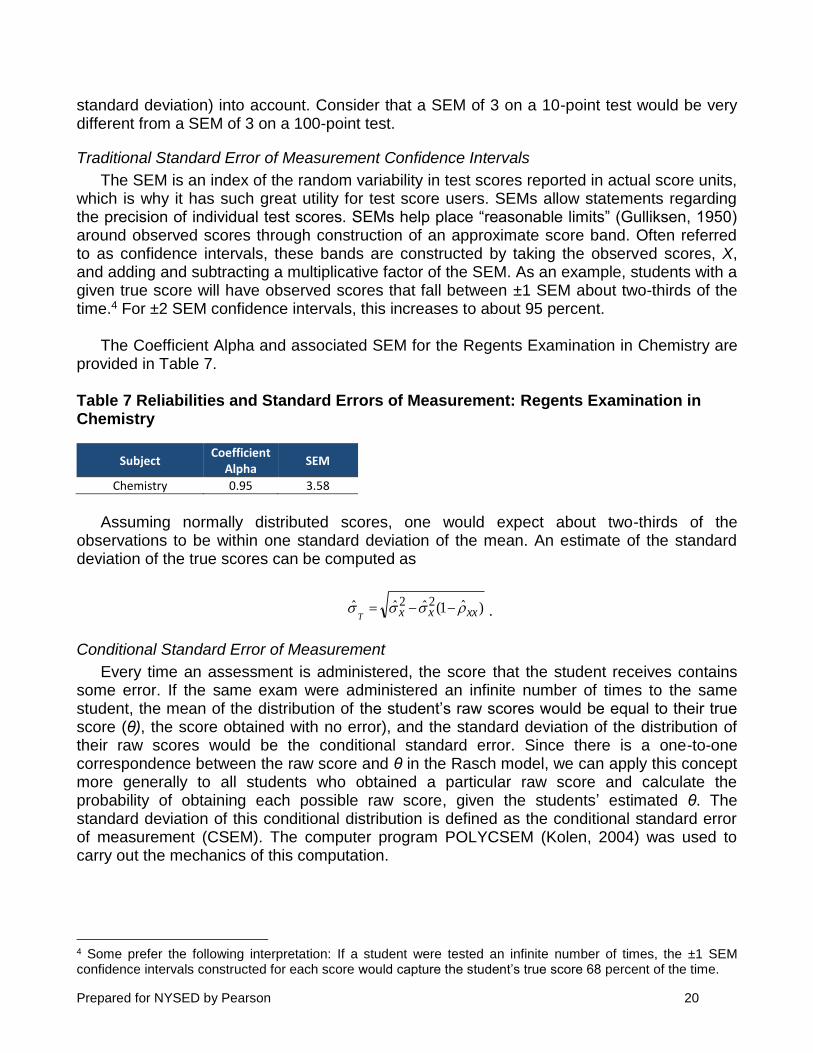
Assuming normally distributed scores, one would expect about two-thirds of the
observations to be within one standard deviation of the mean. An estimate of the standard deviation of the true scores can be computed as
)ˆ1(ˆˆˆ 22xxxxT
−−= .
Conditional Standard Error of Measurement
Every time an assessment is administered, the score that the student receives contains some error. If the same exam were administered an infinite number of times to the same student, the mean of the distribution of the student’s raw scores would be equal to their true score (θ), the score obtained with no error), and the standard deviation of the distribution of their raw scores would be the conditional standard error. Since there is a one-to-one correspondence between the raw score and θ in the Rasch model, we can apply this concept more generally to all students who obtained a particular raw score and calculate the probability of obtaining each possible raw score, given the students’ estimated θ. The standard deviation of this conditional distribution is defined as the conditional standard error of measurement (CSEM). The computer program POLYCSEM (Kolen, 2004) was used to carry out the mechanics of this computation.
4 Some prefer the following interpretation: If a student were tested an infinite number of times, the ±1 SEM confidence intervals constructed for each score would capture the student’s true score 68 percent of the time.

Prepared for NYSED by Pearson 21
The relationship between θ and the scale score is not expressible in a simple mathematical form because it is a blend of the third-degree polynomial relationship between the raw and scale scores and the nonlinear relationship between the expected raw and θ scores. In addition, as the exam is equated from year to year, the relationship between the raw and scale scores moves away from the original third-degree polynomial relationship to one that is also no longer expressible in a simple mathematical form. In the absence of a simple mathematical relationship between θ and the scale scores, the CSEMs that are available for each θ score via Rasch IRT cannot be converted directly to the scale score metric.
The use of Rasch IRT to scale and equate the Regents Examinations does, however,
make it possible to calculate CSEMs using the procedures described by Kolen, Zeng, and Hanson (1996) for dichotomously scored items and extended by Wang, Kolen, and Harris (2000) to polytomously scored items. For tests such as the Regents Examination in Chemistry that have a one-to-one relationship between raw (θ) and scale scores, the CSEM for each achievable scale score can be calculated using the compound multinomial distribution to represent the conditional distribution of raw scores for each level of θ.
Consider an examinee with a certain performance level. If it were possible to measure this
examinee’s performance perfectly, without any error, this measure could be called the examinee’s “true score,” as discussed earlier. This score is equal to the expected raw score. However, whenever an examinee takes a test, the observed test score always includes some level of measurement error. Sometimes this error is positive, and the examinee achieves a higher score than would be expected given his or her level of θ; other times it is negative, and the examinee achieves a lower-than-expected score. If we could give an examinee the same test multiple times and record the observed test scores, the resulting distribution would be the conditional distribution of raw scores for that examinee’s level of θ with a mean value equal to the examinee’s expected raw (true) score. The CSEM for that level of θ in the raw score metric is the square root of the variance of this conditional distribution.
The conditional distribution of raw scores for any level of θ is the compound multinomial
distribution (Wang et al., 2000). An algorithm to compute this can be found in Hanson (1994) and in Thissen, Pommerich, Billeaud, and Williams (1995) and is also implemented in the computer program POLYCSEM (Kolen, 2004). The compound multinomial distribution yields the probabilities that an examinee with a given level of θ has of achieving each achievable raw (and accompanying scale) score. The point values associated with each achievable raw or scale score point can be used to calculate the mean and variance of this distribution in the raw or scale score metric, respectively; the square root of the variance is the CSEM of the raw or scale score point associated with the current level of θ.
Conditional Standard Error of Measurement Confidence Intervals
CSEMs allow statements regarding the precision of individual tests scores. Like SEMs, they help place reasonable limits around observed scaled scores through construction of an approximate score band. The confidence intervals are constructed by adding and subtracting a multiplicative factor of the CSEM.

Prepared for NYSED by Pearson 22
Conditional Standard Error of Measurement Characteristics
The relationship between the scale score CSEM and θ depends both on the nature of the raw-to-scale score transformation (Kolen and Brennan, 2005; Kolen and Lee, 2011) and on whether the CSEM is derived from the raw scores or from θ (Lord, 1980). The pattern of CSEMs for raw scores and linear transformations of the raw score tend to have a characteristic “inverted-U” shape, with smaller CSEMs at the ends of the score continuum and larger CSEMs towards the middle of the distribution.
Achievable raw score points for these distributions are spaced equally across the score
range. Kolen and Brennan (2005, p. 357) state, “When, relative to raw scores, the transformation compresses the scale in the middle and stretches it at the ends, the pattern of the conditional standard errors of measurement will be concave up (U-shaped), even though the pattern for the raw scores was concave down (inverted-U shape).”
Results and Observations
The relationship between raw and scale scores for the Regents Examinations tends to be roughly linear from scale scores of 0 to 65 and then concave down from about 65 to 100. In other words, the scale scores track linearly with the raw scores for the first quarter of the scale score range and then are compressed relative to the raw scores for the remaining three quarters of the range, though there are slight variations. The CSEMs for the Regents Examinations can be expected to have inverted-U shaped patterns, with some variations.
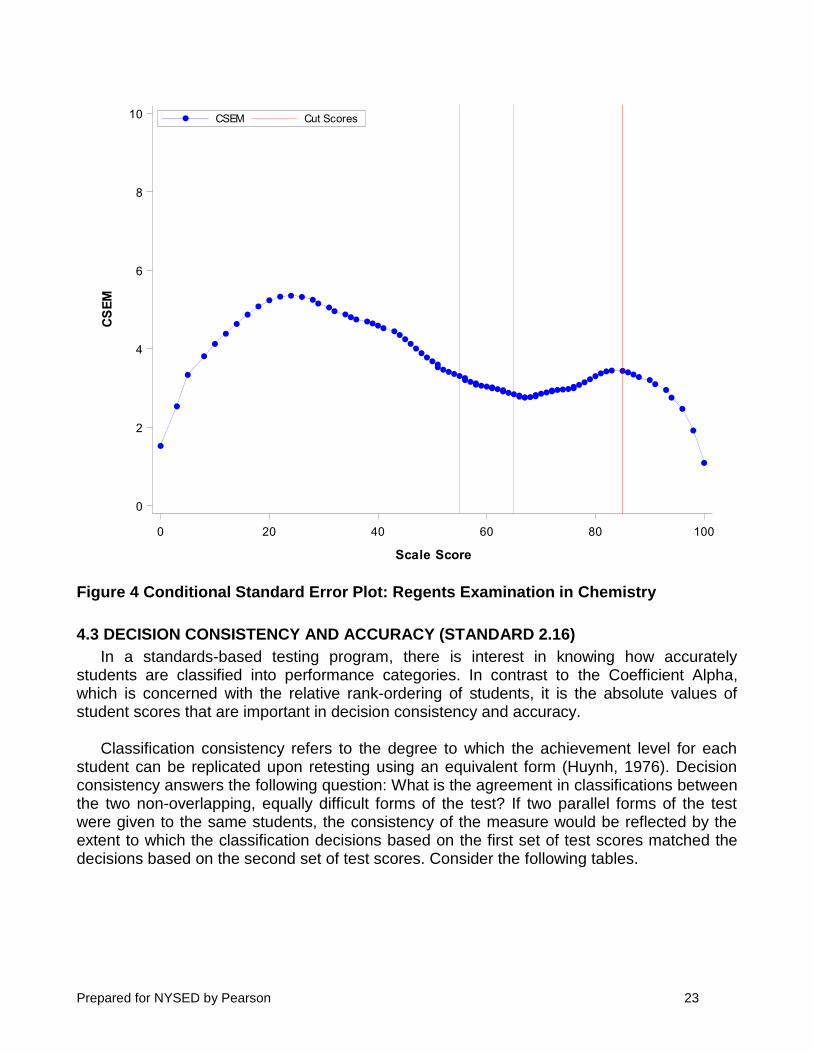
Figure 4 shows this type of CSEM variation for the Regents Examination in Chemistry in
which the compression of raw score to scale scores around the cut score of 65 changes the shape of the curve slightly. This type of expansion and compression can be seen in Figure 4 by looking at the changing density of raw score points along the scale score range on the horizontal axis. Specifically, at the lower end of the scale, scale scores 0 through 38 span raw scores 0 through 19 (20 raw score points for 39 scale score points). Over the range from scale scores 39 to 84, the raw score range is 20 to 73 (54 raw score points for 46 scale score points). Finally, scale scores over the range of 85 to 100 span raw scores of 74 to 85 (12 raw score points for 16 scale score points).
Prepared for NYSED by Pearson 23
Figure 4 Conditional Standard Error Plot: Regents Examination in Chemistry
4.3 DECISION CONSISTENCY AND ACCURACY (STANDARD 2.16)
In a standards-based testing program, there is interest in knowing how accurately students are classified into performance categories. In contrast to the Coefficient Alpha, which is concerned with the relative rank-ordering of students, it is the absolute values of student scores that are important in decision consistency and accuracy.
Classification consistency refers to the degree to which the achievement level for each
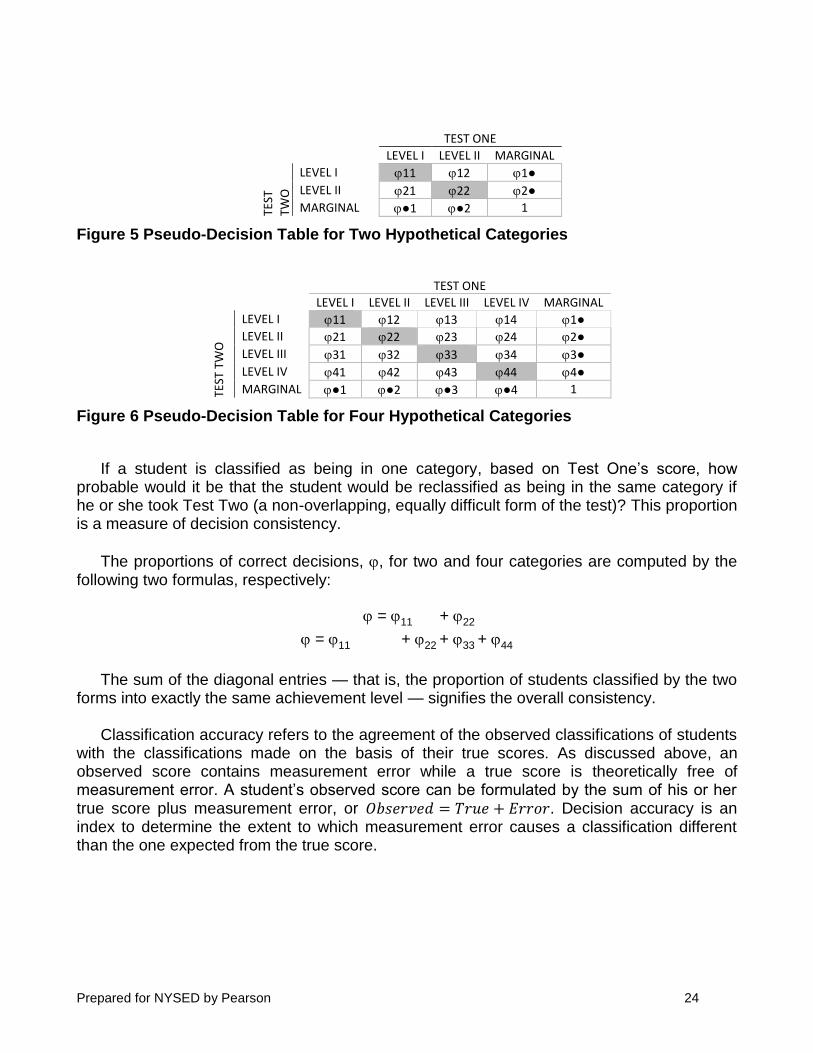
student can be replicated upon retesting using an equivalent form (Huynh, 1976). Decision consistency answers the following question: What is the agreement in classifications between the two non-overlapping, equally difficult forms of the test? If two parallel forms of the test were given to the same students, the consistency of the measure would be reflected by the extent to which the classification decisions based on the first set of test scores matched the decisions based on the second set of test scores. Consider the following tables.
0 20 40 60 80 100
Scale Score
0
2
4
6
8
10C
SE
MCut ScoresCSEM
Prepared for NYSED by Pearson 24
TEST ONE
LEVEL I LEVEL II MARGINAL
TEST
TWO
LEVEL I 11 12 1●
LEVEL II 21 22 2●
MARGINAL ●1 ●2 1
Figure 5 Pseudo-Decision Table for Two Hypothetical Categories
TEST ONE
LEVEL I LEVEL II LEVEL III LEVEL IV MARGINAL
TEST
TW
O
LEVEL I 11 12 13 14 1●
LEVEL II 21 22 23 24 2●
LEVEL III 31 32 33 34 3●
LEVEL IV 41 42 43 44 4●
MARGINAL ●1 ●2 ●3 ●4 1
Figure 6 Pseudo-Decision Table for Four Hypothetical Categories
If a student is classified as being in one category, based on Test One’s score, how
probable would it be that the student would be reclassified as being in the same category if he or she took Test Two (a non-overlapping, equally difficult form of the test)? This proportion is a measure of decision consistency.
The proportions of correct decisions, , for two and four categories are computed by the following two formulas, respectively:
= 11 + 22
= 11 + 22 + 33 + 44
The sum of the diagonal entries — that is, the proportion of students classified by the two
forms into exactly the same achievement level — signifies the overall consistency. Classification accuracy refers to the agreement of the observed classifications of students
with the classifications made on the basis of their true scores. As discussed above, an observed score contains measurement error while a true score is theoretically free of measurement error. A student’s observed score can be formulated by the sum of his or her true score plus measurement error, or 𝑂𝑏𝑠𝑒𝑟𝑣𝑒𝑑 = 𝑇𝑟𝑢𝑒 + 𝐸𝑟𝑟𝑜𝑟. Decision accuracy is an index to determine the extent to which measurement error causes a classification different than the one expected from the true score.
Prepared for NYSED by Pearson 25
Since true scores are unobserved and decision consistency is computed based on a single administration of the Regents Examination in Chemistry, a statistical model using solely data from the available administration is used to estimate the true scores and to project the consistency and accuracy of classifications (Hambleton & Novick, 1973). Although a number of procedures are available, a well-known method developed by Livingston and Lewis (1995) that utilizes a specific true score model is used.
Several factors might affect decision consistency and accuracy. One important factor is
the reliability of the scores. All other things being equal, more reliable test scores tend to result in more similar reclassifications and less measurement error. Another factor is the location of the cut score in the score distribution. More consistent and accurate classifications are observed when the cut scores are located away from the mass of the score distribution. The number of performance levels is also a consideration. Consistency and accuracy indices based on four performance levels should be lower than those based on two performance levels. This is not surprising, since classification and accuracy using four performance levels would allow more opportunity to change performance levels. Hence, there would be more classification errors and less accuracy with four performance levels, resulting in lower consistency indices.
Results and Observations
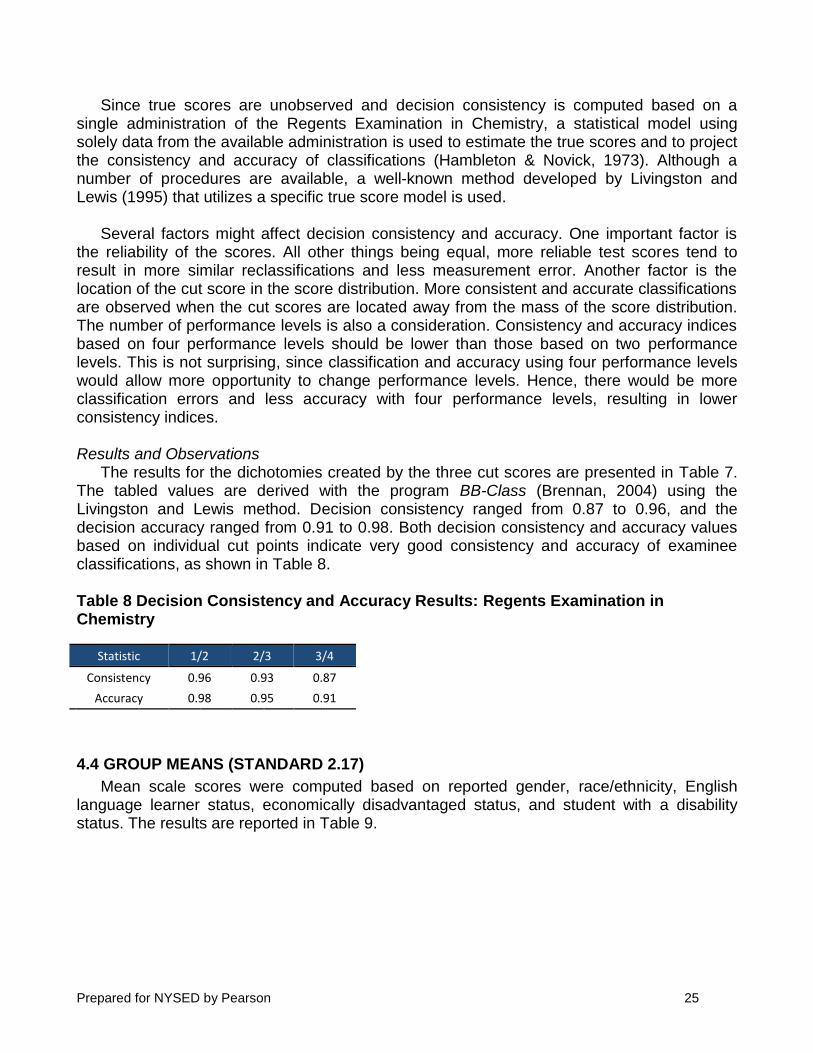
The results for the dichotomies created by the three cut scores are presented in Table 7. The tabled values are derived with the program BB-Class (Brennan, 2004) using the Livingston and Lewis method. Decision consistency ranged from 0.87 to 0.96, and the decision accuracy ranged from 0.91 to 0.98. Both decision consistency and accuracy values based on individual cut points indicate very good consistency and accuracy of examinee classifications, as shown in Table 8.
Table 8 Decision Consistency and Accuracy Results: Regents Examination in Chemistry
Statistic 1/2 2/3 3/4
Consistency 0.96 0.93 0.87
Accuracy 0.98 0.95 0.91
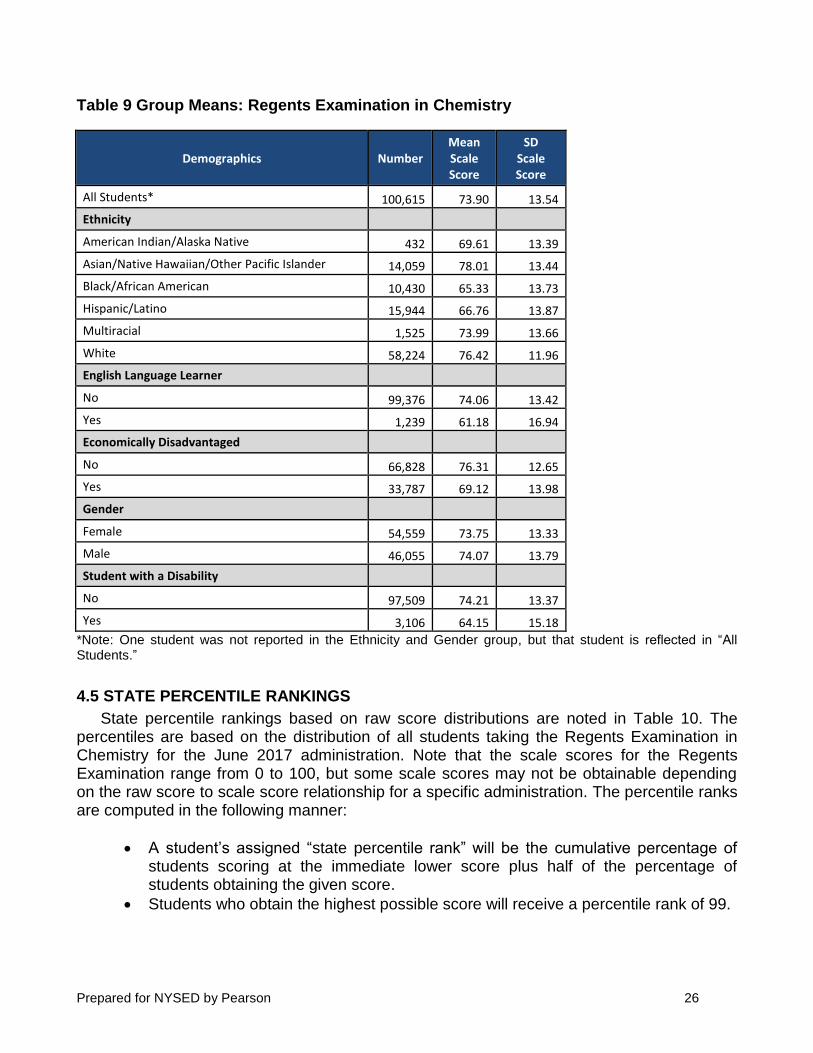
4.4 GROUP MEANS (STANDARD 2.17)
Mean scale scores were computed based on reported gender, race/ethnicity, English language learner status, economically disadvantaged status, and student with a disability status. The results are reported in Table 9.
Prepared for NYSED by Pearson 26
Table 9 Group Means: Regents Examination in Chemistry
Demographics Number Mean Scale Score
SD Scale Score
All Students* 100,615 73.90 13.54
Ethnicity
American Indian/Alaska Native 432 69.61 13.39
Asian/Native Hawaiian/Other Pacific Islander 14,059 78.01 13.44
Black/African American 10,430 65.33 13.73
Hispanic/Latino 15,944 66.76 13.87
Multiracial 1,525 73.99 13.66
White 58,224 76.42 11.96
English Language Learner
No 99,376 74.06 13.42
Yes 1,239 61.18 16.94
Economically Disadvantaged
No 66,828 76.31 12.65
Yes 33,787 69.12 13.98
Gender
Female 54,559 73.75 13.33
Male 46,055 74.07 13.79
Student with a Disability
No 97,509 74.21 13.37
Yes 3,106 64.15 15.18
*Note: One student was not reported in the Ethnicity and Gender group, but that student is reflected in “All Students.”
4.5 STATE PERCENTILE RANKINGS
State percentile rankings based on raw score distributions are noted in Table 10. The percentiles are based on the distribution of all students taking the Regents Examination in Chemistry for the June 2017 administration. Note that the scale scores for the Regents Examination range from 0 to 100, but some scale scores may not be obtainable depending on the raw score to scale score relationship for a specific administration. The percentile ranks are computed in the following manner:
• A student’s assigned “state percentile rank” will be the cumulative percentage of students scoring at the immediate lower score plus half of the percentage of students obtaining the given score.
• Students who obtain the highest possible score will receive a percentile rank of 99.
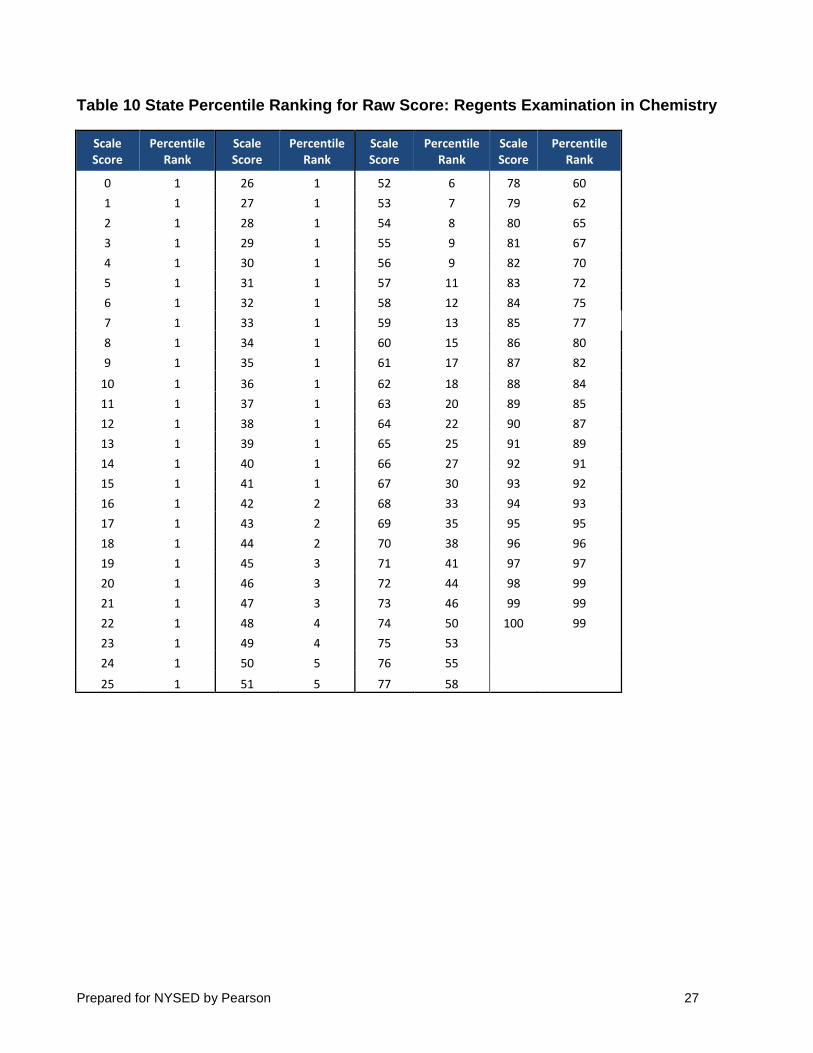
Prepared for NYSED by Pearson 27
Table 10 State Percentile Ranking for Raw Score: Regents Examination in Chemistry
Scale Score
Percentile Rank
Scale Score
Percentile Rank
Scale Score
Percentile Rank
Scale Score
Percentile Rank
0 1 26 1 52 6 78 60
1 1 27 1 53 7 79 62
2 1 28 1 54 8 80 65
3 1 29 1 55 9 81 67
4 1 30 1 56 9 82 70
5 1 31 1 57 11 83 72
6 1 32 1 58 12 84 75
7 1 33 1 59 13 85 77
8 1 34 1 60 15 86 80
9 1 35 1 61 17 87 82
10 1 36 1 62 18 88 84
11 1 37 1 63 20 89 85
12 1 38 1 64 22 90 87
13 1 39 1 65 25 91 89
14 1 40 1 66 27 92 91
15 1 41 1 67 30 93 92
16 1 42 2 68 33 94 93
17 1 43 2 69 35 95 95
18 1 44 2 70 38 96 96
19 1 45 3 71 41 97 97
20 1 46 3 72 44 98 99
21 1 47 3 73 46 99 99
22 1 48 4 74 50 100 99
23 1 49 4 75 53
24 1 50 5 76 55
25 1 51 5 77 58

Prepared for NYSED by Pearson 28
Chapter 5: Validity (Standard 1) Restating the purpose and uses of the Regents Examination in Chemistry, this exam
measures examinee achievement against the New York State learning standards. The exam is prepared by teacher examination committees and New York State Education Department subject matter and testing specialists, and it provides teachers and students with important information about student learning and performance against the established curriculum standards. Results of this exam may be used to identify student strengths and needs in order to guide classroom teaching and learning. The exams also provide students, parents, counselors, administrators, and college admissions officers with objective and easily understood achievement information that may be used to inform empirically based educational and vocational decisions about students. As a state-provided objective benchmark, the Regents Examination in Chemistry is intended for use in satisfying state testing requirements for students who have finished a course in Chemistry. A passing score on the exam counts toward requirements for a high school diploma, as described in the New York State diploma requirements: http://www.nysed.gov/common/nysed/files/programs/curriculum-instruction/currentdiplomarequirements2.pdf. Results of the Regents Examination in Chemistry may also be used to satisfy various locally established requirements throughout the state.
The validity of score interpretations for the Regents Examination in Chemistry is
supported by multiple sources of evidence. Chapter 1 of the Standards for Educational Psychological Testing (AERA et al., 2014) specifies five sources of validity evidence that are important to gather and document in order to support validity claims for an assessment:
• test content
• response processes
• internal test structure
• relation to other variables
• consequences of testing It is important to note that these categories are not mutually exclusive. One source of
validity evidence often falls into more than one category, as discussed in more detail in this chapter. Nevertheless, these classifications provide a useful framework within the Standards (AERA et al., 2014) for the discussion and documentation of validity evidence, so they are used here. The process of gathering evidence of the validity of score interpretations is best characterized as ongoing throughout test development, administration, scoring, reporting, and beyond.
5.1 EVIDENCE BASED ON TEST CONTENT
The validity of test content is fundamental to arguments that test scores are valid for their intended purpose. It demands that a test developer provide evidence that test content is well-aligned with the framework and standards used in curriculum and instruction. Accordingly, detailed attention was given to this correspondence between standards and test content during test design and construction.
Prepared for NYSED by Pearson 29
The Regents Examination in Chemistry measures student achievement on the New York State Learning Standards for Chemistry. The standards can be found at: http://www.nysed.gov/common/nysed/files/programs/curriculum-instruction/chemist.pdf.
Content Validity
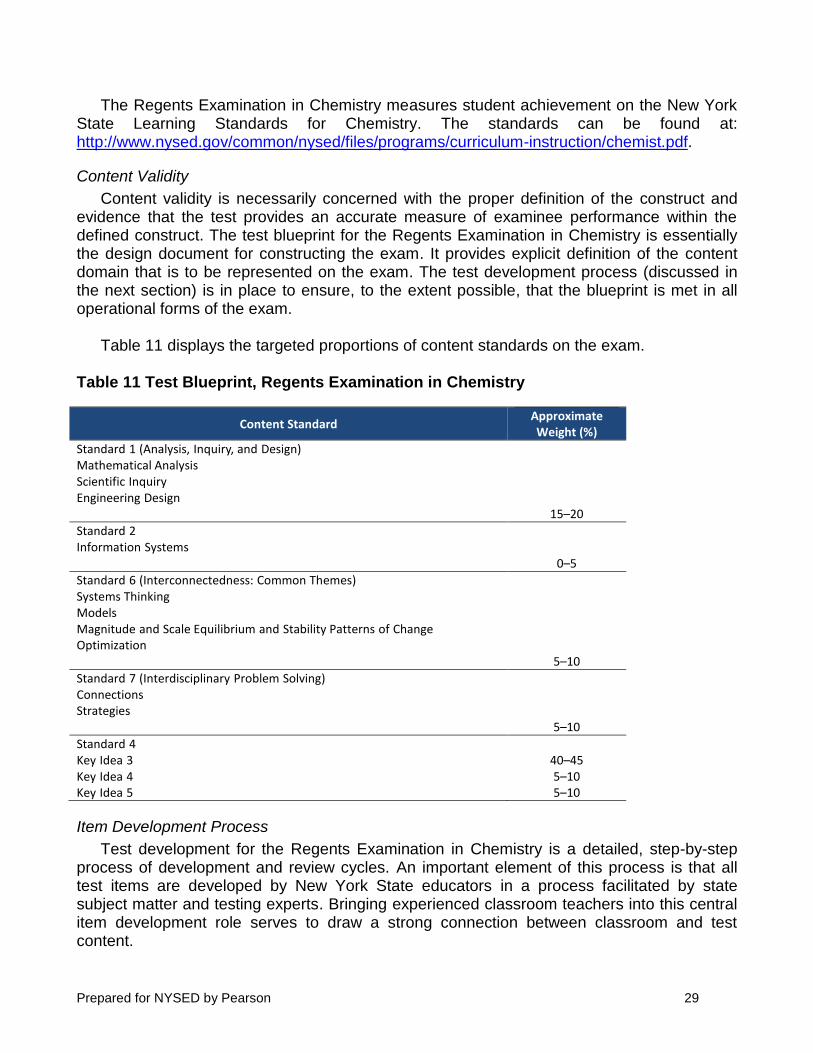
Content validity is necessarily concerned with the proper definition of the construct and evidence that the test provides an accurate measure of examinee performance within the defined construct. The test blueprint for the Regents Examination in Chemistry is essentially the design document for constructing the exam. It provides explicit definition of the content domain that is to be represented on the exam. The test development process (discussed in the next section) is in place to ensure, to the extent possible, that the blueprint is met in all operational forms of the exam.
Table 11 displays the targeted proportions of content standards on the exam.
Table 11 Test Blueprint, Regents Examination in Chemistry
Content Standard Approximate Weight (%)
Standard 1 (Analysis, Inquiry, and Design) Mathematical Analysis Scientific Inquiry Engineering Design
15–20
Standard 2 Information Systems
0–5
Standard 6 (Interconnectedness: Common Themes) Systems Thinking Models Magnitude and Scale Equilibrium and Stability Patterns of Change Optimization
5–10
Standard 7 (Interdisciplinary Problem Solving) Connections Strategies
5–10
Standard 4 Key Idea 3 40–45 Key Idea 4 5–10 Key Idea 5 5–10
Item Development Process
Test development for the Regents Examination in Chemistry is a detailed, step-by-step process of development and review cycles. An important element of this process is that all test items are developed by New York State educators in a process facilitated by state subject matter and testing experts. Bringing experienced classroom teachers into this central item development role serves to draw a strong connection between classroom and test content.

Prepared for NYSED by Pearson 30
Only New York State-certified educators may participate in this process. The New York State Education Department asks for nominations from districts, and all recruiting is done with diversity of participants in mind, including diversity in gender, ethnicity, geographic region, and teaching experience. Educators with item-writing skills from around the state are retained to write all items for the Regents Examination in Chemistry, under strict guidelines that leverage best practices (see Appendix C). State educators also conduct all item quality and bias reviews to ensure that item content is appropriate to the construct being measured and fair for all students. Finally, educators use the defined standards, test blueprint targets, and statistical information generated during field testing to select the highest quality items for use in the operational test.
Figure 7 summarizes the full test development process, with steps 3 and 4 addressing
initial item development and review. This figure also demonstrates the ongoing nature of ensuring the content validity of items through field test trials, and final item selection for operational testing.
Initial item development is conducted under the criteria and guidance provided by the
Department. Both multiple-choice and constructed-response items are included in the Regents Examination in Chemistry to ensure appropriate coverage of the construct domain.
Figure 7 New York State Education Department Test Development Process

Prepared for NYSED by Pearson 31
Item Review Process
The item review process helps to ensure the consistent application of rigorous item reviews intended to assess the quality of the items developed and identify items that require edits or removal from the pool of items to be field tested. This process allows high-quality items to be continually developed in a manner that is consistent with the test blueprint.
All reviewers participate in rigorous training designed to assist in a consistent
interpretation of the standards throughout the item review process. This is a critical step in item development because consistency between the standards and what the items are asking examinees is a fundamental form of evidence of the validity of the intended score interpretations. Another integral component of this item review process is to review the scoring rules, or “rubrics,” for their clarity and consistency in what the examinee is being asked to demonstrate by responding to each item. Each of these elements of the review process is in place, ultimately, to target fairness for all students by targeting consistency in examinee scores and providing evidence of the validity of their interpretations.
Specifically, the item review process articulates the four major item characteristics that the
New York State Education Department looks for when developing quality items:
1. language and graphical appropriateness 2. sensitivity/bias 3. fidelity of measurement to standards 4. conformity to the expectations for the specific item types and formats
Each section of the criteria includes pertinent questions that help reviewers determine whether an item is of sufficient quality. Within the first two categories, criteria for language appropriateness are used to help ensure that students understand what is asked in each question and that the language in the question does not adversely affect a student’s ability to perform the required task. Similarly, sensitivity/bias criteria are used to evaluate whether questions are unbiased, non-offensive, and not disadvantageous to any given subgroup(s).
The third category of item review, alignment, addresses how each item measures a given
standard. This category asks the reviewer to comment on key aspects of how the item addresses and calls for the skills demanded by the standards.
The fourth category addresses the specific demands for different item types and
formats. Reviewers evaluate each item to ensure that it conforms to the given requirements. For example, multiple-choice items must have, among other characteristics, one unambiguously correct answer and several plausible, but incorrect, answer choices. Following these reviews, only items that are approved by an assigned educator panel move forward for field testing.
Ongoing attention is also given to the relevance of the standards used to guide curriculum
and assessment. Consistent with a desire to assess this relevance, the New York State Education Department is committed to ongoing standards review over time and periodically solicits thoughtful, specific responses from stakeholders about individual standards within the NYS P–12 Standards.

Prepared for NYSED by Pearson 32
5.2 EVIDENCE BASED ON RESPONSE PROCESSES
The second source of validity evidence is based on examinee response processes. This standard requires evidence that examinees are responding in the manner intended by the test items and rubrics and that raters are scoring those responses in a manner that is consistent with the rubrics. Accordingly, it is important to control and monitor whether construct-irrelevant variance in response patterns has been introduced at any point in the test development, administration, or scoring processes.
The controls and monitoring in place for the Regents Examination in Chemistry include
the item development process, with attention paid to mitigating the introduction of construct-irrelevant variance. The development process described in the previous sections details the process and attention given to reducing the potential for construct irrelevance in response processes by attending to the quality and alignment of test content to the test blueprint and to the item development guidelines (Appendix C). Further evidence is documented in the test administration and scoring procedures, as well as in the results of statistical analyses, which are covered in the following two sections.
Administration and Scoring
Adherence to standardized administration procedures is fundamental to the validity of test scores and their interpretation, as such procedures allow for adequate and consistently applied conditions for scoring the work of every student who takes the examination. For this reason, guidelines, which are contained in the School Administrator’s Manual, Secondary Level Examinations (http://www.p12.nysed.gov/assessment/sam/secondary/hssam-update.html), have been developed and implemented for the New York State Regents testing program. All secondary-level Regents Examinations are administered under these standard conditions, in order to support valid inferences for all students. These standard procedures also cover testing students with disabilities who are provided testing accommodations consistent with their Individualized Education Programs (IEPs) or Section 504 Accommodation Plans (504 Plans). Full test administration procedures are available at http://www.p12.nysed.gov/assessment/hsgen/.
The implementation of rigorous scoring procedures directly supports the validity of the
scores. Regents test-scoring practices therefore focus on producing high-quality scores. Multiple-choice items are scored via local scanning at testing centers, and trained educators score constructed-response items. There are many studies that focus on various elements of producing valid and reliable scores for constructed-response items, but generally, attention to the following all contribute to valid and reliable scores for constructed-response items:
1. Quality training (Hoyt & Kerns, 1999; Lumley & McNamara, 1995; Wang, Wong, and Kwong, 2010; Gorman & Rentsch, 2009; Schleicher, Day, Bronston, Mayes, and Riggo, 2002; Woehr & Huffcutt, 1994; Johnson, Penny, and Gordon, 2008; Weigle, 1998)
2. Detection and correction of rating bias (McQueen & Congdon, 1997; Congdon & McQueen, 2000; Myford & Wolfe, 2009; Barkaoui, 2011; Patz, Junker, Johnson, and Mariano, 2002)

Prepared for NYSED by Pearson 33
3. Consistency or reliability of ratings (Congdon & McQueen, 2000; Harik, Clauser, Grabovsky, Nungester, Swanson, & Nandakumar, 2009; McQueen & Congdon, 1997; Myford & Wolfe, 2009; Mero & Motowidlo, 1995; Weinrott & Jones, 1984)
4. Rubric designs that facilitate consistency of ratings (Pecheone & Chung, 2006; Wolfe & Gitomer, 2000; Cronbach, Linn, Brennan, & Haertel, 1995; Cook & Beckman, 2009; Penny, Johnson, & Gordon, 2000; Smith, 1993; Leacock, Gonzalez, and Conarroe, 2014)
The distinct steps for operational test scoring include close attention to each of these
elements and begin before the operational test is even selected. After the field test process, during which many more items than appear on the operational test are administered to a representative sample of students, a set of “anchor” papers representing student responses across the range of possible responses for constructed-response items is selected. The objective of these “range-finding” efforts is to create a training set for scorer training and execution, the scores from which are used to generate important statistical information about the item. Training scorers to produce reliable and valid scores is the basis for creating rating guides and scoring ancillaries to be used during operational scoring.
To review and select these anchor papers, NYS educators serve as table leaders during
the range-finding session. In the range-finding process, committees of educators receive a set of student papers for each field-tested question. Committee members familiarize themselves with each item type and score a number of responses that are representative of each of the different score points. After the independent scoring is completed, the committee reviews and discusses their results and determines consensus scores for the student responses. During this process, atypical responses are important to identify and annotate for use in training and live scoring. The range-finding results are then used to build training materials for the vendor’s scorers, who then score the rest of the field test responses to constructed-response items. The final model response sets for the August 2016, January 2017, and June 2017 administrations of the Regents Examination in Chemistry are located at http://www.nysedregents.org/Chemistry.
During the range-finding and field test scoring processes, it is important to be aware of
and control for sources of variation in scoring. One possible source of variation in constructed-response scores is unintended rater bias associated with items and examinee responses. Because the rater is often unaware of such bias, this type of variation may be the most challenging source of variation in scoring to control and measure. Rater biases can appear as severity or leniency in applying the scoring rubric. Bias also includes phenomena such as the halo effect, which occurs when good or poor performance on one element of the rubric encourages inaccurate scoring of other elements. These types of rater bias can be effectively controlled by training practices with a strict focus on rubric requirements.
The training process for operational scoring by state educators begins with a review and
discussion of actual student work on constructed-response test items. This helps raters understand the range and characteristics typical of examinee responses, as well as the kinds of mistakes that students commonly make. This information is used to train raters on how to consistently apply key elements of the scoring rubric across the domain of student responses.

Prepared for NYSED by Pearson 34
Raters then receive training consistent with the guidelines and ancillaries produced after field testing and are allowed to practice scoring prior to the start of live scoring. Throughout the scoring process, there are important procedures for correcting inconsistent scoring or the misapplication of scoring rubrics for constructed-response items. When monitoring and correction do not occur during scoring, construct-irrelevant variation may be introduced. Accordingly, a scoring lead may be assigned to review the consistency of scoring for their assigned staff against model responses and to be available for consultation throughout the scoring process.
Attention to the rubric design also fundamentally contributes to the validity of examinee
response processes. The rubric specifies what the examinee needs to provide as evidence of learning based on the question asked. The more explicit the rubric (and the item), the more clear the response expectations are for examinees. To facilitate the development of constructed-response scoring rubrics, NYSED training for writing items includes specific attention to rubric development as follows:
• The rubric should clearly specify the criteria for awarding each credit.
• The rubric should be aligned to what is asked for in the item and correspond to the knowledge or skill being assessed.
• Whenever possible, the rubric should be written to allow for alternative approaches and other legitimate methods.
In support of the goal of valid score interpretations for each examinee, then, such scoring
training procedures are implemented for the Regents Examination in Chemistry. Operational raters are selected based on expertise in the exam subject and are assigned a specific set of items to score. No more than approximately one-half of the items on the test are assigned to any one rater. This has the effect of increasing the consistency of scoring across examinee responses by allowing each rater to focus on a subset of items. It also assures that no one rater is allowed to score the entire test for any one student. This practice reduces the effect of any potential bias of a single rater on individual examinees. Additionally, no rater is allowed to score the responses of his or her own students.
Statistical Analysis
One statistic that is useful for evaluating the response processes for multiple-choice items is an item’s point-biserial correlation on the distractors. A high point-biserial on a distractor may indicate that students are not able to identify the correct response for a reason other than the difficulty of the item. A finding of poor model fit for an item may also support a finding that examinees are not responding the way that the item developer intended them to. As documented in Table 2, the point-biserial statistics for distractors in the multiple-choice items all appear to be negative or close to zero, indicating that, for the most part, examinees are not being drawn to an unintended construct.
5.3 EVIDENCE BASED ON INTERNAL STRUCTURE
The third source of validity evidence comes from the internal structure of the test. This requires that test developers evaluate the test structure to ensure that the test is functioning as intended. Such an evaluation may include attention to item interactions, tests of dimensionality, or indications of test bias for or against one or more subgroups of examinees

Prepared for NYSED by Pearson 35
detected by differential item functioning (DIF) analysis. Evaluation of internal test structure also includes a review of the results of classical item analyses, test reliability, and the IRT scaling and equating.
The following analyses were conducted for the Regents Examination in Chemistry:
• item difficulty
• item discrimination
• differential item functioning
• IRT model fit
• test reliability
• classification consistency
• test dimensionality
Item Difficulty
Multiple analyses allow an evaluation of item difficulty. For this exam, p-values and Rasch difficulty (item location) estimates were computed for MC and CR items. Items for the Regents Examination in Chemistry show a range of p-values consistent with the targeted exam difficulty. Item p-values range from 0.31 to 0.97, with a mean of 0.71. The difficulty distribution illustrated in Figure 1 shows a wide range of item difficulties on the exam. This is consistent with general test development practice, which seeks to measure student ability along a full range of difficulty. Refer to Chapter 2 of this report for additional details.
Item Discrimination
How well the items on a test discriminate between high- and low-performing examinees is an important measure of the structure of a test. Items that do not discriminate well generally provide less reliable information about student performance. Table 2 and Table 3 provide point-biserial values on the correct responses, and Table 2 also provides point-biserial values on the three distractors. The values for correct answers are 0.24 or higher for all but one item and are negative for all distractors, indicating that examinees are responding to the items as expected during item and rubric development.
Differential Item Functioning
Differential item functioning (DIF) for gender was conducted following field testing of the items in 2007–2010 and 2012–2016. Sample sizes for subgroups based on ethnicity and English language learner status were, unfortunately, too small to reliably compute DIF statistics, so only gender DIF analyses were conducted. The Mantel-Haenszel 𝜒2 and standardized mean difference were used to detect items that may function differently for any of these subgroups. The Mantel-Haenszel 𝜒2 is a conditional mean comparison of the ordered response categories for reference and focal groups combined over values of the matching variable score. “Ordered” means that a response earning a score of “1” on an item is better than a response earning a score of “0,” a “2” is better than “1,” and so on. “Conditional,” on the other hand, refers to the comparison of members from the two groups who received the same score on the matching variable — the total test score in our analysis.

Prepared for NYSED by Pearson 36
Six operational items for the June 2017 administration had a DIF flag from the field test. One of the items (# 73) had a moderate DIF favoring female students while the other five items (#s 2, 4, 15, 60, 65) had a moderate DIF favoring male students. This item was subsequently reviewed by content specialists. They were unable to identify content-based reasons why the items might be functioning differently between male students and female students and did not see any issue with using them for the operational exam.
Full differential item functioning results are reported in Appendix C of the 2007–2010 and
2012 technical reports, Appendix E of the 2013, 2014, and 2015 technical reports, and Appendix F of the 2016 technical report.
IRT Model Fit
Model fit for the Rasch method used to estimate location (difficulty) parameters for the items on the Regents Examination in Chemistry provide important evidence that the internal structure of the test is of high technical quality. The number of items within a targeted range of [0.7, 1.3] is reported in Table 5. The mean INFIT value is 1.00, with all items but only one falling in a targeted range of [0.7, 1.3]. As the range of [0.7, 1.3] is used as guide for ideal fit, fit values outside of the range are considered individually. These results indicate that the Rasch model fits the Regents Examination in Chemistry item data well.
Test Reliability
As discussed, test reliability is a measure of the internal consistency of a test (Cronbach, 1951). It is a measure of the extent to which the items on a test provide consistent information about student mastery of the domain. Reliability should ultimately demonstrate that examinee score estimates maximize consistency and therefore minimize error or, theoretically speaking, that examinees who take a test multiple times would get the same score each time. The reliability estimate for the Regents Examination in Chemistry is 0.95, showing high reliability of examinee scores. Refer to Chapter 4 of this report for additional details.
Classification Consistency and Accuracy
A decision consistency analysis measures the agreement between the classifications based on two non-overlapping, equally difficult forms of the test. If two parallel forms of the test were given to the same students, the consistency of the measure would be reflected by the extent to which the classification decisions based on the first set of test scores matched the decisions based on the second set of test scores. Decision accuracy is an index to determine the extent to which measurement error causes a classification different from that expected from the true score. High decision consistency and accuracy provide strong evidence that the internal structure of a test is sound.
For the Regents Examination in Chemistry, both decision consistency and accuracy
values are high, indicating very good consistency and accuracy of examinee classifications. The overall decision consistency ranged from 0.87 to 0.96, and the decision accuracy ranged from 0.91 to 0.98. For the Regents Examination in Chemistry, both decision consistency and accuracy values for all three cut points are high, indicating very good consistency and accuracy of examinee classifications. Refer to Table 7 for details.

Prepared for NYSED by Pearson 37
Dimensionality
In addition to model fit, a strong assumption of the Rasch model is that the construct measured by a test is unidimensional. Violation of this assumption might suggest that the test is measuring something other than the intended content and indicate that the quality of the test structure is compromised. A principal components analysis was conducted to test the assumption of unidimensionality, and the results provide strong evidence that a single dimension in the Regents Examination in Chemistry is explaining a large portion of the variance in student response data. This analysis does not characterize or explain the dimension, but a reasonable assumption can be made that the test is largely unidimensional and that the dimension most present is the targeted construct. Refer to Chapter 3 for details of this analysis.
Considering this collection of detailed analyses of the internal structure of the Regents
Examination in Chemistry, strong evidence exists that the exam is functioning as intended and is providing valid and reliable information about examinee performance.
5.4 EVIDENCE BASED ON RELATIONS TO OTHER VARIABLES
Another source of validity evidence is based on the relation of the test to other variables. This source commonly encompasses two validity categories prevalent in the literature and practice — concurrent and predictive validity. To make claims about the validity of a test that is to be used for high-stakes purposes, such as the Regents Examination in Chemistry, these claims could be supported by providing evidence that performance on this test correlates well with other tests that measure the same or similar constructs. Although not absolute in its ability to offer evidence that concurrent test score validity exists, such correlations can be helpful for supporting a claim of concurrent validity, if the correlation is high. To conduct such studies, matched examinee score data for other tests measuring the same content as the Regents Examination in Chemistry are ideal, but the systematic acquisition of such data is complex and costly.
Importantly, a strong connection between classroom curriculum and test content may be
inferred by the fact that New York State educators, deeply familiar with both the curriculum standards and their enactment in the classroom, develop all content for the Regents Examination in Chemistry.
In terms of predictive validity, time is a fundamental constraint on gathering evidence. The
gold standard for supporting the validity of predictive statements about test scores requires empirical evidence of the relationship between test scores and future performance on a defined characteristic. To the extent that the objective of the standards is to prepare students for meeting graduation requirements, it will be important to gather evidence of this empirical relationship over time.
5.5 EVIDENCE BASED ON TESTING CONSEQUENCES
There are two general approaches in the literature to evaluating consequential validity. Messick (1995) points out that adverse social consequences invalidate test use mainly if they are due to flaws in the test. In this sense, the sources of evidence documented in this report (based on the construct, internal test structure, response processes, and relation to other
Prepared for NYSED by Pearson 38
variables) serve as a consequential validity argument, as well. This evidence supports conclusions based on test scores that social consequences are not likely to be traced to characteristics or qualities of the test itself.
Cronbach (1988), on the other hand, argues that negative consequences could invalidate
test use. From this perspective, the test user is obligated to make the case for test use and to ensure appropriate and supported uses. Regardless of perspective on the nature of consequential validity, it is important to caution against uses that are not supported by the validity claims documented for this test. For example, use of this test to predict examinee scores on other tests is not directly supported by either the stated purposes or by the development process and research conducted on examinee data. A brief survey of websites of New York State universities and colleges finds that, beyond the explicitly defined use as a testing requirement toward graduation for students who have completed a course in Chemistry, the exam is most commonly used to inform admissions and course placement decisions. Such uses can be considered reasonable, assuming that the competencies demonstrated in the Regents Examination in Chemistry are consistent with those required in the courses for which a student is seeking enrollment or placement. Educational institutions using the exam for placement purposes are advised to examine the scoring rules for the Regents Examination in Chemistry and to assess their appropriateness for the inferences being made about course placement.
As stated, the nature of validity arguments is not absolute, but it is supported through
ongoing processes and studies designed to accumulate support for validity claims. The evidence provided in this report documents the evidence to date that supports the use of the Regents Examination in Chemistry scores for the purposes described.
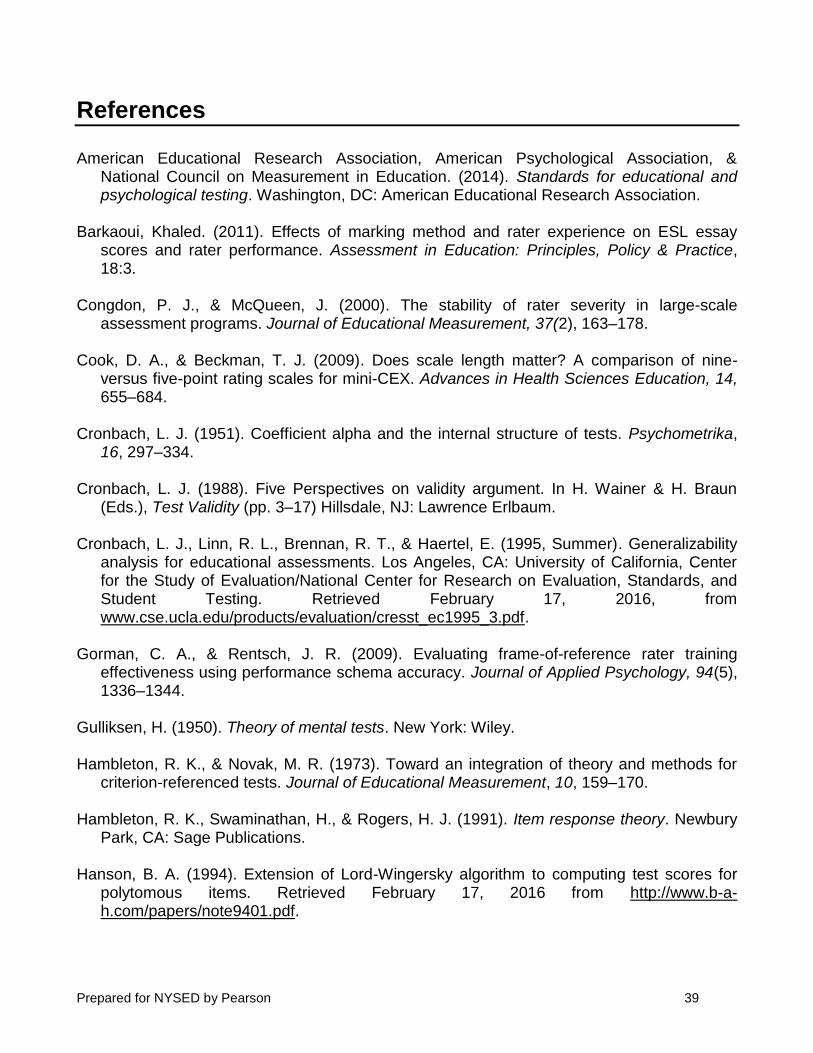
Prepared for NYSED by Pearson 39
References American Educational Research Association, American Psychological Association, &
National Council on Measurement in Education. (2014). Standards for educational and psychological testing. Washington, DC: American Educational Research Association.
Barkaoui, Khaled. (2011). Effects of marking method and rater experience on ESL essay
scores and rater performance. Assessment in Education: Principles, Policy & Practice, 18:3.
Congdon, P. J., & McQueen, J. (2000). The stability of rater severity in large-scale
assessment programs. Journal of Educational Measurement, 37(2), 163–178. Cook, D. A., & Beckman, T. J. (2009). Does scale length matter? A comparison of nine-
versus five-point rating scales for mini-CEX. Advances in Health Sciences Education, 14, 655–684.
Cronbach, L. J. (1951). Coefficient alpha and the internal structure of tests. Psychometrika,
16, 297–334. Cronbach, L. J. (1988). Five Perspectives on validity argument. In H. Wainer & H. Braun
(Eds.), Test Validity (pp. 3–17) Hillsdale, NJ: Lawrence Erlbaum. Cronbach, L. J., Linn, R. L., Brennan, R. T., & Haertel, E. (1995, Summer). Generalizability
analysis for educational assessments. Los Angeles, CA: University of California, Center for the Study of Evaluation/National Center for Research on Evaluation, Standards, and Student Testing. Retrieved February 17, 2016, from www.cse.ucla.edu/products/evaluation/cresst_ec1995_3.pdf.
Gorman, C. A., & Rentsch, J. R. (2009). Evaluating frame-of-reference rater training
effectiveness using performance schema accuracy. Journal of Applied Psychology, 94(5), 1336–1344.
Gulliksen, H. (1950). Theory of mental tests. New York: Wiley. Hambleton, R. K., & Novak, M. R. (1973). Toward an integration of theory and methods for
criterion-referenced tests. Journal of Educational Measurement, 10, 159–170. Hambleton, R. K., Swaminathan, H., & Rogers, H. J. (1991). Item response theory. Newbury
Park, CA: Sage Publications. Hanson, B. A. (1994). Extension of Lord-Wingersky algorithm to computing test scores for
polytomous items. Retrieved February 17, 2016 from http://www.b-a-h.com/papers/note9401.pdf.
Prepared for NYSED by Pearson 40
Harik, P., Clauser, B. E., Grabovsky, I., Nungester, R. J., Swanson, D., & Nandakumar, R. (2009, Spring). An examination of rater drift within a generalizability theory framework. Journal of Educational Measurement, 46(1), 43–58.
Harvill, L. M. (1991). Standard error of measurement. Educational Measurement: Issues and
Practices, 10(2), 33–41. Horn, J. L. (1965). A rationale and test for the number of factors in factor analysis.
Psychometrika, 32, 179–185. Hoyt, W. T., & Kerns, M. (1999). Magnitude and moderators of bias in observer ratings: A
meta-analysis. Psychological Methods, 4, 403–424. Huynh, H. (1976). Statistical consideration of mastery scores. Psychometrika, 41, 65–78. Johnson, R. L., Penny, J. A., & Gordon, B. (2008). Assessing performance. New York, NY:
The Guilford Press. Kolen, M. J. (2004). POLYCSEM [Computer program]. University of Iowa. Retrieved August
1, 2012, from https://education.uiowa.edu/centers/center-advanced-studies-measurement-and-assessment/computer-programs.
Kolen, M. J., & Brennan, R. L. (2005). Test equating, scaling, and linking: Methods and
practices (2nd ed.). New York: Springer-Verlag. Kolen, M. J. & Lee, W. (2011). Psychometric Properties of Raw and Scale Scores on Mixed-
Format Tests. Educational Measurement: Issues and Practice 30(2), 15–24. Kolen, M. J., Zeng, L., & Hanson, B. A. (1996). Conditional standard errors of measurement
for scale scores using IRT. Journal of Educational Measurement, 33(2), 129–140. Leacock, Claudia, Gonzalez, Erin, Conarroe, Mike. (2014). Developing effective scoring
rubrics for AI short answer scoring. CTB McGraw-Hill Education Innovative Research and Development Grant.
Livingston, S. A., & Lewis, C. (1995). Estimating the consistency and accuracy of
classifications based on test scores. Journal of Educational Measurement, 32, 179–197. Lord, F. M. (1980). Applications of item response theory to practical testing problems.
Hillsdale, NJ: Lawrence Erlbaum. Lumley, T., & McNamara, T. F. (1995). Rater characteristics and rater bias: Implications for
training. Language Testing, 12, 54–72. McDonald, R.P. (1979). The structural analysis of multivariate data: A sketch of general
theory. Multivariate Behavioral Research, 14, 21–38.

Prepared for NYSED by Pearson 41
McQueen, J., & Congdon, P. J. (1997, March). Rater severity in large-scale assessment: Is it invariant? Paper presented at the Annual Meeting of the American Educational Research Association, Chicago, IL.
Mero, N. P., & Motowidlo, S. J. (1995). Effects of rater accountability on the accuracy and the
favorability of performance ratings. Journal of Applied Psychology, 80(4), 517–524. Messick, S. (1995). Standards of Validity and the validity of and standards in performance
assessment. Educational Measurement: Issues and Practice, 14(4), 5–8. Myford, C. M., & Wolfe, E. W. (2009). Monitoring rater performance over time: A framework
for detecting differential accuracy and differential scale use. Journal of Educational Measurement, 46(4), 371–389.
National Governors Association Center for Best Practices, & Council of Chief State School
Officers. (2010). Common Core State Standards. Washington, DC: Authors. Patz, R. J., Junker, B. W., Johnson, M. S., and Mariano, L. T. (2002). The Hierarchical Rater
Model for Rated Test Items and its Application to Large-Scale Educational Assessment Data. Journal of Educational and Behavioral Statistics, 27: 341.
Pearson, K. (1896). Mathematical Contributions to the Theory of Evolution. III. Regression, Heredity and Panmixia. Philosophical Transactions of the Royal Society of London, 187, 253–318.
Pecheone, R. L., & Chung Wei, R. R. (2007). Performance assessment for California teachers: Summary of validity and reliability studies for the 2003−04 pilot year. Palo Alto, CA: Stanford University PACT Consortium.
Penny, J., Johnson, R. L., & Gordon, B. (2000). Using rating augmentation to expand the
scale of an analytic rubric. The Journal of Experimental Education, 68(3), 269–287. Schleicher, D. J., Day, D. V., Bronston, T., Mayes, B. T., & Riggo, R. E. (2002). A new frame
for frame-of-reference training: Enhancing the construct validity of assessment centers. Journal of Applied Psychology, 87(4), 735–746.
Thissen, D., Pommerich, M., Billeaud, K., & Williams, V. S. L. (1995). Item response theory for
scores on tests including polytomous items with ordered responses. Applied Psychological Measurement, 19, 39–49.
van der Linden, W. J., & Hambleton, R. K. (Eds.). (1997). Handbook of modern item
response theory. New York, NY: Springer-Verlag. Wang, T., Kolen, M. J., & Harris, D. J. (2000). Psychometric properties of scale scores and
performance levels for performance assessments using polytomous IRT. Journal of Educational Measurement, 37(2), 141–162.
Prepared for NYSED by Pearson 42
Wang, X. M., Wong, K. F. E., & Kwong, J. Y. Y. (2010). The roles of rater goals and ratee performance levels in the distortion of performance ratings. Journal of Applied Psychology, 95(3), 546–561.
Weigle, S.C. (1998). Using FACETS to model rater training effects. Language Testing 15,
263–287. Weinrott, L., & Jones, B. (1984). Overt verses covert assessment of observer reliability. Child
Development, 55, 1125–1137. Woehr, D. J., & Huffcutt, A. I. (1994). Rater training for performance appraisal: A quantitative
review. Journal of Occupational and Organizational Psychology, 67, 189–205. Wolfe, E. W., & Gitomer, D. H. (2000). The influence of changes in assessment design on the
psychometric quality of scores. Princeton, NJ: Educational Testing Service.

Prepared for NYSED by Pearson 43
Appendix A: Operational Test Maps
Table A.1 Test Map for August 2016 Administration
Position Item Type Max
Points Weight Standard
Key Idea
PI Mean Point-
Biserial RID INFIT
1 MC 1 1 4 3 3.1 0.67 0.43 -0.8076 1.00
2 MC 1 1 4 3 3.1 0.70 0.51 -0.9909 0.89
3 MC 1 1 4 3 3.1 0.67 0.50 -0.6700 0.90
4 MC 1 1 4 3 3.1 0.40 0.41 0.5448 1.01
5 MC 1 1 4 3 3.3 0.75 0.43 -1.2499 0.98
6 MC 1 1 4 3 3.1 0.80 0.32 -1.4300 1.03
7 MC 1 1 4 5 5.2 0.35 0.34 0.7589 1.07
8 MC 1 1 4 5 5.2 0.47 0.38 0.2055 1.06
9 MC 1 1 4 5 5.2 0.59 0.40 -0.3561 1.06
10 MC 1 1 4 3 3.1 0.82 0.31 -1.7443 1.07
11 MC 1 1 4 5 5.2 0.93 0.32 -2.7841 0.90
12 MC 1 1 4 3 3.1 0.72 0.47 -1.0952 0.88
13 MC 1 1 4 3 3.1 0.87 0.31 -2.2573 0.92
14 MC 1 1 4 3 3.1 0.68 0.29 -0.7998 1.01
15 MC 1 1 4 3 3.1 0.66 0.49 -0.6900 1.06
16 MC 1 1 4 3 3.4 0.58 0.31 -0.2900 0.89
17 MC 1 1 4 3 3.1 0.55 0.47 -0.1772 1.13
18 MC 1 1 4 4 4.2 0.50 0.28 0.2478 0.97
19 MC 1 1 4 3 3.4 0.73 0.37 -1.0800 1.19
20 MC 1 1 4 3 3.4 0.58 0.21 -0.3027 1.07
21 MC 1 1 4 3 3.4 0.90 0.42 -2.3400 1.19
22 MC 1 1 4 4 4.1 0.40 0.36 0.5281 1.08
23 MC 1 1 4 3 3.1 0.51 0.30 0.1542 1.16
24 MC 1 1 4 3 3.2 0.54 0.45 -0.0800 0.91
25 MC 1 1 4 3 3.2 0.66 0.30 -0.6980 1.11
26 MC 1 1 4 3 3.1 0.36 0.38 0.7323 1.05
27 MC 1 1 4 3 3.1 0.37 0.33 0.7443 1.18
28 MC 1 1 4 3 3.1 0.44 0.26 0.3359 1.16
29 MC 1 1 4 4 4.4 0.48 0.34 0.1371 1.10
30 MC 1 1 4 3 3.1 0.76 0.31 -1.2507 1.12
31 MC 1 1 4 3 3.1 0.84 0.42 -1.7996 0.93
32 MC 1 1 4 3 3.1 0.42 0.37 0.4287 1.05
33 MC 1 1 4 3 3.1 0.62 0.43 -0.5377 0.98
34 MC 1 1 4 5 5.2 0.80 0.46 -1.6550 0.89
35 MC 1 1 4 3 3.3 0.46 0.45 0.2440 0.97
36 MC 1 1 4 5 5.2 0.42 0.45 0.4783 1.03

Prepared for NYSED by Pearson 44
Position Item Type Max
Points Weight Standard
Key Idea
PI Mean Point-
Biserial RID INFIT
37 MC 1 1 4 5 5.2 0.49 0.37 0.0896 1.04
38 MC 1 1 4 5 5.2 0.51 0.31 0.0004 1.13
39 MC 1 1 4 3 3.1 0.82 0.46 -1.6600 1.05
40 MC 1 1 4 3 3.1 0.72 0.18 -0.9500 1.11
41 MC 1 1 4 4 4.2 0.36 0.40 0.9264 1.05
42 MC 1 1 4 3 3.4 0.88 0.29 -2.1300 0.96
43 MC 1 1 4 3 3.1 0.54 0.33 -0.1579 1.19
44 MC 1 1 4 3 3.2 0.44 0.38 0.3440 1.03
45 MC 1 1 4 3 3.1 0.69 0.35 -0.8647 1.05
46 MC 1 1 4 3 3.1 0.61 0.39 -0.4666 1.06
47 MC 1 1 4 3 3.1 0.55 0.54 -0.1917 0.91
48 MC 1 1 4 3 3.1 0.54 0.33 -0.1579 1.18
49 MC 1 1 4 3 3.1 0.84 0.39 -1.9102 0.96
50 MC 1 1 4 3 3.4 0.46 0.46 0.2162 0.95
51 CR 1 1 4 3 3.3 0.52 0.44 0.1300 0.90
52 CR 1 1 4 3 3.1 0.61 0.56 -0.1929 0.88
53 CR 1 1 4 3 3.1 0.20 0.44 2.0138 0.94
54 CR 1 1 4 4 4.2 0.75 0.35 -1.0798 1.10
55 CR 1 1 4 3 3.2 0.43 0.48 0.5809 1.00
56 CR 1 1 4 3 3.2 0.35 0.56 0.9190 0.88
57 CR 1 1 4 3 3.1 0.32 0.50 1.1018 0.95
58 CR 1 1 4 3 3.1 0.26 0.50 1.4908 0.92
59 CR 1 1 4 4 4.2 0.72 0.45 -0.9992 0.97
60 CR 1 1 4 5 5.2 0.69 0.47 -0.8892 0.89
61 CR 1 1 4 5 5.2 0.39 0.58 0.5808 0.83
62 CR 1 1 4 5 5.2 0.18 0.45 1.7815 0.94
63 CR 1 1 4 3 3.1 0.59 0.42 -0.3914 0.96
64 CR 1 1 4 5 5.3 0.30 0.44 1.1641 0.95
65 CR 1 1 4 4 4.4 0.31 0.41 1.1579 0.99
66 CR 1 1 4 3 3.2 0.21 0.43 1.5901 0.96
67 CR 1 1 4 3 3.3 0.15 0.51 2.0391 0.86
68 CR 1 1 4 3 3.2 0.11 0.49 2.3982 0.86
69 CR 1 1 4 3 3.4 0.37 0.47 0.6521 0.94
70 CR 1 1 4 3 3.1 0.50 0.48 0.0808 0.95
71 CR 1 1 4 3 3.1 0.24 0.44 1.4147 0.96
72 CR 1 1 4 3 3.1 0.39 0.47 0.5867 0.96
73 CR 1 1 4 3 3.1 0.62 0.52 -0.5249 0.89
74 CR 1 1 4 3 3.2 0.57 0.62 0.0203 0.83
75 CR 1 1 4 3 3.3 0.54 0.64 0.1749 0.81
76 CR 1 1 4 3 3.1 0.72 0.44 -0.8541 1.04

Prepared for NYSED by Pearson 45
Position Item Type Max
Points Weight Standard
Key Idea
PI Mean Point-
Biserial RID INFIT
77 CR 1 1 4 3 3.1 0.49 0.53 0.1117 0.93
78 CR 1 1 4 3 3.1 0.42 0.59 0.4437 0.86
79 CR 1 1 4 3 3.1 0.35 0.43 0.8546 1.06
80 CR 1 1 4 3 3.1 0.22 0.49 1.6215 0.96
81 CR 1 1 4 3 3.1 0.52 0.49 -0.0318 0.95
82 CR 1 1 4 3 3.1 0.29 0.47 1.1550 0.93
83 CR 1 1 4 3 3.1 0.27 0.50 1.2554 0.88
84 CR 1 1 4 5 5.2 0.39 0.49 0.6060 0.94
85 CR 1 1 4 3 3.2 0.17 0.39 1.9498 0.97

Prepared for NYSED by Pearson 46
Table A.2 Test Map for January 2017 Administration
Position Item Type Max
Points Weight Standard
Key Idea
PI Mean Point-
Biserial RID INFIT
1 MC 1 1 4 3 3.1 0.85 0.40 −1.7221 0.94
2 MC 1 1 4 3 3.1 0.48 0.45 0.4207 1.01
3 MC 1 1 4 3 3.1 0.85 0.46 −1.7774 0.92
4 MC 1 1 4 3 3.1 0.71 0.41 −0.7203 0.99
5 MC 1 1 4 3 3.1 0.58 0.36 −0.0247 1.11
6 MC 1 1 4 3 3.1 0.71 0.42 −0.7138 1.00
7 MC 1 1 4 3 3.1 0.45 0.46 0.5652 0.99
8 MC 1 1 4 5 5.2 0.70 0.42 −0.6699 0.99
9 MC 1 1 4 3 3.1 0.64 0.36 −0.3460 1.09
10 MC 1 1 4 3 3.1 0.80 0.27 −1.5600 1.11
11 MC 1 1 4 5 5.2 0.44 0.44 0.6351 1.02
12 MC 1 1 4 5 5.2 0.67 0.46 −0.4977 0.96
13 MC 1 1 4 5 5.2 0.88 0.41 −1.9906 0.88
14 MC 1 1 4 3 3.4 0.68 0.51 −0.6600 0.86
15 MC 1 1 4 3 3.1 0.73 0.38 −0.8593 1.05
16 MC 1 1 4 3 3.1 0.77 0.41 −1.1140 0.97
17 MC 1 1 4 3 3.1 0.81 0.36 −1.3952 1.00
18 MC 1 1 4 3 3.2 0.83 0.45 −1.6143 0.95
19 MC 1 1 4 5 5.2 0.73 0.34 −0.8429 1.08
20 MC 1 1 4 3 3.1 0.62 0.36 −0.2525 1.09
21 MC 1 1 4 3 3.1 0.92 0.35 −2.5380 0.95
22 MC 1 1 4 3 3.1 0.64 0.47 −0.3348 0.96
23 MC 1 1 4 3 3.2 0.77 0.44 −1.0923 0.96
24 MC 1 1 4 3 3.2 0.66 0.38 −0.4752 1.05
25 MC 1 1 4 3 3.3 0.69 0.39 −0.7400 0.98
26 MC 1 1 4 3 3.2 0.64 0.41 −0.4800 1.01
27 MC 1 1 4 3 3.1 0.54 0.44 0.1290 1.02
28 MC 1 1 4 3 3.2 0.38 0.43 0.9360 1.01
29 MC 1 1 4 3 3.1 0.74 0.38 −1.0100 1.02
30 MC 1 1 4 4 4.4 0.54 0.45 0.1563 1.08
31 MC 1 1 4 3 3.1 0.89 0.32 −2.2257 1.02
32 MC 1 1 4 3 3.1 0.74 0.44 −0.8811 0.99
33 MC 1 1 4 3 3.1 0.56 0.45 0.0486 1.09
34 MC 1 1 4 3 3.1 0.77 0.43 −1.1446 1.03
35 MC 1 1 4 3 3.3 0.67 0.57 −0.5142 0.84
36 MC 1 1 4 3 3.3 0.54 0.42 0.1377 1.04
37 MC 1 1 4 3 3.3 0.77 0.50 −1.0686 0.89
38 MC 1 1 4 5 5.2 0.36 0.33 1.0722 1.12
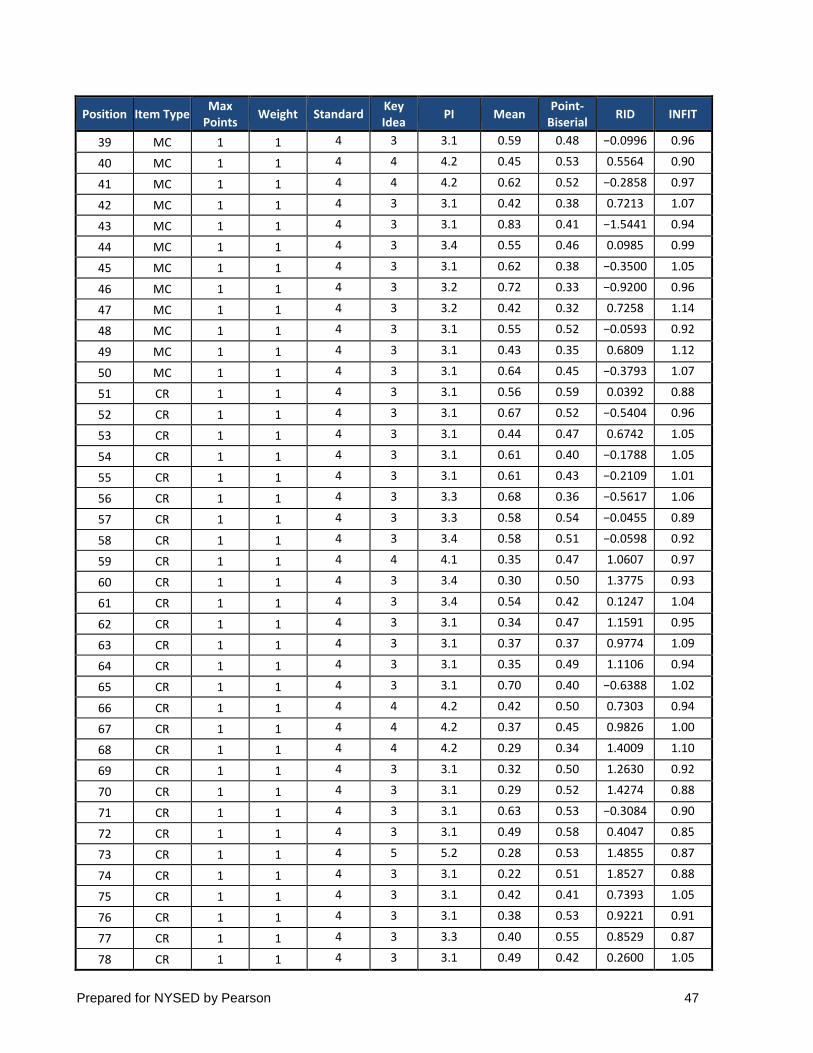
Prepared for NYSED by Pearson 47
Position Item Type Max
Points Weight Standard
Key Idea
PI Mean Point-
Biserial RID INFIT
39 MC 1 1 4 3 3.1 0.59 0.48 −0.0996 0.96
40 MC 1 1 4 4 4.2 0.45 0.53 0.5564 0.90
41 MC 1 1 4 4 4.2 0.62 0.52 −0.2858 0.97
42 MC 1 1 4 3 3.1 0.42 0.38 0.7213 1.07
43 MC 1 1 4 3 3.1 0.83 0.41 −1.5441 0.94
44 MC 1 1 4 3 3.4 0.55 0.46 0.0985 0.99
45 MC 1 1 4 3 3.1 0.62 0.38 −0.3500 1.05
46 MC 1 1 4 3 3.2 0.72 0.33 −0.9200 0.96
47 MC 1 1 4 3 3.2 0.42 0.32 0.7258 1.14
48 MC 1 1 4 3 3.1 0.55 0.52 −0.0593 0.92
49 MC 1 1 4 3 3.1 0.43 0.35 0.6809 1.12
50 MC 1 1 4 3 3.1 0.64 0.45 −0.3793 1.07
51 CR 1 1 4 3 3.1 0.56 0.59 0.0392 0.88
52 CR 1 1 4 3 3.1 0.67 0.52 −0.5404 0.96
53 CR 1 1 4 3 3.1 0.44 0.47 0.6742 1.05
54 CR 1 1 4 3 3.1 0.61 0.40 −0.1788 1.05
55 CR 1 1 4 3 3.1 0.61 0.43 −0.2109 1.01
56 CR 1 1 4 3 3.3 0.68 0.36 −0.5617 1.06
57 CR 1 1 4 3 3.3 0.58 0.54 −0.0455 0.89
58 CR 1 1 4 3 3.4 0.58 0.51 −0.0598 0.92
59 CR 1 1 4 4 4.1 0.35 0.47 1.0607 0.97
60 CR 1 1 4 3 3.4 0.30 0.50 1.3775 0.93
61 CR 1 1 4 3 3.4 0.54 0.42 0.1247 1.04
62 CR 1 1 4 3 3.1 0.34 0.47 1.1591 0.95
63 CR 1 1 4 3 3.1 0.37 0.37 0.9774 1.09
64 CR 1 1 4 3 3.1 0.35 0.49 1.1106 0.94
65 CR 1 1 4 3 3.1 0.70 0.40 −0.6388 1.02
66 CR 1 1 4 4 4.2 0.42 0.50 0.7303 0.94
67 CR 1 1 4 4 4.2 0.37 0.45 0.9826 1.00
68 CR 1 1 4 4 4.2 0.29 0.34 1.4009 1.10
69 CR 1 1 4 3 3.1 0.32 0.50 1.2630 0.92
70 CR 1 1 4 3 3.1 0.29 0.52 1.4274 0.88
71 CR 1 1 4 3 3.1 0.63 0.53 −0.3084 0.90
72 CR 1 1 4 3 3.1 0.49 0.58 0.4047 0.85
73 CR 1 1 4 5 5.2 0.28 0.53 1.4855 0.87
74 CR 1 1 4 3 3.1 0.22 0.51 1.8527 0.88
75 CR 1 1 4 3 3.1 0.42 0.41 0.7393 1.05
76 CR 1 1 4 3 3.1 0.38 0.53 0.9221 0.91
77 CR 1 1 4 3 3.3 0.40 0.55 0.8529 0.87
78 CR 1 1 4 3 3.1 0.49 0.42 0.2600 1.05

Prepared for NYSED by Pearson 48
Position Item Type Max
Points Weight Standard
Key Idea
PI Mean Point-
Biserial RID INFIT
79 CR 1 1 4 3 3.1 0.60 0.46 −0.2900 0.97
80 CR 1 1 4 3 3.2 0.21 0.43 1.6339 0.94
81 CR 1 1 4 3 3.2 0.44 0.44 0.3391 0.99
82 CR 1 1 4 3 3.2 0.10 0.37 2.6341 0.92
83 CR 1 1 4 4 4.4 0.34 0.45 1.2217 1.07
84 CR 1 1 4 3 3.1 0.43 0.61 0.7405 0.84
85 CR 1 1 4 4 4.4 0.27 0.56 1.6734 0.84

Prepared for NYSED by Pearson 49
Table A.3 Test Map for June 2017 Administration
Position Item Type Max
Points Weight Standard
Key Idea
PI Mean Point-
Biserial RID INFIT
1 MC 1 1 4 3 3.1 0.90 0.34 -2.2435 0.96
2 MC 1 1 4 3 3.1 0.84 0.45 -1.6230 0.90
3 MC 1 1 4 3 3.1 0.89 0.32 -2.0732 0.97
4 MC 1 1 4 3 3.1 0.78 0.47 -1.1819 0.92
5 MC 1 1 4 3 3.1 0.67 0.54 -0.5295 0.88
6 MC 1 1 4 3 3.1 0.89 0.35 -2.2000 0.96
7 MC 1 1 4 3 3.1 0.61 0.41 -0.2168 1.06
8 MC 1 1 4 3 3.3 0.62 0.34 -0.2614 1.14
9 MC 1 1 4 3 3.2 0.86 0.37 -2.0051 0.96
10 MC 1 1 4 3 3.1 0.60 0.39 -0.1717 1.10
11 MC 1 1 4 5 5.2 0.65 0.43 -0.3913 1.02
12 MC 1 1 4 5 5.2 0.49 0.35 0.3911 1.14
13 MC 1 1 4 5 5.2 0.51 0.37 0.1700 1.04
14 MC 1 1 4 4 4.2 0.51 0.43 0.2857 1.05
15 MC 1 1 4 4 4.2 0.69 0.53 -0.6430 0.88
16 MC 1 1 4 4 4.1 0.91 0.34 -2.5000 0.93
17 MC 1 1 4 3 3.4 0.78 0.44 -1.1941 0.96
18 MC 1 1 4 3 3.4 0.85 0.32 -1.7056 1.04
19 MC 1 1 4 3 3.4 0.62 0.48 -0.2588 0.96
20 MC 1 1 4 3 3.1 0.58 0.39 -0.2700 1.03
21 MC 1 1 4 3 3.1 0.80 0.35 -1.3900 1.01
22 MC 1 1 4 3 3.4 0.59 0.37 -0.1446 1.12
23 MC 1 1 4 4 4.1 0.49 0.44 0.3690 1.02
24 MC 1 1 4 3 3.4 0.47 0.32 0.5107 1.19
25 MC 1 1 4 3 3.1 0.61 0.29 -0.2399 1.22
26 MC 1 1 4 3 3.1 0.56 0.40 0.0298 1.06
27 MC 1 1 4 3 3.2 0.41 0.33 0.7707 1.16
28 MC 1 1 4 3 3.3 0.75 0.48 -0.9944 0.93
29 MC 1 1 4 3 3.2 0.65 0.39 -0.4538 1.08
30 MC 1 1 4 3 3.1 0.63 0.36 -0.3199 1.08
31 MC 1 1 4 3 3.1 0.78 0.45 -1.2218 0.94
32 MC 1 1 4 3 3.1 0.67 0.48 -0.5692 0.96
33 MC 1 1 4 3 3.1 0.49 0.39 0.3868 1.09
34 MC 1 1 4 3 3.1 0.68 0.51 -0.5929 0.93
35 MC 1 1 4 3 3.4 0.57 0.28 -0.0369 1.23
36 MC 1 1 4 3 3.3 0.68 0.47 -0.6700 0.93
37 MC 1 1 4 3 3.1 0.57 0.48 -0.0222 0.98
38 MC 1 1 4 5 5.2 0.75 0.46 -1.0096 0.95

Prepared for NYSED by Pearson 50
Position Item Type Max
Points Weight Standard
Key Idea
PI Mean Point-
Biserial RID INFIT
39 MC 1 1 4 5 5.2 0.41 0.41 0.8098 1.05
40 MC 1 1 4 3 3.1 0.47 0.41 0.3799 1.05
41 MC 1 1 4 3 3.1 0.84 0.40 -1.6979 0.95
42 MC 1 1 4 3 3.4 0.63 0.44 -0.3096 1.03
43 MC 1 1 4 4 4.1 0.64 0.37 -0.5489 1.11
44 MC 1 1 4 3 3.1 0.58 0.39 -0.0682 1.10
45 MC 1 1 4 3 3.1 0.33 0.35 1.2192 1.09
46 MC 1 1 4 4 4.4 0.41 0.36 0.7752 1.13
47 MC 1 1 4 4 4.4 0.52 0.42 0.2675 1.06
48 MC 1 1 4 4 4.4 0.34 0.36 1.1459 1.10
49 MC 1 1 4 5 5.2 0.82 0.31 -1.4461 1.08
50 MC 1 1 4 3 3.4 0.59 0.15 -0.0880 1.36
51 CR 1 1 4 3 3.1 0.68 0.56 -0.5886 0.86
52 CR 1 1 4 5 5.2 0.66 0.52 -0.4566 0.92
53 CR 1 1 4 3 3.1 0.52 0.54 0.2675 0.91
54 CR 1 1 4 3 3.1 0.80 0.50 -1.3492 0.87
55 CR 1 1 4 3 3.1 0.40 0.41 0.8539 1.07
56 CR 1 1 4 3 3.1 0.53 0.52 0.1668 0.94
57 CR 1 1 4 5 5.2 0.61 0.47 -0.2216 0.99
58 CR 1 1 4 5 5.2 0.44 0.51 0.6551 0.95
59 CR 1 1 4 5 5.2 0.46 0.46 0.5518 1.00
60 CR 1 1 4 5 5.2 0.18 0.47 2.1380 0.89
61 CR 1 1 4 3 3.1 0.48 0.54 0.4002 0.92
62 CR 1 1 4 4 4.2 0.58 0.55 -0.0951 0.90
63 CR 1 1 4 4 4.2 0.14 0.47 2.5202 0.88
64 CR 1 1 4 4 4.4 0.39 0.46 0.8884 0.99
65 CR 1 1 4 5 5.3 0.21 0.41 1.9561 0.98
66 CR 1 1 4 3 3.1 0.59 0.44 -0.1071 1.02
67 CR 1 1 4 3 3.1 0.52 0.52 0.2471 0.94
68 CR 1 1 4 3 3.1 0.64 0.47 -0.3772 0.98
69 CR 1 1 4 3 3.3 0.58 0.58 -0.0665 0.86
70 CR 1 1 4 3 3.3 0.50 0.52 0.3558 0.94
71 CR 1 1 4 3 3.4 0.33 0.55 1.2140 0.88
72 CR 1 1 4 3 3.3 0.46 0.51 0.5608 0.94
73 CR 1 1 4 3 3.1 0.34 0.51 1.1209 0.93
74 CR 1 1 4 3 3.3 0.50 0.56 0.3379 0.88
75 CR 1 1 4 3 3.1 0.23 0.41 1.7642 1.00
76 CR 1 1 4 4 4.2 0.28 0.58 1.5092 0.83
77 CR 1 1 4 3 3.2 0.54 0.49 0.1548 0.97
78 CR 1 1 4 3 3.2 0.41 0.55 0.8025 0.90

Prepared for NYSED by Pearson 51
Position Item Type Max
Points Weight Standard
Key Idea
PI Mean Point-
Biserial RID INFIT
79 CR 1 1 4 3 3.2 0.39 0.57 0.8944 0.87
80 CR 1 1 4 3 3.2 0.41 0.49 0.7888 0.97
81 CR 1 1 4 3 3.1 0.27 0.46 1.4069 1.02
82 CR 1 1 4 3 3.1 0.44 0.54 0.5057 0.92
83 CR 1 1 4 3 3.1 0.15 0.44 2.4781 0.91
84 CR 1 1 4 3 3.1 0.67 0.54 -0.5643 0.88
85 CR 1 1 4 3 3.1 0.30 0.57 1.3907 0.84
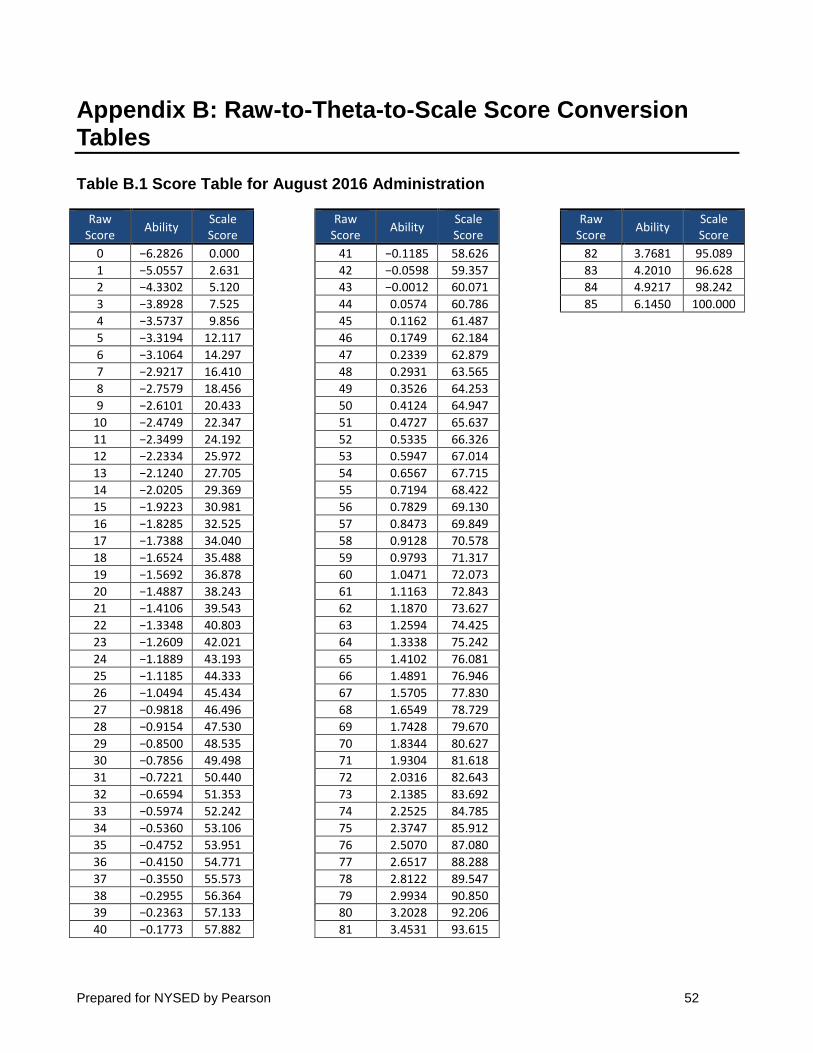
Prepared for NYSED by Pearson 52
Appendix B: Raw-to-Theta-to-Scale Score Conversion Tables
Table B.1 Score Table for August 2016 Administration
Raw Score
Ability Scale Score
Raw
Score Ability
Scale Score
Raw
Score Ability
Scale Score
0 −6.2826 0.000 41 −0.1185 58.626 82 3.7681 95.089
1 −5.0557 2.631 42 −0.0598 59.357 83 4.2010 96.628
2 −4.3302 5.120 43 −0.0012 60.071 84 4.9217 98.242
3 −3.8928 7.525 44 0.0574 60.786 85 6.1450 100.000
4 −3.5737 9.856 45 0.1162 61.487
5 −3.3194 12.117 46 0.1749 62.184
6 −3.1064 14.297 47 0.2339 62.879
7 −2.9217 16.410 48 0.2931 63.565
8 −2.7579 18.456 49 0.3526 64.253
9 −2.6101 20.433 50 0.4124 64.947
10 −2.4749 22.347 51 0.4727 65.637
11 −2.3499 24.192 52 0.5335 66.326
12 −2.2334 25.972 53 0.5947 67.014
13 −2.1240 27.705 54 0.6567 67.715
14 −2.0205 29.369 55 0.7194 68.422
15 −1.9223 30.981 56 0.7829 69.130
16 −1.8285 32.525 57 0.8473 69.849
17 −1.7388 34.040 58 0.9128 70.578
18 −1.6524 35.488 59 0.9793 71.317
19 −1.5692 36.878 60 1.0471 72.073
20 −1.4887 38.243 61 1.1163 72.843
21 −1.4106 39.543 62 1.1870 73.627
22 −1.3348 40.803 63 1.2594 74.425
23 −1.2609 42.021 64 1.3338 75.242
24 −1.1889 43.193 65 1.4102 76.081
25 −1.1185 44.333 66 1.4891 76.946
26 −1.0494 45.434 67 1.5705 77.830
27 −0.9818 46.496 68 1.6549 78.729
28 −0.9154 47.530 69 1.7428 79.670
29 −0.8500 48.535 70 1.8344 80.627
30 −0.7856 49.498 71 1.9304 81.618
31 −0.7221 50.440 72 2.0316 82.643
32 −0.6594 51.353 73 2.1385 83.692
33 −0.5974 52.242 74 2.2525 84.785
34 −0.5360 53.106 75 2.3747 85.912
35 −0.4752 53.951 76 2.5070 87.080
36 −0.4150 54.771 77 2.6517 88.288
37 −0.3550 55.573 78 2.8122 89.547
38 −0.2955 56.364 79 2.9934 90.850
39 −0.2363 57.133 80 3.2028 92.206
40 −0.1773 57.882 81 3.4531 93.615
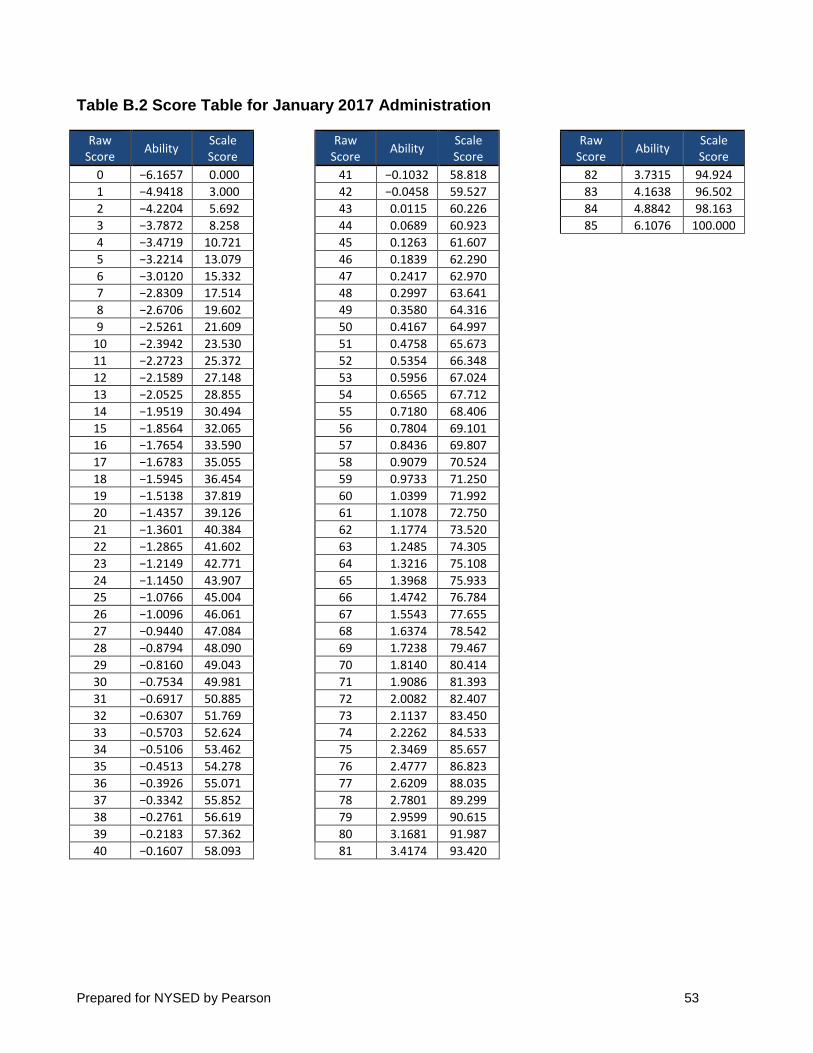
Prepared for NYSED by Pearson 53
Table B.2 Score Table for January 2017 Administration
Raw Score
Ability Scale Score
Raw
Score Ability
Scale Score
Raw
Score Ability
Scale Score
0 −6.1657 0.000 41 −0.1032 58.818 82 3.7315 94.924
1 −4.9418 3.000 42 −0.0458 59.527 83 4.1638 96.502
2 −4.2204 5.692 43 0.0115 60.226 84 4.8842 98.163
3 −3.7872 8.258 44 0.0689 60.923 85 6.1076 100.000
4 −3.4719 10.721 45 0.1263 61.607
5 −3.2214 13.079 46 0.1839 62.290
6 −3.0120 15.332 47 0.2417 62.970
7 −2.8309 17.514 48 0.2997 63.641
8 −2.6706 19.602 49 0.3580 64.316
9 −2.5261 21.609 50 0.4167 64.997
10 −2.3942 23.530 51 0.4758 65.673
11 −2.2723 25.372 52 0.5354 66.348
12 −2.1589 27.148 53 0.5956 67.024
13 −2.0525 28.855 54 0.6565 67.712
14 −1.9519 30.494 55 0.7180 68.406
15 −1.8564 32.065 56 0.7804 69.101
16 −1.7654 33.590 57 0.8436 69.807
17 −1.6783 35.055 58 0.9079 70.524
18 −1.5945 36.454 59 0.9733 71.250
19 −1.5138 37.819 60 1.0399 71.992
20 −1.4357 39.126 61 1.1078 72.750
21 −1.3601 40.384 62 1.1774 73.520
22 −1.2865 41.602 63 1.2485 74.305
23 −1.2149 42.771 64 1.3216 75.108
24 −1.1450 43.907 65 1.3968 75.933
25 −1.0766 45.004 66 1.4742 76.784
26 −1.0096 46.061 67 1.5543 77.655
27 −0.9440 47.084 68 1.6374 78.542
28 −0.8794 48.090 69 1.7238 79.467
29 −0.8160 49.043 70 1.8140 80.414
30 −0.7534 49.981 71 1.9086 81.393
31 −0.6917 50.885 72 2.0082 82.407
32 −0.6307 51.769 73 2.1137 83.450
33 −0.5703 52.624 74 2.2262 84.533
34 −0.5106 53.462 75 2.3469 85.657
35 −0.4513 54.278 76 2.4777 86.823
36 −0.3926 55.071 77 2.6209 88.035
37 −0.3342 55.852 78 2.7801 89.299
38 −0.2761 56.619 79 2.9599 90.615
39 −0.2183 57.362 80 3.1681 91.987
40 −0.1607 58.093 81 3.4174 93.420

Prepared for NYSED by Pearson 54
Table B.3 Score Table for June 2017 Administration
Raw Score
Ability Scale Score
Raw
Score Ability
Scale Score
Raw
Score Ability
Scale Score
0 −6.2096 0.000 41 −0.0998 58.860 82 3.7742 95.116
1 −4.9844 2.862 42 −0.0424 59.569 83 4.2099 96.659
2 −4.2612 5.480 43 0.0150 60.269 84 4.9338 98.267
3 −3.8258 7.991 44 0.0724 60.964 85 6.1597 100.000
4 −3.5084 10.410 45 0.1298 61.649
5 −3.2559 12.741 46 0.1874 62.331
6 −3.0443 14.978 47 0.2452 63.010
7 −2.8611 17.143 48 0.3031 63.681
8 −2.6986 19.223 49 0.3615 64.356
9 −2.5522 21.234 50 0.4202 65.036
10 −2.4182 23.172 51 0.4793 65.713
11 −2.2944 25.032 52 0.5389 66.388
12 −2.1791 26.825 53 0.5992 67.065
13 −2.0708 28.559 54 0.6601 67.753
14 −1.9685 30.220 55 0.7218 68.449
15 −1.8714 31.818 56 0.7843 69.144
16 −1.7788 33.364 57 0.8477 69.854
17 −1.6902 34.856 58 0.9123 70.573
18 −1.6050 36.279 59 0.9779 71.302
19 −1.5229 37.664 60 1.0449 72.048
20 −1.4436 38.995 61 1.1133 72.810
21 −1.3667 40.273 62 1.1833 73.585
22 −1.2921 41.510 63 1.2551 74.377
23 −1.2194 42.696 64 1.3288 75.187
24 −1.1486 43.849 65 1.4047 76.021
25 −1.0793 44.960 66 1.4831 76.881
26 −1.0116 46.031 67 1.5642 77.762
27 −0.9452 47.066 68 1.6483 78.658
28 −0.8800 48.082 69 1.7360 79.597
29 −0.8159 49.044 70 1.8275 80.555
30 −0.7528 49.990 71 1.9236 81.548
31 −0.6906 50.901 72 2.0249 82.575
32 −0.6291 51.791 73 2.1322 83.631
33 −0.5684 52.651 74 2.2466 84.728
34 −0.5084 53.493 75 2.3695 85.864
35 −0.4489 54.312 76 2.5026 87.041
36 −0.3899 55.107 77 2.6484 88.261
37 −0.3313 55.891 78 2.8102 89.531
38 −0.2730 56.659 79 2.9930 90.847
39 −0.2150 57.403 80 3.2042 92.214
40 −0.1574 58.135 81 3.4567 93.634

Prepared for NYSED by Pearson 55
Appendix C: Item Writing Guidelines
GUIDELINES FOR WRITING MULTIPLE-CHOICE ITEMS 1. The item should focus on a single issue, problem, or topic stated clearly and concisely
in the stem. 2. The item should be written in clear and simple language, with vocabulary and sentence
structure kept as simple as possible. 3. The stem should be written as a direct question or an incomplete statement 4. The stem should not contain irrelevant or unnecessary detail. 5. The stem should be stated positively. Avoid using negatively stated stems. 6. The phrase which of the following should not be used to refer to the alternatives.
Instead use which followed by a noun. 7. The stem should include any words that must otherwise be repeated in each
alternative. 8. The item should have one and only one correct answer (key). 9. The distractors should be plausible and attractive to students who lack the knowledge,
understanding, or ability assessed by the item. 10. The alternatives should be grammatically consistent with the stem. 11. The alternatives should be parallel with one another in form. 12. The alternatives should be arranged in logical order, when possible. 13. The alternatives should be independent and mutually exclusive. 14. The item should not contain extraneous clues to the correct answer. 15. Items should be written in the third person. Use generic terms instead of proper nouns,
such as first names and brand names.

Prepared for NYSED by Pearson 56
CHECKLIST OF TEST CONSTRUCTION PRINCIPLES
(Multiple-Choice Items)
YES
NO
1. Is the item significant?
2. Does the item have curricular validity?
3. Is the item presented in clear and simple language, with vocabulary kept as simple as possible?
4. Does the item have one and only one correct answer?
5. Does the item state one single central problem completely in the stem? (See Helpful Hint below.)
6. Does the stem include any extraneous material (“window dressing”)?
7. Are all responses grammatically consistent with the stem and parallel with one another in form?
8. Are all responses plausible (attractive to students who lack the information tested by the item)?
9. Are all responses independent and mutually exclusive?
10. Are there any extraneous clues due to grammatical inconsistencies, verbal associations, length of response, etc.?
11. Were the principles of Universal Design used in constructing the item?
HELPFUL HINT To determine if the stem is complete (meaningful all by itself): 1. Cover up the responses and read just the stem. 2. Try to turn the stem into a short-answer question by drawing a line after the last word. If
it is not a good-short answer item, then there may a problem with the stem. 3. The stem must consist of a statement that contains a verb.

Prepared for NYSED by Pearson 57
GUIDELINES FOR WRITING CONSTRUCTED-RESPONSE ITEMS 1. The item should focus on a single issue, problem, or topic stated clearly and concisely. 2. The item should be written with terminology, vocabulary and sentence structure kept as
simple as possible. The item should be free of irrelevant or unnecessary detail. 3. The item should be written in the third person. Use generic terms instead of proper
nouns such as first names and brand names. 4. The item should not contain extraneous clues to the correct answer. 5. The item should assess student understanding of the material by requiring responses
that show evidence of knowledge, comprehension, application, analysis, synthesis, and/or evaluation.
6. When a stimulus is used, an introduction is required. 7. The item should clearly specify what the student is expected to do to provide an
acceptable response. 8. A group of constructed response items should be arranged in logical sequence, and
each item should test different knowledge, understandings, and/or skills. 9. The stimulus should provide information/data that is scientifically accurate. 10. The source of each stimulus must be clearly identified for all material that is not original. 11. The introduction, stimulus (when used), item, student answer space, and rating guide
must correspond. 12. The rating guide must provide examples of correct responses. 13. The rating guide and items should clearly specify if credit is allowed for labeling units. If
no credit is allowed for units, the unit should be provided within the student answer space.
14. The rating guide should specify the acceptable range for numerical responses.
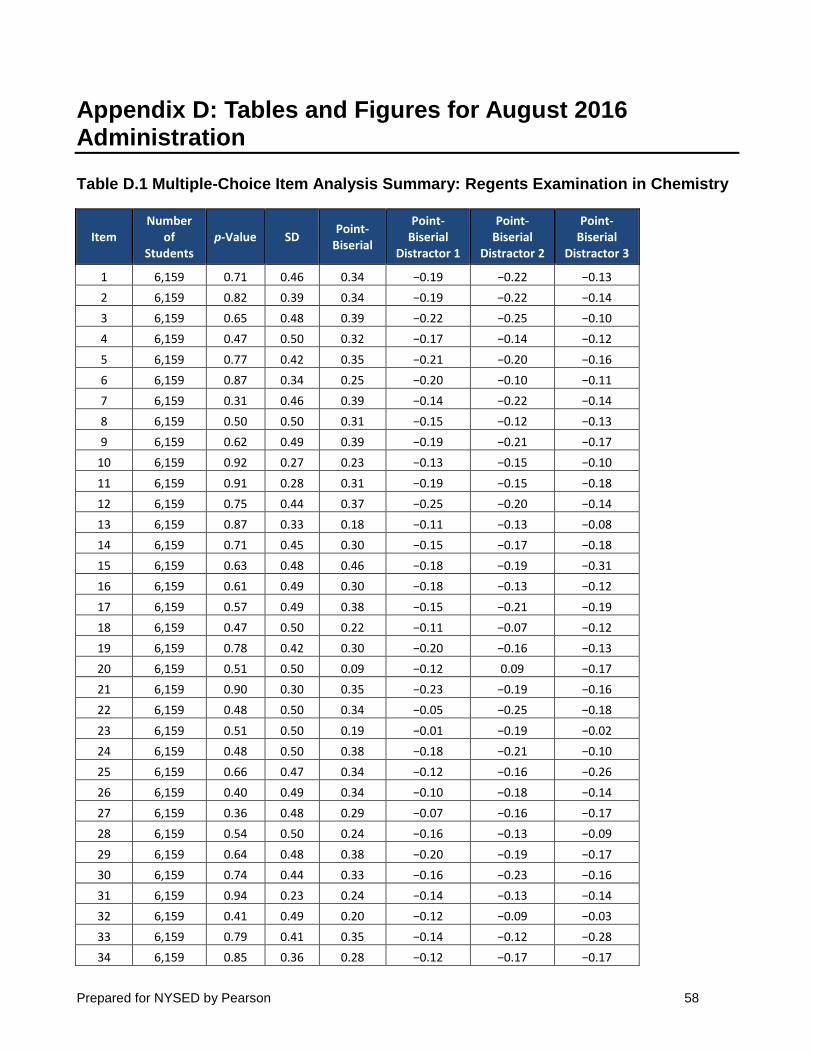
Prepared for NYSED by Pearson 58
Appendix D: Tables and Figures for August 2016 Administration
Table D.1 Multiple-Choice Item Analysis Summary: Regents Examination in Chemistry
Item Number
of Students
p-Value SD Point-
Biserial
Point-Biserial
Distractor 1
Point-Biserial
Distractor 2
Point-Biserial
Distractor 3
1 6,159 0.71 0.46 0.34 −0.19 −0.22 −0.13
2 6,159 0.82 0.39 0.34 −0.19 −0.22 −0.14
3 6,159 0.65 0.48 0.39 −0.22 −0.25 −0.10
4 6,159 0.47 0.50 0.32 −0.17 −0.14 −0.12
5 6,159 0.77 0.42 0.35 −0.21 −0.20 −0.16
6 6,159 0.87 0.34 0.25 −0.20 −0.10 −0.11
7 6,159 0.31 0.46 0.39 −0.14 −0.22 −0.14
8 6,159 0.50 0.50 0.31 −0.15 −0.12 −0.13
9 6,159 0.62 0.49 0.39 −0.19 −0.21 −0.17
10 6,159 0.92 0.27 0.23 −0.13 −0.15 −0.10
11 6,159 0.91 0.28 0.31 −0.19 −0.15 −0.18
12 6,159 0.75 0.44 0.37 −0.25 −0.20 −0.14
13 6,159 0.87 0.33 0.18 −0.11 −0.13 −0.08
14 6,159 0.71 0.45 0.30 −0.15 −0.17 −0.18
15 6,159 0.63 0.48 0.46 −0.18 −0.19 −0.31
16 6,159 0.61 0.49 0.30 −0.18 −0.13 −0.12
17 6,159 0.57 0.49 0.38 −0.15 −0.21 −0.19
18 6,159 0.47 0.50 0.22 −0.11 −0.07 −0.12
19 6,159 0.78 0.42 0.30 −0.20 −0.16 −0.13
20 6,159 0.51 0.50 0.09 −0.12 0.09 −0.17
21 6,159 0.90 0.30 0.35 −0.23 −0.19 −0.16
22 6,159 0.48 0.50 0.34 −0.05 −0.25 −0.18
23 6,159 0.51 0.50 0.19 −0.01 −0.19 −0.02
24 6,159 0.48 0.50 0.38 −0.18 −0.21 −0.10
25 6,159 0.66 0.47 0.34 −0.12 −0.16 −0.26
26 6,159 0.40 0.49 0.34 −0.10 −0.18 −0.14
27 6,159 0.36 0.48 0.29 −0.07 −0.16 −0.17
28 6,159 0.54 0.50 0.24 −0.16 −0.13 −0.09
29 6,159 0.64 0.48 0.38 −0.20 −0.19 −0.17
30 6,159 0.74 0.44 0.33 −0.16 −0.23 −0.16
31 6,159 0.94 0.23 0.24 −0.14 −0.13 −0.14
32 6,159 0.41 0.49 0.20 −0.12 −0.09 −0.03
33 6,159 0.79 0.41 0.35 −0.14 −0.12 −0.28
34 6,159 0.85 0.36 0.28 −0.12 −0.17 −0.17

Prepared for NYSED by Pearson 59
Item Number
of Students
p-Value SD Point-
Biserial
Point-Biserial
Distractor 1
Point-Biserial
Distractor 2
Point-Biserial
Distractor 3
35 6,159 0.40 0.49 0.32 −0.12 −0.13 −0.14
36 6,159 0.42 0.49 0.40 −0.13 −0.21 −0.17
37 6,159 0.56 0.50 0.27 0.05 −0.16 −0.26
38 6,159 0.50 0.50 0.25 −0.11 −0.12 −0.09
39 6,159 0.83 0.38 0.35 −0.19 −0.22 −0.15
40 6,159 0.75 0.43 0.25 −0.16 −0.11 −0.14
41 6,159 0.36 0.48 0.36 −0.19 −0.21 0.00
42 6,159 0.82 0.38 0.28 −0.16 −0.18 −0.10
43 6,159 0.58 0.49 0.28 −0.21 −0.20 −0.08
44 6,159 0.36 0.48 0.30 −0.10 −0.22 −0.14
45 6,159 0.63 0.48 0.33 −0.22 −0.15 −0.14
46 6,159 0.62 0.49 0.30 −0.23 −0.09 −0.09
47 6,159 0.52 0.50 0.48 −0.20 −0.24 −0.25
48 6,159 0.54 0.50 0.25 −0.17 −0.13 −0.08
49 6,159 0.86 0.35 0.25 −0.16 −0.12 −0.14
50 6,159 0.48 0.50 0.38 −0.22 −0.13 −0.16

Prepared for NYSED by Pearson 60
Table D.2 Constructed-Response Item Analysis Summary: Regents Examination in Chemistry
Item Min. score
Max. score
Number of
Students Mean SD p-Value
Point-Biserial
51 0 1 6,159 0.58 0.49 0.58 0.46
52 0 1 6,159 0.52 0.50 0.52 0.47
53 0 1 6,159 0.25 0.43 0.25 0.41
54 0 1 6,159 0.87 0.33 0.87 0.19
55 0 1 6,159 0.49 0.50 0.49 0.36
56 0 1 6,159 0.51 0.50 0.51 0.49
57 0 1 6,159 0.52 0.50 0.52 0.49
58 0 1 6,159 0.47 0.50 0.47 0.50
59 0 1 6,159 0.82 0.38 0.82 0.39
60 0 1 6,159 0.79 0.41 0.79 0.33
61 0 1 6,159 0.50 0.50 0.50 0.47
62 0 1 6,159 0.34 0.47 0.34 0.41
63 0 1 6,159 0.66 0.47 0.66 0.37
64 0 1 6,159 0.51 0.50 0.51 0.31
65 0 1 6,159 0.41 0.49 0.41 0.41
66 0 1 6,159 0.19 0.40 0.19 0.39
67 0 1 6,159 0.14 0.34 0.14 0.49
68 0 1 6,159 0.09 0.29 0.09 0.40
69 0 1 6,159 0.53 0.50 0.53 0.40
70 0 1 6,159 0.52 0.50 0.52 0.41
71 0 1 6,159 0.28 0.45 0.28 0.46
72 0 1 6,159 0.60 0.49 0.60 0.40
73 0 1 6,159 0.74 0.44 0.74 0.44
74 0 1 6,159 0.33 0.47 0.33 0.55
75 0 1 6,159 0.48 0.50 0.48 0.48
76 0 1 6,159 0.89 0.31 0.89 0.28
77 0 1 6,159 0.63 0.48 0.63 0.36
78 0 1 6,159 0.43 0.50 0.43 0.43
79 0 1 6,159 0.39 0.49 0.39 0.34
80 0 1 6,159 0.24 0.43 0.24 0.49
81 0 1 6,159 0.50 0.50 0.50 0.47
82 0 1 6,159 0.16 0.37 0.16 0.45
83 0 1 6,159 0.28 0.45 0.28 0.50
84 0 1 6,159 0.52 0.50 0.52 0.44
85 0 1 6,159 0.21 0.41 0.21 0.49

Prepared for NYSED by Pearson 61
Figure D.1 Scatter Plot: Regents Examination in Chemistry
Table D.3 Descriptive Statistics in p-value and Point-Biserial Correlation: Regents Examination in Chemistry
Statistics N Mean Min Q1 Median Q3 Max
p-value 85 0.56 0.09 0.43 0.52 0.74 0.94
Point-Biserial 85 0.36 0.09 0.30 0.35 0.41 0.55

Prepared for NYSED by Pearson 62
Figure D.2 Student Performance Map: Regents Examination in Chemistry
0 200 400 600
Student Distribution
CR(35 Items)MC(50 Items)StudentCut Scores
10 8 6 4 2 0
Item Distribution
-6
-5
-4
-3
-2
-1
0
1
2
3
4
5
6Theta
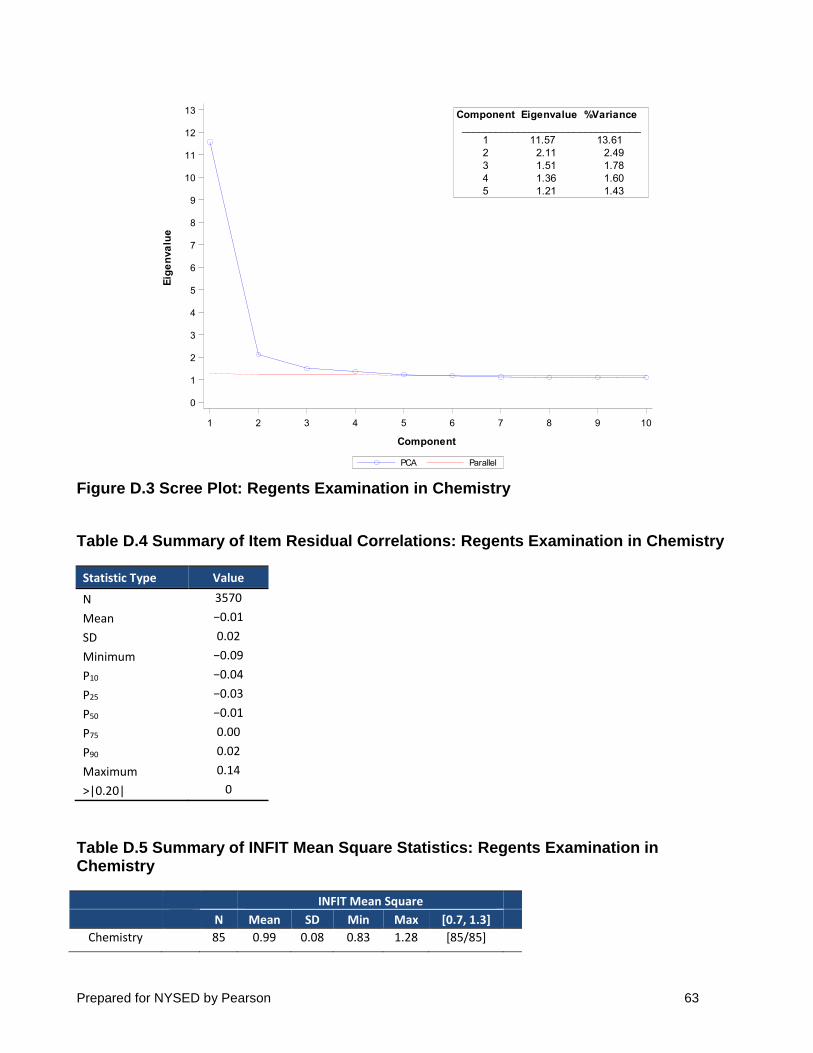
Prepared for NYSED by Pearson 63
Figure D.3 Scree Plot: Regents Examination in Chemistry
Table D.4 Summary of Item Residual Correlations: Regents Examination in Chemistry
Statistic Type Value
N 3570
Mean −0.01
SD 0.02
Minimum −0.09
P10 −0.04
P25 −0.03
P50 −0.01
P75 0.00
P90 0.02
Maximum 0.14
>|0.20| 0
Table D.5 Summary of INFIT Mean Square Statistics: Regents Examination in Chemistry
INFIT Mean Square
N Mean SD Min Max [0.7, 1.3] Chemistry 85 0.99 0.08 0.83 1.28 [85/85]
1 2 3 4 5 6 7 8 9 10
Component
0
1
2
3
4
5
6
7
8
9
10
11
12
13
Eig
en
va
lue
5 1.21 1.43
4 1.36 1.60
3 1.51 1.78
2 2.11 2.49
1 11.57 13.61
________________________________
Component Eigenvalue %Variance
ParallelPCA
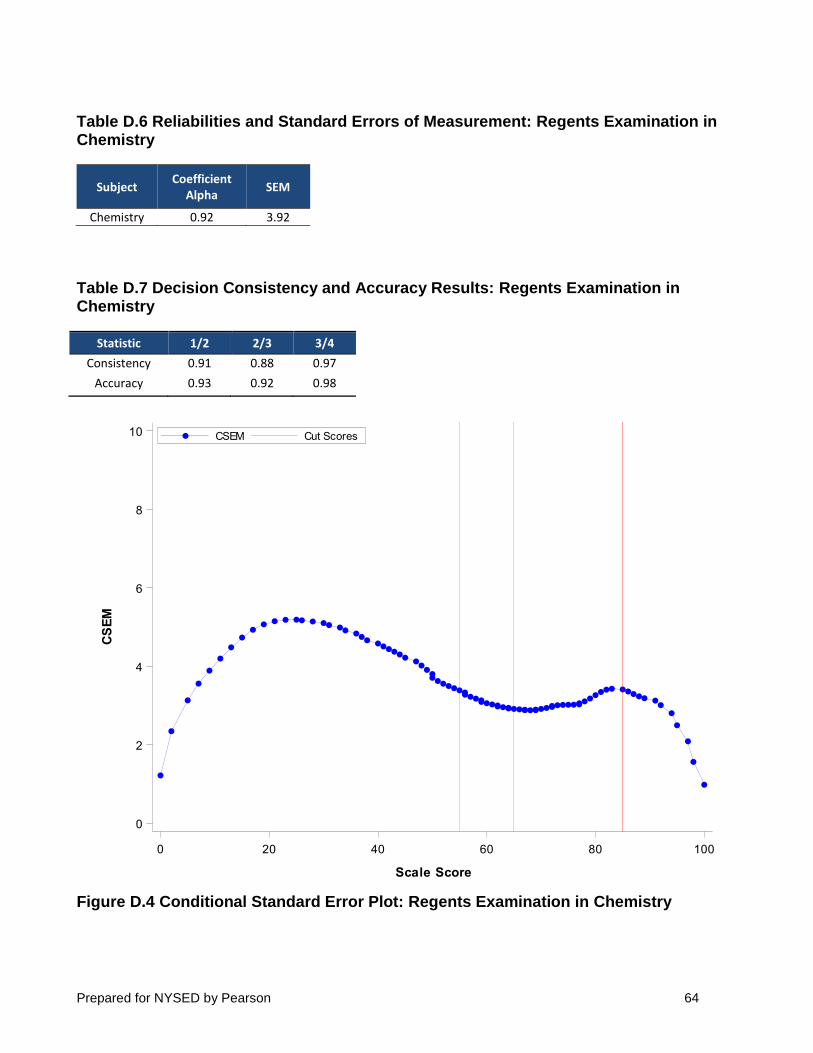
Prepared for NYSED by Pearson 64
Table D.6 Reliabilities and Standard Errors of Measurement: Regents Examination in Chemistry
Subject Coefficient
Alpha SEM
Chemistry 0.92 3.92
Table D.7 Decision Consistency and Accuracy Results: Regents Examination in Chemistry
Statistic 1/2 2/3 3/4
Consistency 0.91 0.88 0.97
Accuracy 0.93 0.92 0.98
Figure D.4 Conditional Standard Error Plot: Regents Examination in Chemistry
0 20 40 60 80 100
Scale Score
0
2
4
6
8
10
CS
EM
Cut ScoresCSEM
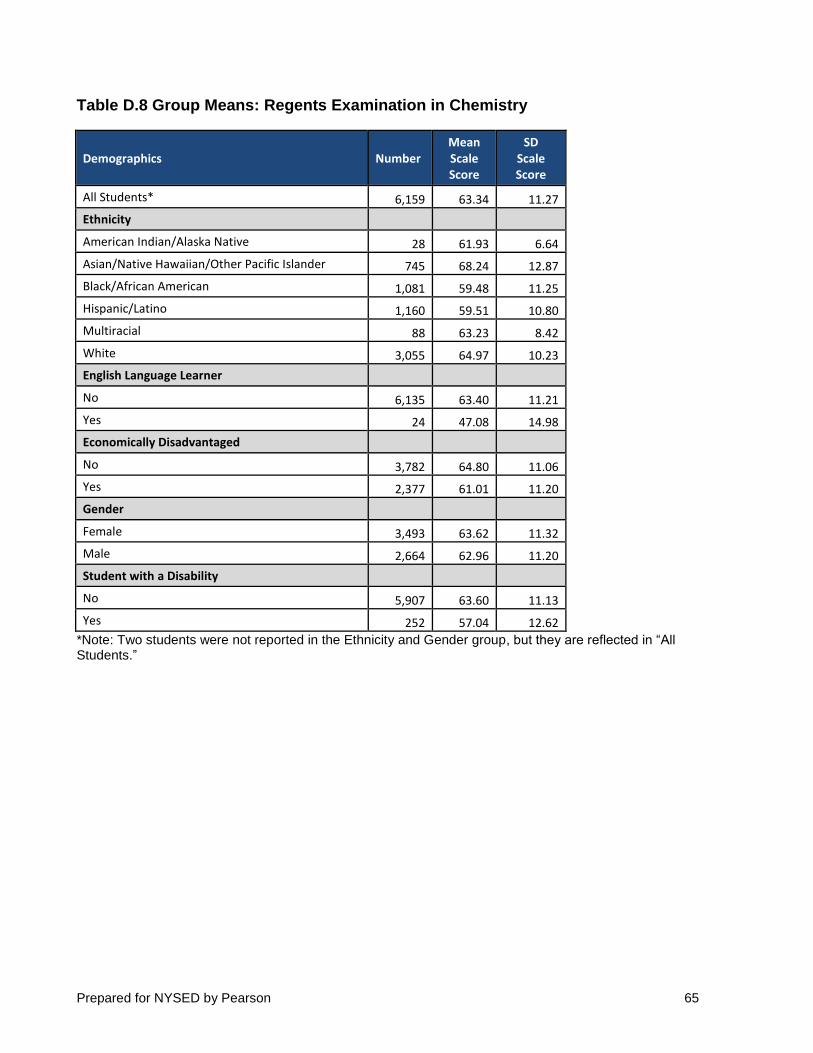
Prepared for NYSED by Pearson 65
Table D.8 Group Means: Regents Examination in Chemistry
Demographics Number Mean Scale Score
SD Scale Score
All Students* 6,159 63.34 11.27
Ethnicity
American Indian/Alaska Native 28 61.93 6.64
Asian/Native Hawaiian/Other Pacific Islander 745 68.24 12.87
Black/African American 1,081 59.48 11.25
Hispanic/Latino 1,160 59.51 10.80
Multiracial 88 63.23 8.42
White 3,055 64.97 10.23
English Language Learner
No 6,135 63.40 11.21
Yes 24 47.08 14.98
Economically Disadvantaged
No 3,782 64.80 11.06
Yes 2,377 61.01 11.20
Gender
Female 3,493 63.62 11.32
Male 2,664 62.96 11.20
Student with a Disability
No 5,907 63.60 11.13
Yes 252 57.04 12.62
*Note: Two students were not reported in the Ethnicity and Gender group, but they are reflected in “All Students.”

Prepared for NYSED by Pearson 66
Appendix E: Tables and Figures for January 2017 Administration
Table E.1 Multiple-Choice Item Analysis Summary: Regents Examination in Chemistry
Item Number
of Students
p-Value SD Point-
Biserial
Point-Biserial
Distractor 1
Point-Biserial
Distractor 2
Point-Biserial
Distractor 3
1 3,268 0.82 0.39 0.39 −0.18 −0.26 −0.19
2 3,268 0.45 0.50 0.34 −0.12 −0.16 −0.27
3 3,268 0.83 0.38 0.37 −0.13 −0.27 −0.17
4 3,268 0.72 0.45 0.36 −0.22 −0.21 −0.13
5 3,268 0.47 0.50 0.33 −0.14 −0.16 −0.18
6 3,268 0.63 0.48 0.34 −0.12 −0.24 −0.15
7 3,268 0.33 0.47 0.40 −0.12 −0.30 −0.05
8 3,268 0.63 0.48 0.36 −0.09 −0.27 −0.14
9 3,268 0.60 0.49 0.27 −0.13 −0.13 −0.14
10 3,268 0.87 0.33 0.22 −0.09 −0.16 −0.13
11 3,268 0.40 0.49 0.35 −0.19 −0.20 −0.04
12 3,268 0.54 0.50 0.43 −0.05 −0.15 −0.35
13 3,268 0.81 0.39 0.33 −0.18 −0.18 −0.17
14 3,268 0.48 0.50 0.49 −0.16 −0.30 −0.19
15 3,268 0.74 0.44 0.36 −0.22 −0.20 −0.14
16 3,268 0.73 0.44 0.31 −0.08 −0.25 −0.15
17 3,268 0.72 0.45 0.32 −0.21 −0.13 −0.15
18 3,268 0.71 0.45 0.38 −0.17 −0.23 −0.18
19 3,268 0.70 0.46 0.24 −0.14 −0.16 −0.11
20 3,268 0.65 0.48 0.29 −0.09 −0.12 −0.22
21 3,268 0.88 0.32 0.30 −0.15 −0.19 −0.15
22 3,268 0.65 0.48 0.47 −0.19 −0.30 −0.21
23 3,268 0.62 0.49 0.36 −0.10 −0.21 −0.22
24 3,268 0.58 0.49 0.38 −0.18 −0.23 −0.12
25 3,268 0.56 0.50 0.43 −0.29 −0.21 −0.08
26 3,268 0.45 0.50 0.42 −0.24 −0.15 −0.13
27 3,268 0.47 0.50 0.26 −0.14 −0.09 −0.15
28 3,268 0.23 0.42 0.37 −0.18 −0.13 −0.06
29 3,268 0.75 0.43 0.29 −0.14 −0.20 −0.13
30 3,268 0.57 0.49 0.35 −0.26 −0.13 −0.09
31 3,268 0.87 0.34 0.26 −0.17 −0.18 −0.09
32 3,268 0.61 0.49 0.36 −0.21 −0.14 −0.18
33 3,268 0.62 0.48 0.33 −0.21 −0.19 −0.07
34 3,268 0.71 0.46 0.37 −0.25 −0.19 −0.12
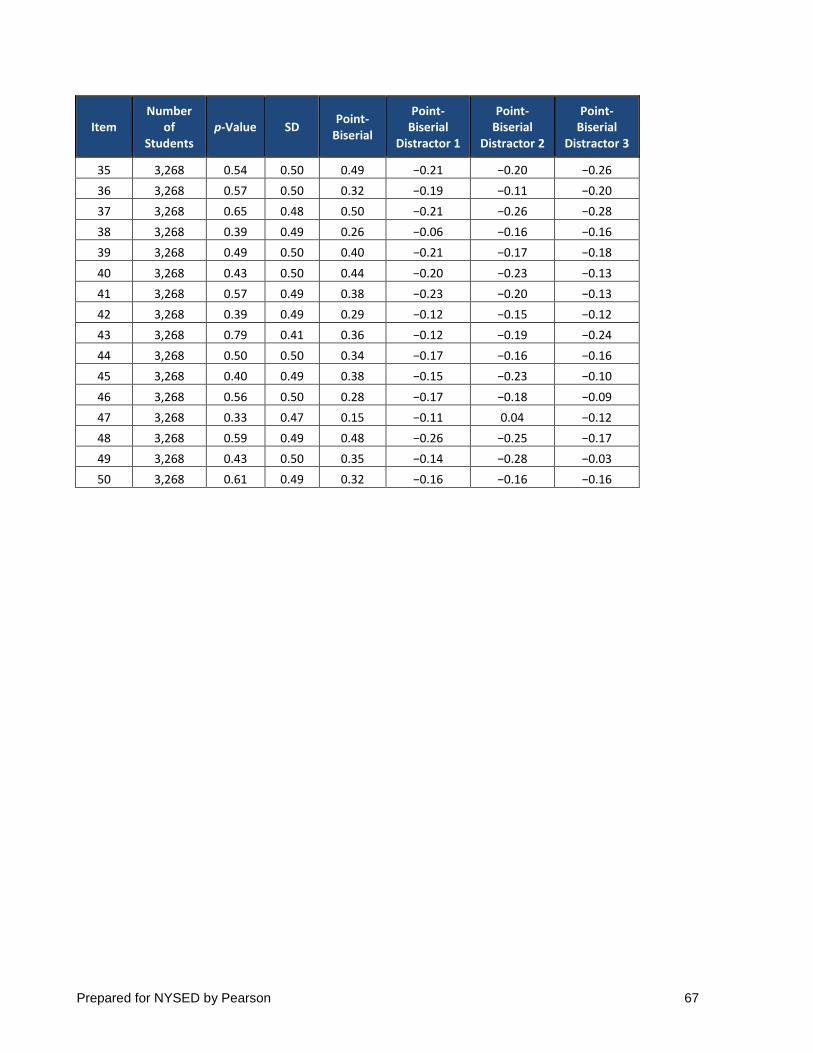
Prepared for NYSED by Pearson 67
Item Number
of Students
p-Value SD Point-
Biserial
Point-Biserial
Distractor 1
Point-Biserial
Distractor 2
Point-Biserial
Distractor 3
35 3,268 0.54 0.50 0.49 −0.21 −0.20 −0.26
36 3,268 0.57 0.50 0.32 −0.19 −0.11 −0.20
37 3,268 0.65 0.48 0.50 −0.21 −0.26 −0.28
38 3,268 0.39 0.49 0.26 −0.06 −0.16 −0.16
39 3,268 0.49 0.50 0.40 −0.21 −0.17 −0.18
40 3,268 0.43 0.50 0.44 −0.20 −0.23 −0.13
41 3,268 0.57 0.49 0.38 −0.23 −0.20 −0.13
42 3,268 0.39 0.49 0.29 −0.12 −0.15 −0.12
43 3,268 0.79 0.41 0.36 −0.12 −0.19 −0.24
44 3,268 0.50 0.50 0.34 −0.17 −0.16 −0.16
45 3,268 0.40 0.49 0.38 −0.15 −0.23 −0.10
46 3,268 0.56 0.50 0.28 −0.17 −0.18 −0.09
47 3,268 0.33 0.47 0.15 −0.11 0.04 −0.12
48 3,268 0.59 0.49 0.48 −0.26 −0.25 −0.17
49 3,268 0.43 0.50 0.35 −0.14 −0.28 −0.03
50 3,268 0.61 0.49 0.32 −0.16 −0.16 −0.16
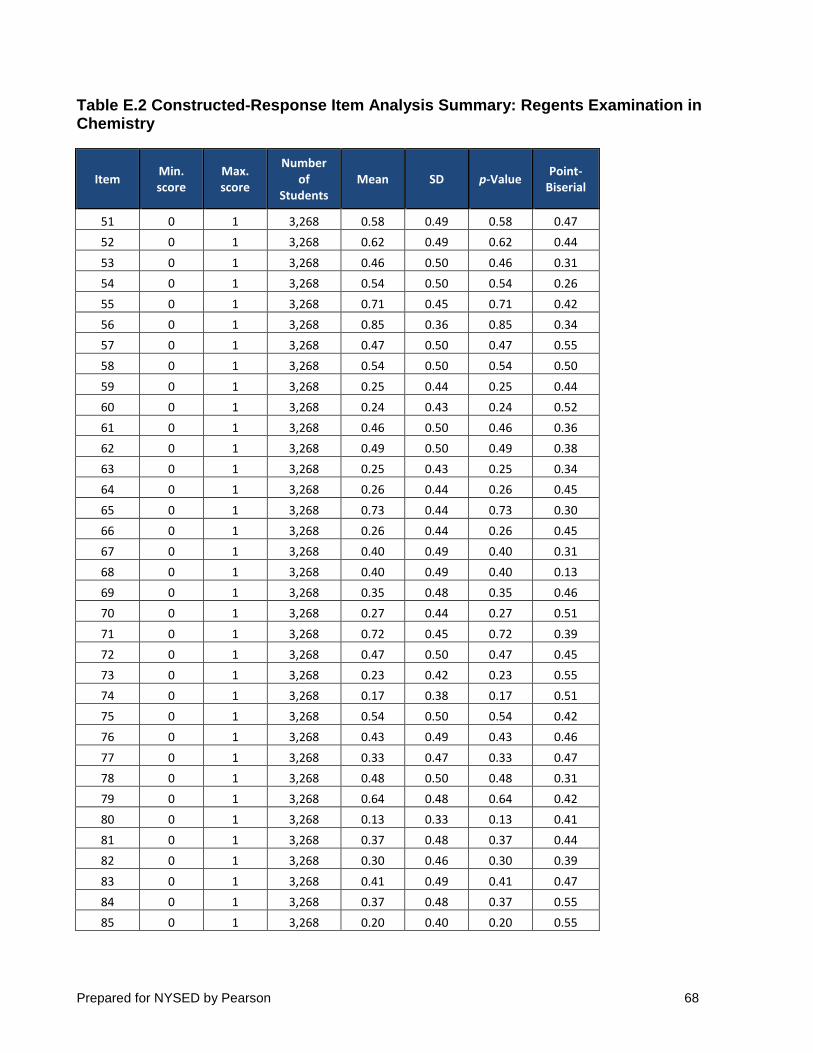
Prepared for NYSED by Pearson 68
Table E.2 Constructed-Response Item Analysis Summary: Regents Examination in Chemistry
Item Min. score
Max. score
Number of
Students Mean SD p-Value
Point-Biserial
51 0 1 3,268 0.58 0.49 0.58 0.47
52 0 1 3,268 0.62 0.49 0.62 0.44
53 0 1 3,268 0.46 0.50 0.46 0.31
54 0 1 3,268 0.54 0.50 0.54 0.26
55 0 1 3,268 0.71 0.45 0.71 0.42
56 0 1 3,268 0.85 0.36 0.85 0.34
57 0 1 3,268 0.47 0.50 0.47 0.55
58 0 1 3,268 0.54 0.50 0.54 0.50
59 0 1 3,268 0.25 0.44 0.25 0.44
60 0 1 3,268 0.24 0.43 0.24 0.52
61 0 1 3,268 0.46 0.50 0.46 0.36
62 0 1 3,268 0.49 0.50 0.49 0.38
63 0 1 3,268 0.25 0.43 0.25 0.34
64 0 1 3,268 0.26 0.44 0.26 0.45
65 0 1 3,268 0.73 0.44 0.73 0.30
66 0 1 3,268 0.26 0.44 0.26 0.45
67 0 1 3,268 0.40 0.49 0.40 0.31
68 0 1 3,268 0.40 0.49 0.40 0.13
69 0 1 3,268 0.35 0.48 0.35 0.46
70 0 1 3,268 0.27 0.44 0.27 0.51
71 0 1 3,268 0.72 0.45 0.72 0.39
72 0 1 3,268 0.47 0.50 0.47 0.45
73 0 1 3,268 0.23 0.42 0.23 0.55
74 0 1 3,268 0.17 0.38 0.17 0.51
75 0 1 3,268 0.54 0.50 0.54 0.42
76 0 1 3,268 0.43 0.49 0.43 0.46
77 0 1 3,268 0.33 0.47 0.33 0.47
78 0 1 3,268 0.48 0.50 0.48 0.31
79 0 1 3,268 0.64 0.48 0.64 0.42
80 0 1 3,268 0.13 0.33 0.13 0.41
81 0 1 3,268 0.37 0.48 0.37 0.44
82 0 1 3,268 0.30 0.46 0.30 0.39
83 0 1 3,268 0.41 0.49 0.41 0.47
84 0 1 3,268 0.37 0.48 0.37 0.55
85 0 1 3,268 0.20 0.40 0.20 0.55
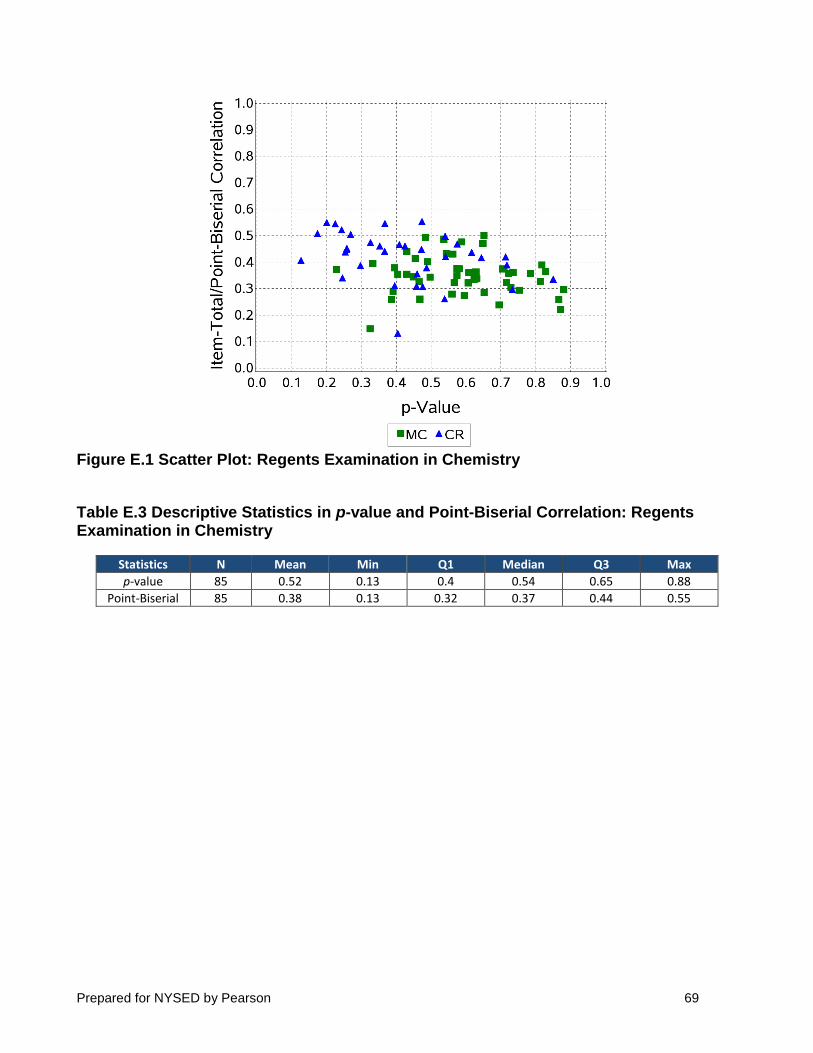
Prepared for NYSED by Pearson 69
Figure E.1 Scatter Plot: Regents Examination in Chemistry
Table E.3 Descriptive Statistics in p-value and Point-Biserial Correlation: Regents Examination in Chemistry
Statistics N Mean Min Q1 Median Q3 Max
p-value 85 0.52 0.13 0.4 0.54 0.65 0.88
Point-Biserial 85 0.38 0.13 0.32 0.37 0.44 0.55
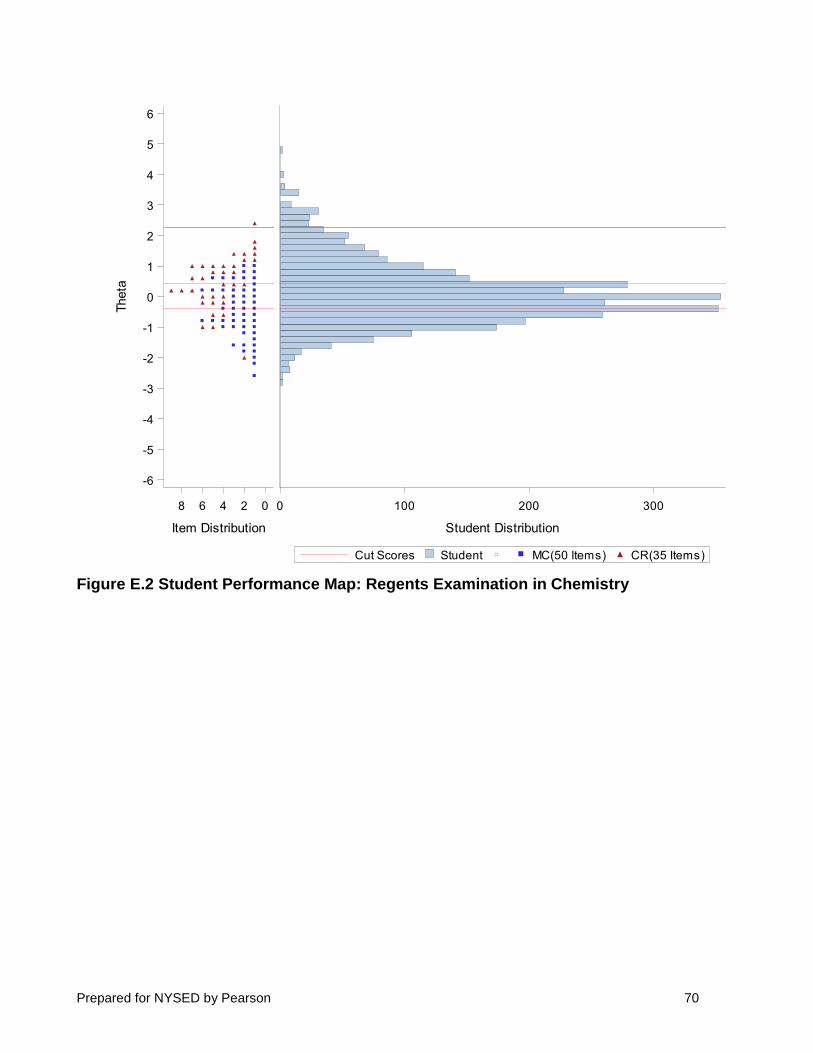
Prepared for NYSED by Pearson 70
Figure E.2 Student Performance Map: Regents Examination in Chemistry
0 100 200 300
Student Distribution
CR(35 Items)MC(50 Items)StudentCut Scores
8 6 4 2 0
Item Distribution
-6
-5
-4
-3
-2
-1
0
1
2
3
4
5
6Theta

Prepared for NYSED by Pearson 71
Figure E.3 Scree Plot: Regents Examination in Chemistry
Table E.4 Summary of Item Residual Correlations: Regents Examination in Chemistry
Statistic Type Value
N 3570
Mean −0.01
SD 0.03
Minimum −0.10
P10 −0.05
P25 −0.03
P50 −0.01
P75 0.01
P90 0.02
Maximum 0.28
>|0.20| 3
1 2 3 4 5 6 7 8 9 10
Component
0
1
2
3
4
5
6
7
8
9
10
11
12
13
14
Eig
en
va
lue
5 1.34 1.58
4 1.59 1.87
3 1.66 1.95
2 1.94 2.28
1 12.99 15.28
________________________________
Component Eigenvalue %Variance
ParallelPCA

Prepared for NYSED by Pearson 72
Table E.5 Summary of INFIT Mean Square Statistics: Regents Examination in Chemistry
INFIT Mean Square
N Mean SD Min Max [0.7, 1.3] Chemistry 85 1.00 0.09 0.82 1.29 [85/85]
Table E.6 Reliabilities and Standard Errors of Measurement: Regents Examination in Chemistry
Subject Coefficient
Alpha SEM
Chemistry 0.93 3.99
Table E.7 Decision Consistency and Accuracy Results: Regents Examination in Chemistry
Statistic 1/2 2/3 3/4
Consistency 0.89 0.90 0.98
Accuracy 0.92 0.93 0.98

Prepared for NYSED by Pearson 73
Figure E.4 Conditional Standard Error Plot: Regents Examination in Chemistry
0 20 40 60 80 100
Scale Score
0
2
4
6
8
10C
SE
MCut ScoresCSEM

Prepared for NYSED by Pearson 74
Table E.8 Group Means: Regents Examination in Chemistry
Demographics Number Mean Scale Score
SD Scale Score
All Students 3,268 60.90 12.10
Ethnicity
American Indian/Alaska Native 22 60.45 11.66
Asian/Native Hawaiian/Other Pacific Islander 493 61.99 12.46
Black/African American 658 57.77 11.04
Hispanic/Latino 912 57.72 10.93
Multiracial 49 62.94 10.97
White 1,134 64.71 12.31
English Language Learner
No 3,215 60.99 12.07
Yes 53 55.08 12.45
Economically Disadvantaged
No 1,423 63.23 12.82
Yes 1,845 59.10 11.19
Gender
Female 1,874 60.57 11.76
Male 1,394 61.34 12.54
Student with a Disability
No 3,135 61.13 12.07
Yes 133 55.41 11.48