new zealand residential property overview november 2006
TRANSCRIPT

New Zealand Residential Property OverviewNovember 2006

Agenda
Economic overview
• Mixed economic indicators
• Enough positives to keep household spending growing
• The monetary policy pipeline works - eventually
Residential building and property
• Why has this upturn been so prolonged?
• House sales, prices, rents, and building activity
The regions
• Key indicators from north to south

Mixed economic indicators
Annualised change, last 3 mths
Year-end % change
-40% -20% 0% 20% 40% 60%
Used cars
Dwelling consents (excl
apartments)
New cars
Retail sales
House prices

1%
2%
3%
4%
5%
6%
7%
02 03 04 05 06 07 08 09
Household spending and GDP
Real growth
(year ended)
Household
consumption
Total GDP

The economy’s soft landing
NZ’s external position starts to improve:
• imports contracting in response to weaker domestic demand
• global economic growth holds above 3%pa
• depreciation of the currency from highs of 2005
Household spending keeps growing:
• unemployment rate remains low
• tight labour market ensures good wage growth
• more Working for Families in 2007, and tax cuts from 2008
Setting monetary policy
No more rises:
• headline inflation has peaked – helps inflation expectations
• non-tradable inflation should ease
• below-potential output creates spare capacity
• household spending contracting
• effective mortgage rate still rising
• currency has done some tightening work since June
But plenty of reasons to delay any cuts:
• Bank’s inflation-fighting credibility has been eroded
• labour market tightness has continued to surprise

Interest rate outlook
5.0%
5.5%
6.0%
6.5%
7.0%
7.5%
8.0%
02 03 04 05 06 07 08 09
90-day bill
rates
Ten-year bond
rates

House sales
4,000
5,000
6,000
7,000
8,000
9,000
10,000
11,000
12,000
97 98 99 00 01 02 03 04 05 06
Monthly sales
(seasonally
adjusted)

House prices – the latest data
0
5
10
15
20
25
30
35
01 02 03 04 05 06
Number of areas with
quarterly price falls
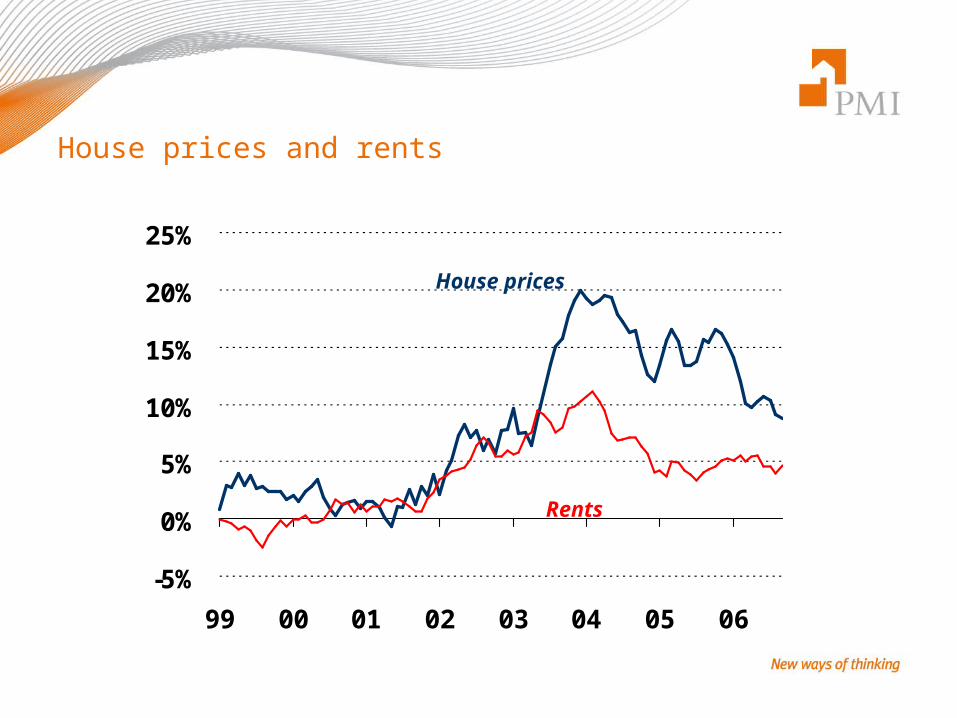
House prices and rents
-5%
0%
5%
10%
15%
20%
25%
99 00 01 02 03 04 05 06
House prices
Rents

Declining rental yields
3.0%
3.5%
4.0%
4.5%
5.0%
5.5%
6.0%
6.5%
99 00 01 02 03 04 05 06
Average gross
rental yield
Inflation-indexed
government bonds

New house building
19,000
21,000
23,000
25,000
27,000
29,000
31,000
33,000
35,000
02 03 04 05 06 07 08 09
Annual consent
total

Why such a long upturn?
• A shortage of houses?
• Rapid population growth?
• Higher incomes?
• Low real interest rates?
• Increased savings?
• Favourable tax treatment?
- Not much evidence that population is the main driver of demand
- High house prices have spurred supply
- Rental yields have fallen

House price growth
-5%
0%
5%
10%
15%
20%
25%
30%
02 03 04 05 06 07 08 09
Nov 05 forecast
Nov 06 forecast

Northland
Latest indicators:
• House sales growth: -15%pa
• House price growth: 9.7%pa
• Rental growth: 8.4%pa
• Consent growth: -0.3%pa
-20%
-10%
0%
10%
20%
30%
40%
50%
60%
02 03 04 05 06
Northland sales
growth
NZ sales
growth

Northland
Nominal house
price growth
-5%
0%
5%
10%
15%
20%
25%
30%
00 01 02 03 04 05 06 07 08 09
New Zealand
Northlan
d

Auckland
Latest indicators:
• House sales growth: -6.5%pa
• House price growth: 5.8%pa
• Rental growth: 2.5%pa
• Consent growth: -18%pa
-50%-40%-30%-20%-10%
0%10%20%30%40%50%60%
02 03 04 05 06
NZ consent
growth
Auckland consent
growth

Auckland
Nominal house
price growth
0%2%4%6%8%
10%12%14%16%18%20%
00 01 02 03 04 05 06 07 08 09
Auckland
New Zealand
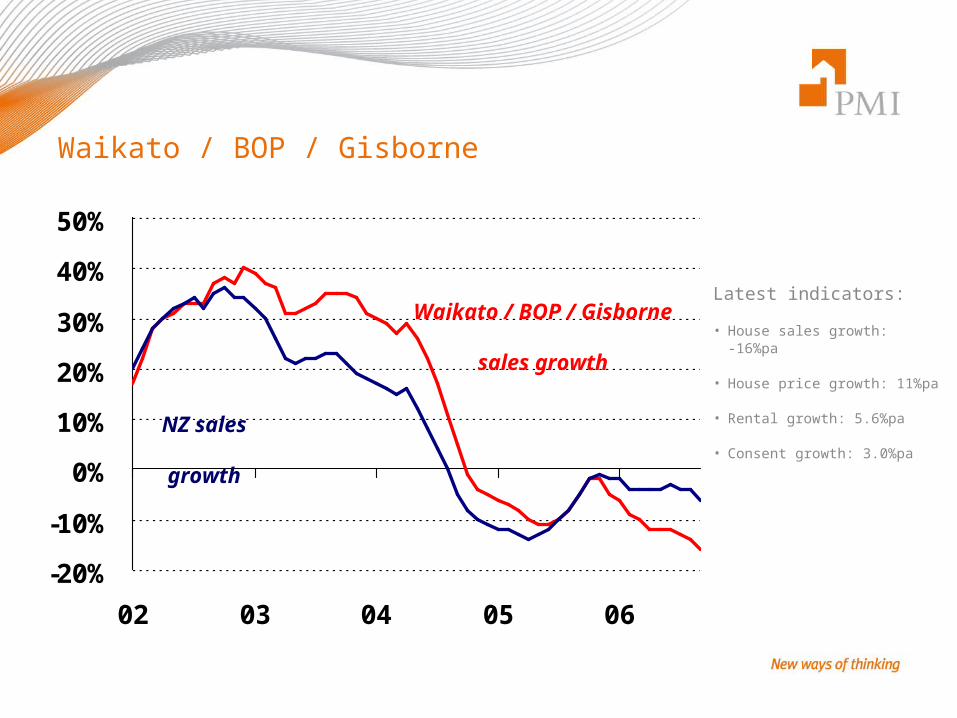
Waikato / BOP / Gisborne
Latest indicators:
• House sales growth: -16%pa
• House price growth: 11%pa
• Rental growth: 5.6%pa
• Consent growth: 3.0%pa
-20%
-10%
0%
10%
20%
30%
40%
50%
02 03 04 05 06
Waikato / BOP / Gisborne
sales growth
NZ sales
growth

Waikato / BOP / Gisborne
Nominal house
price growth
0%
5%
10%
15%
20%
25%
30%
00 01 02 03 04 05 06 07 08 09
New ZealandWaikato / Bay of
Plenty / Gisborne

Hawke’s Bay
Latest indicators:
• House sales growth: -1.1%pa
• House price growth: 1.9%pa
• Rental growth: 6.6%pa
• Consent growth: 12%pa
-30%
-20%
-10%
0%
10%
20%
30%
40%
50%
02 03 04 05 06
NZ consent
growth
Hawke’s Bay
consent growth

Hawke’s Bay
Nominal house
price growth
-10%
-5%
0%
5%
10%
15%
20%
25%
30%
35%
00 01 02 03 04 05 06 07 08 09
New Zealand
Hawke’s Bay

Taranaki / Manawatu / Wanganui
Latest indicators:
• House sales growth: -6.4%pa
• House price growth: 16%pa
• Rental growth: 7.8%pa
• Consent growth: 8.2%pa
-15%-10%-5%0%5%
10%15%20%25%30%35%
Sales Prices Consents
Taranaki
Manawatu
Wanganui

Taranaki / Manawatu / Wanganui
Nominal house
price growth
-5%
0%
5%
10%
15%
20%
25%
30%
00 01 02 03 04 05 06 07 08 09
New ZealandTaranaki /
Manawatu /
Wanganui
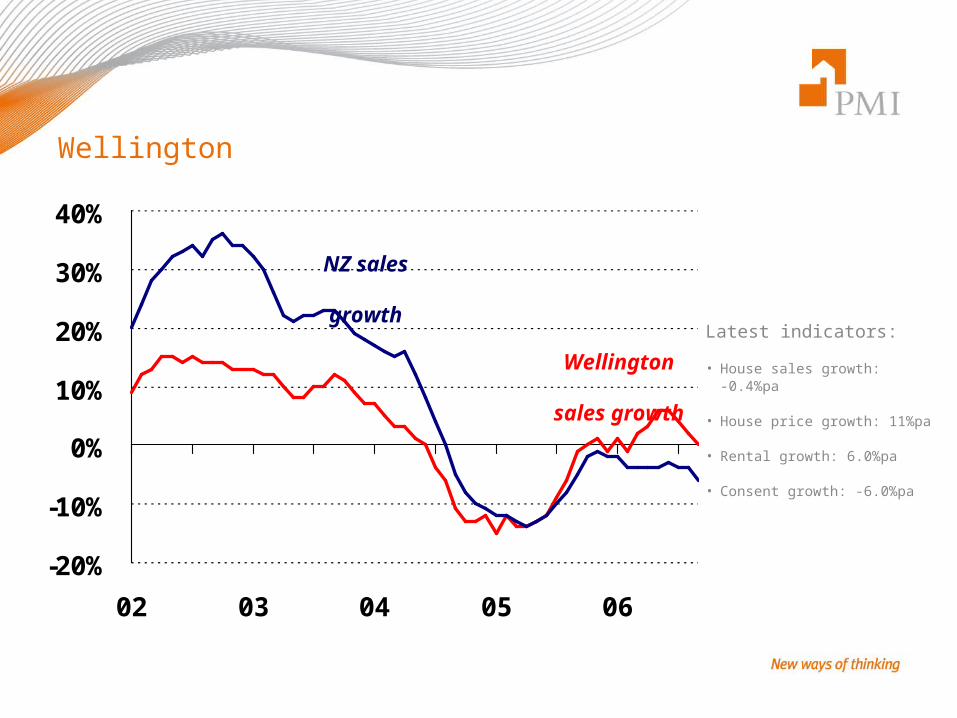
Wellington
Latest indicators:
• House sales growth: -0.4%pa
• House price growth: 11%pa
• Rental growth: 6.0%pa
• Consent growth: -6.0%pa
-20%
-10%
0%
10%
20%
30%
40%
02 03 04 05 06
Wellington
sales growth
NZ sales
growth

Wellington
Nominal house
price growth
0%2%4%6%8%
10%12%14%16%18%20%
00 01 02 03 04 05 06 07 08 09
New Zealand
Wellington

Nelson / Marlborough
Latest indicators:
• House sales growth: 7.1%pa
• House price growth: 12%pa
• Rental growth: 5.5%pa
• Consent growth: 1.9%pa
-30%
-20%
-10%
0%
10%
20%
30%
40%
50%
60%
02 03 04 05 06
Nelson /
Marlborough sales
growth
NZ sales
growth

Nelson / Marlborough
Nominal house
price growth
-5%
0%
5%
10%
15%
20%
25%
30%
35%
00 01 02 03 04 05 06 07 08 09
New Zealand
Nelson /
Marlborough

Christchurch
Latest indicators:
• House sales growth: -0.4%pa
• House price growth: 6.5%pa
• Rental growth: 4.2%pa
• Consent growth: 3.5%pa
-20%
-10%
0%
10%
20%
30%
40%
50%
02 03 04 05 06
NZ sales
growth
Christchurch
sales growth

Christchurch
Nominal house
price growth
-5%
0%
5%
10%
15%
20%
25%
30%
35%
00 01 02 03 04 05 06 07 08 09
New Zealand
Christchurch
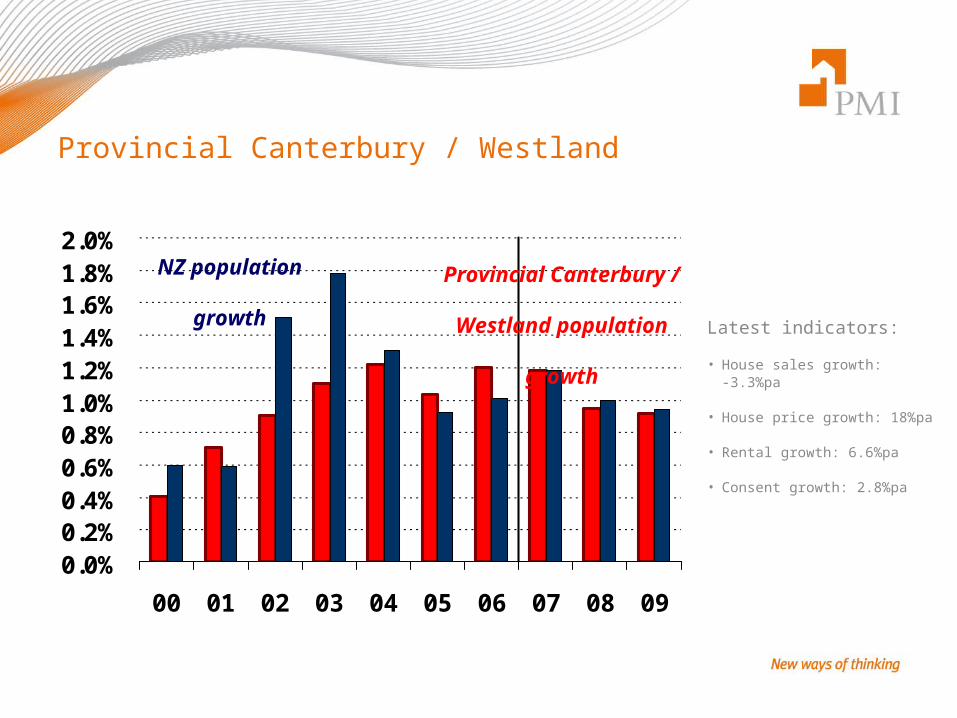
Provincial Canterbury / Westland
Latest indicators:
• House sales growth: -3.3%pa
• House price growth: 18%pa
• Rental growth: 6.6%pa
• Consent growth: 2.8%pa
0.0%0.2%0.4%0.6%0.8%1.0%1.2%1.4%1.6%1.8%2.0%
00 01 02 03 04 05 06 07 08 09
Provincial Canterbury /
Westland population
growth
NZ population
growth

Provincial Canterbury / Westland
Nominal house
price growth
-10%
-5%
0%
5%
10%
15%
20%
25%
30%
35%
00 01 02 03 04 05 06 07 08 09
New ZealandProvincial
Canterbury /
Westland

Otago / Southland
Latest indicators:
• House sales growth: 1.5%pa
• House price growth: 8.9%pa
• Rental growth: 3.9%pa
• Consent growth: 6.7%pa
-5%
0%
5%
10%
15%
20%
Sales Prices Consents
Coastal OtagoCentral
OtagoSouthlan
d
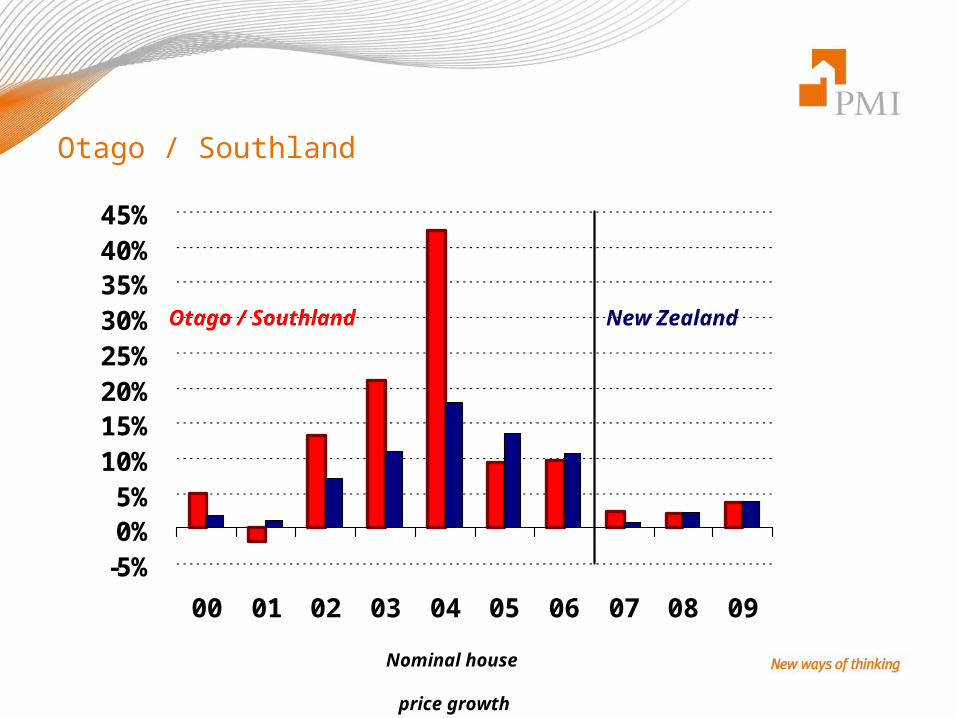
Otago / Southland
Nominal house
price growth
-5%0%5%
10%15%20%25%30%35%40%45%
00 01 02 03 04 05 06 07 08 09
New ZealandOtago / Southland

Summary
Economic growth near its low point, at 2%pa:
• Household spending has been pressured by interest rates, slower income growth, fuel prices
• Some improvement in net exports, but currency isn’t helping
• Tight labour market, good income growth, and tax cuts will restore confidence to spend
Signs of slowing housing market:
• Quarterly price falls in many areas
• Strong building activity will cap further price growth
• Sales, rents, and population growth all remain positive
Broader factors to prevent price falls:
• Baby boomer investment a medium term phenomenon
• Households remain in good position to service debt