new zealand steel analyst site visit - amazon s3...ross murray president new zealand steel &...
TRANSCRIPT

New Zealand Steel Analyst Site Visit
Ross Murray President New Zealand Steel & Pacific Islands 5 - 6 June 2008

2
Important Notice
THIS PRESENTATION IS NOT AND DOES NOT FORM PART OF ANY OFFER, INVITATION OR RECOMMENDATION IN RESPECT OF SECURITIES. ANY DECISION TO BUY OR SELL BLUESCOPE STEEL LIMITED SECURITIES OR OTHER PRODUCTS SHOULD BE MADE ONLY AFTER SEEKING APPROPRIATE FINANCIAL ADVICE. RELIANCE SHOULD NOT BE PLACED ON INFORMATION OR OPINIONS CONTAINED IN THIS PRESENTATION AND, SUBJECT ONLY TO ANY LEGAL OBLIGATION TO DO SO, BLUESCOPE STEEL DOES NOT ACCEPT ANY OBLIGATION TO CORRECT OR UPDATE THEM. THIS PRESENTATION DOES NOT TAKE INTO CONSIDERATION THE INVESTMENT OBJECTIVES, FINANCIAL SITUATION OR PARTICULAR NEEDS OF ANY PARTICULAR INVESTOR.
TO THE FULLEST EXTENT PERMITTED BY LAW, BLUESCOPE STEEL AND ITS AFFILIATES AND THEIR RESPECTIVE OFFICERS, DIRECTORS, EMPLOYEES AND AGENTS, ACCEPT NO RESPONSIBILITY FOR ANY INFORMATION PROVIDED IN THIS PRESENTATION, INCLUDING ANY FORWARD LOOKING INFORMATION, AND DISCLAIM ANY LIABILITY WHATSOEVER (INCLUDING FOR NEGLIGENCE) FOR ANY LOSS HOWSOEVER ARISING FROM ANY USE OF THIS PRESENTATION OR RELIANCE ON ANYTHING CONTAINED IN OR OMITTED FROM IT OR OTHERWISE ARISING IN CONNECTION WITH THIS.

3
Presentation
• Introduction– Safety Message– Organisation
• Safety • Environment & Sustainability• History• Blueprint• Operations & Financials• Marketing & Sales• Summary

4
BlueScope business structure
Noel Cornish Paul O’Keefe Mark Vassella (2) TBA Bob MooreBrian Kruger (1) (3)
Aus/NZ Steel Manufacturing
Businesses
Australian Coated and Industrial
Markets
Australian Distribution and
Solutions
CFO (Charlie Elias)
Asia
Legal (Michael Barron)
ChinaCorporate Strategy
and Innovation;North America,
People and Organisational Performance (Ian Cummin)Paul O’Malley
Managing Director and CEO
Note: (1) Mark Vassella will be succeeding Brian Kruger as President of the North American businesses (2) Mark Vassella’s current responsibilities – TBA(3) Corporate Strategy and innovation - TBA
Ross Murray
New Zealand Steel & Pacific Islands

5
New Zealand Steel & Pacific Islands
Gary HookVice President
NZ & PI BuildingMarkets
Anthony BurgVice President
Finance
Martin HaconVice President
Mining & Co-ProductBusinesses
Tony WrightVice President
Human Resources& External Affairs
Norm ClarkVice President
Engineering Services& Environment
Bob PulleinVice President
Operations
Scott FullerVice President
Marketing & Sales
Ross MurrayPresident
New Zealand Steel& Pacific Islands

6
3.54.1
5.9
3.42.4
1.20.6 0.6 0.9 0.7
16
14
8.0
4.8
0
2
4
6
8
10
12
14
16
18
1995 1996 1997 1998 1999 2000 2001 2002 2003 2004 2005 2006 2007 2008YTD
Lost
time i
njurie
s per
milli
on m
an-h
ours
worke
d
Medically Treated Injury Frequency Rate
Lost Time Injury Frequency Rate
6.2 5.3 3.6 3.6
60
52
47
3.9
13.7
29
22 2227
17
0
10
20
30
40
50
60
70
1995 1995 1997 1998 1999 2000 2001 2002 2003 2004 2005 2006 2007 2008YTD
Medic
ally t
reate
d inju
ries p
er m
illion
man
-hou
rs wo
rked
• Includes Contractor performance from 2004
Safety
Mission : Relentlessly reduce workplace injuryCore Elements : Felt Leadership, employee engagement, training, accountability
Highlights• Site-wide open access
safety and operational incident reporting system implemented 2007
• Alcohol and other drugs testing regime implemented site-wide in 2007
• Five BlueScope Steel Codes of Practice implemented
• Capital works of $13m invested in hazard elimination between 2005 - 2008
• Site security upgraded in 2007
• National award for Safety and Injury Prevention in the work place and community in general
Reported performance for IISI member companies (employees and contractors)

7
Non-compliance
Environmental
Highlights• Clean and Green initiative – continued landscaping
industrial site and key riparian zones in NZS farmland. Future work planned for both Glenbrook and Taharoa as mitigation measures for consented activities.
• Environmental Management System – ISO14001 certification for 3 operating sites since 2003; accountability driven to plants.
• Zero Waste initiative – Investigating further options for waste diversion, including material recovery for internal and external use and segregation of materials for recycling.
• Monitoring systems and measurement – Rigorous environmental monitoring (~1300 measurements taken monthly) with new resource consents implemented recently on 2 sites
• Community focus – support local environmental initiatives with schools and landcare group
• Capital focus –new fish pass on Taharoa mine water supply dam.
• Energy – Greenhouse Gas Inventory and Worlds Best Practice Study completed by Hatch in 2007.
• Energy improvement plans in place
0
5
10
15
20
25
FY 05FY 06FY 07
YTD
July
Augus
tSep
tembe
rOcto
ber
Novembe
rDece
mber
Jan'0
8Feb
ruary
March
April
Num
ber
Key Issue• Climate Change and New Zealand Government’s proposed
Emissions Trading Scheme (ETS)

8
Proposed Emissions Trading Scheme
• All gasses and eventually all sectors• Steel sector in scheme from December
2010• 90% free credits (2005 base) to 2018• Zero credits by 2030 (rate of credit
removal for trade exposed industry tested in 5 yearly rests from 2018)
New Zealand Steel• New Zealand Steel is seeking to be
excluded from the Scheme or granted 100% free credits
Proposed New Zealand Government Emission Trading Scheme

9
New Zealand Steel and sustainability – benefits of cogeneration
0
200
400
600
800
1000
1200
82/03
83/84
84/85
85/86
86/87
87/88
88/89
89/90
90/91
91/92
92/93
93/94
94/95
95/96
96/97
97/98
98/99
99/00
00/01
01/02
02/03
03/04
04/05
05/06
06/07
GW
h
Internal Cogeneration
Electricity from NZ grid
$200 million already spent to reduce energy demand. 60% of our New Zealand operations electricity needs produced on-site by co-generation from captured process gasses since mid ’90’s
10
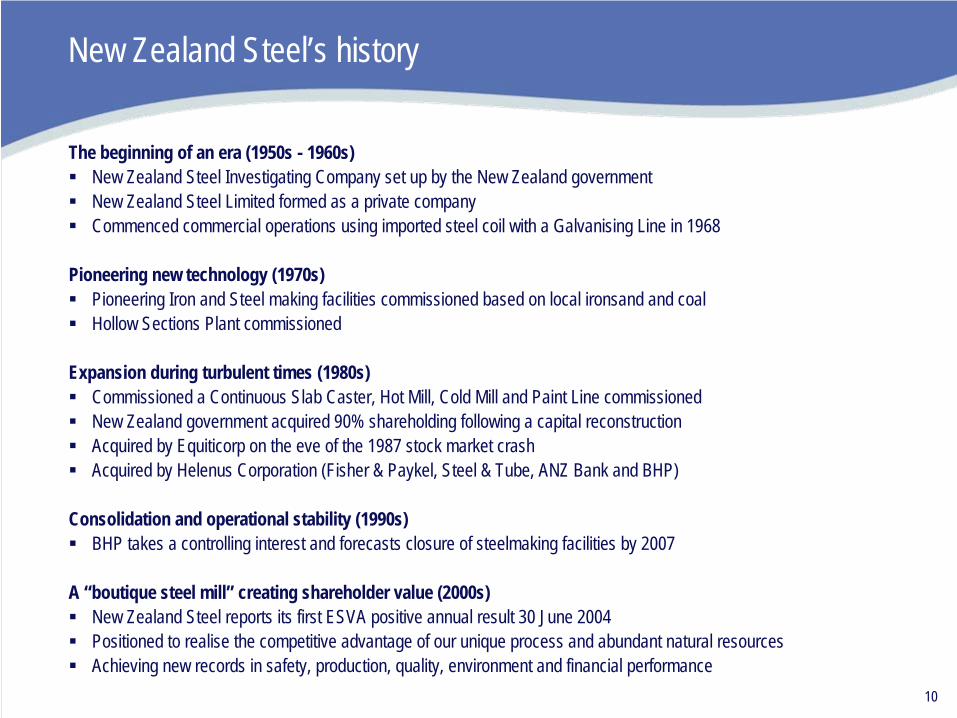
The beginning of an era (1950s - 1960s) New Zealand Steel Investigating Company set up by the New Zealand governmentNew Zealand Steel Limited formed as a private companyCommenced commercial operations using imported steel coil with a Galvanising Line in 1968
Pioneering new technology (1970s) Pioneering Iron and Steel making facilities commissioned based on local ironsand and coalHollow Sections Plant commissioned
Expansion during turbulent times (1980s)Commissioned a Continuous Slab Caster, Hot Mill, Cold Mill and Paint Line commissionedNew Zealand government acquired 90% shareholding following a capital reconstructionAcquired by Equiticorp on the eve of the 1987 stock market crashAcquired by Helenus Corporation (Fisher & Paykel, Steel & Tube, ANZ Bank and BHP)
Consolidation and operational stability (1990s)BHP takes a controlling interest and forecasts closure of steelmaking facilities by 2007
A “boutique steel mill” creating shareholder value (2000s)New Zealand Steel reports its first ESVA positive annual result 30 June 2004Positioned to realise the competitive advantage of our unique process and abundant natural resourcesAchieving new records in safety, production, quality, environment and financial performance
New Zealand Steel’s history
11
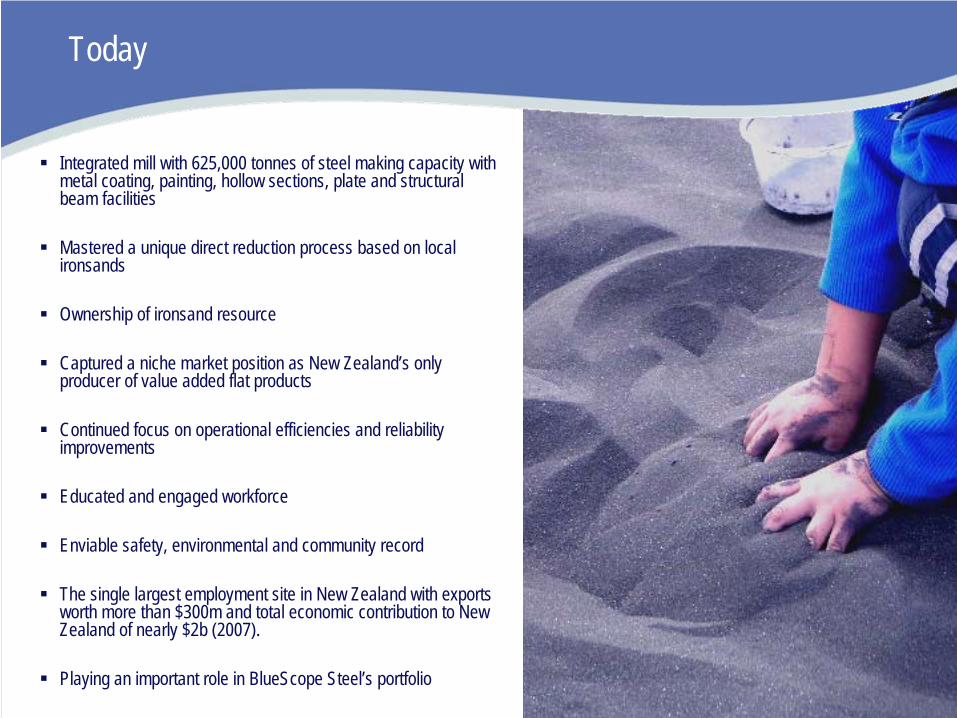
Integrated mill with 625,000 tonnes of steel making capacity with metal coating, painting, hollow sections, plate and structural beam facilities
Mastered a unique direct reduction process based on local ironsands
Ownership of ironsand resource
Captured a niche market position as New Zealand’s only producer of value added flat products
Continued focus on operational efficiencies and reliability improvements
Educated and engaged workforce
Enviable safety, environmental and community record
The single largest employment site in New Zealand with exports worth more than $300m and total economic contribution to New Zealand of nearly $2b (2007).
Playing an important role in BlueScope Steel’s portfolio
Today
12
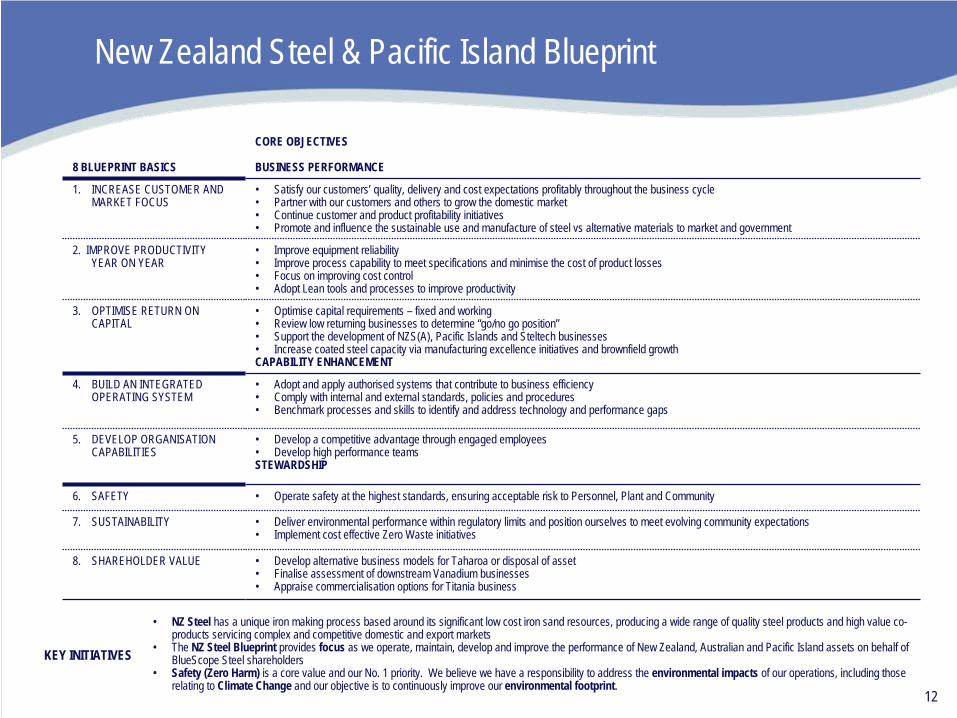
New Zealand Steel & Pacific Island Blueprint
8 BLUEPRINT BASICS
CORE OBJECTIVES
BUSINESS PERFORMANCE
1. INCREASE CUSTOMER AND MARKET FOCUS
• Satisfy our customers’ quality, delivery and cost expectations profitably throughout the business cycle• Partner with our customers and others to grow the domestic market• Continue customer and product profitability initiatives• Promote and influence the sustainable use and manufacture of steel vs alternative materials to market and government
2. IMPROVE PRODUCTIVITY YEAR ON YEAR
• Improve equipment reliability• Improve process capability to meet specifications and minimise the cost of product losses• Focus on improving cost control• Adopt Lean tools and processes to improve productivity
3. OPTIMISE RETURN ON CAPITAL
• Optimise capital requirements – fixed and working• Review low returning businesses to determine “go/no go position”• Support the development of NZS(A), Pacific Islands and Steltech businesses• Increase coated steel capacity via manufacturing excellence initiatives and brownfield growthCAPABILITY ENHANCEMENT
4. BUILD AN INTEGRATED OPERATING SYSTEM
• Adopt and apply authorised systems that contribute to business efficiency• Comply with internal and external standards, policies and procedures• Benchmark processes and skills to identify and address technology and performance gaps
5. DEVELOP ORGANISATION CAPABILITIES
• Develop a competitive advantage through engaged employees• Develop high performance teamsSTEWARDSHIP
6. SAFETY • Operate safety at the highest standards, ensuring acceptable risk to Personnel, Plant and Community
7. SUSTAINABILITY • Deliver environmental performance within regulatory limits and position ourselves to meet evolving community expectations• Implement cost effective Zero Waste initiatives
8. SHAREHOLDER VALUE • Develop alternative business models for Taharoa or disposal of asset• Finalise assessment of downstream Vanadium businesses• Appraise commercialisation options for Titania business
KEY INITIATIVES
• NZ Steel has a unique iron making process based around its significant low cost iron sand resources, producing a wide range of quality steel products and high value co- products servicing complex and competitive domestic and export markets
• The NZ Steel Blueprint provides focus as we operate, maintain, develop and improve the performance of New Zealand, Australian and Pacific Island assets on behalf of BlueScope Steel shareholders
• Safety (Zero Harm) is a core value and our No. 1 priority. We believe we have a responsibility to address the environmental impacts of our operations, including those relating to Climate Change and our objective is to continuously improve our environmental footprint.

13
Operations – New Zealand
Glenbrook
Waikato North HeadTaharoa
Auckland
TaurangaWharf
GlenbrookIron and Steel productionHot and Cold Rolling MillsDual Pot Metal Coating LinePaint LinePlate LineHollow sections plant
Waikato North Head MineConcentrated iron sand slurry pumped to Glenbrook
Taharoa MineApproximately 1mt concentrated iron sand shipped to Asia annually
AucklandStructural Beam plant
Tauranga WharfDeep sea export facilities

14
Operations – Pacific Islands & Australia
Fiji• Components business
• Roll formed roofing and cladding products plus accessories• Operate in two locations, Suva and Lautoka• FY07 sales of 4,500t
• PEB capability including in-house design, engineering, structural steel supply and fabrication
• Capacity of 1,500t per annum• Total FY07 sales of 5,500t • Business materially impacted by November 2006 coup
Australia• New Zealand Steel (Australia)
• Sales of between 80-200ktpa• Complementary to Australian business• Next best margin for New Zealand Steel after domestic and
helps combat other imports into Australian market
New Caledonia• Components business• FY07 sales of 5,700t
Vanuatu• Components business• FY07 sales of 570t

15
Production Process
Attached link takes you to full New Zealand Steel Production Process
http://www.bluescopesteel.com/index.cfm?objectid=4C8AE684-F795-D7AC-0477497D4DD97727

16
Unique direct reduction process

17
Iron Sand Concentrate (Waikato North Head Mine)Iron sand mined and concentrated on site - 58.5% Fe13mt of contained product in probable reserves and 13mt of contained product in proven reservesAdditional 591mt of inferred resourceConcentrate is slurry pumped 18km underground to Glenbrook
Coal Thermal coal predominantly from Solid Energy Approximately 0.8mt transported by rail to Glenbrook each yearHistorically had long term contract with Solid Energy. Currently in negotiation for a new contract but have concerns re Solid wanting to move way from previous arrangements (including pricing). Currently contract expires 30 June 2008. Considering range of options. Will update market when final details are available.Importing approximately 60ktpa Indonesian coal
Lime (McDonalds Lime - 28% NZS owned)34ktpa lime (oxide and chip) quarried and processed at OtorohangaRailed and trucked to Glenbrook
Raw materials
Export Iron Sand Concentrate (Taharoa Mine)Iron sand mined and concentrated on site - 57% Fe9mt of contained product in probable reserves and 22mt of contained product in proven reservesApproximately 1mt of concentrate is slurry pumped to a buoy 2.5km offshore to a dedicated slurry vessel and shipped to China and Japan annually

18
Steelmaking production & productivity
0
100
200
300
400
500
600
700
01/02 02/03 03/04 04/05 05/06 06/07 1H 07/08
(000
's to
nne)
Slab HRC
0
500
1000
1500
2000
2500
3000
01/02 02/03 03/04 04/05 05/06 06/07 1H 07/08Sl
ab to
nnes
per
prim
ary p
lant e
mpl
oyee
Slab tonnes (x1000) Slab tonnes per employee
ProductivityProduction
Half Year
Half Year
19
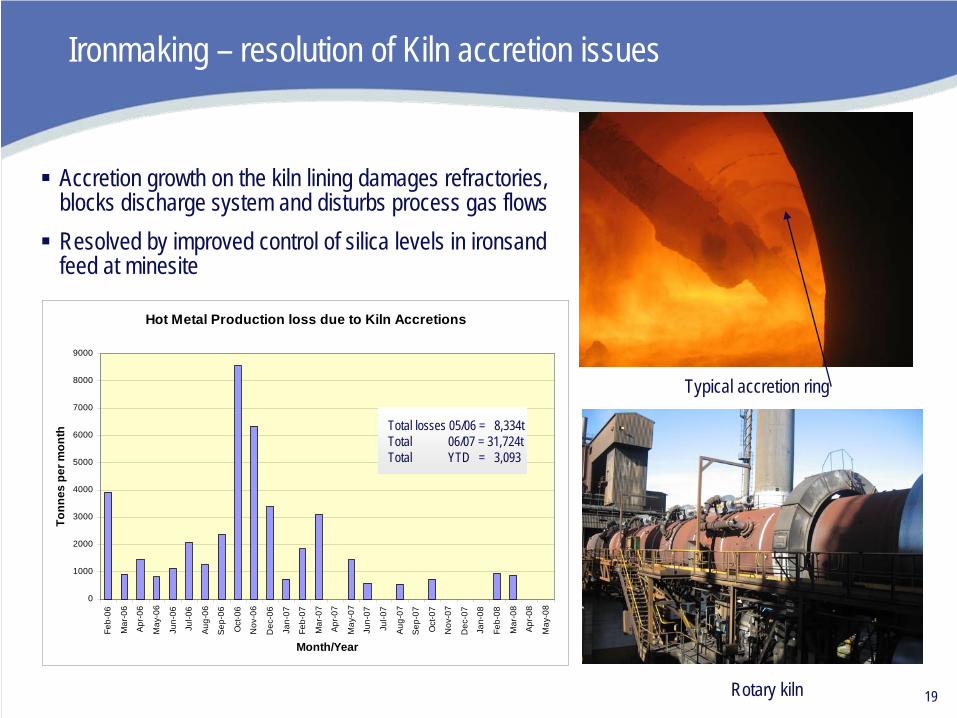
Ironmaking – resolution of Kiln accretion issues
Typical accretion ring
Rotary kiln
Hot Metal Production loss due to Kiln Accretions
0
1000
2000
3000
4000
5000
6000
7000
8000
9000
Feb-
06
Mar
-06
Apr
-06
May
-06
Jun-
06
Jul-0
6
Aug
-06
Sep
-06
Oct
-06
Nov
-06
Dec
-06
Jan-
07
Feb-
07
Mar
-07
Apr
-07
May
-07
Jun-
07
Jul-0
7
Aug
-07
Sep
-07
Oct
-07
Nov
-07
Dec
-07
Jan-
08
Feb-
08
Mar
-08
Apr
-08
May
-08
Month/Year
Tonn
es p
er m
onth Total losses 05/06 = 8,334t
Total 06/07 = 31,724tTotal YTD = 3,093
Accretion growth on the kiln lining damages refractories, blocks discharge system and disturbs process gas flowsResolved by improved control of silica levels in ironsandfeed at minesite
20
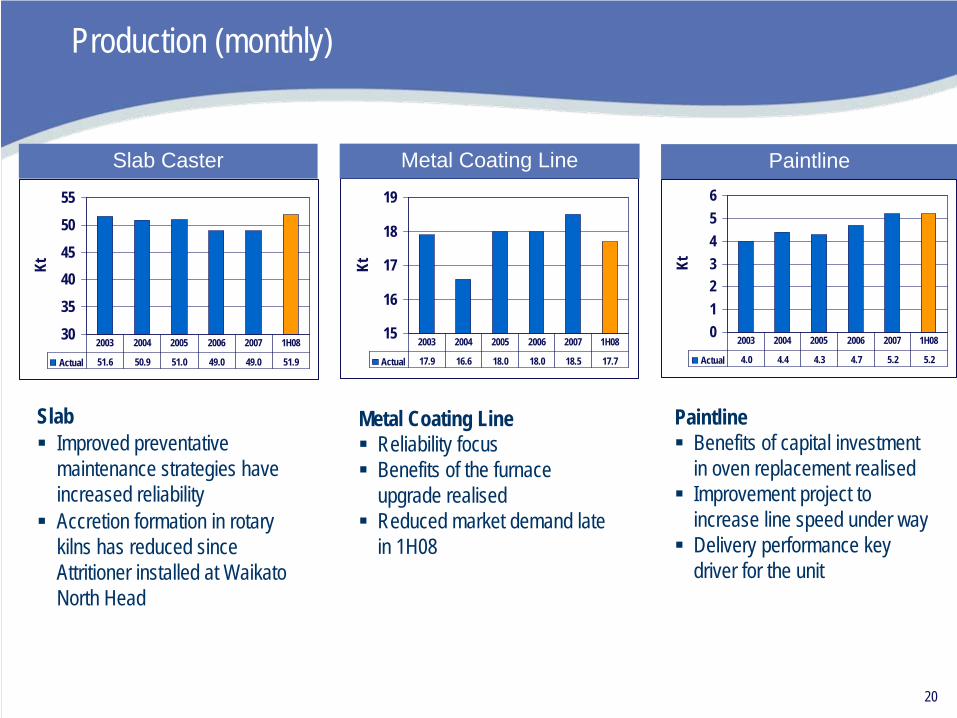
Production (monthly)
SlabImproved preventative maintenance strategies have increased reliability Accretion formation in rotary kilns has reduced since Attritioner installed at Waikato North Head
Metal Coating LineReliability focusBenefits of the furnace upgrade realisedReduced market demand late in 1H08
PaintlineBenefits of capital investment in oven replacement realisedImprovement project to increase line speed under wayDelivery performance key driver for the unit
0123456
Kt
Actual 4.0 4.4 4.3 4.7 5.2 5.2
2003 2004 2005 2006 2007 1H0815
16
17
18
19
KtActual 17.9 16.6 18.0 18.0 18.5 17.7
2003 2004 2005 2006 2007 1H08303540455055
Kt
Actual 51.6 50.9 51.0 49.0 49.0 51.9
2003 2004 2005 2006 2007 1H08
Slab Caster Metal Coating Line Paintline

21
Relentless cost control
FY 2008 Improvement Projects
0
5
10
15
20
25
Jul Aug Sep Oct Nov Dec Jan Feb Mar Apr May Jun
NZ$m
Examples of 2008 improvement projects include:• Introduction of universal primer• Reduction of breakouts• Procurement savings• Additional attritioner benefits• Additional slab production• Additional scrap and vanadium sales• Inventory reduction (held coil reduction)
Total Costs ($)
FY2006 FY2007 FY2008(e)
S&A Costs Despatch & Freight Raw Materials & Utilities

22
Capital
Commissioned Project Capex (A$m)1998 Melter 1 Reline $24.0m
2002 Melter 2 Reline $15.5m
2004 – 2005 Metal Coating Line UpgradePaint Line UpgradeSAP ERP
$14.0m$3.0m
$12.0m2006 HSM Computer Upgrade
Waikato North Head Tailings System UpgradePrimary Operations Plant & Equipment Rolling Mills Plant Upgrade
$8.0m$2.0m$8.0m$6.0m
2007 6 Hi Shape Control Attritioner
$3.0m$3.0m
2008 Metal Coating Line Drive UpgradeTapping Floor Automation (complete June 2010)
$4.5m$11.0m
Average capital invested 1998 – 2008 approximately A$23m per annum

23
Financial Performance – NZ & Pacific Steel Products
1. 2002 included Melter Reline2. 2005 includes 2 kiln shuts and steel plant shut
Fiscal Year 2000 2001 20021 2003 2004 20052 2006 2007 2008
1H 2H FY 1HRaw Steel (kt) 555 602 552 620 611 610 589 293 301 594 312
Sales Revenue $A 495 501 497 567 581 746 709 364 364 728 341
EBITDA $A 80 76 45 87 98 217 132 56 63 119 59
EBIT $A 49 46 13 49 62 189 105 42 48 90 44
Capital Expenditure $A 6 14 23 23 23 36 55 21 18 40 9
External Sales Volume (kt)Regional Domestic*ExportTotal
202373575
254298552
260284544
267205472
272239511
315276591
278300578
162121283
140140280
302261563
144132276
* Includes Pacific Island external sales, but excludes inter-company sales
24
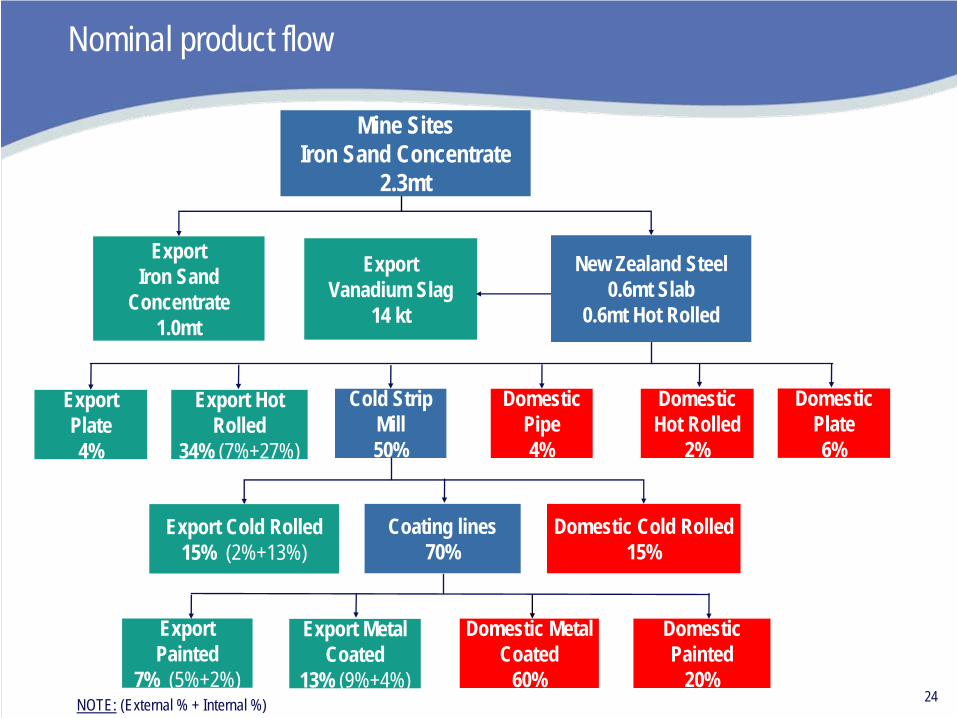
Export Hot Rolled
34% (7%+27%)
Domestic Pipe4%
Domestic Hot Rolled
2%
Export Cold Rolled15% (2%+13%)
Domestic Cold Rolled15%
Coating lines70%
Nominal product flow
Export Metal Coated
13% (9%+4%)
Domestic Painted
20%
Domestic Metal Coated
60%
ExportIron Sand
Concentrate1.0mt
Export Vanadium Slag
14 kt
Mine SitesIron Sand Concentrate
2.3mt
New Zealand Steel0.6mt Slab
0.6mt Hot Rolled
Cold Strip Mill50%
Export Plate 4%
Domestic Plate6%
Export Painted
7% (5%+2%)NOTE: (External % + Internal %)

25
Market – New Zealand sales vs export sales
Growing the NZ market
New Zealand market has softened in 1H FY08 vs1H FY07 largely due to
Strength of NZD affecting manufacturersWeaker coated market residential
Export despatches in 1H FY08 in line with 1H FY07
Reducing dependence on Deep Sea Exports
Sales within New Zealand
050
100150200250300350
1994 1995 1996 1997 1998 1999 2000FY's
2001 2002 2003 2004 2005 2006 2007 20081H
kt
Sales outside New Zealand (incl. Pacific Islands)
050
100150200250300350400450
1994 1995 1996 1997 1998 1999 2000FY's
2001 2002 2003 2004 2005 2006 2007 20081H
kt
Represents external and intercompany sales from Glenbrook, New Zealand

26
Domestic market structure is unique
Value Proposition
• Short lead times
• Stock lock in’s
• Small order size
• Delivery reliability
• Brands and Quality
• Technical back up
Major Competitors
• Pacific Coil Coaters – prepainted steel and largest customer at 40ktpa
• Australian Tube Mills - hollow sections
• OneSteel – structural beams
• Steel importers – coated products
Top 4 Domestic Customers = 80%
• Fletcher Building
• Steel & Tube
• Metalcraft
• Vulcan

27
New Zealand Steel - product distribution (1H08)
Indicative Product Mix (t) Indicative Sales by Country (t)
Pipe4%
Cold Rolled13%
Painted11%
Hot Rolled46%
Metal Coated26%
Building & Construction
20%
Distribution18%
Export50%
Indirect Export7%
Manufacturing5%
New Zealand51%
USA/Canada24%
Pacific Islands6%
Asia2%
Japan3%
Australia14%
Indicative Sales by Sector (t)
* External & Internal sales
(incl. Plate 12%)

28
New Zealand Steel - domestic sales (1H08)
Indicative Product Mix (t) Indicative Sales by Sector (t)
Hot Rolled17%
Pipe9%
Cold Rolled12%
Painted16%
Metal Coated46%
Other13%Distribution
36%
Building & Construction
41%
Manufacturing9%
(incl. Plate 13%)
* External & Internal sales

29
New Zealand domestic delivery performance
0102030405060708090
100
00/01 01/02 02/03 03/04 04/05 05/06 06/07 1H08
%
30
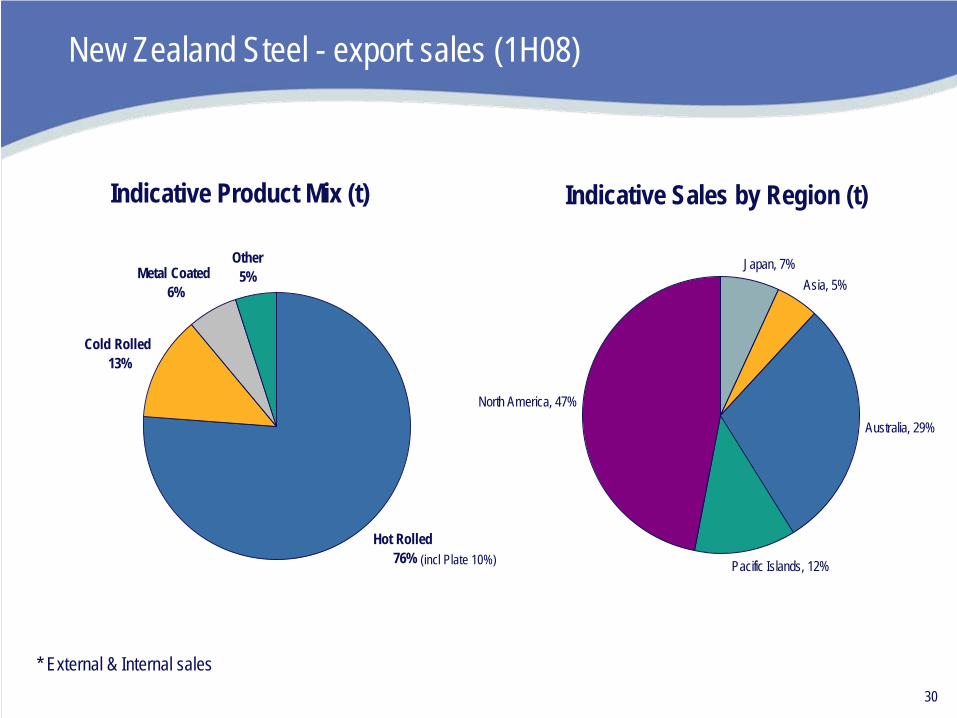
New Zealand Steel - export sales (1H08)
Indicative Product Mix (t) Indicative Sales by Region (t)
Japan, 7%Asia, 5%
Australia, 29%
Pacific Islands, 12%
North America, 47%
Hot Rolled 76%
Other 5%Metal Coated
6%
Cold Rolled 13%
(incl Plate 10%)
* External & Internal sales

31
Export sales geographic mix changed
• Optimising return of available export volumes has resulted in increasing importance of USA market
• Winner of 2007 AMCHAM Exporter of the Year award.
Export Total Volume By Regions FY2002
PAPUA NEW GUINEA 4%
SE ASIA11%
JAPAN10%
PACIFIC ISLANDS9%
CANADA4%
AUSTRALIA 37%
USA-WEST C25%
Export Total Volume By Regions FY2007
PAPUA NEW GUINEA 4%
CANADA6%
JAPAN7%
PACIFIC ISLANDS10%
AUSTRALIA 24%
USA-WEST C38%
SE ASIA11%
32
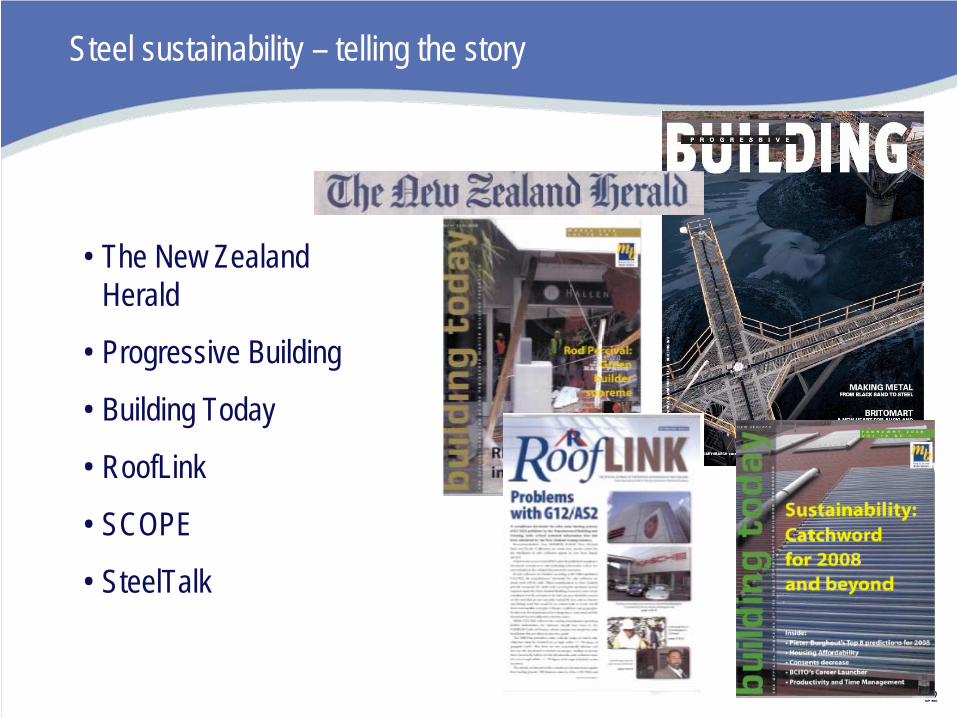
Steel sustainability – telling the story
• The New Zealand Herald
• Progressive Building
• Building Today
• RoofLink
• SCOPE
• SteelTalk

33
Steel sustainability & market share
• Low waste• 100% recyclable• High strength to weight ratio• Sensitive to building occupants• Non combustible

34
Steel sustainability & market share
•• LLaunch COLORSTEEL® CP Antibacterial
•• MMerchandising display stands
•• BBrand/product/channel print advertising
•• HHome Ideas Centre permanent display

35
Iron Sand Iron sand successfully repositioned as a blast furnace feed in niche markets (Sales 06/07 year 730kt, H1 07/08 year 418kt)Contracts with China and Japan
ScrapRecord iron production leading to surplus plate iron – high grade scrapRecord scrap prices makes searching for buried scrap attractive (Sales 06/07 year 80kt, H1 07/08 year 52kt)
SlagSold as road base by SteelServ
Vanadium SlagStrong international demand (Sales 06/07 year 14.5kt, H1 07/08 year 7.5kt)
Non steel revenue streams

36
Non steel revenue streams - Vanadium Slag
What is vanadium?Vanadium in its pure form is a metalIt is present in the NZS ore body as an oxide within the individual grains of Titanomagnetiteironsand. It is extracted in slag form from the Hot Metal (Liquid iron)
What is it used for?>90% of the worlds Vanadium is added to
steel as a strengthening alloythe fuel cell industry is a small but growing market
Buoyant world prices following industry consolidation
Record iron production leading to increased volumes
Major customers are located in Europe, China and the USA
0.00
5.00
10.00
15.00
20.00
25.00
30.00
1 Ju
n 19
801
Jun
1981
1 Ju
n 19
821
Jun
1983
1 Ju
n 19
841
Jun
1985
1 Ju
n 19
861
Jun
1987
1 Ju
n 19
881
Jun
1989
1 Ju
n 19
901
Jun
1991
1 Ju
n 19
921
Jun
1993
1 Ju
n 19
941
Jun
1995
1 Ju
n 19
961
Jun
1997
1 Ju
n 19
981
Jun
1999
1 Ju
n 20
001
Jun
2001
1 Ju
n 20
021
Jun
2003
1 Ju
n 20
041
Jun
2005
1 Ju
n 20
061
Jun
2007
1 Ju
n 20
08
US$
/lb
V2O5
Historical global market prices
37
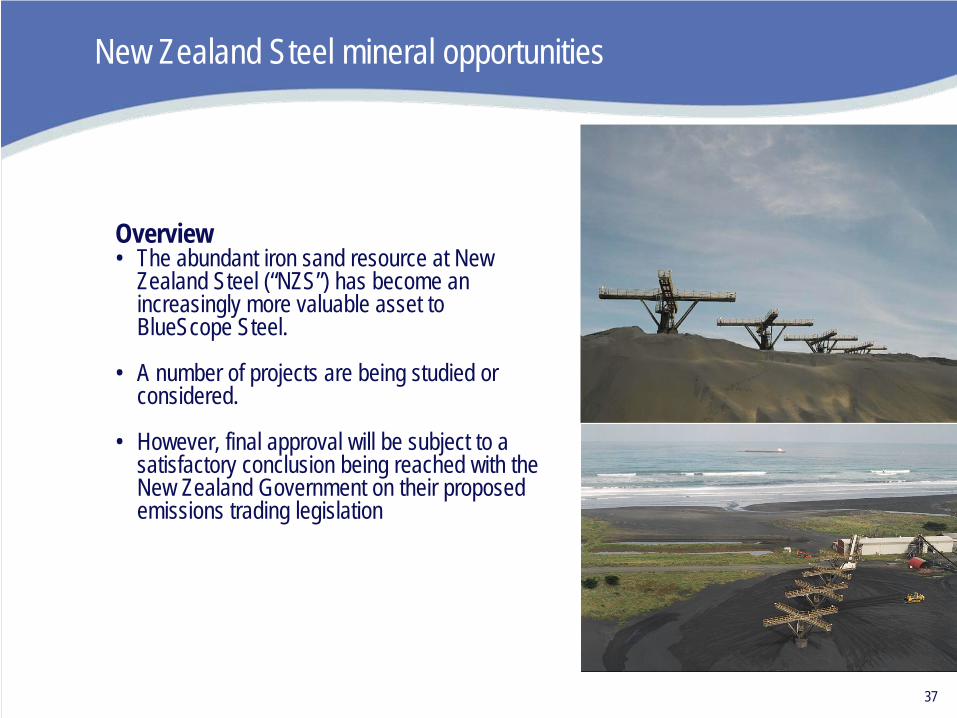
New Zealand Steel mineral opportunities
Overview• The abundant iron sand resource at New
Zealand Steel (“NZS”) has become an increasingly more valuable asset to BlueScope Steel.
• A number of projects are being studied or considered.
• However, final approval will be subject to a satisfactory conclusion being reached with the New Zealand Government on their proposed emissions trading legislation

38
Specific project opportunities
• The specific projects being studied or considered are:– Vanadium Converter Project – Increases the quality and quantity of vanadium slag recovered from the existing hot metal
supply. Also increases slab make thereby reducing slab unit cost and increasing revenue and overall plant utilisationFeasibility stage
– Taharoa Development or asset sale – The development case increases the quantity and quality of iron sands concentrateFeasibility stage
– Titania Project – Reprocesses tailings from the Waikato North Head mine extracting ilmenite for smelting into Titania slag and producing additional hot metal further increasing plant utilisationPrefeasibility stage
– Iron Make Project – Installation of new direct reduced iron technology to fully utilise the latent capacity of the existing melters. Significant benefits include additional vanadium extraction, lower slab unit costs and cost effective pig iron manufacture Prefeasibility stage
– Vanadium Pentoxide Option – Value adds to vanadium slag production through the conversion to Vanadium flake Concept stage
– Taharoa Pig Iron Option – Value adds to increased iron sand production at Taharoa in the medium term utilising emerging technology to meet a growing market demand for pig iron / ferrous scrap. Concept stage
39
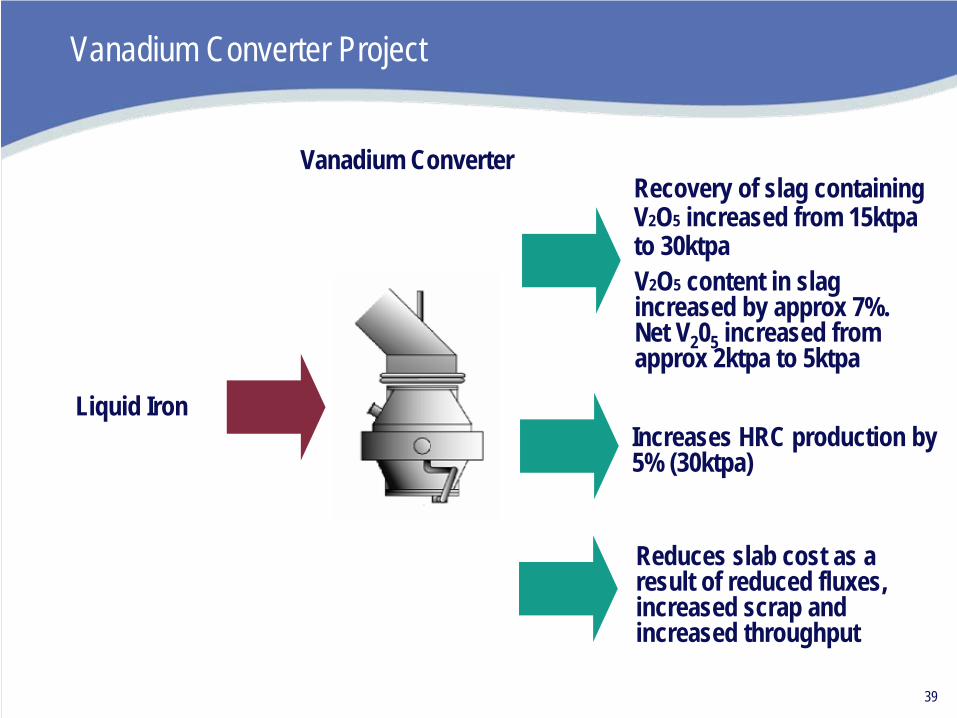
Vanadium Converter Project
Vanadium Converter
Increases HRC production by 5% (30ktpa)
Liquid Iron
Recovery of slag containing V2 O5 increased from 15ktpa to 30ktpa
Reduces slab cost as a result of reduced fluxes, increased scrap and increased throughput
V2 O5 content in slag increased by approx 7%. Net V2 05 increased from approx 2ktpa to 5ktpa
40
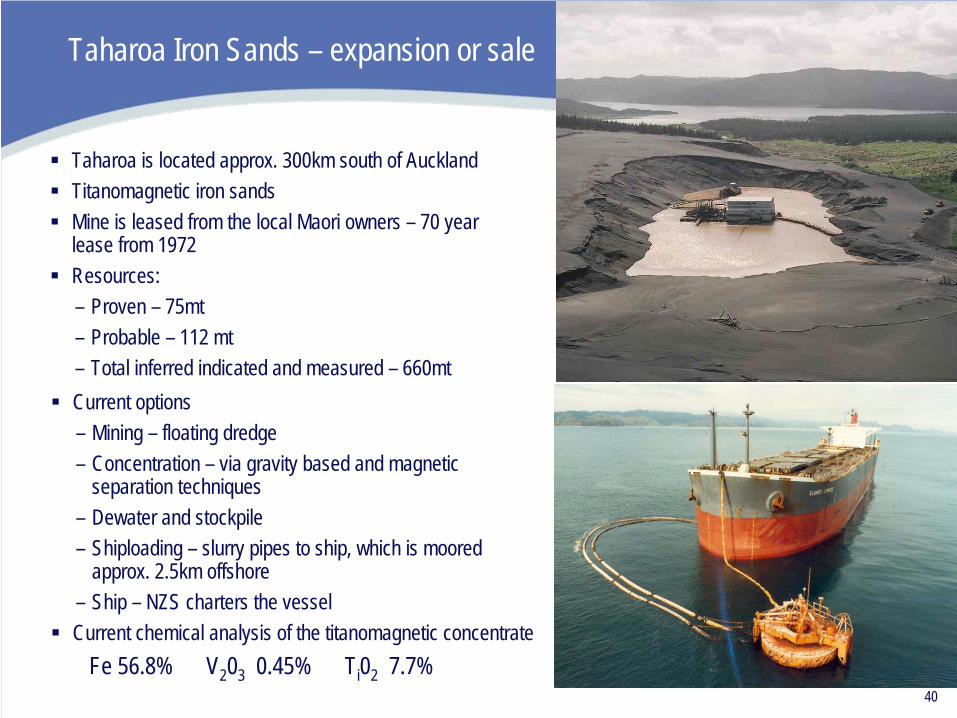
Taharoa Iron Sands – expansion or sale
Taharoa is located approx. 300km south of AucklandTitanomagnetic iron sandsMine is leased from the local Maori owners – 70 year lease from 1972Resources:– Proven – 75mt– Probable – 112 mt– Total inferred indicated and measured – 660mtCurrent options– Mining – floating dredge– Concentration – via gravity based and magnetic
separation techniques– Dewater and stockpile– Shiploading – slurry pipes to ship, which is moored
approx. 2.5km offshore– Ship – NZS charters the vesselCurrent chemical analysis of the titanomagnetic concentrate
Fe 56.8% V2 03 0.45% Ti 02 7.7%

41
Summary
• Continued focus on safety, environment and community
• Specific Blueprint focus on– Customers, market share and sustainable steel– Productivity and capability– System and organisationl capability– Optimisation Projects
• Vanadium Converter• Taharoa Iron Sands
• Focus on domestic market growth, New Zealand Steel & Pacific Islands profitability and increased contribution to BlueScope Steel portfolio

New Zealand Steel Analyst Site Visit
Ross Murray President New Zealand Steel & Pacific Islands 5 - 6 June 2008