newcastle university...
TRANSCRIPT

Newcastle University ePrints
Zhang Y, Forootan SS, Kamalian L, Bao ZZ, Malki MI, Foster CS, Ke
Y. Suppressing tumourigenicity of prostate cancer cells by inhibiting
osteopontin expression.
International Journal of Oncology 2011, 38(4), 1083-1091.
Copyright:
The definitive version of this article, published by Spandidos Publications Ltd, 2011, is available at:
http://dx.doi.org/10.3892/ijo.2011.932
Always use the definitive version when citing.
Further information on publisher website: http://www.spandidos-publications.com
Date deposited: 23rd July 2013
Article version: Published
This work is licensed under a Creative Commons Attribution-NonCommercial 3.0 Unported License
ePrints – Newcastle University ePrints
http://eprint.ncl.ac.uk
INTERNATIONAL JOURNAL OF ONCOLOGY 38: 1083-1091, 2011
Abstract. Expression of osteopontin (OPN) is increased in prostate cancer cells. The possibility of utilising the increased OPN as a target to suppress the tumourigenicity was investigated in this study. Small interference RNAs against OPN were transfected into highly malignant DU145 prostate cancer cells, which express high level of OPN prior to the transfections, to establish OPN-suppressed clones. Compared with the control transfectants generated by scrambled RNA, suppressed expression of OPN significantly inhibited cell invasiveness and anchorage-independent growth. Similar results were obtained from in vivo experiments. OPN-suppressed transfectants produced significant reductions in average sizes of subcutaneous tumours after inoculation into nude mice. When the levels of OPN measured in transfectants before injection were related to tumour sizes, the reduction in tumour sizes was not propotionally related to the inhibition in OPN-levels. However, when the levels of OPN were analysed in the tumour tissues, it was found that the reduced OPN expression levels were significantly associated with the reducing tumour sizes. These results showed that changes in OPN levels had occurred after the transfectants were inoculated in mice. This study suggested while OPN can be an effective target for therapeutic suppression of prostate cancer, more effective way than RNAi is needed to inhibit OPN expression.
Introduction
The pathogenesis of prostate cancer involves complicated molecular biology events. Like other malignant diseases, over-expression of cancer-promoting genes is one of the most important causes for the development and spread of prostate
cancer cells. Identification of these cancer-promoting genes and investigation of their potential as targets for therapeutic intervention is of paramount importance. OPN was involved in promoting tumourigenicity and malignant dissemination of breast cancer cells. The possibility of using OPN as a prognostic marker and a molecular target for therapeutic intervention in breast cancer cells has been well assessed (1-3). Similar to breast cancer, prostate cancer is also a hormone responsive cancer. Recently, over-expression of OPN in prostate cancer was reported and the prognostic significance of the increased OPN expression to prostate cancer patient survival has also been investigated (4). It is interesting to see whether the tumourigenicity of prostate cancer cells can be suppressed by inhibiting OPN expression as that observed in breast cancer.
OPN was first discovered by Senger et al in 1979 as a phosphoprotein secreted by transformed, malignant epithelial cells (5). It was rediscovered 10 years later, using molecular cloning, as a transformation-associated phosphoprotein whose level of expression was correlated with tumourigenicity (6). OPN was expressed in multiple species, such as human and rodents and it was found in various tissues and cell types, even in biological fluids (7-14). Human OPN gene is located in chromosome 4q13 and consist of seven exons (15,16). OPN was suggested to inhibit apoptosis in cancer through activation of the phosphatidylinositol 3-kinase/Akt pathway, to suppress integrin-mediated cell death, to induce an NFκB mediated pathway (17-19). It was demonstrated that OPN induced invasion and metastasis by activating MMPs through several overlapping pathways (20-22). It was previously shown in this laboratory (4) that OPN was expressed in higher levels in both malignant prostate cancer cells and carcinoma tissues. The increased expression of OPN was significantly correlated with the reduced patient survival and both OPN staining intensity and Gleason scores have a similar prognostic significance. OPN was associated with CD44 and MMP9 in migration of prostate cancer cells (23). The OPN/integrin αvβ3 signaling pathway was involved in the migration and invasion of PC3 cells via regulating the formation and function of invadopodia (24). All these studies suggested that OPN play an important role in the malignant progression of prostate cancer and thus it is worthwhile to investigate whether OPN might serve as a target for therapeutic intervention in prostate cancer.
Suppressing tumourigenicity of prostate cancer cells by inhibiting osteopontin expression
YU ZHANG, SHIvA S. FOROOTAN, LALEH KAMALIAN, ZHENG Z. BAO, MOHAMMED I. MALKI, CHRISTOPHER S. FOSTER and YOUqIANG KE
Molecular Pathology Laboratory, Department of Molecular and Clinical Cancer Medicine, University of Liverpool, 6th Floor, Duncan Building, Daulby Street, Liverpool, L69 3GA, UK
Received December 10, 2010; Accepted January 14, 2011
DOI: 10.3892/ijo.2011.932
Correspondence to: Professor Y. Ke, Molecular Pathology Laboratory, Department of Molecular and Clinical Cancer Medicine, University of Liverpool, 6th Floor, Duncan Building, Daulby Street, Liverpool L69 3GA, UKE-mail: [email protected]
Key words: OPN, siRNA, prostate cancer, DU145, nude mouse

ZHANG et al: OPN siRNA SUPPRESSES PROSTATE CANCER CELLS1084
Materials and methods
Cell lines and culture condition. DU145 (25) cells were grown in monolayer culture in RPMI-1640 (PAA, Pasching, Austria) supplemented with 10% (v/v) fetal bovine serum (Biosera, UK), L-glutamine (20 mM), penicillin (100 U/ml) and streptomycin (100 U/ml), and maintained in a humidified incubator (model TC2323, Borolabs Ltd., UK) at 37˚C with 5% (v/v) CO2. For transfected cells during and after the selection process, geneticin G418 (PAA Labs GmbH, Pasching, Austria) was added to the culture medium at a concentration of 1 mg/ml.
siRNA sequences and expression constructs. Three unique 21nt sequences (Table I) were selected respectively from OPN-cDNA using the siRNA target design tool on the website of the Biotech Company Ambion (www.ambion.com) and the uniqueness of the sequences were confirmed by BLAST for their high specificity. For transient transfection, a double stranded RNA targeting each 21nt sequence was designed and synthesized. For stable transfection, a short DNA molecule was commercially purchased as two separate oligos. These two complementary DNA oligos were annealed to form a double stranded siRNA insert and ligated into a pSilencer™ 4.1-CMv neo vector (Ambion, UK) by HindIII and BamH1 sites. The plasmid containing specific siRNA sequences were transformed respectively into DH5α competent E. Coli cells and the presence of the siRNA insert was confirmed by sequencing analysis using an internal sequence primer (5'-ATTAACCCTCAGTAAAGGGA-3'). Results were analysed using BIOEDIT sequence visualisation software.
Transient and stable transfection. Transient transfection of the siRNAs into highly malignant DU145 cells was performed with a siPORT NeoFX transfection reagent (Ambion) following the manufacturer's instruction. The most efficient siRNA was determined by Western blotting performed to test the levels of OPN in cells after the different transient transfections. A siPORT XP-1 transfection agent kit (Ambio, UK) was used to perform the stable transfection following the manufacturer's instruction. Cells were plated at 2x10⁵/dish in routine medium ~24 h before the transfection, to reach 30-60% confluence. After the siPORT XP-1/DNA complex was overlaid dropwise onto the cells, the plate was transferred into a selection medium (normal medium containing 1 mg/ml G418) to select the clones harbouring plasmid DNA. Western blotting was used to detect the levels of OPN in transfectants. In a parallel, but separate transfection, a scrambled RNA was transfected to DU145 cells in the same way to generate a pool of control transfectants.
Detection of protein expression in cultured cells. OPN protein expressed in cultured cells was detected by Western blotting, using an ECL detection system (26). Proteins were extracted and equal amounts of total protein from each cell lines were quantified with a Coomassie Protein Assay Reagent kit (Bio-Rad Laboratories GmbH, Munchen, Germany). Samples containing equal amounts of total protein were subjected to SDS-PAGE in 9% polyacrylamide gels together with molecular weight markers. Separated proteins were transferred onto a
nitrocellulose membrane (Hybond-ECL, GE Healthcare, UK) at 100 V for 2 h at 4˚C. The membrane was first incubated with pre-block reagent Protoblock (National Diagnostics, UK) for an hour at room temperature and then incubated with the MPIIIB10 ascites (OPN) (Developmental Studies Hybridoma Bank, USA) in 1:200 for OPN at 4˚C overnight. The membrane was then incubated with polyclonal rabbit anti-mouse immuno-globulins/HRP (Dako, UK) at a dilution of 1:1000 for 2 h at room temperature. The bound antibodies were revealed by ECL Advance (GE Healthcare, UK) and recorded on Kodak XAR-5 film. The bands were scanned using Alpha-Imager 2000 software (Alpha Innotech, Cannock, UK) and the intensity of band was obtained by measuring the peak area. The relative levels of OPN expression in different cell lines were obtained by comparing the intensity of bands. Blots were incubated with monoclonal anti-β-actin (Sigma) to correct the possible loading errors.
Soft agar colony-formation assay. Soft agar assay was performed to test the anchorage-independent growth of the cells as an indication of their tumourigenicity in vitro. In this study, parental cells and the siRNA transfected cells were cultured in soft agar to determine their ability to form colonies in an anchorage-independent environment. One percent of soft agar gel-I (SA-I) was made from 2% low melting temperature agarose (LMA) mixed with equal amount of routine medium for parental cells while 1% of soft agar gel-II (SA-II) was made from 2% LMA mixed with equal amount of routine medium with G418 for the scrambled-RNA control cells and siRNA-transfected cells. SA-I and SA-II were plated at 1 ml per well in a 6-well plate and placed at 4˚C to solidify the basement gel layer. Parental cells, control cells, and OPN-suppressed transfectants were harvested separately, adjusted with SA-I or SA-II to 3x10³ cells/ml, plated on top of the preset basement gel layer and placed at 4˚C for 10 min for solidification. Once set, the cells in plates were incubated at 37˚C in a humidified atmosphere of 5% CO2 for 8 weeks. All soft agar gels were stained with 2% MTT for 4 h. Plates were scanned and the colonies were counted using an Optronix Gel Count (Oxford Optronix, UK).
Proliferation assay. The control and transfectant cells were cultured in normal RPMI-1640 medium in 96-well plates in triplicates. Each single well contained 2,000 cells growing in 200 µl of medium. The number of cells in one well from each plate was counted by the MTT colour metric method every 24 h during the 6-day experiment period, as described before (27).
Invasion and motility assay. Invasiveness of the control and different transfectant cells was measured by an invasion assay (28) with some modifications (29). All cell lines were set as triplicate and the assay run for 24 h in the incubator at 37˚C. Invaded cells on the lower side of the filter were fixed and stained with Crystal violet and the number of the stained cells on the lower side of the chamber was counted under a microscope. For motility assay, culture medium, experimental condition and analytic method were similar to those used in the invasion assay except no matrigel was used and test cells were adjusted to 4x10⁵ cells/ml.
INTERNATIONAL JOURNAL OF ONCOLOGY 38: 1083-1091, 2011 1085
Nude mouse assay. To test the tumourigenicity in vivo, the transfectant cells were inoculated in BALB/c male nude mice to produce tumours, as described previously (30). Six to eight week-old male BALB/c nude mice (purchased from Charles River Laboratories, UK) with body weights ranged from 18-20 g on arrival, were used to inoculate the transfectants. For each mouse, a subcutaneous injection of 200 µl suspension (PBS:Matrigel=1:1) containing 2x10⁶ cells from different cell lines was given on the right shoulder region. Body weight and the tumour size were measured twice a week using a calliper. Tumour volume was calculated by the formula 0.5236 x (length) x (width) x (height) (31). The animals were maintained for 4 weeks, or until the tumours reached 17 mm in one dimension before they were sacrificed. All animal work was conducted in accordance to UKCCCR guidelines under Home Office project licence PPL40/2270 to Professor Y. Ke.
Detection of OPN expression in tumour tissues by Western blot analysis and immunohistochemistry. At autopsy, some parts of tumours were frozen in liquid nitrogen and some were fixed in 10% formalin. Upon starting the analysis, the frozen tumour samples were defrosted on ice and tissues were cut into small pieces. Total protein was extracted with CelLytic M Cell Lysis reagent (Sigma, USA). Tissues were sonicated and centrifuged at 13,000 rpm for 30 min. The supernatant containing the protein was transferred to a new microfuge tube to make cell extracts which were subjected to Western blot analysis to measure the levels of OPN expression. Fixed tissues in 10% formalin were trimmed, embedded in paraffine wax, cut into 4 µm sections and mounted onto APES slides using standard routine procedure (26). Tissue sections were stained immuno-histochemically to detect OPN expression. The procedure for tissue staining was similar to those described previously (4,26). Sections were dewaxed in xylene rehydrated in Industrial Methylated Spirits (IMS) (GENTA Environmental Ltd., UK) before being transferred into fresh H2O2/methanol for 12 min to block endogenous peroxidase activity. Sections were incubated with the primary antibody, MPIIIB10 ascites (Developmental Studies Hybridoma Bank), at 1:250. Bound antibody was detected with 100 µl of labelled polymer (DakoCytomation, UK) and visualised with DAB (DakoCytomation) for 10 min.
After briefly counterstained with hematoxylin solution, sections were mounted in DPX (Bios, UK).
Statistical analysis. Statistical analyses were performed using the PASW package, version 17.0 (SPSS Inc., USA). Data from the soft agar assay, proliferation assay, invasion and motility assay were assessed using Student's t-test. Differences on sizes of tumours produced in mice were also assessed by Student's t-test. Correlations between tumour volumes and OPN levels were assessed by Box plot and Mann-Whitney U test. p<0.05 was defined as statistically significant.
Results
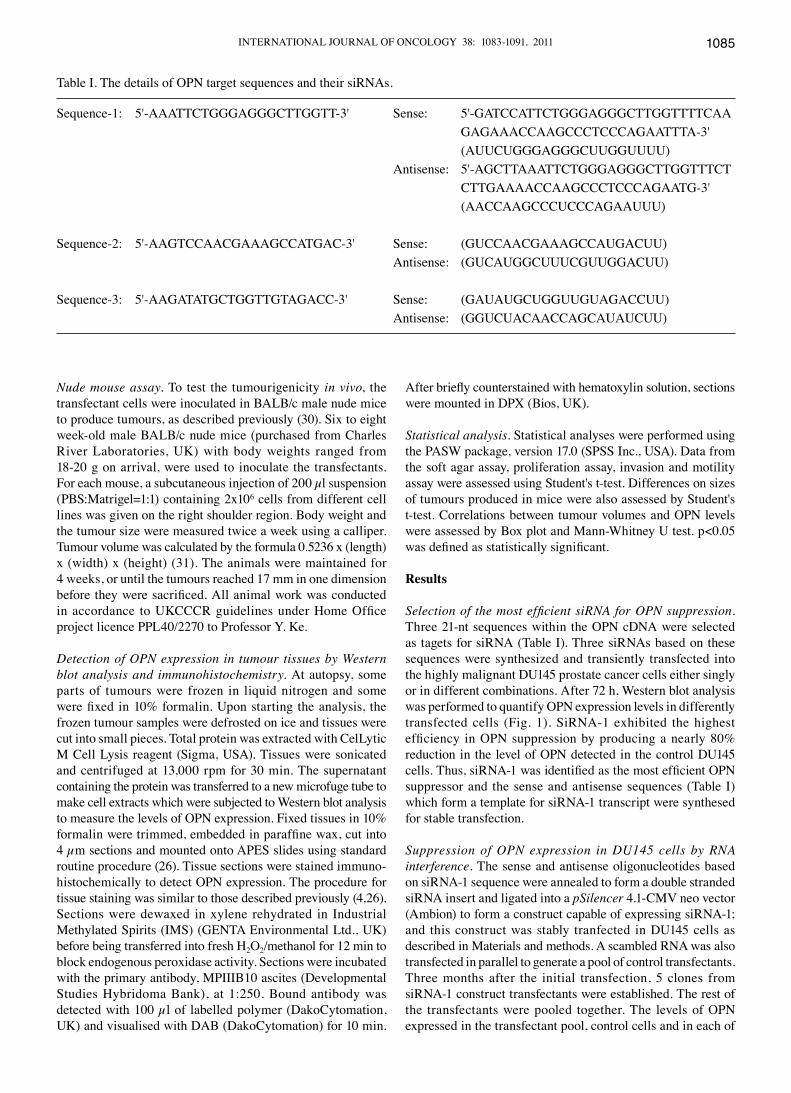
Selection of the most efficient siRNA for OPN suppression. Three 21-nt sequences within the OPN cDNA were selected as tagets for siRNA (Table I). Three siRNAs based on these sequences were synthesized and transiently transfected into the highly malignant DU145 prostate cancer cells either singly or in different combinations. After 72 h, Western blot analysis was performed to quantify OPN expression levels in differently transfected cells (Fig. 1). SiRNA-1 exhibited the highest efficiency in OPN suppression by producing a nearly 80% reduction in the level of OPN detected in the control DU145 cells. Thus, siRNA-1 was identified as the most efficient OPN suppressor and the sense and antisense sequences (Table I) which form a template for siRNA-1 transcript were synthesed for stable transfection.
Suppression of OPN expression in DU145 cells by RNA interference. The sense and antisense oligonucleotides based on siRNA-1 sequence were annealed to form a double stranded siRNA insert and ligated into a pSilencer 4.1-CMv neo vector (Ambion) to form a construct capable of expressing siRNA-1; and this construct was stably tranfected in DU145 cells as described in Materials and methods. A scambled RNA was also transfected in parallel to generate a pool of control transfectants. Three months after the initial transfection, 5 clones from siRNA-1 construct transfectants were established. The rest of the transfectants were pooled together. The levels of OPN expressed in the transfectant pool, control cells and in each of
Table I. The details of OPN target sequences and their siRNAs.
Sequence-1: 5'-AAATTCTGGGAGGGCTTGGTT-3' Sense: 5'-GATCCATTCTGGGAGGGCTTGGTTTTCAA GAGAAACCAAGCCCTCCCAGAATTTA-3' (AUUCUGGGAGGGCUUGGUUUU) Antisense: 5'-AGCTTAAATTCTGGGAGGGCTTGGTTTCT CTTGAAAACCAAGCCCTCCCAGAATG-3' (AACCAAGCCCUCCCAGAAUUU)
Sequence-2: 5'-AAGTCCAACGAAAGCCATGAC-3' Sense: (GUCCAACGAAAGCCAUGACUU) Antisense: (GUCAUGGCUUUCGUUGGACUU)
Sequence-3: 5'-AAGATATGCTGGTTGTAGACC-3' Sense: (GAUAUGCUGGUUGUAGACCUU) Antisense: (GGUCUACAACCAGCAUAUCUU)

ZHANG et al: OPN siRNA SUPPRESSES PROSTATE CANCER CELLS1086
the 5 clones were measured by Western blot analysis and the results were shown in Fig. 2. When the OPN level expressed in the control cells was set at 1, the level of OPN in the transfectant pool was sharply reduced by 6.3 times to 0.16. For the 5 cell lines derived from separate clones, there was a clone which did not exhibit any OPN reduction (lane 3), instead, its OPN level was 1.23 times of that detected in the control. The OPN expression was suppressed in all other 4 clones, with levels varied from an almost complete suppression (lane 7) to a 12% reduction (lane 6). Two clones (lanes 4 and 7) which exhibited the greatest OPN suppression were identified and named C1 and C2, respectively.
Effect of suppression of OPN on DU145 cells in vitro. The effect of OPN suppression on characteristics of DU145 cells was tested by several assays. The anchorage-independent growth of the cells was assessed by a soft agar assay and the result was shown in Fig. 3A. While no significant difference (Student's t-test, p=0.14) was observed between the number of colonies formed by the parental DU145 cells and the control cells, the numbers of colonies produced by OPN-highly-suppressed cells C1 (Student's t-test, p<0.0001) and C2 (Student's t-test, p<0.001) were significantly reduced by 61.5 and 92.7%, respectively, in comparison with that developed from the control cells.
Cell proliferation assay was performed to measure the growth rate of the parental DU145 cells, the control, C1 and
C2 cells, and the result was shown in Fig. 3B. When compared with the control, no differentce was detected on numbers of the control cells at any of the time-points. Although some reductions on numbers of C1 and C2 cells were detected at all time points after the first measurement, these differences were not significant (not shown). Thus OPN suppression did not significantly change the cell proliferation rate.
The invasiveness of different cells was assessed using an invasion assay as described in Materials and methods. While no significant (Student's t-test, p=0.75) difference between parental DU145 and the control cells was observed, the invasiveness of C1 (Student's t-test, p<0.0001) and C2 (Student's t-test, p<0.0001) were significantly reduced by 92.9 and 88.3% respectively, in comparison with the control (Fig. 3C). Thus suppression of OPN expression significantly reduced the invasiveness of the cells.
The motility of the cells was tested by acrossing transwell polycarbonate membranes as described in Materials and methods. No significant (Student's t-test, p=0.62) difference was observed between parental DU145 and the control cells. The motility of C1 (Student's t-test, p=0.18) and C2 (Student's
Figure 1. Levels of OPN expressed in DU145 cells transfected transiently with different siRNAs. (A) Western blot analysis of OPN expression in DU145 cells transfected transiently with different siRNAs: lane 1, siRNA-1; lane 2, siRNA-2; lane 3, siRNA-3; lane 4, siRNA-1+2; lane 5, siRNA-1+3; lane 6, siRNA-2+3; lane 7, siRNA-1+2+3; lane 8, reagents only (control). (B) Relative OPN levels expressed in DU145 cells after different transient transfections. Relative OPN levels were measured by densitometry analysis of the bands on the blots. The OPN level in control cells was set as 1.0. The levels of OPN in other lanes of the blot were calculated by relating to the control cells. The possible loading errors were corrected by relating to the amount of β-actin. Results were obtained from three separate measurements (mean ± SE).
Figure 2. Levels of OPN expression in different stable transfectant cells. (A) Western blot analysis of OPN expression in scrambled RNA transfectants (control) and in different clones derived from siRNA-1 stable transfectants: lane 1, control; lane 2, pool of siRNA-1 transfectants; lanes 3-7, different individual colonies separated from siRNA-1 transfectants. The antibody against β-actin was used to standardise the loading amongst different wells of the blot. (B) Relative OPN levels in control, tansfectants pool and each of the different colonies. The OPN levels were obtained by densitometry analysis of the bands on the blot. The level in control cells was set at 1.0 and levels of OPN expressed in the siRNA-1 tansfectants pool and each of the different colonies were calculated by relating to that in the control. The possible loading errors were corrected by relating to the bands of β-actin. Results were obtained from three separate measurements (mean ± SE).

INTERNATIONAL JOURNAL OF ONCOLOGY 38: 1083-1091, 2011 1087
t-test, p=0.72) were not significantly different in comparison with the control (Fig. 3D). Thus, suppression of OPN expression had no significant effect on cell motility.
Effect of suppression of OPN on tumourigenicity in vivo. To assess the effect of the suppression of OPN on tumourigenicity, the control, C1 and C2 cells were inoculated respectively into 3 groups (10 mice per group) of male balb/c nude mice. All 3 cell lines produced tumours respectively in all 30 nude mice (100% tumour incidence). Tumours appeared in either the 5th or the 6th day in all experimental mice after the inoculation and no difference was observed in the average lengths of the letant periods amongst the 3 different groups (data not shown). The average tumour sizes amongst the 3 groups of mice did not exhibit any remarkable differences until the 5th round of measurements at day 13 when the tumours of the control group started to grow faster than those of the C2 group which grew faster than C1 group. This growing pattern remained until the end of the experiments (Fig. 4A). On the 23rd day post-inoculation, the average volumes of tumours produced by the control, C1 and C2 were 347.9±38.8, 102.2±26.5, and 204.9±53.6 mm3 respectively (Fig. 4B). In comparison with the average sizes, the average volumes of tumours in C1 and C2 groups were significantly reduced by 70.1% (Student's t-test, p<0.001) and 41.1% (Student's t-test, p<0.01), respectively. Between the two OPN-suppressed groups, the tumours produced by C2 group were significantly (Student's t-test, p<0.05) larger
(2 times) than those produced by C1 cells. A representative tumour-bearing mouse and the tumour developed inside it were taken from each group of mice and shown in Fig. 4C.
Expression of OPN in mouse tumours. Total protein extracts, prepared from each of the tumours produced in 3 groups of mice were subjected to Western blot analysis to detect the OPN expression. The results were summuried in Fig. 5A. When the average level of OPN in the tumours of the control group was set at 1, the relative levels of OPN expressed in C1 and C2 groups were 0.4±0.12 and 0.53±0.09, respectively. Therefore, in comparison with the control group, the levels of OPN in C1 and C2 groups were reduced by 60 and 47%, respectively. Interestingly, the OPN level detected in tumours produced by C2 group was 32.5% higher than that detected in tumours produced by C1 groups. Immunohistochemical stains of tumour tissues with OPN antibody (Fig. 5B) showed that strongest staining was observed in the control group and moderate staining was observed in C2 tumours. The weakest stain was observed in C1 tumours. Thus the patterns of immunohistochemical stains were similar to those measured by Western blot analysis.
Correlations between levels of OPN expression and volumes of tumours. Tumours developed from all 30 mice were divided to three groups according to their relative OPN levels, irrespective of their cell origins: low (<0.4), moderate (0.4-0.75) and high
Figure 3. The effect of suppressing OPN expression on cell characteristics. (A) Numbers of colonies produced in soft agar by the parental DU145 cells (1), the control (2), C1 (3) and C2 cells (4). Results were obtained from three separate assays (mean ± SE). (B) Proliferation rates of the parental DU145 cells, the control, C1 and C2 on different time-points. Results were obtained from three separate assays (mean ± SE). (C) Numbers of invaded cells from different cell lines: 1, DU145; 2, control transfectants; 3, C1; 4, C2. The results were obtained from 3 separate assays (mean ± SE). (D) Numbers of motile cells from different cell lines: 1, DU145; 2, control transfectants; 3, C1; 4, C2. The results were obtained from 3 separate assays (mean ± SE).

ZHANG et al: OPN siRNA SUPPRESSES PROSTATE CANCER CELLS1088
(>0.75) (the level in the highest OPN tumour was set at 1). For tumours expressing low, moderate and high levels of OPN, the median tumour volumes were 68.1±15.5, 146.6±65.1 and 381.2±120.3 mm3, respectively. The correlation between the levels of OPN expression and the tumour volumes is assessed by Box plot analysis and the results are shown in Fig. 6. Box plot analysis showed that the volumes of the tumours with high OPN expression levels were significantly higher than those with moderate (Mann-Whitney U test, p=0.0001) and
Figure 4. Tumours produced by different cells in nude mice. (A) Average sizes of tumours (measured at different time-points) developed in 3 groups of mice inoculated with the control, C1 and C2 cells, respectively. (B) Average volumes of tumours produced in each of the 3 groups of mice at autopsy on day 23. (C) One representative tumour-bearing mouse taken from each of the 3 groups of mice inoculated with the control (a), C1 (b), and C2 (c) cells respectively. The tumour of each mouse is shown in the insert.
Figure 5. OPN expression in tumours produced in different groups of animals. (A) Relative OPN levels in tumours developed in different groups of mice by Western blot analysis. The average level of OPN in control group was set at 1.0. The average OPN levels detected in other groups were calculated by relating to that expressed in the control group. The possible loading errors were corrected by relating to the amount of β-actin. (B) Immunohistochemical staining of OPN expressed in tumour tissues taken from different groups of mice. (a) control, (b) C1, (c) C2, (d) positive (left) and negative (right) staining controls. Magnification x100.
Figure 6. Correlations between levels of OPN expression and volumes of tumours. Acording to their OPN levels, tumours from each of entire experimental mice were divided into 3 groups: group 1 or low OPN level group (n=12); group 2 or moderate OPN level group (n=11), and group 3 or high OPN level group (n=7). Correlations between levels of OPN and volumes of tumours were assessed by comparing the average OPN levels with the average tumour volumes in each of the 3 groups with Mann-Whitney U test. 0, representative of outlier values; and *representative of extreme values.

INTERNATIONAL JOURNAL OF ONCOLOGY 38: 1083-1091, 2011 1089
low (Mann-Whitney U test, p=0.001) OPN expression level. Tumours with moderate OPN expression levels were also significantly (Mann-Whitney U test, p=0.015) larger than those with low OPN expression level.
Discussion
OPN was shown to be highly expressed in a variety of cancers, particularly breast cancer which is a hormone responsive cancer like prostate cancer (32). Recent studies demonstrated the potential of using OPN as a prognostic marker and therapeutic target for breast cancer (33-36). In contrast to the well-established important role of OPN played in development and metastasis of breast cancer, the involvement of OPN in prostate cancer was not established until recently. Although some initial reports suggested that OPN might be overexpressed in human prostate cancer cells (37,38), its biological significance was disputed (39). To clarify the discrepancies reported in the early studies, we investigated the OPN expression status in an archival set of a large number of benign and malignant prostate tissues and firmly established that the increased expression was significantly associated with the degree of malignancy of prostate cancer and that the level of OPN expression is an important determinant for patient survival (4).
In this work, we investigated the possible role of OPN in tumourigenicity of prostate cancer by suppressing OPN expression in the highly malignant prostate cancer cell line DU145 and succesffuly established several clones, in which different degree of suppression in OPN expression was achieved by RNAi technique. While bioassay in vitro results showed that OPN suppression did not significantly change the cell proliferation rate and cell motility, it did have great effect on tumourigenicity and invasiveness. The invasion assay results showed that comparing with the control, the invasiveness of C1 and C2 cells were significantly reduced by 92.9 and 88.3%, respectively (Fig. 3C). Thus suppression of OPN expression significantly reduced the invasiveness of the cells. The soft agar assay results showed that comparing with the control, the number of colonies produced by OPN-moderately-suppressed cells C1 and OPN-highly-suppressed cells C2 were signifi-cantly reduced by 61.5 and 92.7%, respectively (Fig. 3A). Thus the reduced tumourigenicity in vitro was associated with the decreasing level of OPN in a propotional manner. These results suggested that OPN may be a promoting factor in prostate cancer cells and it may play a promoting role by facilitating tumourigenicity and invasiveness of the cancer cells. These results are consistent with previously reported role of OPN in other types of cancers (32).
The effect of the reduced expression of OPN on the ability of the cancer cells to form tumours in vivo was assessed by nude mouse assay. At the end-point of the experiments, the average volume of tumours produced by the control, C1 and C2 cells was 347.9±38.8, 102.2±26.5, and 204.9±53.6 mm3, respectively (Fig. 4B). Thus, in comparison with the control, the average volumes of tumours in C1 and C2 groups were significantly reduced by 70.1% (Student's t-test, p<0.001) and 41.1% (Student's t-test, p<0.01), respectively. These results showed that suppressed OPN expression significantly inhibited the tumourigenicity of the DU145 cells in vivo. However, this inhibition in tumour growth was not quantitatively related to
the degree of OPN level reduction measured in the transfectants before the inoculation. As showed in the results, the average size of tumours produced by C2 cells (204.9±53.6 mm3), which hardly express any OPN, was twice as big as that produced by C1 cells which expressed 12% of the level of OPN measured in the control cells (Fig. 2). Thus, this result seemed not to be quite consistent with that observed in the soft agar assay in vitro. To find out the possible reason for this difference, we investigated the expression status of OPN in the tissues of the tumours developed in nude mice. It was found that the patterns of OPN expression amongst the 3 groups of tumours were not the same as those measured in the transfectnats before the inoculation. When the average level of OPN in the tumours of the control group was set at 1, the relative levels of OPN expressed in C1 and C2 groups were 0.4±0.12 and 0.53±0.09, respectively (Fig. 5). In comparison with the control group, the level of OPN in tumours produced by C1 and C2 groups was reduced by 60 and 47%, respectively. Thus the level of OPN detected in C2 tumours was actually 32.5% higher than that detected in C1 tumours. Immunohistochemical staining of tumour tissues with OPN antibody exhibited a similar results, further supported the OPN expression pattern detected by Western blotting. To study further the correlations between levels of OPN expression and volumes of tumours, we measure OPN levels in all tumours developed from the entire 30 mice and divided them into three groups according to their relative OPN levels, irrespective of their cell origin. For tumours expressing low, moderate and high level of OPN, the median tumour volumes were 68.1±15.5, 146.6±65.1 and 381.2±120.3 mm3, respectively. Box plot analysis showed that the volumes of the tumours with high OPN expression level were significantly higher than those with moderate or low OPN expression level. Tumours with moderate OPN expression level were also significantly larger than those with low OPN expression level (Fig. 6). These results taken together suggested that suppression of OPN expression can inhibit tumour growth in a quantitatively-related manner. Reduction of tumour sizes in this batch of experimental mice is propotionally associated with the decreasing level of OPN expression. Thus OPN is a determinant factor of the tumourigenicity in prostate cancer cells.
An interesting observation is the difference in OPN expression levels between the transfectants in vitro and tumours produced by the same transfectants in nude mice. For example, the OPN level in C2 cells was hardly detectable, but this was increased remarkably in the tumour produced by these cells in vivo, indicating that the RNAi suppression functions were partially lost or a desuppression process might have occurred during the inoculation in nude mice. The mechanism for this is not understood currently. Although RNAi is a technique widely used to suppress the expression of specific genes in a variety of studies (40-42) on different fields of molecular biology, the exact mechanisms on many aspects are not fully understood. Controversial results were reported by several laboratories (43-45). It was reported that several dsRNAs induce gene transcription in a sequence-specific manner by targeting the promoter region of various genes (44). This RNAi was also named RNA activation or ‘RNAa’, and these siRNAs were identified leading to the activation and increased levels of some genes in human cells (46). The difference in

ZHANG et al: OPN siRNA SUPPRESSES PROSTATE CANCER CELLS1090
OPN level of the transfectants between the in vitro and in vivo environments may be a reflection of the complicated mechanisms, through which the RNAi molecules interact with their targeting genes in different surrounding conditions.
In conclusion, increased expression of OPN may play an important role in development and expansion of prostate cancer and the changes in OPN level have a determinant effect on the sizes of tumours. Thus OPN should be a reliable target for therapeutic intervention providing an efficient and stable method is used to inhibit the expression of OPN in the cancer cells.
Acknowledgements
We would like to thank Mrs. C. Beesley, Mr. T. Dickenson and Mrs. P. Gerard for their technical assistance and the Northwest Cancer Research Fund, Prostate UK for their generous financial support.
References
1. Das R, Mahabeleshwar G and Kundu GC: Osteopontin stimulates cell motility and nuclear factor kappaB-mediated secretion of urokinase type plasminogen activator through phosphatidylinositol 3-kinase/Akt signaling pathways in breast cancer cells. J Biol Chem 278: 28593-28606, 2003.
2. De Silva Rudland S, Martin L, Roshanlall C, Winstanley J, Leinster S, Platt-Higgins A, Carroll J, West C, Barraclough R and Rudland P: Association of S100A4 and osteopontin with specific prognostic factors and survival of patients with minimally invasive breast cancer. Clin Cancer Res 12: 1192-1200, 2006.
3. Philip S and Kundu G: Osteopontin induces nuclear factor kappa B-mediated promatrix metalloproteinase-2 activation through I kappa B alpha /IKK signaling pathways, and curcumin (diferulolyl-methane) down-regulates these pathways. J Biol Chem 278: 14487-14497, 2003.
4. Forootan SS, Foster C, Aachi vR, Adamson J, Smith PH, Lin K and Ke Y: Prognostic significance of osteopontin expression in human prostate cancer. Int J Cancer 118: 2255-2261, 2006.
5. Senger DR, Wirth D and Hynes RO: Transformed mammalian cells secrete specific proteins and phosphoproteins. Cell 16: 885-893, 1979.
6. Craig AM, Smith J and Denhardt DT: Osteopontin, a trans-formation-associated cell adhesion phosphoprotein, is induced by 12-O-tetradecanoylphorbol 13-acetate in mouse epidermis. J Biol Chem 264: 9682-9689, 1989.
7. Denhardt DT and Guo X: Osteopontin: a protein with diverse functions. FASEB J 7: 1475-1482, 1993.
8. Chakraborty G, Jain S, Behera R, Ahmed M, Sharma P, Kumar v and Kundu GC: The multifaceted roles of osteopontin in cell signaling, tumour progression and angiogenesis. Curr Mol Med 6: 819-830, 2006.
9. Sodek J, Ganss B and McKee MD: Osteopontin. Crit Rev Oral Biol Med 11: 279-303, 2000.
10. Higashibata Y, Sakuma T, Kawahata H, Fujihara S, Moriyama K, Okada A, Yasui T, Kohri K, Kitamura Y and Nomura S: Identi-fication of promoter regions involved in cell- and developmental stage-specific osteopontin expression in bone, kidney, placenta, and mammary gland: an analysis of transgenic mice. J Bone Miner Res 19: 78-88, 2004.
11. Senger DR, Perruzzi C, Gracey CF, Papadopoulos A and Tenen DG: Secreted phosphoproteins associated with neoplastic trans-formation: close homology with plasma proteins cleaved during blood coagulation. Cancer Res 48: 5770-5774, 1988.
12. Senger DR, Perruzzi C, Papadopoulos A and Tenen DG: Purification of a human milk protein closely similar to tumour-secreted phospho-proteins and osteopontin. Biochim Biophys Acta 996: 43-48, 1989.
13. Bautista DS, Denstedt J, Chambers AF and Harris JF: Low-molecular-weight variants of osteopontin generated by serine proteinases in urine of patients with kidney stones. J Cell Biochem 61: 402-409, 1996.
14. Cancel AM, Chapman DA and Killian GJ: Osteopontin localization in the holstein bull reproductive tract. Biol Reprod 60: 454-460, 1999.
15. Young MF, Kerr J, Termine JD, Wewer UM, Wang MG, McBride OW and Fisher LW: cDNA cloning, mRNA distribution and heterogeneity, chromosomal location, and RFLP analysis of human osteopontin (OPN). Genomics 7: 491-502, 1990.
16. Hijiya N, Setoguchi M, Matsuura K, Higuchi Y, Akizuki S and Yamamoto S: Cloning and characterization of the human osteo-pontin gene and its promoter. Biochem J 303: 255-262, 1994.
17. Lin YH and Yang-Yen H: The osteopontin-CD44 survival signal involves activation of the phosphatidylinositol 3-kinase/Akt signaling pathway. J Biol Chem 276: 46024-46030, 2001.
18. Khan SA, Lopez-Chua C, Zhang J, Fisher LW, Sørensen ES and Denhardt DT: Soluble osteopontin inhibits apoptosis of adherent endothelial cells deprived of growth factors. J Cell Biochem 85: 728-736, 2002.
19. Philip S, Bulbule A and Kundu GC: Osteopontin stimulates tumour growth and activation of promatrix metalloproteinase-2 through nuclear factor-kappa B-mediated induction of membrane type 1 matrix metalloproteinase in murine melanoma cells. J Biol Chem 276: 44926-44935, 2001.
20. Jain S, Chakraborty G and Kundu GC: The crucial role of cyclooxygenase-2 in osteopontin-induced protein kinase C alpha/c-Src/IkappaB kinase alpha/beta-dependent prostate tumor progression and angiogenesis. Cancer Res 66: 6638-6648, 2006.
21. Rangaswami H, Bulbule A and Kundu GC: Nuclear factor-inducing kinase plays a crucial role in osteopontin-induced MAPK/ IkappaBalpha kinase-dependent nuclear factor kappaB-mediated promatrix metalloproteinase-9 activation. J Biol Chem 279: 38921-38935, 2004.
22. Mi Z, Guo H, Wai PY, Gao C and Kuo PC: Integrin-linked kinase regulates osteopontin-dependent MMP-2 and uPA expression to convey metastatic function in murine mammary epithelial cancer cells. Carcinogenesis 27: 1134-1145, 2006.
23. Desai B, Rogers M and Chellaiah MA: Mechanisms of osteopontin and CD44 as metastatic principles in prostate cancer cells. Mol Cancer 6: 18, 2007.
24. Desai B, Ma T and Chellaiah MA: Invadopodia and matrix degradation, a new property of prostate cancer cells during migration and invasion. J Biol Chem 283: 13856-13866, 2008.
25. Stone KR, Mickey D, Wunderli H, Mickey GH and Paulson DF: Isolation of a human prostate carcinoma cell line (DU 145). Int J Cancer 21: 274-281, 1978.
26. Zhang Y, Forootan S, Liu D, Barraclough R, Foster CS, Rudland PS and Ke Y: Increased expression of anterior gradient-2 is significantly associated with poor survival of prostate cancer patients. Prostate Cancer Prostatic Dis 10: 293-300, 2007.
27. Adamson J, Morgan EA, Beesley C, et al: High-level expression of cutaneous fatty acid-binding protein in prostatic carcinomas and its effect on tumourigenicity. Oncogene 22: 2739-2749, 2003.
28. Albini A, Iwamoto Y, Kleinman HK, et al: A rapid in vitro assay for quantitating the invasive potential of tumour cells. Cancer Res 47: 3239-3245, 1987.
29. Smith P, Rhodes NP, Shortland AP, et al: Sodium channel protein expression enhances the invasiveness of rat and human prostate cancer cells. FEBS Lett 423: 19-24, 1998.
30. Morgan EA, Forootan SS, Adamson J, et al: Expression of cutaneous fatty acid-binding protein (C-FABP) in prostate cancer: potential prognostic marker and target for tumourigenicity-suppression. Int J Oncol 32: 767-775, 2008.
31. Janik P, Briand P and Hartmann NR: The effect of estrone-proges-terone treatment on cell proliferation kinetics of hormone-dependent GR mouse mammary tumors. Cancer Res 35: 3698-3704, 1975.
32. Wai PY and Kuo P: Osteopontin: regulation in tumour metastasis. Cancer Metastasis Rev 27: 103-118, 2008.
33. Tuck AB, O'Malley F, Singhal H, Harris JF, Tonkin KS, Kerkvliet N, Saad Z, Doig GS and Chambers AF: Osteopontin expression in a group of lymph node negative breast cancer patients. Int J Cancer 79: 502-508, 1998.
34. Ue T, Yokozaki H, Kitadai Y, Yamamoto S, Yasui W, Ishikawa T and Tahara E: Co-expression of osteopontin and CD44v9 in gastric cancer. Int J Cancer 79: 127-132, 1998.
35. Chambers AF, Wilson S, Kerkvliet N, O'Malley FP, Harris JF and Casson AG: Osteopontin expression in lung cancer. Lung Cancer 15: 311-323, 1996.

INTERNATIONAL JOURNAL OF ONCOLOGY 38: 1083-1091, 2011 1091
36. Agrawal D, Chen T, Irby R, quackenbush J, Chambers AF, Szabo M, Cantor A, Coppola D and Yeatman TJ: Osteopontin identified as lead marker of colon cancer progression, using pooled sample expression profiling. J Natl Cancer Inst 94: 513-521, 2002.
37. Fedarko NS, Jain A, Karadag A, van Eman MR and Fisher LW: Elevated serum bone sialoprotein and osteopontin in colon, breast, prostate, and lung cancer. Clin Cancer Res 7: 4060-4066, 2001.
38. Thalmann GN, Sikes R, Devoll RE, Kiefer JA, Markwalder R, Klima I, Farach-Carson CM, Studer UE and Chung LW: Osteopontin: possible role in prostate cancer progression. Clin Cancer Res 5: 2271-2277, 1999.
39. Tozawa K, Yamada Y, Kawai N, Okamura T, Ueda K and Kohri K: Osteopontin expression in prostate cancer and benign prostatic hyperplasia. Urol Int 62: 155-158, 1999.
40. Dwivedi M, Misra SP, Misra v, Waikhom RK and Bhatnagar M: Management of chronic hepatitis B virus infection: a promising approach using small interfering RNA (siRNA). Natl Med J India 21: 123-127, 2008.
41. Tong AW, Zhang YA and Nemunaitis J: Small interfering RNA for experimental cancer therapy. Curr Opin Mol Ther 7: 114-124, 2005.
42. Heidenreich O: Oncogene suppression by small interfering RNAs. Curr Pharm Biotechnol 5: 349-354, 2004.
43. Chen Z, Place RF, Jia ZJ, Pookot D, Dahiya R and Li LC: Antitumor effect of dsRNA-induced p21(WAF1/CIP1) gene activation in human bladder cancer cells. Mol Cancer Ther 7: 698-703, 2008.
44. Li LC, Okino ST, Zhao H, et al: Small dsRNAs induce transcrip-tional activation in human cells. Proc Natl Acad Sci USA 103: 17337-17342, 2006.
45. Janowski BA, Younger ST, Hardy DB, Ram R, Huffman KE and Corey DR: Activating gene expression in mammalian cells with promoter-targeted duplex rnas. Nat Chem Biol 3: 166-173, 2007.
46. Huang v, qin Y, Wang J, et al: RNAa is conserved in mammalian cells. PLoS One 5: e8848, 2010.