newmont announces $378 million in operating … june 5, 2014, pt newmont nusa tenggara (ptnnt), the...
TRANSCRIPT

Newmont Announces $378 Million in Operating Cash Flow, Improved Cost and Production Outlook and Approval of Merian DENVER, July 29, 2014 – Newmont Mining Corporation (NYSE: NEM) today reported second quarter 2014 financial and operating results, including:
• Achieved reported net income attributable to shareholders from continuing operations of $182 million, or $0.37 per basic share, and adjusted net income
1 of $101 million, or $0.20 per basic share;
• Reduced costs applicable to sales (CAS) by 17 percent to $744 per ounce of gold and by 67 percent to $2.53 per pound of copper over second quarter 2013 including current and prior period inventory adjustments;
• Generated cost savings of $359 million in gold all-in sustaining costs2 (AISC);
• Generated cash from continuing operations of $378 million and $124 million in free cash flow from continuing operations;
• Delivered 1.2 million ounces and 20,000 tonnes of attributable gold and copper production, respectively;
• Improved gold CAS outlook3 by three percent to $720 to $760 per ounce in 2014;
• Increased attributable gold production outlook by two percent to 4.7 to 5.0 million ounces in 2014;
• Announced a decision to develop the Merian project in Suriname;
• Announced the sale of the Jundee operation in Australia for total proceeds of approximately $94 million, bringing the total value of divestments to nearly $800 million in the last year; and
• Declared a third quarter dividend of $0.025 per share in accordance with the Company’s gold price-linked dividend policy
4.
“We continued to improve costs and efficiencies during the second quarter with $359 million in all-in sustaining cost reductions. We also continued to optimize our project pipeline and asset portfolio while reaching a decision to develop the Merian mine in Suriname, which establishes a prospective new district for Newmont,” said Gary Goldberg, President and Chief Executive Officer. “We delivered $124 million in free cash flow in the second quarter and have generated nearly $800 million through fairly valued divestments over the last 12 months. Based on this positive trajectory, we have updated our 2014 outlook to reflect lower costs and higher production. Finally, we continue to work with the Indonesian government to find a fair solution that allows us to resume normal operations as quickly as possible.”
1 Non-GAAP measure. See page 18 for reconciliation to net income.
2 Non-GAAP measure. See pages 19-22 for reconciliation to Costs applicable to sales.
3 Outlook constitutes forward-looking statements, which are subject to risk and uncertainties. See Cautionary Note on page 24.
4 Such policy is non-binding; declaration of future dividends remains subject to approval and discretion of the Board of Directors.
Newmont Mining Corporation
6363 South Fiddler’s Green Circle, Suite 800 Greenwood Village, CO T: 303.863.7414 F: 303.837.5837 www.newmont.com
Please see updated Outlook file on
http://www.newmont.com/our-
investors/financial-reporting, and the
8-K/A filed on July 30, 2014

Page 2 of 24
Newmont Mining Corporation 6363 South Fiddlers Green Circle Greenwood Village, CO 80111 T 303.863.7414 F 303.837.5837 www.newmont.com
Merian Update Newmont has announced a decision to develop the Merian gold mine in Suriname. The new mine is expected to begin production in late 2016, pending receipt of the Right of Exploitation from the government of Suriname. Merian offers Newmont a profitable new operation in Suriname, and a foothold in the prospective Guiana Shield region. During Merian’s first five years of operation, the Company forecasts average annual production of between 400,000 and 500,000 attributable ounces of gold at all-in sustaining costs of between $750 and $850 per ounce. Total capital to bring Merian into commercial production is estimated at between $900 million and $1 billion on a 100 percent basis. The government of Suriname has an option to earn up to a 25 percent fully-funded equity ownership stake, including all project capital and operating expenses and an initial earn-in contribution. Indonesia Update
On June 5, 2014, PT Newmont Nusa Tenggara (PTNNT), the entity operating the Batu Hijau mine, invoked the force majeure clause of its Contract of Work (CoW), the investment agreement entered into by PTNNT and the Indonesian government in 1986 and valid through 2030, due to the inability to export preventing continued production. On July 1, 2014, PTNNT and Nusa Tenggara Partnership B.V. (NTPBV), a Dutch entity and PTNNT’s majority shareholder, announced filing for international arbitration against the Government of Indonesia to seek relief from export restrictions that have halted production at Batu Hijau. As a result, we have modified Indonesian guidance for 2014 and updated our outlook for 2015 and 2016. In the meantime, the Company remains committed to seeking opportunities to resolve outstanding issues with the Government of Indonesia to resume normal operations.
2014 Second Quarter Financial Results The Company reported attributable net income from continuing operations of $182 million, or $0.37 per basic share, compared with a loss of $2.1 billion, or $4.29 per basic share in the second quarter of 2013. Adjusted net income was $101 million, or $0.20 per basic share, compared with a loss of $90 million, or $0.18 per basic share, in the prior year quarter. Revenue totaled $1.8 billion compared to $2.0 billion in the second quarter of 2013. Gold and copper AISC was $1,063 per ounce and $3.69 per pound, respectively, compared with $1,283 per ounce and $8.72 per pound, respectively, in the prior year quarter. Gold and copper CAS was $744 per ounce and $2.53 per pound, respectively, compared with $895 per ounce and $7.59 per pound, respectively, in the second quarter of 2013. Average realized gold and copper price was $1,283 per ounce and $3.01 per pound, respectively, compared with $1,386 per ounce and $2.69 per pound, respectively, in the prior year quarter.
2014 Second Quarter Operating Results Summary Attributable Production Table (Attributable production, Koz and Kt)
Region Q2 2014 Q2 2013 Change
North America 401 437 -8%
South America 106 167 -37%
Australia/New Zealand 468 418 12%
Indonesia 7 6 17%
Africa 238 139 71%
Total Gold 1,220 1,167 5%
North America 5.3 4.1 29%
Australia/New Zealand 7.4 7.4 0%
Indonesia 7.5 7.9 -5%
Total Copper 20.2 19.4 4%

Page 3 of 24
Newmont Mining Corporation 6363 South Fiddlers Green Circle Greenwood Village, CO 80111 T 303.863.7414 F 303.837.5837 www.newmont.com
Summary CAS Table (Consolidated $/oz and $/lb)
Region Q2 2014 Q2 2013 Change
North America $780 $722 8%
South America $984 $673 46%
Australia/New Zealand $748 $1,206 -38%
Indonesia $1,071 $5,299 -80%
Africa $468 $596 -21%
Total Gold CAS $744 $895 -17%
North America $2.33 $1.65 41%
Australia/New Zealand $2.42 $3.25 -26%
Indonesia $2.82 $11.23 -75%
Total Copper CAS $2.53 $7.59 -67%
Summary All-in Sustaining Costs Table (Consolidated $/oz and $/lb)
Region Q2 2014 Q2 2013 Change
North America $1,032 $1,095 -6%
South America $1,398 $949 47%
Australia/New Zealand $926 $1,425 -35%
Indonesia $1,556 $5,917 -74%
Africa $688 $1,035 -34%
Total Gold AISC $1,063 $1,283 -17%
North America $3.15 $2.38 32%
Australia/New Zealand $3.31 $3.84 -14%
Indonesia $4.32 $12.59 -66%
Total Copper AISC $3.69 $8.72 -58%
Attributable gold production increased by approximately five percent from the prior year quarter due to higher production from Africa and Australia/New Zealand, partially offset by lower production from South America. Attributable copper production increased by four percent due to new production from Phoenix Copper Leach in Nevada, offsetting lower production from Batu Hijau related to export issues. Gold CAS per ounce decreased by 17 percent due to continued reductions in direct operating costs as well as lower stockpile and leach pad inventory adjustments, partially offset by higher unit mining costs in South America. Copper CAS per pound decreased 67 percent due to lower stockpile inventory adjustments compared to the prior year quarter.
Second Quarter Operating Results by Region North America Attributable gold production at Carlin increased three percent from the prior year quarter due to higher throughput and grade at Mill 6 as well as higher recoveries at Emigrant. Utilization at Mill 6 has improved by 10 percent year to date through optimization of management controls and scheduled downtime. CAS per ounce increased 24 percent from the prior year quarter due to planned stripping at Gold Quarry and the Carlin North Area, partially offset by lower direct operating costs achieved by optimizing haulage costs and reducing leach pad consumables. Development of the Turf Vent Shaft continues on schedule and on budget. Attributable gold production at Phoenix decreased 19 percent from the prior year quarter due to lower grades and throughput. Copper production increased 29 percent from the prior year quarter due to Phoenix Copper Leach which commenced production in the fourth quarter of 2013. Gold CAS per ounce increased four percent from the prior year quarter, primarily due to lower ounces sold. Copper CAS per pound increased 41 percent from the prior year quarter, due to lower grades and higher allocation of costs to copper production based on revenue.

Page 4 of 24
Newmont Mining Corporation 6363 South Fiddlers Green Circle Greenwood Village, CO 80111 T 303.863.7414 F 303.837.5837 www.newmont.com
Attributable gold production at Twin Creeks decreased 19 percent from the prior year quarter primarily due to lower production following the sale of Midas, as well as lower grades and volumes at the Twin Creeks Autoclave. CAS per ounce decreased 19 percent from the prior year quarter, primarily due to a lower strip ratio and the sale of Midas. Attributable gold production at La Herradura decreased 15 percent from the prior year quarter, primarily due to the temporary suspension of an explosives permit. CAS per ounce decreased 28 percent from the prior year quarter, primarily due to the ramp-up of production upon receipt of a new explosives permit. Gold AISC in North America was $1,032 per ounce, a decrease of six percent over the prior year quarter due to lower advanced project and exploration spending and lower sustaining capital achieved through sustainable cost and efficiency improvements. Copper AISC was $3.15 per pound, an increase of 32 percent over the prior year quarter due to the increase in CAS as previously mentioned. South America Attributable gold production at Yanacocha decreased 35 percent from the prior year quarter, due primarily to planned processing of lower grade stockpiled ore and declining grades at Tapado Oeste and Chaquicocha. CAS per ounce increased 46 percent from the prior year quarter, primarily due to higher direct mining costs on a unit basis related to the decline in production compared to the prior year period. Gold AISC in South America was $1,398 per ounce, an increase of 47 percent over the prior year quarter primarily due to higher direct mining costs on a unit basis related to lower grade production compared to the prior year period. Australia/New Zealand Attributable gold production at Boddington decreased two percent from the prior year quarter, primarily due to lower ore grades. This was partially offset by higher mill throughput. Mill utilization rates have increased 13 percent year to date through improved conveyor reliability and consolidation of planned maintenance shutdowns. Copper production at Boddington was essentially in line with the prior year quarter as higher throughput was mostly offset by lower ore grades. Gold CAS per ounce decreased 31 percent and copper CAS per pound decreased 26 percent from the prior year quarter, primarily due to lower stockpile inventory adjustments, lower mill maintenance costs and lower mining costs on a unit basis as a result of higher tons mined. These were achieved through an improved strip ratio with improved shovel availability and a change in the mine sequence contributing to the increase in tons mined. Attributable gold production at Tanami increased 53 percent from the prior year quarter, primarily due to higher grades from the Auron ore body coupled with improved mining rates. Mining rates were enhanced through improvements in truck utilization and stope availability leading to higher mill throughput. CAS per ounce decreased 36 percent from the prior year quarter, primarily due to higher production coupled with lower underground mining costs on a unit basis. Attributable gold production at Jundee increased one percent from the prior year quarter, primarily due to higher ore grade and throughput, and was partially offset by a build-up of in-circuit inventory. CAS per ounce decreased 20 percent from the prior year quarter, primarily due to lower underground mining costs and higher production. Attributable gold production at Waihi increased 64 percent from the prior year quarter, primarily due to increased mining and throughput. CAS per ounce decreased 53 percent from the prior year quarter, primarily due to higher production and lower operating costs related to the stripping campaign in the prior year period. Attributable gold production at KCGM increased five percent from the prior year quarter, primarily due to a combination of higher ore grades and recovery, improved throughput and higher concentrate production, partially offset by a build-up of gold in-circuit inventory. CAS per ounce decreased 46 percent from the

Page 5 of 24
Newmont Mining Corporation 6363 South Fiddlers Green Circle Greenwood Village, CO 80111 T 303.863.7414 F 303.837.5837 www.newmont.com
prior year quarter, through lower direct operating costs, higher production, and the impact of the inventory adjustment in the prior year quarter. Gold AISC in Australia/New Zealand was $926 per ounce, a decrease of 35 percent, and copper AISC was $3.31 per pound, a decrease of 14 percent over the prior year quarter due to lower operating costs and the impact of the inventory adjustment in the prior year quarter. Indonesia
Attributable gold production at Batu Hijau increased 17 percent primarily due to higher grade and higher metal recovery, and was partially offset by lower throughput as a result of the export issues. Attributable copper production decreased five percent due to lower throughput related to the ramp down and was partially offset by higher ore grade milled and higher recovery. Gold CAS per ounce and copper CAS per pound decreased 80 percent and 75 percent, respectively, from the prior year quarter, primarily due to lower inventory adjustments, partially offset by the abnormal production costs related to the suspension of operations. CAS includes $16 million of abnormal costs related to the suspended operation, which equates to $267 per ounce and $0.70 per pound this quarter. Gold AISC in Indonesia was $1,556 per ounce, a decrease of 74 percent, and copper AISC was $4.32 per pound, a decrease of 66 percent over the prior year quarter due to lower inventory adjustments than the prior year quarter. Africa Attributable gold production at Ahafo decreased 10 percent from the prior year quarter due to lower grades and throughput. CAS per ounce decreased 10 percent from the prior year quarter, primarily due to lower costs, a decrease in mining rates to synchronize with mill capacity, and improved costs and tire life. Akyem contributed 113,000 ounces of gold production at CAS of $396 per ounce. Gold AISC in Africa was $688 per ounce this quarter, a decrease of 34 percent over the prior year quarter due to lower advanced projects and exploration spending and higher volume. Outlook Update For 2014, the Company now expects total attributable gold production of 4.7 to 5.0 million ounces up from 4.6 to 4.9 million ounces, an increase of two percent. CAS is now expected to be $720 to $760 per ounce reduced from $740 to $790 per ounce, a reduction of three percent. The Company also expects total copper production of 90 to 100 thousand tonnes at CAS of $2.80 to $3.10 per pound and AISC of $3.80 to $4.10 per pound. Outlook for 2015 and 2016 has been revised to include the recent sale of Jundee, and initial production from Merian in late 2016. The timing and outcome of a resolution in Indonesia is difficult to predict; however, for illustrative purposes guidance reflects the receipt of export permits for Batu Hijau, by January 1, 2015. The Batu Hijau mine is in care and maintenance pending receipt of export permits, with PTNNT expected to incur approximately $20 to $25 million per month in holding costs. For the second half of 2014, PTNNT plans to ship approximately 58,400 tonnes of concentrate containing approximately 14,400 tonnes of copper and approximately 11,000 ounces of gold from inventory to PT Smelting. PTNNT’s ability to export will impact these expectations and assumptions and Newmont’s ability to achieve outlook. Balance Sheet and Financial Flexibility In the second quarter, cash from continuing operations was $378 million and free cash flow generated from continuing operations was $124 million. At quarter end, the Company held $1.7 billion of consolidated cash on its balance sheet. During the quarter, the Company also announced the close of a $575 million five-year, amortizing term loan that was used to repay the $575 million convertible debt issue that matured July 15, 2014.

Page 6 of 24
Newmont Mining Corporation 6363 South Fiddlers Green Circle Greenwood Village, CO 80111 T 303.863.7414 F 303.837.5837 www.newmont.com
Capital Update Total capital spent in the second quarter was $254 million. Capital expenditures in North America during the second quarter of 2014 were primarily related to the development of the Turf Vent Shaft in Nevada. Capital expenditures in South America, Australia and New Zealand, Indonesia, and Africa were primarily for sustaining capital, which has been reduced across the portfolio through improved asset management. Total consolidated capital spending is now expected to be $1.4 to $1.485 billion, including $200 to $220 million of project capital for Merian partially offset by lower sustaining capital spending.

Page 7 of 24
Newmont Mining Corporation 6363 South Fiddlers Green Circle Greenwood Village, CO 80111 T 303.863.7414 F 303.837.5837 www.newmont.com
Operating Results Table Second Quarter Consolidated and Attributable Production and Consolidated CAS and AISC Results
Region
Q2 2014 Consolidated Production
Q2 2014 Attributable Production
Q2 2014 Consolidated
CAS
Q2 2014 Consolidated
AISCa
(Kozs, Kt) (Kozs, Kt) ($/oz, $/lb) ($/oz, $/lb)
Carlin 209 209 $1,003
Phoenixb 52 52 $601
Twin Creeksc 94 94 $507
La Herradurad 46 46 $568
North America 401 401 $780 $1,032
Yanacochae 190 98 $984
La Zanjaf 8
South America 190 106 $984 $1,398
Boddington 168 168 $897
Tanami 95 95 $680
Jundee 74 74 $569
Waihi 41 41 $468
KCGMd 77 77 $868
Duketonf 13
Australia/New Zealand 455 468 $748 $926
Batu Hijau, Indonesiae 15 7 $1,071 $1,556
Ahafo 125 125 $534
Akyem 113 113 $396
Africa 238 238 $468 $688
Total Gold 1,299 1,220 $744 $1,063
Phoenix 5 5 $2.33 $3.15
Boddington 7 7 $2.42 $3.31
Batu Hijaue 16 8 $2.82 $4.32
Total Copper 28 20 $2.53 $3.69
aNon-GAAP measure. See pages 19-23 for reconciliation to Costs applicable to sales.
bIncludes Lone Tree operations.
cIncludes GTRJV operations.
dBoth consolidated and attributable production are shown on a pro-rata basis with a 44% ownership
interest for La Herradura and a 50% ownership for KCGM. eConsolidated production for Yanacocha and Batu Hijau are presented on a total production basis for the
mine site; whereas attributable production represents a 51.35% ownership interest for Yanacocha, and a 48.5% interest for Batu Hijau. fLa Zanja and Duketon are not included in the consolidated figures above; attributable production figures are
presented based upon a 46.94% ownership interest at La Zanja and a 19.45% ownership interest in Duketon.

Page 8 of 24
Newmont Mining Corporation 6363 South Fiddlers Green Circle Greenwood Village, CO 80111 T 303.863.7414 F 303.837.5837 www.newmont.com
Outlook Tables 2014 Consolidated and Attributable Production, CAS, AISC, and Capital Outlook
a
Region
2014 Consolidated Production
2014 Attributable Production
2014 Consolidated
CAS
2014 All-in Sustaining
Costsb
2014 Consolidated
Capital
(Kozs, Kt) (Kozs, kt) ($/oz, $/lb) ($/oz, $/t) Expenditures
($M)
Carlin 830 - 910 830 – 910 $850 - $930 $270 - $295
Phoenixc 195 - 215 195 – 215 $655 - $715 $30 - $40
Twin Creeksd 330 - 360 330 – 360 $550 - $600 $110 - $130
La Herradurae 185 - 200 185 – 200 $800 - $875 $90 - $100
Other North America $30 - $40
North America 1,550 - 1,650 1,550 - 1,650 $750 - $810 $1,000 - $1,100 $500 - $550
Yanacochaf 895 - 985 460 – 500 $660 - $720 $135 - $150
La Zanjag 50 – 60
Other South America $225 - $270
South America 895 - 985 510 – 560 $660 - $720 $1,090 - $1,180 $360 - $400
Boddington 665 - 725 665 – 725 $880 - $960 $90 - $100
Tanami 320 - 350 320 – 350 $700 - $765 $100 - $110
Jundee 138 - 140 138 – 140 $610 - $620 $15
Waihi 120 - 130 120 – 130 $560 - $610 $25 - $30
KCGMe 300 - 330 300 – 330 $895 - $980 $30 - $40
Duketong 40 – 50
Other Australia/NZ $5 - $15
Australia/New Zealand
1,575 - 1,675 1,625 - 1,725 $805 - $880 $990 - $1,080 $275 - $300
Batu Hijau, Indonesia
h
30 - 35 15 – 20 $1,435 - $1,570 $2,060 - $2,250 $50 - $55
Ahafo 415 - 440 415 – 440 $580 - $650 $100 - $115
Akyem 440 - 480 440 – 480 $400 - $445 $15 - $25
Africa 855 - 920 855 – 920 $495 - $540 $660 - $725 $115 - $140
Corporate/Other $20 - $25
Total Gold 5,100 - 5,400 4,725 - 5,000 $720 - $760 $1,075 - $1,175 $1,400 - $1,485
Phoenix 15 - 25 15 – 25 $2.10 - $2.30
Boddington 25 - 35 25 – 35 $2.50 - $2.80
Batu Hijauh 35 - 40 15 – 20 $3.50 - $3.80
Total Copper 80 - 95 90 – 100 $2.80 - $3.10 $3.80 - $4.10 aThe outlook ranges presented herein represent forward looking statements, which are subject to certain risks and
uncertainties. See cautionary statement at the end of this release. Additionally, individual site ranges in the table above may not sum to total regional or Company levels to provide for portfolio flexibility.
bNon-GAAP measure, see pages 19-23 for reconciliation to Costs applicable to sales.
cIncludes Lone Tree operations.
dIncludes GTRJV operations.
eBoth consolidated and attributable production are shown on a pro-rata basis with a 44% ownership interest for La
Herradura and a 50% ownership for KCGM. fConsolidated production for Yanacocha is presented on a total production basis for the mine site; whereas attributable production represents a 51.35% ownership interest.

Page 9 of 24
Newmont Mining Corporation 6363 South Fiddlers Green Circle Greenwood Village, CO 80111 T 303.863.7414 F 303.837.5837 www.newmont.com
gLa Zanja and Duketon are not included in the consolidated figures above; attributable production figures are presented based upon
a 46.94% ownership interest at La Zanja and a 19.45% ownership interest in Duketon. hConsolidated production for Batu Hijau is presented on a total production basis for the mine site; whereas attributable production
represents an expected 44.5625% ownership interest in 2014 outlook (which assumes completion of the remaining share divestiture). PTNNT does not currently have approvals necessary for export. When and whether PTNNT is able to resume export in 2014 will impact outlook.
Consolidated and Attributable Production (Moz, kt)
2014 Outlook
2015 Outlook
2016 Outlook
Gold (Consolidated Moz) 5,100 - 5,400 5,010 - 5,490 5,700 - 6,100
Gold (Attributable Moz) 4,725 - 5,000 4,600 - 4,900 5,100 - 5,400
Copper (Consolidated kt) 80 - 95 220 - 240 260 - 270
Copper (Attributable kt) 90 - 100 125 - 135 140 - 150
Consolidated CAS ($/oz, $/lb) Region
2014 Outlook
2015 Outlook
2016 Outlook
North America $750 - $810 $740 - $810 $680 - $740
South America $660 - $720 $560 - $615 $770 - $840
Australia/New Zealand $805 - $880 $865 - $950 $850 - $925
Batu Hijau, Indonesia $1,435 - $1,570 $490 - $540 $440 - $480
Africa $495 - $540 $695 - $760 $730 - $800
Total Gold $720 - $760 $690 - $740 $720 - $760
Total Copper $2.80 - $3.10 $1.50 - $1.65 $1.25 - $1.35
Consolidated AISC ($/oz, $/lb) Region
2014 Outlook
2015 Outlook
2016 Outlook
North America $1,000 - $1,100 $955 - $1,045 $835 - $925
South America $1,090 - $1,180 $900 - $990 $1,180 - $1,290
Australia/New Zealand $990 - $1,080 $1,040 - $1,140 $985 - $1,075
Batu Hijau, Indonesia $2,060 - $2,250 $710 - $770 $600 - $655
Africa $660 - $725 $875 - $955 $885 - $965
Total Gold $1,075 - $1,175 $1,000 - $1,100 $985 - $1,085
Total Copper $3.80 - $4.10 $2.00 - $2.20 $1.60 - $1.80

Page 10 of 24
Newmont Mining Corporation 6363 South Fiddlers Green Circle Greenwood Village, CO 80111 T 303.863.7414 F 303.837.5837 www.newmont.com
Consolidated Capital Expenditures ($M) Region
2014 Outlook
2015 Outlook
2016 Outlook
North America $500 - $550 $430 - $475 $270 - $295
South America $360 - $400 $600 - $655 $420 - $455
Australia/New Zealand $275 - $300 $220 - $245 $190 - $210
Batu Hijau, Indonesia $50 - $55 $150 - $165 $155 - $170
Africa $115 - $140 $80 - $90 $80 - $90
Total $1,400 - $1,485 $1,550 - $1,650 $1,250 - $1,300
2014 Expense Outlook
Description 2014
Consolidated Expenses ($M)
General & Administrative $175 - $200
Other Expense $150 - $175
Interest Expense $325 - $350
DD&A $1,050 - $1,125
Exploration and Projects $400 - $450
Sustaining Capital $1,000 - $1,100
Tax Rate 37% - 40%

Page 11 of 24
Newmont Mining Corporation 6363 South Fiddlers Green Circle Greenwood Village, CO 80111 T 303.863.7414 F 303.837.5837 www.newmont.com
NEWMONT MINING CORPORATION
CONDENSED CONSOLIDATED STATEMENTS OF OPERATIONS
(unaudited, in millions except per share)
Three Months Ended Six Months Ended
June 30, June 30,
2014 2013 2014 2013
Sales
$ 1,765 $ 2,018 $ 3,529 $ 4,206
Costs and expenses
Costs applicable to sales (1)
1,060 1,682 2,143 2,739
Depreciation and amortization 306 415 604 682
Reclamation and remediation 21 18 41 36
Exploration 41 76 75 135
Advanced projects, research and development 42 46 84 98
General and administrative 48 54 93 110
Write-downs 13 2,261 13 2,262
Other expense, net 51 77 103 176
1,582 4,629 3,156 6,238
Other income (expense)
Other income, net 3 50 49 76
Interest expense, net (94) (70) (187) (135)
(91) (20) (138) (59)
Income (loss) before income and mining tax and other items 92 (2,631) 235 (2,091)
Income and mining tax benefit (expense) 53 287 (25) 107
Equity income (loss) of affiliates 2 (3) 2 (7)
Income (loss) from continuing operations 147 (2,347) 212 (1,991)
Income (loss) from discontinued operations (2) 74 (19) 74
Net income (loss) 145 (2,273) 193 (1,917)
Net loss (income) attributable to noncontrolling interests 35 214 87 172
Net income (loss) attributable to Newmont stockholders $ 180 $ (2,059) $ 280 $ (1,745)
Net income (loss) attributable to Newmont stockholders:
Continuing operations $ 182 $ (2,133) $ 299 $ (1,819)
Discontinued operations (2) 74 (19) 74
$ 180 $ (2,059) $ 280 $ (1,745)
Income (loss) per common share
Basic:
Continuing operations $ 0.37 $ (4.29) $ 0.60 $ (3.66)
Discontinued operations (0.01) 0.15 (0.04) 0.15
$ 0.36 $ (4.14) $ 0.56 $ (3.51)
Diluted:
Continuing operations $ 0.37 $ (4.29) $ 0.60 $ (3.66)
Discontinued operations (0.01) 0.15 (0.04) 0.15
$ 0.36 $ (4.14) $ 0.56 $ (3.51)
Cash dividends declared per common share $ 0.025 $ 0.35 $ 0.175 $ 0.775 (1)
Excludes Depreciation and amortization and Reclamation and remediation.

Page 12 of 24
Newmont Mining Corporation 6363 South Fiddlers Green Circle Greenwood Village, CO 80111 T 303.863.7414 F 303.837.5837 www.newmont.com
NEWMONT MINING CORPORATION
CONDENSED CONSOLIDATED STATEMENTS OF CASH FLOWS
(unaudited, in millions)
Three Months Ended Six Months Ended
June 30, June 30,
2014 2013 2014 2013
Operating activities:
Net income (loss) $ 145 $ (2,273) $ 193 $ (1,917)
Adjustments:
Depreciation and amortization 306 415 604 682
Stock based compensation and other non-cash benefits 14 19 27 38
Reclamation and remediation 21 18 41 36
Loss (income) from discontinued operations 2 (74) 19 (74)
Write-downs 13 2,262 13 2,262
Impairment of marketable securities - 7 1 11
Deferred income taxes (127) (469) (92) (480)
Gain on asset and investment sales, net (2) - (52) (1)
Other operating adjustments and write-downs 109 558 260 632
Net change in operating assets and liabilities (103) (170) (453) (457)
Net cash provided from continuing operations 378 293 561 732
Net cash used in discontinued operations (3) (5) (6) (11)
Net cash provided from operations 375 288 555 721
Investing activities:
Additions to property, plant and mine development (254) (610) (489) (1,120)
Acquisitions, net - (5) (28) (13)
Sale of marketable securities - - 25 1
Purchases of marketable securities - - (1) (1)
Proceeds from sale of other assets 6 24 76 49
Other (2) (7) (11) (21)
Net cash used in investing activities (250) (598) (428) (1,105)
Financing activities:
Proceeds from debt, net 15 907 18 987
Repayment of debt (5) (534) (5) (534)
Proceeds from stock issuance, net - 1 - 2
Sale of noncontrolling interests 68 - 68 32
Acquisition of noncontrolling interests (2) (4) (4) (10)
Dividends paid to noncontrolling interests (4) (2) (4) (2)
Dividends paid to common stockholders (12) (174) (89) (385)
Other (7) (2) (11) (3)
Net cash provided from (used in) financing activities 53 192 (27) 87
Effect of exchange rate changes on cash - (12) (2) (16)
Net change in cash and cash equivalents 178 (130) 98 (313)
Cash and cash equivalents at beginning of period 1,475 1,378 1,555 1,561
Cash and cash equivalents at end of period $ 1,653 $ 1,248 $ 1,653 $ 1,248

Page 13 of 24
Newmont Mining Corporation 6363 South Fiddlers Green Circle Greenwood Village, CO 80111 T 303.863.7414 F 303.837.5837 www.newmont.com
NEWMONT MINING CORPORATION
CONDENSED CONSOLIDATED BALANCE SHEETS
(unaudited, in millions)
At June 30, At December 31,
2014 2013
ASSETS
Cash and cash equivalents $ 1,653 $ 1,555
Trade receivables 147 230
Accounts receivable 299 252
Investments 84 78
Inventories 863 717
Stockpiles and ore on leach pads 775 805
Deferred income tax assets 287 246
Other current assets 1,246 1,006
Current assets 5,354 4,889
Property, plant and mine development, net 14,043 14,277
Investments 347 439
Stockpiles and ore on leach pads 2,773 2,680
Deferred income tax assets 1,611 1,478
Other long-term assets 848 844
Total assets $ 24,976 $ 24,607
LIABILITIES
Debt $ 112 $ 595
Accounts payable 435 478
Employee-related benefits 232 341
Income and mining taxes 52 13
Other current liabilities 1,421 1,313
Current liabilities 2,252 2,740
Debt 6,673 6,145
Reclamation and remediation liabilities 1,531 1,513
Deferred income tax liabilities 730 635
Employee-related benefits 345 323
Other long-term liabilities 354 342
Total liabilities 11,885 11,698
EQUITY
Common stock 798 789
Additional paid-in capital 8,636 8,538
Accumulated other comprehensive income (loss) (242) (182)
Retained earnings 1,039 848
Newmont stockholders’ equity 10,231 9,993
Noncontrolling interests 2,860 2,916
Total equity 13,091 12,909
Total liabilities and equity $ 24,976 $ 24,607

Page 14 of 24
Newmont Mining Corporation 6363 South Fiddlers Green Circle Greenwood Village, CO 80111 T 303.863.7414 F 303.837.5837 www.newmont.com
Regional Operating Statistics Production Statistics Summary
Three Months Ended June 30, Six Months Ended June 30,
2014 2013 2014 2013
Consolidated gold ounces produced (thousands):
North America
Carlin 209 203 438 434
Phoenix 52 64 105 116
Twin Creeks 94 116 190 215
La Herradura 46 54 74 109
401 437 807 874
South America
Yanacocha 190 291 398 577 Australia/New Zealand
Boddington 168 171 342 347
Tanami 95 62 179 122
Jundee 74 73 138 150
Waihi 41 25 67 55
Kalgoorlie 77 73 167 151
455 404 893 825
Indonesia
Batu Hijau 15 13 31 27 Africa
Ahafo 125 139 230 264
Akyem 113 - 232 -
238 139 462 264
1,299 1,284 2,591 2,567
Consolidated copper pounds produced (millions):
Phoenix 12 9 24 16
Boddington 16 16 34 35
Batu Hijau 34 36 81 76
62 61 139 127
Consolidated copper tonnes produced (thousands):
Phoenix 5 4 11 7
Boddington 7 7 15 16
Batu Hijau 16 16 37 35
28 27 63 58

Page 15 of 24
Newmont Mining Corporation 6363 South Fiddlers Green Circle Greenwood Village, CO 80111 T 303.863.7414 F 303.837.5837 www.newmont.com
Production Statistics Summary
Three Months Ended June 30, Six Months Ended June 30,
2014 2013 2014 2013
Attributable gold ounces produced (thousands):
North America
Carlin 209 203 438 434
Phoenix 52 64 105 116
Twin Creeks 94 116 190 215
La Herradura 46 54 74 109
401 437 807 874
South America
Yanacocha 98 150 205 296
Other South America Equity Interests 8 17 23 32
106 167 228 328
Australia/New Zealand
Boddington 168 171 342 347
Tanami 95 62 179 122
Jundee 74 73 138 150
Waihi 41 25 67 55
Kalgoorlie 77 73 167 151 Other Australia/New Zealand Equity Interests 13 14 25 29
468 418 918 854
Indonesia
Batu Hijau 7 6 15 13 Africa
Ahafo 125 139 230 264
Akyem 113 - 232 -
238 139 462 264
1,220 1,167 2,430 2,333
Attributable copper pounds produced (millions):
Phoenix 12 9 24 16
Boddington 16 16 34 35
Batu Hijau 17 17 39 37
45 42 97 88
Attributable copper tonnes produced (thousands):
Phoenix 5 4 11 7
Boddington 7 7 15 16
Batu Hijau 8 8 18 17
20 19 44 40

Page 16 of 24
Newmont Mining Corporation 6363 South Fiddlers Green Circle Greenwood Village, CO 80111 T 303.863.7414 F 303.837.5837 www.newmont.com
CAS Three Months Ended June 30,
Six Months Ended June 30,
2014
2013 2014 2013
Gold
Costs Applicable to Sales ($/ounce)
(1)
North America
Carlin $ 1,003 $ 806 $ 919 $ 806
Phoenix 601 579 613 796
Twin Creeks 507 628 522 592
La Herradura 568 784 603 750
780
722 753 743
South America
Yanacocha 984 673 1,032 626
Australia/New Zealand
Boddington 897 1,307 873 1,086
Tanami 680 1,064 680 1,156
Jundee 569 714 614 712
Waihi 468 995 577 954 Kalgoorlie 868 1,601 852 1,309
748
1,206 765 1,062
Indonesia
Batu Hijau 1,071 5,299 1,161 3,682
Africa
Ahafo 534 596 544 577
Akyem 396 - 353 -
468
596 448 577
Average $ 744 $ 895 $ 747 $ 830
Copper
Costs Applicable to Sales ($/pound)
(1)
Phoenix
$ 2.33 $ 1.65 $ 2.36 $ 2.11
Boddington 2.42 3.25 2.53 2.78
Batu Hijau 2.82 11.23 2.90 7.71
Average $ 2.53 $ 7.59 $ 2.62 $ 5.35
(1)Consolidated Costs applicable to sales excludes Depreciation and amortization and Reclamation and
remediation.
Page 17 of 24
Newmont Mining Corporation 6363 South Fiddlers Green Circle Greenwood Village, CO 80111 T 303.863.7414 F 303.837.5837 www.newmont.com
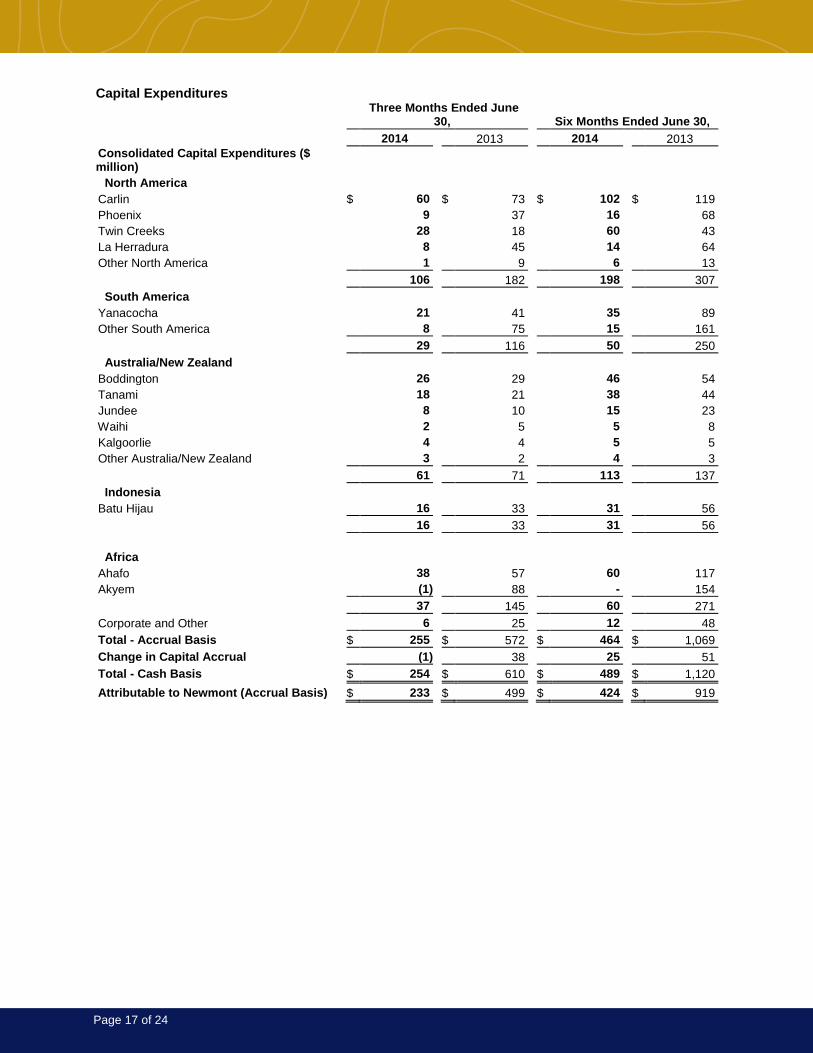
Capital Expenditures
Three Months Ended June
30,
Six Months Ended June 30,
2014
2013 2014 2013
Consolidated Capital Expenditures ($ million) North America
Carlin $ 60 $ 73 $ 102 $ 119
Phoenix 9 37 16 68
Twin Creeks 28 18 60 43
La Herradura 8 45 14 64
Other North America 1 9 6 13
106
182 198 307
South America
Yanacocha 21 41 35 89
Other South America 8 75 15 161
29
116 50 250
Australia/New Zealand
Boddington 26 29 46 54
Tanami 18 21 38 44
Jundee 8 10 15 23
Waihi 2 5 5 8 Kalgoorlie 4 4 5 5
Other Australia/New Zealand 3 2 4 3
61
71 113 137
Indonesia
Batu Hijau 16 33 31 56
16
33 31 56
Africa
Ahafo 38 57 60 117
Akyem (1) 88 - 154
37
145 60 271
Corporate and Other 6 25 12 48
Total - Accrual Basis $ 255 $ 572 $ 464 $ 1,069
Change in Capital Accrual (1) 38 25 51
Total - Cash Basis $ 254 $ 610 $ 489 $ 1,120
Attributable to Newmont (Accrual Basis) $ 233 $ 499 $ 424 $ 919

Page 18 of 24
Newmont Mining Corporation 6363 South Fiddlers Green Circle Greenwood Village, CO 80111 T 303.863.7414 F 303.837.5837 www.newmont.com
Non-GAAP Financial Measures
Non-GAAP financial measures are intended to provide additional information only and do not have any standard meaning prescribed by generally accepted accounting principles (“GAAP”). These measures should not be considered in isolation or as a substitute for measures of performance prepared in accordance with GAAP.
Adjusted net income (loss) Management of the Company uses Adjusted net income (loss) to evaluate the Company’s operating
performance, and for planning and forecasting future business operations. The Company believes the use of Adjusted net income (loss) allows investors and analysts to compare results of the continuing operations of the Company and its direct and indirect subsidiaries relating to the production and sale of minerals to similar operating results of other mining companies, by excluding exceptional or unusual items. Management’s determination of the components of Adjusted net income (loss) are evaluated periodically and based, in part, on a review of non-GAAP financial measures used by mining industry analysts. Net income (loss) attributable to Newmont stockholders is reconciled to Adjusted net income (loss) as follows:
Three Months Ended June 30,
Six Months Ended June 30,
2014
2013 2014 2013
Net income (loss) attributable to Newmont stockholders $ 180 $ (2,059) $ 280 $ (1,745)
Loss (income) from discontinued operations
2 (74) 19 (74)
Impairments and loss provisions
5 1,497 7 1,501
Tax valuation allowance
(98) 535 (98) 535
Restructuring and other
4 11 7 16
Asset sales
(1) - (14) -
Abnormal production costs at Batu Hijau
9 - 9 -
TMAC transaction costs
- - - 30
Adjusted net income (loss) $ 101 $ (90) $ 210 $ 263
Adjusted net income (loss) per share, basic $ 0.20 $ (0.18) $ 0.42 $ 0.53
Adjusted net income (loss) per share, diluted $ 0.20 $ (0.18) $ 0.42 $ 0.53
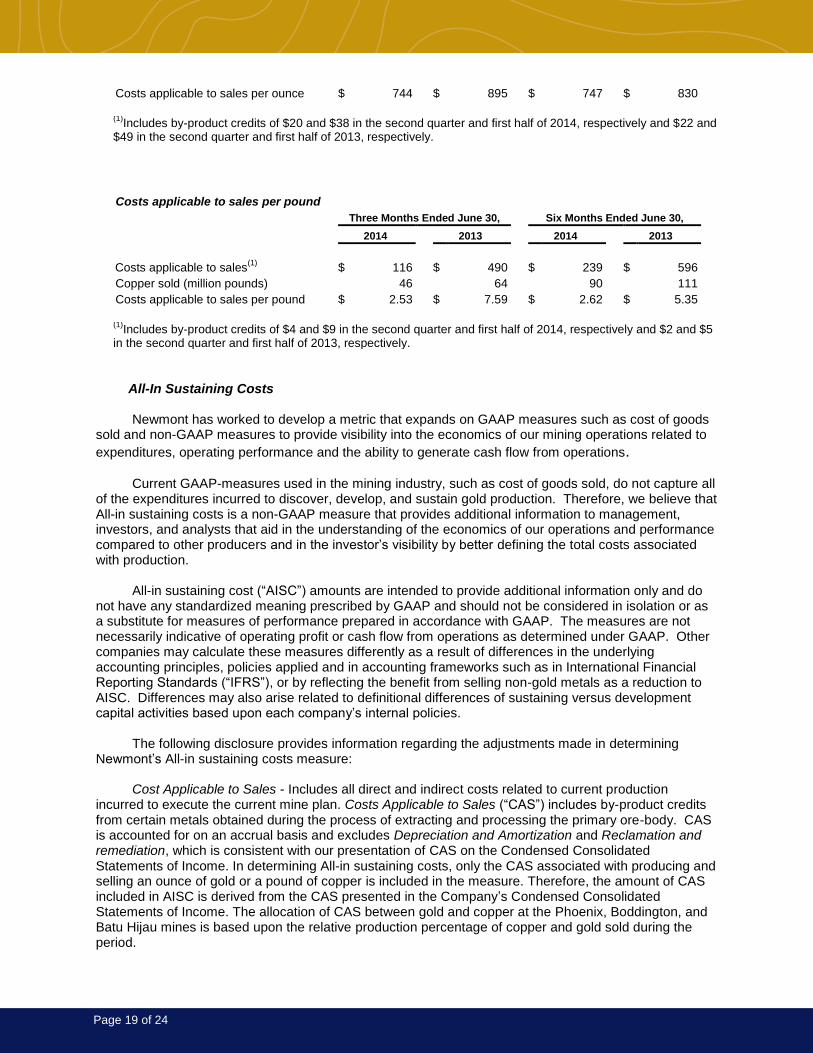
Costs applicable to sales per ounce/pound Costs applicable to sales per ounce/pound are non-GAAP financial measures. These measures are
calculated by dividing the costs applicable to sales of gold and copper by gold ounces or copper pounds sold, respectively. These measures are calculated on a consistent basis for the periods presented on a consolidated basis. Costs applicable to sales per ounce/pound statistics are intended to provide additional information only and do not have any standardized meaning prescribed by GAAP and should not be considered in isolation or as a substitute for measures of performance prepared in accordance with GAAP. The measures are not necessarily indicative of operating profit or cash flow from operations as determined under GAAP. Other companies may calculate these measures differently.
The following tables reconcile these non-GAAP measures to the most directly comparable GAAP measures.
Costs applicable to sales per ounce
Three Months Ended June 30,
Six Months Ended June 30,
2014
2013 2014 2013
Costs applicable to sales(1)
$ 944 $ 1,192 $ 1,904 $ 2,143
Gold sold (thousand ounces) 1,269 1,331 2,547 2,583
Page 19 of 24
Newmont Mining Corporation 6363 South Fiddlers Green Circle Greenwood Village, CO 80111 T 303.863.7414 F 303.837.5837 www.newmont.com
Costs applicable to sales per ounce $ 744 $ 895 $ 747 $ 830
(1)Includes by-product credits of $20 and $38 in the second quarter and first half of 2014, respectively and $22 and
$49 in the second quarter and first half of 2013, respectively.
(2)
Relates to partners' interests in a.
Costs applicable to sales per pound
Three Months Ended June 30,
Six Months Ended June 30,
2014
2013 2014 2013
Costs applicable to sales(1)
$ 116 $ 490 $ 239 $ 596
Copper sold (million pounds) 46 64 90 111
Costs applicable to sales per pound $ 2.53 $ 7.59 $ 2.62 $ 5.35
(1)Includes by-product credits of $4 and $9 in the second quarter and first half of 2014, respectively and $2 and $5
in the second quarter and first half of 2013, respectively.
(2)
Relates to partners' interests in
All-In Sustaining Costs Newmont has worked to develop a metric that expands on GAAP measures such as cost of goods
sold and non-GAAP measures to provide visibility into the economics of our mining operations related to
expenditures, operating performance and the ability to generate cash flow from operations. Current GAAP-measures used in the mining industry, such as cost of goods sold, do not capture all
of the expenditures incurred to discover, develop, and sustain gold production. Therefore, we believe that All-in sustaining costs is a non-GAAP measure that provides additional information to management, investors, and analysts that aid in the understanding of the economics of our operations and performance compared to other producers and in the investor’s visibility by better defining the total costs associated with production.
All-in sustaining cost (“AISC”) amounts are intended to provide additional information only and do
not have any standardized meaning prescribed by GAAP and should not be considered in isolation or as a substitute for measures of performance prepared in accordance with GAAP. The measures are not necessarily indicative of operating profit or cash flow from operations as determined under GAAP. Other companies may calculate these measures differently as a result of differences in the underlying accounting principles, policies applied and in accounting frameworks such as in International Financial Reporting Standards (“IFRS”), or by reflecting the benefit from selling non-gold metals as a reduction to AISC. Differences may also arise related to definitional differences of sustaining versus development capital activities based upon each company’s internal policies.
The following disclosure provides information regarding the adjustments made in determining
Newmont’s All-in sustaining costs measure: Cost Applicable to Sales - Includes all direct and indirect costs related to current production
incurred to execute the current mine plan. Costs Applicable to Sales (“CAS”) includes by-product credits from certain metals obtained during the process of extracting and processing the primary ore-body. CAS is accounted for on an accrual basis and excludes Depreciation and Amortization and Reclamation and remediation, which is consistent with our presentation of CAS on the Condensed Consolidated Statements of Income. In determining All-in sustaining costs, only the CAS associated with producing and selling an ounce of gold or a pound of copper is included in the measure. Therefore, the amount of CAS included in AISC is derived from the CAS presented in the Company’s Condensed Consolidated Statements of Income. The allocation of CAS between gold and copper at the Phoenix, Boddington, and Batu Hijau mines is based upon the relative production percentage of copper and gold sold during the period.

Page 20 of 24
Newmont Mining Corporation 6363 South Fiddlers Green Circle Greenwood Village, CO 80111 T 303.863.7414 F 303.837.5837 www.newmont.com
Remediation Costs - Includes accretion expense related to asset retirement obligations (“ARO”) and the amortization of the related Asset Retirement Cost (“ARC”) for the Company’s operating properties recorded as an ARC asset. Accretion related to ARO and the amortization of the ARC assets for reclamation and remediation do not reflect annual cash outflows but are calculated in accordance with GAAP. The accretion and amortization reflect the periodic costs of reclamation and remediation associated with current gold production and are therefore included in the measure. The allocation of these costs to gold and copper is determined using the same allocation used in the allocation of CAS between gold and copper at the Phoenix, Boddington, and Batu Hijau mines.
Advanced Projects and Exploration - Includes incurred expenses related to projects that are
designed to increase or enhance current gold production and gold exploration. We note that as current resources are depleted, exploration and advanced projects are necessary for us to replace the depleting reserves or enhance the recovery and processing of the current reserves. As this relates to sustaining our gold production, and is considered a continuing cost of a mining company, these costs are included in the AISC measure. These costs are derived from the Advanced projects, research and development and Exploration amounts presented in the Company’s Condensed Consolidated Statements of Income. The allocation of these costs to gold and copper is determined using the same allocation used in the allocation of CAS between gold and copper at the Phoenix, Boddington, and Batu Hijau mines.
General and Administrative - Includes cost related to administrative tasks not directly related to
current gold production, but rather related to support our corporate structure and fulfilling our obligations to operate as a public company. Including these expenses in the AISC metric provides visibility of the impact that general and administrative activities have on current operations and profitability on a per ounce basis.
Other Expense, net - Includes costs related to regional administration and community development
to support current production. We exclude certain exceptional or unusual expenses from Other expense, net, such as restructuring, as these are not indicative to sustaining our current operations. Furthermore, this adjustment to Other expense, net is also consistent with the nature of the adjustments made to Net income (loss) as disclosed in the Company’s non-GAAP financial measure Adjusted net income (loss). The allocation of these costs to gold and copper is determined using the same allocation used in the allocation of CAS between gold and copper at the Phoenix, Boddington, and Batu Hijau mines.
Treatment and Refining Costs - Includes costs paid to smelters for treatment and refining of our
concentrates to produce the salable precious metal. These costs are presented net as a reduction of Sales.
Sustaining Capital - We determined sustaining capital as those capital expenditures that are
necessary to maintain current gold production and execute the current mine plan. Capital expenditures to develop new operations, or related to projects at existing operations where these projects will enhance gold production or reserves, are considered development. We determined the breakout of sustaining and development capital costs based on a systematic review of our project portfolio in light of the nature of each project. Sustaining capital costs are relevant to the AISC metric as these are needed to maintain the Company’s current gold operations and provide improved transparency related to our ability to finance these expenditures from current operations. The allocation of these costs to gold and copper is determined using the same allocation used in the allocation of CAS between gold and copper at the Phoenix, Boddington, and Batu Hijau mines.
Page 21 of 24
Newmont Mining Corporation 6363 South Fiddlers Green Circle Greenwood Village, CO 80111 T 303.863.7414 F 303.837.5837 www.newmont.com
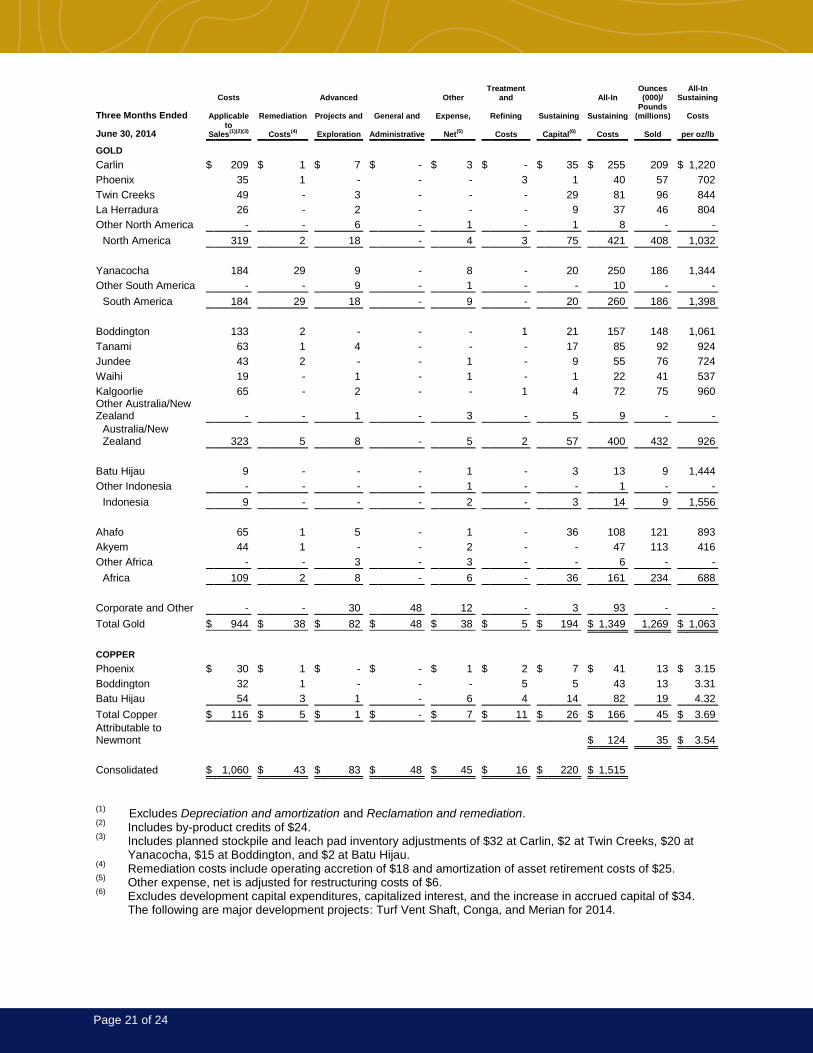
Costs Advanced Other Treatment
and All-In Ounces (000)/
All-In Sustaining
Three Months Ended Applicable Remediation Projects and General and Expense, Refining Sustaining Sustaining Pounds
(millions) Costs
June 30, 2014 to
Sales(1)(2)(3)
Costs(4)
Exploration Administrative Net
(5)
Costs
Capital
(6)
Costs
Sold per oz/lb
GOLD
Carlin $ 209 $ 1 $ 7 $ - $ 3 $ - $ 35 $ 255 209 $ 1,220
Phoenix 35 1 - - - 3 1 40 57 702
Twin Creeks 49 - 3 - - - 29 81 96 844
La Herradura 26 - 2 - - - 9 37 46 804
Other North America - - 6 - 1 - 1 8 - -
North America 319 2 18 - 4 3 75 421 408 1,032
Yanacocha 184 29 9 - 8 - 20 250 186 1,344
Other South America - - 9 - 1 - - 10 - -
South America 184 29 18 - 9 - 20 260 186 1,398
Boddington 133 2 - - - 1 21 157 148 1,061
Tanami 63 1 4 - - - 17 85 92 924
Jundee 43 2 - - 1 - 9 55 76 724
Waihi 19 - 1 - 1 - 1 22 41 537
Kalgoorlie 65 - 2 - - 1 4 72 75 960 Other Australia/New Zealand - - 1 - 3 - 5 9 - -
Australia/New Zealand 323 5 8 - 5 2 57 400 432 926
Batu Hijau 9 - - - 1 - 3 13 9 1,444
Other Indonesia - - - - 1 - - 1 - -
Indonesia 9 - - - 2 - 3 14 9 1,556
Ahafo 65 1 5 - 1 - 36 108 121 893
Akyem 44 1 - - 2 - - 47 113 416
Other Africa - - 3 - 3 - - 6 - -
Africa 109 2 8 - 6 - 36 161 234 688
Corporate and Other - - 30 48 12 - 3 93 - -
Total Gold $ 944 $ 38 $ 82 $ 48 $ 38 $ 5 $ 194 $ 1,349 1,269 $ 1,063
COPPER
Phoenix $ 30 $ 1 $ - $ - $ 1 $ 2 $ 7 $ 41 13 $ 3.15
Boddington 32 1 - - - 5 5 43 13 3.31
Batu Hijau 54 3 1 - 6 4 14 82 19 4.32
Total Copper $ 116 $ 5 $ 1 $ - $ 7 $ 11 $ 26 $ 166 45 $ 3.69
Attributable to Newmont $ 124 35 $ 3.54
Consolidated $ 1,060 $ 43 $ 83 $ 48 $ 45 $ 16 $ 220 $ 1,515
(1)
Excludes Depreciation and amortization and Reclamation and remediation. (2)
Includes by-product credits of $24. (3)
Includes planned stockpile and leach pad inventory adjustments of $32 at Carlin, $2 at Twin Creeks, $20 at Yanacocha, $15 at Boddington, and $2 at Batu Hijau.
(4) Remediation costs include operating accretion of $18 and amortization of asset retirement costs of $25.
(5) Other expense, net is adjusted for restructuring costs of $6.
(6) Excludes development capital expenditures, capitalized interest, and the increase in accrued capital of $34. The following are major development projects: Turf Vent Shaft, Conga, and Merian for 2014.

Page 22 of 24
Newmont Mining Corporation 6363 South Fiddlers Green Circle Greenwood Village, CO 80111 T 303.863.7414 F 303.837.5837 www.newmont.com
Costs Advanced Other Treatment
and All-In Ounces (000)/
All-In Sustaining
Three Months Ended Applicable Remediation Projects and General and Expense, Refining Sustaining Sustaining Pounds
(millions) Costs
June 30, 2013 to
Sales(1)(2)(3)
Costs(4)
Exploration Administrative Net
(5)
Costs
Capital
(6)
Costs
Sold per oz/lb
GOLD
Carlin $ 169 $ 2 $ 8 $ - $ 1 $ - $ 49 $ 229 210 $ 1,090
Phoenix 37 1 2 - 1 2 6 49 64 766
Twin Creeks 80 1 3 - 1 - 12 97 125 776
La Herradura 42 - 15 - - - 41 98 54 1,815
Other North America - - 13 - 1 - 9 23 - -
North America 328 4 41 - 4 2 117 496 453 1,095
Yanacocha 201 22 10 - 15 - 31 279 296 943
Other South America - - 2 - - - - 2 - -
South America 201 22 12 - 15 - 31 281 296 949
Boddington 252 2 - - 1 2 21 278 193 1,440
Tanami 64 - 3 - 1 - 20 88 60 1,467
Jundee 51 3 3 - 1 - 12 70 73 959
Waihi 25 1 1 - - - 5 32 25 1,280
Kalgoorlie 123 1 1 - 1 - 2 128 77 1,662 Other Australia/New Zealand - - 4 - 11 - (1) 14 - -
Australia/New Zealand 515 7 12 - 15 2 59 610 428 1,425
Batu Hijau 63 - 1 - 1 1 5 71 12 5,917
Indonesia 63 - 1 - 1 1 5 71 12 5,917
Ahafo 85 1 11 - 2 - 38 137 142 965
Akyem - - 2 - - - - 2 - -
Other Africa - - 4 - 4 - - 8 - -
Africa 85 1 17 - 6 - 38 147 142 1,035
Corporate and Other - - 34 54 9 - 6 103 - -
Total Gold $ 1,192 $ 34 $ 117 $ 54 $ 50 $ 5 $ 256 $ 1,708 1,331 $ 1,283
COPPER
Phoenix $ 15 $ - $ 1 $ - $ - $ 1 $ 2 $ 19 8 $ 2.38
Boddington 62 - - - - 5 6 73 19 3.84
Batu Hijau 413 2 4 - 6 11 30 466 37 12.59
Total Copper $ 490 $ 2 $ 5 $ - $ 6 $ 17 $ 38 $ 558 64 $ 8.72
Consolidated $ 1,682 $ 36 $ 122 $ 54 $ 56 $ 22 $ 294 $ 2,266
(1)
Excludes Depreciation and amortization and Reclamation and remediation. (2)
Includes by-product credits of $24. (3)
Includes stockpile and leach pad inventory adjustments of $49 at Yanacocha, $86 at Boddington, $0 at Tanami, $1 at Waihi, $45 at Kalgoorlie, and $366 at Batu Hijau.
(4) Remediation costs include operating accretion of $15 and amortization of asset retirement costs of $21.
(5) Other expense, net is adjusted for restructuring costs of $21.
(6) Excludes development capital expenditures, capitalized interest, and the decrease in accrued capital of $316. The following are major development projects: Phoenix Copper Leach, Turf Vent Shaft, Vista Vein, La Herradura Mill, Yanacocha Bio Leach, Conga, Merian, Ahafo North, Ahafo Mill Expansion, Subika Underground, and Akyem for 2013.
Page 23 of 24
Newmont Mining Corporation 6363 South Fiddlers Green Circle Greenwood Village, CO 80111 T 303.863.7414 F 303.837.5837 www.newmont.com
Conference Call Information
A conference call will be held on Wednesday, July 30, 2014 at 10:00 a.m. Eastern Time (8:00 a.m.
Mountain Time); it will also be carried on the Company's website.
Conference Call Details
Dial-In Number 888.469.0880 Intl Dial-In Number 415.228.3922 Leader Meredith Bandy Passcode Newmont Replay Number 800.294.3086 Intl Replay Number 402.220.9766
Replay Passcode 2014
Webcast Details
URL http://event.on24.com/r.htm?e=811917&s=1&k=476C3CBABBF9B6626C9F6C04FC6F12BA The second quarter 2014 results and related financial and statistical information will be available after the market close on Tuesday, July 29, 2014 on the “Investor Relations” section of the Company’s website, www.newmont.com. Additionally, the conference call will be archived for a limited time on the Company’s website. Investor Contacts
Meredith Bandy 303.837.5143 [email protected]
Kirsten Benefiel 303.837.6117 [email protected]
Media Contacts
Omar Jabara 303.837.5114 [email protected] Diane Reberger 303.967.9455 [email protected]

Page 24 of 24
Newmont Mining Corporation 6363 South Fiddlers Green Circle Greenwood Village, CO 80111 T 303.863.7414 F 303.837.5837 www.newmont.com
Cautionary Statement Regarding Forward Looking Statements, Including Outlook: This release contains “forward-looking statements” within the meaning of Section 27A of the Securities Act of 1933, as amended, and Section 21E of the Securities Exchange Act of 1934, as amended, which are intended to be covered by the safe harbor created by such sections and other applicable laws. Such forward-looking statements may include, without limitation: (i) estimates of future production and sales; (ii) estimates of future costs applicable to sales and All-in sustaining costs; (iii) estimates of future consolidated and attributable capital expenditures; (iv) plans and expectations to reduce costs and expenditures; (v) expectations regarding the development, growth and exploration potential of the Company’s projects, including, without limitation, Merian; and (vi) expectations regarding the timing and/or likelihood of resolution of export issues in Indonesia. Estimates or expectations of future events or results are based upon certain assumptions, which may prove to be incorrect. Such assumptions, include, but are not limited to: (i) there being no significant change to current geotechnical, metallurgical, hydrological and other physical conditions; (ii) permitting, development, operations and expansion of the Company’s operations and projects being consistent with current expectations and mine plans, including without limitation receipt of export approvals; (iii) political developments in any jurisdiction in which the Company operates being consistent with its current expectations; (iv) certain exchange rate assumptions for the Australian dollar to the U.S. dollar, as well as other the exchange rates being approximately consistent with current levels; (v) certain price assumptions for gold, copper and oil; (vi) prices for key supplies being approximately consistent with current levels; (vii) the accuracy of our current mineral reserve and mineral resource estimates; and (viii) other assumptions noted herein. Where the Company expresses or implies an expectation or belief as to future events or results, such expectation or belief is expressed in good faith and believed to have a reasonable basis. However, such statements are subject to risks, uncertainties and other factors, which could cause actual results to differ materially from future results expressed, projected or implied by the “forward-looking statements”. Such risks include, but are not limited to, gold and other metals price volatility, currency fluctuations, increased production costs and variances in ore grade or recovery rates from those assumed in mining plans, political and operational risks, community relations, conflict resolution and outcome of projects or oppositions and governmental regulation and judicial outcomes. For a more detailed discussion of such risks and other factors, see the Company’s 2013 Annual Report on Form 10-K, filed on February 21, 2014, with the Securities and Exchange Commission, as well as the Company’s other SEC filings. The Company does not undertake any obligation to release publicly revisions to any “forward-looking statement,” including, without limitation, outlook, to reflect events or circumstances after the date of this news release, or to reflect the occurrence of unanticipated events, except as may be required under applicable securities laws. Investors should not assume that any lack of update to a previously issued “forward-looking statement” constitutes a reaffirmation of that statement. Continued reliance on “forward-looking statements” is at investors' own risk.
Investors are reminded that this news release should be read in conjunction with Newmont’s Second Quarter Form 10-Q filed with the Securities and Exchange Commission on or about July 29, 2014 (available at www.newmont.com).