newmont mining corp inc
TRANSCRIPT

May 7th, 2016
MINING: GOLD COMPANY
NEWMONT MINING CORP INC.
NEM/NYSE
Newmont:
KEY THEMES
Our Recommendation is based on the following assumptions:
Based on the DCF valuation done for the company from its financial situation, economic and industrial expectancies, we estimate a price per share of $ 33.49, which implies a downside of 1.9% compared to May 6th price of $34.13.
The Gold companies are focusing on sustainability through the reduction of all in sustained costs, which can be easily achieved through exchange rate differences. The 2016 cost is expected to decrease 2.05% and in the long run to achieve a cost of $880/oz, an average YoY decrease of 0.4%.
As a commodity company, the driver for revenue will continue to be the gold price; we project an increase from 2016-2020 of 4% YoY, which is 91%-95% of Newmont revenue.
The consolidated gold production is projected to increase in the next 2 years (2016-2017), due to the opening of operation of two projects. Production is expected to rise 2.3% in 2016-2017, 2018 no new mines are projected to open, but one is expected to close and the production will decrease in a YoY average of 0.2% in the next 3 years (2018-2020).
Recommendation: HOLD
CONTRIBUTORS Jocelyne Lagos
Pablo Alvarado
CONTENT
Company Overview
Strategy
Demand & Supply
Valuation
PERFORMANCE
Source: Newmont financial information
"Please see the disclaimer at back of this report for important information."
(c) 2016, Jocelyne Lagos, Pablo Alvarado

COMPANY OVERVIEW
Newmont Mining Corp Inc
Ticker: NEM/NYSE
Recommendation: HOLD
Price: $34.11
Gold Price $1,293.53
Location: 6363 South Fiddler´s Green Circle, Suite 800. Greenwood Village, CO 80111
Sector: Minerals And Metals
Sub-Sector: Gold Mining
Employees: 28,000
Web page: www.newmont.com
Source: Bloomberg, Yahoo Finance
“Newmont Mining Corporation is one of the world’s leading senior gold producers with significant operations in the United States, Australia, Peru, Indonesia, Ghana, New Zealand and Mexico. After Barrick Gold, it is the second largest gold producer with a market share of 18.4%. In December 31, 2015, Newmont´s proven and probable gold reserves ascended to 98.8 million ounces. Newmont is engaged in the production of copper, principally through its Batu Hijau operation in Indonesia and Boddington operation in Australia. The company has been publicly trading since 1925”. (Newmont Mining Corporation Form 10-K).

Source: Newmont 2015 annual report
“It had consolidated gold production of 5.7 million ounces (5.0 million attributable ounces) in 2015, 5.2 million ounces (4.8 million attributable ounces) in 2014 and 5.5 million ounces (5.1 million attributable ounces) in 2013. Of its 2015 consolidated gold production, approximately 29% came from North America, 16% from South America, 41% from Asia Pacific, and 14% from Africa. From its total revenues, the incomes are mainly driven by the United States by 26% and Australia by 25%, followed by Indonesia in a 21%, Peru in a 14% and Ghana in a 12%. The United States revenue is expected to increase in a 2% in the next year due to the opening of operation of a new mine” (Newmont Mining Corporation Form 10-K).

Source: Newmont 2015 financial information
Gold generally is used for industrial fabrication and investment. Fabricated gold has a variety of end uses, including jewelry, electronics, dentistry, industrial and decorative uses, medals, medallions and official coins. Gold investors and banks buy gold bullion, official coins and jewelry. Central banks and jewelry buyers are the main drivers of gold, the 60% of the production is acquired for jewelry and 15% is bought by central banks and 17% by investors. Copper “Copper is the second driver of the company´s revenue. The copper production for 2015 was of 619 million pounds (365 million attributable pounds), 271 million pounds (191 million attributable pounds) in 2014 and 262 million pounds (179 million attributable pounds) in 2013. For 2015, 16% of Newmont sales were attributable to copper.
Although that in the last years the proportional production of copper has increased, Newmont has a clear strategy of turning into a pure gold producer. The current project pipeline and the mines going into production in the following years will reinforce this strategy, and the goal to 2020 is to receive 95% of the revenues from gold” (Newmont Mining Corporation Form 10-K)
With the following production split, we projected the company´s YoY revenue for the next 5
years.

Source: Newmont Investor´s presentation
STRATEGY
The strategy of Newmont, as presented in the leadership reports, is to provide shareholders with control to the volatile gold and copper prices by selling their production at spot market prices (a); they do not hedge gold and copper sales. Newmont strategy is in line with the rest of the larger players in the gold mining industry. Newmont has tried to lower its average cost of production as well as reduce its outstanding debt through the sale of non-core assets. In the last year the company has divested with the following highlights: - 4 mines sold to other companies, each of them had less than 6 years of mine life.
- Production lost from the divestments is around 500K ounces per year
- They were all high cost mines, 900 – 1300/oz.
- Each of those mines had higher technical and social risks
Additionally, we can outline the following highlights as part of their current strategy:
- Productivity improvements reduced AISC by 10% during 2015 compared to 2014. We are
projecting a slight decrease 0.4% of the AISC through 2020, due to the opening of two
mines and an expansion of an existing one and the implementation of newer
technology that will impact the average AISC. (b)
- Merian project in Suriname is progressing on time and below budget and will begin production
in 2016, with a total annual projected production between 400 and 500 K oz. and AISC
between $ 650 - $750/oz. (a,b)
- Operations reduced injury rates by 18%, the lower in the mining sector in 2015, however
overshadowed by the loss of two workers. Our expectation is for the injury rates to continue
to decrease based on a successful plan health and safety program called My Safety Journey

and Vital Behaviors. The cost of this casualties are minimal and negligible, we used the
same consideration for our valuation.
- Increased gold production regardless of the divestments, to 5.0 million ounces and copper to
166,000 tons. Based on the current projects on their pipeline, we are expecting the gold
production to increase for 2016 and 2017, followed by a decrease through 2020, with a
CAGR of +0.8% from 2016-2020. (a)
- NEM will also fund expansion in Long Canyon Nevada and at Tanami Australia, with an
expected impact on the production in 2017 of 500-600 oz/year in Long Canyon and
400,000-475,000 oz. per year at Tanami. (a)
- Increased EBITDA by 29% to $2.7 billion in 2015. After projecting the revenues and costs
the EBITDA will increases in the next 5 years by a 10% up to $3.02 billion. (C)
- $ 52 million in dividends were given to the shareholders during 2015, or $ 0.10 per share. We are projecting the dividend to increase to the $0.15 - $0.20 range per share based on:
o The current dividend policy of the company outlines a plan to pay dividends of nearly 1.1% of available cash.
o With our expected gold price in the following 5 years, we have projected the total revenue, available cash and surplus.
- Reduced net debt by 19 percent from 2014 to 2015; while continuing to invest in growth during
2015, $ 454 million were used to pay debt. According to our DCF analysis we are
projecting a total debt reduction of 15% for the following 5 years which represents 1.1
billion that must be paid in its majority by the end of 2018, given to credit due dates. (F)
- Energy price is one the major concerns for any mining company, we have estimated
Newmont an additional $40 million annually starting in 2017 through 2020 because of a
projected increase on oil and diesel price. (b)
- Decreasing mine supply and increasing demand from central banks and emerging market
consumers will remain as the main drivers in the gold mining industry.
Will deliver:
- Profitable production between 4.5 and 5 million ounces per year in the next 5 year term. (a)
- Add higher margin production with the incorporation of Merian, Long Canyon and expansion
at CC&V and Tanami (a)
- Expansion at Carlin and Ahafo mine. (a)
Exploration expenses were 156, 164 and 247 million in 2015, 2014 and 2013 respectively. Based
on the current projects been developed and the trend on new ore discoveries, we have projected
a CAPEX reduction of 42% through 2020, going from $1,401 million to $822 million. (e)
(a)(b) (c) (d) (e) see DCF valuation

Source: Bloomberg, Author´s Estimates
(e)
“The Company’s mining and exploration activities are subject to various domestic and
international laws and regulations governing the protection of the environment. The Company has
made and expects to make in the future expenditures to comply with such laws and regulations,
but cannot predict the full amount of such future expenditures. Estimated future reclamation costs
are based principally on legal and regulatory requirements” (Newmont Mining Corporation Form
10-K). Reclamation expense decreased in 2015 compared to 2014, primarily due to delay in
estimated spend to future periods at Yanacocha compared to previous estimates. Remediation
expense increased in 2015, primarily due to increased costs from revised estimates to the
remediation plan of the Midnite Mine in Washington State. At the end of 2015, $1,553 was accrued
for reclamation costs relating to current or recently producing properties. $ 318 million was
accrued for obligations associated with properties previously owned or operated by us or our
subsidiaries. We are projecting an annually, the expense has remained steady in $65 - $75,
we are projecting for these payments to remain stable in the next five years. (e)
Newmont mining and exploration activities are subject to various federal and state laws and regulations governing the protection of the environment. We expect expenditures to comply with such laws and regulations, but cannot predict the full amount of such future expenditures. At December 31, 2015 and 2014, $1,553 and $1,497, respectively, were accrued for reclamation costs relating to currently or recently producing or development stage mineral properties, of which $37 and $42, respectively, were classified as current liabilities. (f)
The changes on both remediation and reclamation are minimal and therefore we project
no major changes for the following years on this expense.
During 2015, Newmont purchased the CC&V gold mining business in Colorado from AngloGold Ashanti Limited for $819 ($821 consideration, net of $2 cash acquired) and purchased $4 in mineral interests. During 2014, purchased the remaining 20% non-controlling interest in the Merian Project. Subsequent to this purchase, Newmont sold a 25% non-controlling interest in the Merian Project to the government of Suriname which was reported as financing activities. This was considered when projecting the revenue of the Merian project.

As the rest of the main gold mining companies, they examine opportunities to make selective
acquisitions to create synergies, Barrick and Newmont held meetings to discuss a possible
merger but it was dismissed by both parties at the beginning of 2015. These two companies have
joint ventures, which responds to their risk reduction strategy. We are not projecting any
merging or acquisition at least in the following 5 years.
Political risks
“Newmont has a substantial investment in Batu Hijau in Indonesia, a nation that since 1997 has undergone periods of financial crises and currency devaluation, outbreaks of political and religious violence and acts of terrorism, changes in national leadership, devolution of authority to regional governments, and the secession of East Timor, one of its former provinces” (Newmont Mining Corporation Form 10-K). Although this represents a noticeable concern for the company, we must remark that the mine is in a stage of reduction on its production already, we project the mine to reduce its production by almost 30% in 2017. (a)
Cost reduction
Productivity improvements reduced AISC by 10% during 2015 compared to 2014. We are
projecting a slight decrease of 0.4% through 2020. (b)
When calculating AISC projections, we considered the current and the future mines costs. The
following table outlines the status of each mine and the calculated AISC for the current projects.
Source: Newmont financial information
We weighted our AISC calculations by taking using the projected annual production during the
first years of the early stages of the following mines:
MINE COUNTRY SHARES RESERVE PROVEN GOLD 2015 AISC 2015 STATUS
Ahafo Ghana 100.00% 1,990,000 332,000 892 Operation
Akyem Ghana 100.00% 1,400,000 473,000 572 Operation
Batu Hijau Indonesia 48.50% 1,780,000 625,000 618 Operation
Boddington Australia 100.00% 2,460,000 816,000 799 Operation
Kalgoorlie Australia 50.00% 2,150,000 318,000 965 Operation
Tanami Australia 100.00% 1,000,000 434,000 724 Operation
Carlin USA 100.00% 9,660,000 886,000 1,134 Operation
Phoenix USA 100.00% 460,000 199,000 980 Operation
Twin Creeks USA 100.00% 3,570,000 473,000 653 Operation
Cripple Creek & Victor USA 100.00% 1,290,000 82,000 683 Operation
Yanacocha Peru 51.35% 1,060,000 924,000 880 Operation
Merian Suriname 75.00% - - Project
Waihi New Zeland 100.00% 116,000 1,543 Sold
Long Canyon USA 100.00% Project
Conga Peru 51.35% Project
TOTAL 26,820,000 5,678,000 898
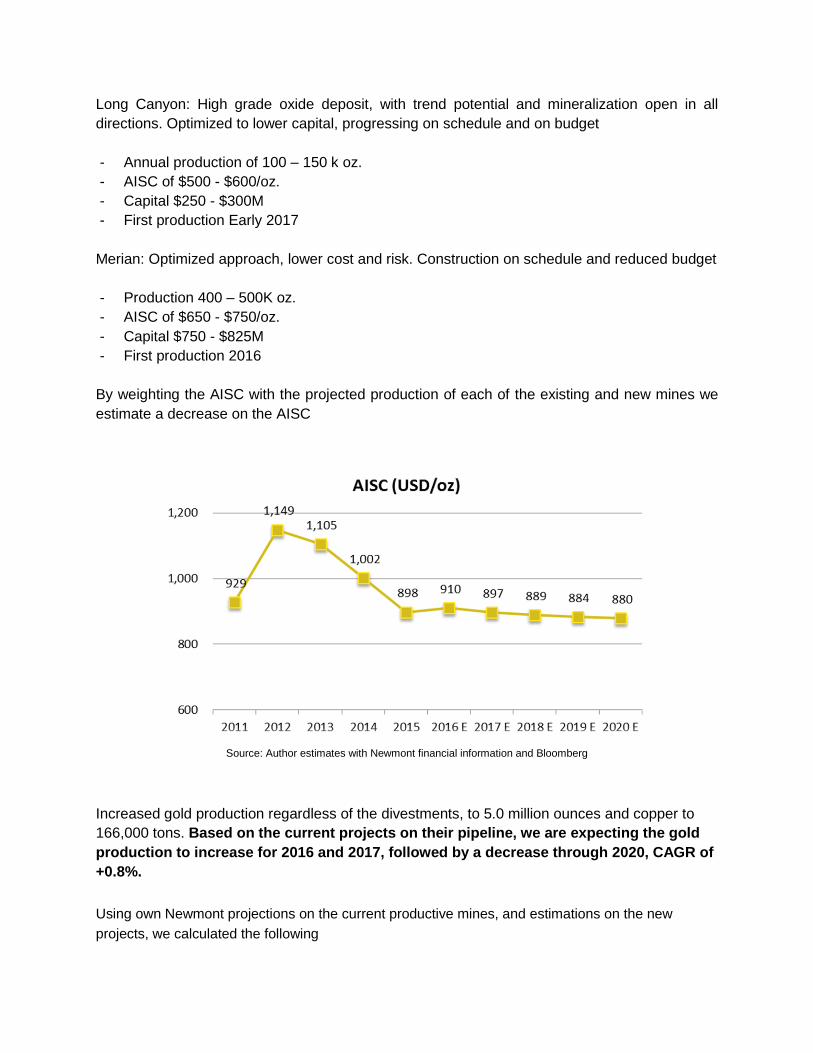
Long Canyon: High grade oxide deposit, with trend potential and mineralization open in all
directions. Optimized to lower capital, progressing on schedule and on budget
- Annual production of 100 – 150 k oz.
- AISC of $500 - $600/oz.
- Capital $250 - $300M
- First production Early 2017
Merian: Optimized approach, lower cost and risk. Construction on schedule and reduced budget
- Production 400 – 500K oz.
- AISC of $650 - $750/oz.
- Capital $750 - $825M
- First production 2016
By weighting the AISC with the projected production of each of the existing and new mines we
estimate a decrease on the AISC
Source: Author estimates with Newmont financial information and Bloomberg
Increased gold production regardless of the divestments, to 5.0 million ounces and copper to
166,000 tons. Based on the current projects on their pipeline, we are expecting the gold
production to increase for 2016 and 2017, followed by a decrease through 2020, CAGR of
+0.8%.
Using own Newmont projections on the current productive mines, and estimations on the new
projects, we calculated the following

Source: Author estimates with Newmont financial information and Bloomberg
NEM will also fund expansion in Long Canyon Nevada and at Tanami Australia, with this last mine
been key, with an expected impact on the production in 2017.
Source: Author estimates with Newmont financial information and Bloomberg
The Company expects to continue to repay project debt and pay down other corporate debt in
2016, targeting the highest rates and 2018 maturities first. According to our DCF analysis we
are projecting a total debt reduction of 15% for the following 5 years which represents 1.1
billion that must be paid in its majority by the end of 2018, given to credit due dates.
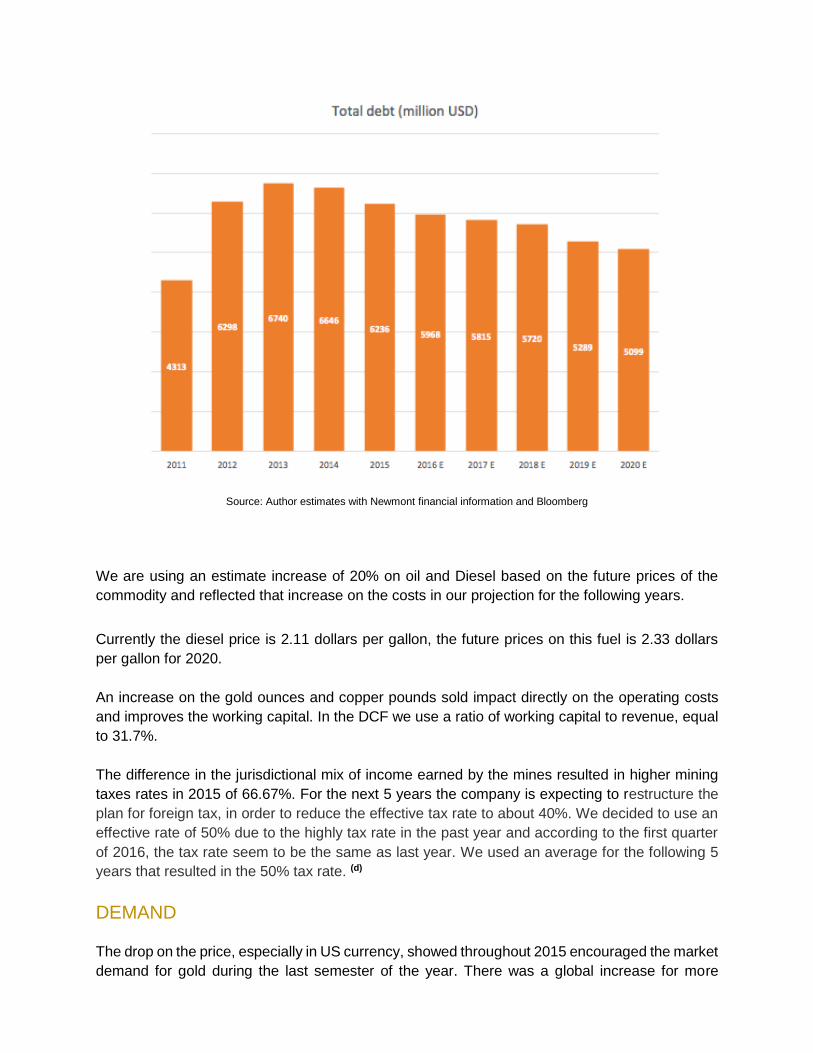
Source: Author estimates with Newmont financial information and Bloomberg
We are using an estimate increase of 20% on oil and Diesel based on the future prices of the
commodity and reflected that increase on the costs in our projection for the following years.
Currently the diesel price is 2.11 dollars per gallon, the future prices on this fuel is 2.33 dollars
per gallon for 2020.
An increase on the gold ounces and copper pounds sold impact directly on the operating costs
and improves the working capital. In the DCF we use a ratio of working capital to revenue, equal
to 31.7%.
The difference in the jurisdictional mix of income earned by the mines resulted in higher mining
taxes rates in 2015 of 66.67%. For the next 5 years the company is expecting to restructure the
plan for foreign tax, in order to reduce the effective tax rate to about 40%. We decided to use an
effective rate of 50% due to the highly tax rate in the past year and according to the first quarter
of 2016, the tax rate seem to be the same as last year. We used an average for the following 5
years that resulted in the 50% tax rate. (d)
DEMAND The drop on the price, especially in US currency, showed throughout 2015 encouraged the market
demand for gold during the last semester of the year. There was a global increase for more

affordable gold jewelry, bars and coins. Demand on Q4 2015 did not match the demand observed
during Q3 2015 but it was still certainly strong and marginally weaker by 1% than the demand on
2014. Jewelry demand was weaker among most of the markets, but Indian festivities helped to
leverage the overall result. For the following 5 years we are expecting the jewelry demand on
India to remain stable in a yearly basis, we are projecting a marginal grow of 0.5% to 1%,
(Parameter J).
Demand was highly boosted by major emerging markets, primarily India and China. Total Indian
demand for jewelry, bars and coins grew 6% during 2015 Q4 against same period of time in 2014.
Since Q4 is traditionally a very strong quarter given the festival and wedding season in this
country, the demand reached 654.3 tons, meaning a 5% rise. After our industry analysis we found
no reason to think that this trend will change within the following 5 years, we still expect to India
and China to drive global demand, (Parameter J).
Demand for gold jewelry in Europe showed consistent results, with rises held in the UK and Spain,
1% and 6% respectively, demand in France fell by 5%, Germany 2% and Italy by 3%, (Parameter
J).
The jewelry industry is a reflection of the overall slowdown of the economy and lack of trust in a prompt recovery. Therefore, given the estimation by the World Bank1 of a global GDP growth of 2.5% for the following 5 years, we expect the jewelry demand to remain stable in the mid-term.
Demand for gold by central banks intensified in the second half of 2015 and it is expected to grow
2% in 2016 due to the economic and political risks, which remain high (plunging oil prices, political
unrest in the Middle East and China's economic slowdown).
With this scenario, financial institutions continued to recognize the need for diversification of their
reserve asset portfolios. The 2% increase for 2016 is not expected to continue throughout the
following years, we expect a zero to marginal increase through 2020, (Parameter Net Investors).
The People's Bank of China, now the world’s biggest gold buyer, increased its gold reserves by
over 600,000 troy ounces to 56.66 million fine troy ounces by the end of December. China has
been selling foreign reserves and buying gold in order to make their currency more tradable. The
forecast for 2016 is to continue purchasing gold in a much similar amount as 2015, 17.9 tons per
month which total 215 tons by the end of the year2. China’s projected to buy 5% more gold for
jewelry, 15% for coins and 18% for bar investment in 20163. (Parameter Net Investors).
Even though the big picture for consumer demand is relatively positive, individual market, such
as Turkey, Russia and the Middle East are struggling. The economic and socio-political troubles
affecting these countries have an effect on gold demand also in the foreseeable future. Political
scene will likely continue to be problematic in those countries, there are no signs that Russia will
have a turn on his political views, therefore moderate isolation will continue to weakening of
Russian ruble and with moderate economic affectation to its economy. Scenario for the Middle
East will continue to remain unstable and the low oil prices will continue to affect the economy for
this region.
1 Global Economic Prospect: Spillovers amid Weak Growth. World Bank. 2 World Gold Council gold demand trend report. 3 Credit Sussie, Investment look 2016

Demand in the US market grew 3%, partially promoted from the drop in the gold price during Q3
2015. Jewelry consumers were helped by lower fuel prices and a strong employment rate; while
improvement in economic indicators provided support, no major changes are visible for 2016
therefore the demand in the US will remain steady with little to none increases in the next 5 years.
Global investment demand increased 8% especially in the form of gold-backed ETFs, due to the
growing conviction that gold could offer relief in an environment of growing uncertainty, such as:
Financial market volatility, due to political unrest, divergent monetary policy measures and China's faltering economic progress.
Geopolitical uncertainty, particularly with terrorist attacks in Europe and the Middle East.
Lack of optimism in the US economic momentum (Parameter Net Investors)
SUPPLY A combination of mine production, recycling and draw-down of existing gold stocks held by governments, financial institutions, industrial organizations and private individuals make up the annual gold supply. Based on public information available, for the years 2013 through 2015, mine production has averaged over 70% of the annual gold supply. For 2015, 2014 and 2013, 84%, 90% and 91%, respectively, of Newmont sales were attributable to gold.
The total gold supply in 2015 decreased by 4% to 4,258.3 tons, its lowest level since 2009, as
mine production contracted as well as recycling. Mine production fell 2% during Q4, from 841.2t
to 824.8t, first quarter decline since 2008. Annual production in 2016 is projected to increase by
just 1%. For the following 5 years, we expect the total mining supply to continuously decrease.
Mining companies recently focus cost-cutting and this explains much of this lower output.
Reduced exploration budgets and project development has led to lower production from existing
mines as well as a reduced project pipeline. This, combined with longstanding issues such as
lower ore grades in average, means constrained mines supply seems likely. It’s clear that the
mining industry faces a number of challenges in the future; gold production will likely see declines
over the coming years.
For Newmont, we are expecting the market share to increase for the following 5 years. The last
4 years production share increased from 17% to over 18.4% in 2015. We are expecting the gold
production of Newmont to overall be stable, with slight increase during 2016 and 2017 due to the
Merian and Long Canyon project coming into production. This will permit Newmont to increase its
current production share, and reaching according to our projecting a top of 21.9% by 2020.
The following table illustrates the contribution from Newmont to the global gold mine production
and our estimates based on the projects that will start production in the following years, we have
considered only those with proved reserves.

Source: Author estimates with Newmont financial information and Bloomberg
We are also estimating, based on the estimated price of gold, and the future prices of copper, that
the revenue from gold will increase its participation on the total revenue of the company. This is
also part of the strategy of Newmont, since gold provides a higher margin product.
VALUATION
Knowing that the main driver of future revenue will be the price of the mined commodities, it is
crucial what expected price we use for each of these products. By looking at the financial results
and the current projects production estimates, we predict that although during 2015 up to 16% of
the total revenue came from copper, by 2020 it will only represent the 5%. This is projected from
the current projects and the strategy of the company.
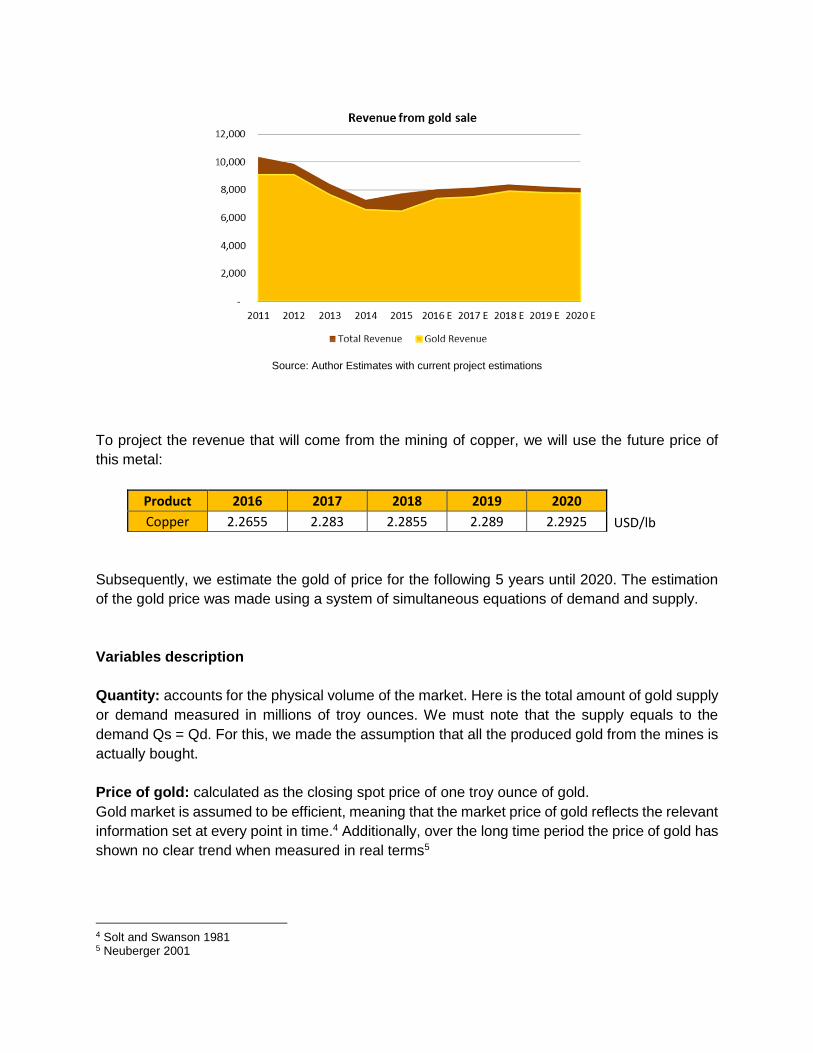
Source: Author Estimates with current project estimations
To project the revenue that will come from the mining of copper, we will use the future price of
this metal:
Product 2016 2017 2018 2019 2020
Copper 2.2655 2.283 2.2855 2.289 2.2925 USD/lb
Subsequently, we estimate the gold of price for the following 5 years until 2020. The estimation
of the gold price was made using a system of simultaneous equations of demand and supply.
Variables description
Quantity: accounts for the physical volume of the market. Here is the total amount of gold supply
or demand measured in millions of troy ounces. We must note that the supply equals to the
demand Qs = Qd. For this, we made the assumption that all the produced gold from the mines is
actually bought.
Price of gold: calculated as the closing spot price of one troy ounce of gold.
Gold market is assumed to be efficient, meaning that the market price of gold reflects the relevant
information set at every point in time.4 Additionally, over the long time period the price of gold has
shown no clear trend when measured in real terms5
4 Solt and Swanson 1981 5 Neuberger 2001

Net Investors position (I): we calculate as the total amount of golden bars, medals or medallions
sold to private investors during a year, plus the transactions made by central banks or the IMF.
Unlike bonds or equities or even currencies, gold does not carry the risk of becoming worthless
through the default of the issuer. Currently, gold serves as a preferred portfolio diversification
instrument as a result, there is a lack of correlation with the mainstream investment solutions.
Trade Weighted US Dollar Index (TWEXB): it is an index that measures the US Dollar value
relative to other world currencies. Broad currency index includes the Euro Area, Canada, Japan,
Mexico, China, UK, Taiwan, Korea, Singapore, Hong Kong, Malaysia, Brazil, Switzerland,
Thailand, Philippines, Australia, Indonesia, India, Israel, Saudi Arabia, Russia, Sweden,
Argentina, Venezuela, Chile and Colombia.
Profit or Mines Profit (R): defined as the difference between the price of bullion and the average
cash operating costs of production in the industry.
Jewelry (J): We use the volume of the jewelry market as another exogenous variable on the
model. Jewelry accounts for the largest share of around 70% of total gold demand.
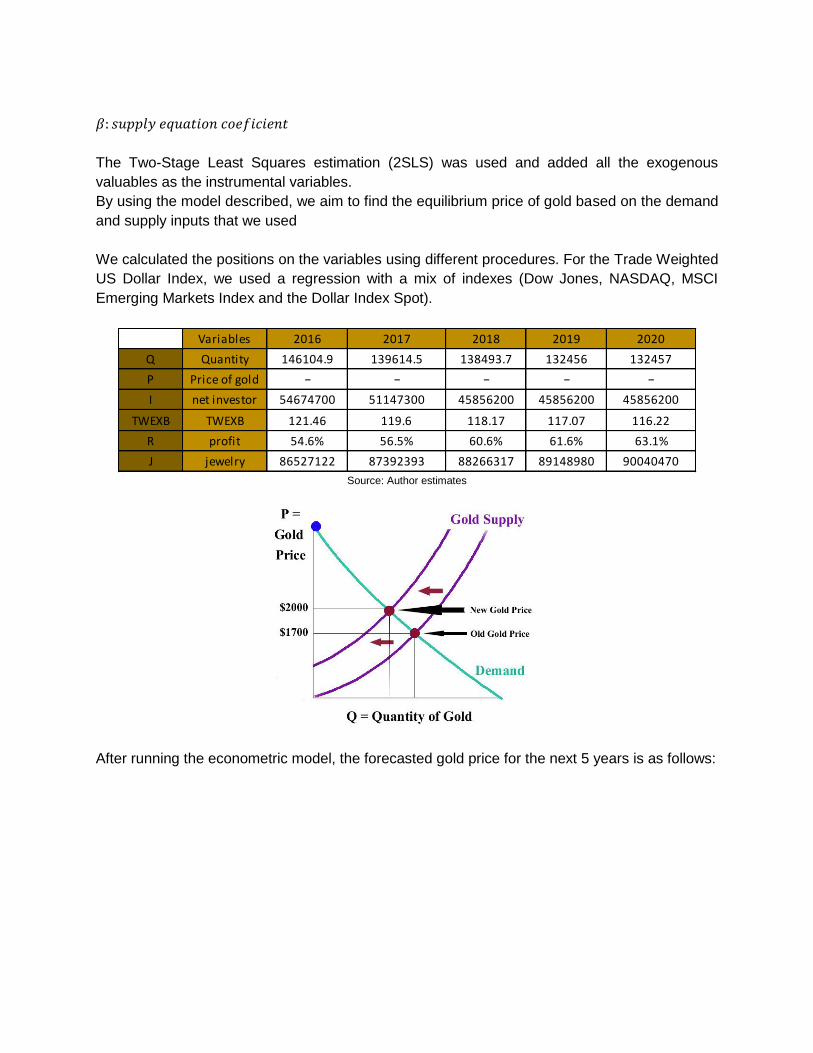
Here are the values of the parameters used for each of the previous variables:
Basic Model Specification
We defined the supply-demand model as the jointly determined variables:
𝑄𝑑 = 𝛼0 + 𝛼1𝑃𝑡 + 𝛼2𝐼𝑡 + 𝛼3𝐽𝑡 (Demand)
𝑄𝑠 = 𝛽0 + 𝛽1𝑃𝑡 + 𝛽2𝑅𝑡 + 𝛽3𝑇𝑊𝐸𝑋𝐵𝑡 (Supply)
The subscript t on each variable stands for the time for the variable sample
𝛼: 𝑑𝑒𝑚𝑎𝑛𝑑 𝑒𝑞𝑢𝑎𝑡𝑖𝑜𝑛 𝑐𝑜𝑒𝑓𝑖𝑐𝑖𝑒𝑛𝑡
Observation_date Net Investors Price Q Profit TWEXB Jewelry consumption
01/01/05 28360296 479.72 121536881.55 0.57 110.8105 95493772.8
01/01/06 32624923 571.05 111080395.15 0.70 108.7339 80594035.2
01/01/07 32346258 757.07 116253784.03 0.70 103.6474 84826915.2
01/01/08 63069912 815.73 110966868.03 0.58 99.8696 77133655.8
01/01/09 62008165 1018.81 139480474.75 0.62 105.6312 61634260.2
01/01/10 82371845 1266.42 143132722.20 0.67 101.8424 76445812.8
01/01/11 79426466 1440.14 144634705.77 0.63 97.1229 77041943.4
01/01/12 74505743 1634.79 144531233.93 0.60 99.8568 77719204.2
01/01/13 40279381 1358.37 138440229.75 0.39 100.9613 95518464.6
01/01/14 49358908 1267.20 135154877.87 0.39 104.1358 87507739.2
01/01/15 51736376 1129.17 137254999.00 0.34 117.2909 85183182.6
𝛽: 𝑠𝑢𝑝𝑝𝑙𝑦 𝑒𝑞𝑢𝑎𝑡𝑖𝑜𝑛 𝑐𝑜𝑒𝑓𝑖𝑐𝑖𝑒𝑛𝑡
The Two-Stage Least Squares estimation (2SLS) was used and added all the exogenous
valuables as the instrumental variables.
By using the model described, we aim to find the equilibrium price of gold based on the demand
and supply inputs that we used
We calculated the positions on the variables using different procedures. For the Trade Weighted
US Dollar Index, we used a regression with a mix of indexes (Dow Jones, NASDAQ, MSCI
Emerging Markets Index and the Dollar Index Spot).
Source: Author estimates
After running the econometric model, the forecasted gold price for the next 5 years is as follows:
Variables 2016 2017 2018 2019 2020
Q Quantity 146104.9 139614.5 138493.7 132456 132457
P Price of gold − − − − −
I net investor 54674700 51147300 45856200 45856200 45856200
TWEXB TWEXB 121.46 119.6 118.17 117.07 116.22
R profit 54.6% 56.5% 60.6% 61.6% 63.1%
J jewelry 86527122 87392393 88266317 89148980 90040470

Source: Author estimates
For the valuation process, we decided to use Adjusted Present Value, based on the fact that the
capital structure will change according to our estimation of debt reduction in the following 5 years.
Value of Levered Firm =
The first step to estimate the APV is to estimate the unlevered firm value, for this we need to
compute the unlevered beta.
Then, using the risk free rate of 2% and the risk premium of 7.5% we estimate an unlevered
cost of equity:
Unlevered cost of equity
5.168%
Using the free cash flow to the firm we estimate the unlevered firm value:
Value of Unlevered Firm =
Unlevered firm value
11881.83
Then, we use the tax benefits from debt, using the tax rate of 50% that we are projecting will be
applicable to Newmont:
Year Price
2011 1,565
2012 1,675
2013 1,202
2014 1,184
2015 1,129
2016 E 1,260
2017 E 1,262
2018 E 1,337
2019 E 1,319
2020 E 1,316
Unlevered Beta
Newmont 0.43
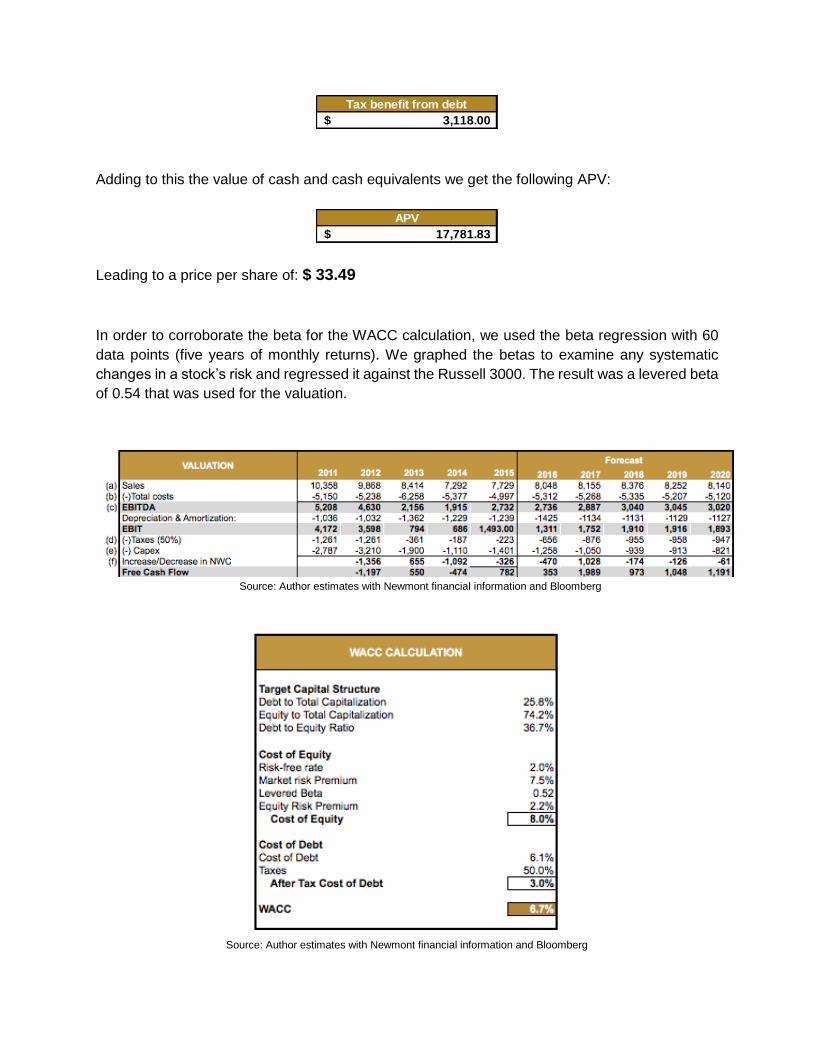
Adding to this the value of cash and cash equivalents we get the following APV:
Leading to a price per share of: $ 33.49
In order to corroborate the beta for the WACC calculation, we used the beta regression with 60
data points (five years of monthly returns). We graphed the betas to examine any systematic
changes in a stock’s risk and regressed it against the Russell 3000. The result was a levered beta
of 0.54 that was used for the valuation.
Source: Author estimates with Newmont financial information and Bloomberg
Source: Author estimates with Newmont financial information and Bloomberg
Tax benefit from debt
3,118.00$
APV
17,781.83$

Source: Author estimates
APPENDIX
Source: Credit Suisse, Bloomberg, World Gold Council, Thomson Reuters

Important Disclaimer
Please read this document before reading this report.
This report has been written by MBA students at Yale's School of Management in
partial fulfillment of their course requirements. The report is a student and not a
professional report. It is intended solely to serve as an example of student work at
Yale’s School of Management. It is not intended as investment advice. It is based on publicly available information and may not be complete analyses of all relevant data.
If you use this report for any purpose, you do so at your own risk. YALE
UNIVERSITY, YALE SCHOOL OF MANAGEMENT, AND YALE
UNIVERSITY’S OFFICERS, FELLOWS, FACULTY, STAFF, AND
STUDENTS MAKE NO REPRESENTATIONS OR WARRANTIES, EXPRESS
OR IMPLIED, ABOUT THE ACCURACY OR SUITABILITY FOR ANY USE
OF THESE REPORTS, AND EXPRESSLY DISCLAIM RESPONSIBIITY FOR
ANY LOSS OR DAMAGE, DIRECT OR INDIRECT, CAUSED BY USE OF OR
RELIANCE ON THESE REPORTS.