airasia&x&berhad& · pdf file4q13&vs&4q12...
TRANSCRIPT

AirAsia X Berhad Fourth Quarter and Full Year 2013 Results

Informa(on contained in our presenta(on is intended solely for your reference. Such informa(on is subject to change without no(ce, its accuracy is not guaranteed and it may not contain all material informa(on concerning the Company. Neither we nor our advisors make any representa(on regarding, and assumes no responsibility or liability for, the accuracy or completeness of, any errors or omissions in, any informa(on contained herein. In addi(on, the informa(on may contain projec(ons and forward-‐looking statements that reflect the company’s current views with respect to future events and financial performance. These views are based on current assump(ons which are subject to various risk factors and which may change over (me. No assurance can be given that future events will occur, that projec(ons will be achieved, or that the company’s assump(ons are correct. Actual results may differ materially from those projected. This presenta(on is strictly not to be distributed without the explicit consent of the Company’s management under any circumstances.
Disclaimer
2

Table of Contents
3
FY2013 Key OperaDng & Financial Highlights
4Q2013 Key OperaDng & Financial Highlights
Network Strategy and Capacity Expansion
2014 Strategic PrioriDes

FY2013 Key OperaDng & Financial Highlights

FY2013 – Key OperaDng Highlights 12-‐month ended 31 December 2013
ASK (mil)
+19.0%YoY
NETWORK CONSOLIDATION
AVERAGE WEEKLY FREQUENCY NUMBER OF ROUTES
12
18
2012 2013
+50.0%YoY
5.8
7.8
2012 2013
+34.5%YoY
5
16,231
19,309
2012 2013
83.8%
82.1%
13,601 15,857 RPK
Load Factor

6
FY2013 – Key Financial Highlights 12-‐month ended 31 December 2013
1,967
2,307
2012 2013
+17.3%YoY
REVENUE (RM mil)
12.00 12.05
2012 2013
RASK (sen)
+0.4%YoY 142.4 144.7
2012 2013
ANCILLARY REVENUE PER PAX (RM)
+1.6%YoY
TOPLINE GROWTH

FY2013 – Key Financial Highlights 12-‐month ended 31 December 2013
15.7% 15.7%
2012 2013
Unchanged
2.5% 1.5%
2012 2013
-‐0.9 ppt YoY
-‐0.3% -‐1.6%
2012 2013
-‐1.3 ppt YoY
EBITDAR MARGIN OPERATING PROFIT MARGIN NET OPERATING LOSS MARGIN
7
MARGINS

8
FY2013 – Segment Profitability 12-‐month ended 31 December 2013
756 878
333
903
1147
257
Australia North Asia Others
2012 2013
REVENUE (RM mil)
18.1% 16.6%
7.7% 11.3%
16.6%
26.8%
Australia North Asia Others
2012 2013
EBITDAR MARGIN
6,184 7,369
2,678
8,281 9,687
1,341
Australia North Asia Others
ASK (mil)
12.26 11.94 12.51 11.01 11.96
19.25
Australia North Asia Others
+53.8%YoY
RASK (sen)
+19.4%YoY
+30.7%YoY
-‐22.9%YoY
-‐6.8 ppt YoY Unchanged
+19.1 ppt YoY
+33.9%YoY +31.5%YoY
-‐49.9%YoY
-‐10.2%YoY +0.1%YoY
Others includes the discon/nued routes-‐ India, New Zealand, and Europe in FY2012.

CASK (RM sen)
9
0.39
0.59
1.32
1.21
1.09
1.69
5.69
0.34
0.54
1.25
1.11
1.02
1.60
5.70
Others
Sales & MarkeDng
OperaDons
Manpower
Maintainance & Overhaul
Aircrae DepreciaDon & Lease
Aircrae Fuel
2012 2013
FY2013 – OperaDng Expenditure 12-‐month ended 31 December 2013
Unchanged
+5%YoY
+7%YoY
+9%YoY
+5%YoY
+10%YoY
+16%YoY
Opera/ons: User Charges and Sta/ons, Inflight, Ramp and Other Opera/ng Expenses Others: Insurance, Fees, Admin and Other Expenses
Total CASK FY12: 11.56sen Total CASK FY13: 11.98sen
+3.6%YoY
§ Currency movement § Charters/Leases
§ Currency movement § Charters/Leases
§ One-‐month IPO bonus § Crew for charters/leases § In-‐sourced Ramp
§ IPO Charges
§ Charter/Lease opera(ons
§ A&P Spend on new routes

4Q13 Key OperaDng & Financial Highlights

ASK (mil)
4,034
6,012
4Q2012 4Q2013
NETWORK CONSOLIDATION
AVERAGE WEEKLY FREQUENCY NUMBER OF ROUTES
4Q13 – Key OperaDng Highlights 3-‐month ended 31 December 2013
+49.0%YoY
12
18
4Q2012 4Q2013
+50.0%YoY
5.8
7.8
4Q2012 4Q2013
+34.5%YoY
11
83.0%
80.9%
3,349 4,862 RPK
Load Factor

12
539
680
4Q2012 4Q2013
REVENUE (RM mil)
13.37
11.34
4Q2012 4Q2013
RASK (sen)
166.4
143.3
4Q2012 4Q2013
ANCILLARY REVENUE PER PAX (RM)
TOPLINE GROWTH
4Q13 – Key Financial Highlights 3-‐month ended 31 December 2013
+26.1%YoY -‐15.2%YoY -‐13.9%YoY

13
4Q13 – Key Financial Highlights 3-‐month ended 31 December 2013
19.6%
10.7%
4Q2012 4Q2013
-‐8.9 ppt YoY
7.4%
-‐5.2%
4Q2012 4Q2013
-‐12.6 ppt YoY 4.4%
-‐8.5%
4Q2012 4Q2013
-‐12.9 ppt YoY
EBITDAR MARGIN OPERATING LOSS MARGIN NET OPERATING LOSS MARGIN
MARGINS
14
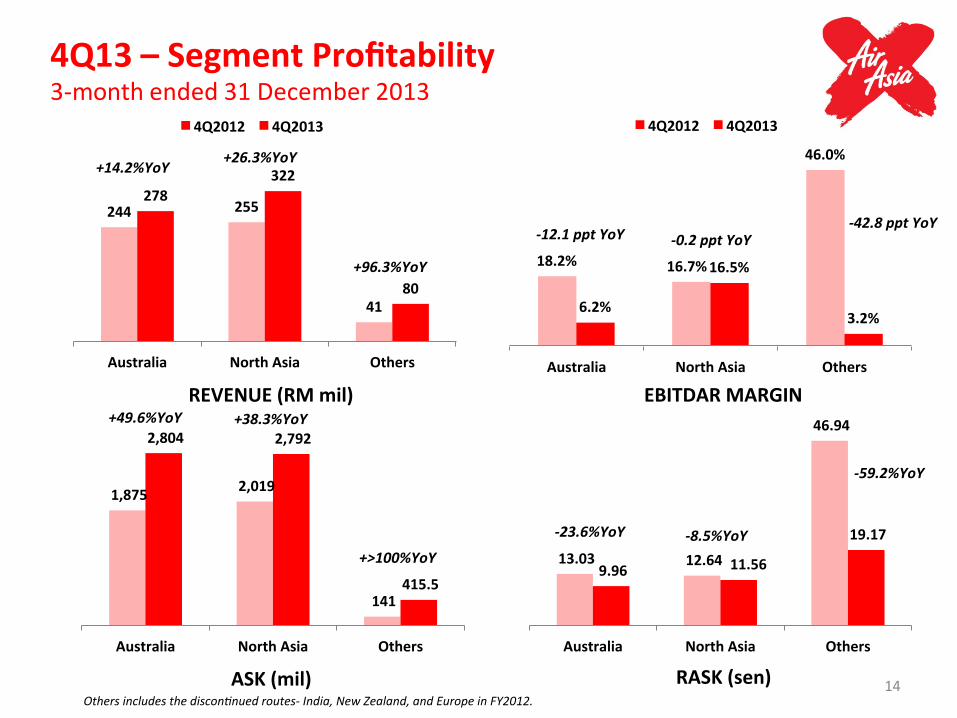
4Q13 – Segment Profitability 3-‐month ended 31 December 2013
244 255
41
278 322
80
Australia North Asia Others
4Q2012 4Q2013
REVENUE (RM mil)
18.2% 16.7%
46.0%
6.2%
16.5%
3.2%
Australia North Asia Others
4Q2012 4Q2013
EBITDAR MARGIN
1,875 2,019
141
2,804 2,792
415.5
Australia North Asia Others
ASK (mil)
13.03 12.64
46.94
9.96 11.56
19.17
Australia North Asia Others
-‐59.2%YoY
RASK (sen)
+14.2%YoY +26.3%YoY
+96.3%YoY
-‐12.1 ppt YoY -‐0.2 ppt YoY -‐42.8 ppt YoY
+49.6%YoY +38.3%YoY
+>100%YoY
-‐23.6%YoY -‐8.5%YoY
Others includes the discon/nued routes-‐ India, New Zealand, and Europe in FY2012.

CASK (RM sen)
15
0.37
0.69
0.89
1.22
1.28
1.80
5.81
0.62
0.80
1.53
1.20
0.84
1.63
5.67
Others
Sales & MarkeDng
OperaDons
Manpower
Maintainance & Overhaul
Aircrae DepreciaDon & Lease
Aircrae Fuel
4Q12 4Q13
+2%YoY
+11%YoY
+53%YoY
+2%YoY
-‐42%YoY
-‐14%YoY
-‐40%YoY
Opera/ons: User Charges and Sta/ons, Inflight, Ramp and Other Opera/ng Expenses Others: Insurance, Fees, Admin and Other Expenses
4Q13 – OperaDng Expenditure 3-‐month ended 31 December 2013
Total CASK FY12: 12.29sen Total CASK FY13: 12.06sen -‐1.8%YoY

Network Strategy and Capacity Expansion

• Intra Asia-‐Pacific Medium-‐Haul market opportunity sized at 84-‐94 aircrae over 5 years -‐ Top-‐Down sizing based on LCC penetra(on from Msia, Thai, Indo -‐ Bo\om-‐Up sizing based on 83 iden(fied priority routes -‐ Further opportunity for North Asia-‐Australia market where our current share is
only 10% of one-‐stop market -‐ Medium-‐term opportunity to connect South Asia, Central Asia, Eastern Europe,
and Middle East/Africa
• Achieve market leadership with largest fleet/network -‐ Largest LCC brand with most seat capacity and routes in key markets -‐ Individual routes where we are market leaders or strong followers -‐ Use mul(ple-‐hubs to serve each des(na(on with more route-‐pairs
• Gain and Maintain First Mover Advantage -‐ Scoot, Jetstar, Cebu Pacific and LionAir have announced new Wide-‐body orders,
and are similarly star(ng to emulate our mul(-‐hub model
Summary of Strategy

18
Network Strategy: Staying The Course
• ‘North-‐South’ Axis connecDng Southeast Asia with North Asia and Australia
Deepen Frequency
Unique Routes
2013 Focus 2014 Focus 2x Daily: SYD, MEL, PER, TPE 1x Daily: KIX, CTU, HGH, OOL, PEK, PVG, KTM
2x Daily: Seoul and Tokyo 1x Daily: Adelaide
Busan Nagoya, Xian, Chongqing
• Increase Fly-‐Thru ConnecDvity 25% Fly-‐Thru, 18% Self-‐Connect 292 Fly-‐Thru Route-‐Pairs 4614 Fly-‐Thru Weekly Freq
35% Fly-‐Thru, 15% Self-‐Connect 344 Fly-‐Thru Route Pairs 5883 Fly-‐Thru Weekly Freq
• Increase Share of ‘North Asia – Australia’ One-‐Stop market from 10% share in 2013 to 20% share in 2014
19
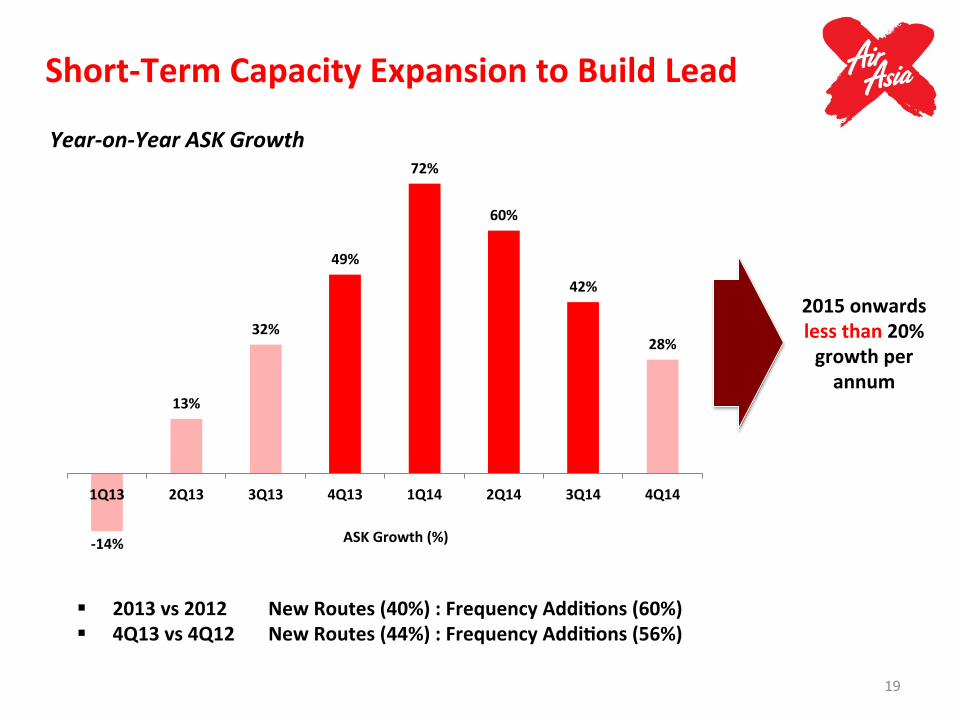
Short-‐Term Capacity Expansion to Build Lead
-‐14%
13%
32%
49%
72%
60%
42%
28%
1Q13 2Q13 3Q13 4Q13 1Q14 2Q14 3Q14 4Q14
ASK Growth (%)
§ 2013 vs 2012 New Routes (40%) : Frequency AddiDons (60%) § 4Q13 vs 4Q12 New Routes (44%) : Frequency AddiDons (56%)
2015 onwards less than 20% growth per annum
Year-‐on-‐Year ASK Growth
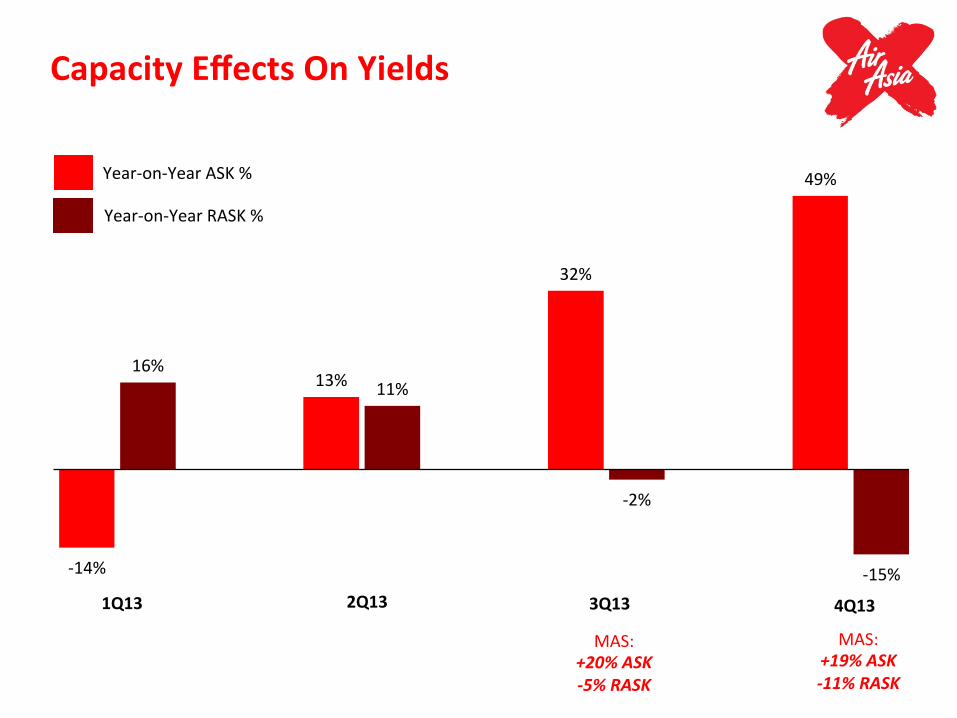
-‐14%
16% 13% 11%
32%
-‐2%
49%
-‐15% 1Q13 2Q13 3Q13 4Q13
Year-‐on-‐Year ASK %
Year-‐on-‐Year RASK %
MAS: +19% ASK -‐11% RASK
MAS: +20% ASK -‐5% RASK
Capacity Effects On Yields

We Added Capacity Others Added Capacity
ASK RASK
We Added Capacity Others Did Not
No Capacity AddiDons
ASK RASK ASK RASK
New Routes
22%
-‐8%
0% +10%
ASK RASK
30%
N.A N.A
-‐22%
53% 20% 12% 15%
100% = 6,012 million ASKs
Q413 Capacity Effect on Yield
41%

22
Currency Impact
The unexpected weakening of MYR in 4Q13, which depreciated 5%YoY against USD in 4Q12, has translated 4Q13 to a Loss Before Tax of RM170.4m, primarily due to: § Foreign Exchange Loss On Borrowings: - Foreign exchange losses of (RM112.4m) vs foreign exchange gain of RM1.2m on USD-‐denominated borrowings in 4Q12.
§ Higher OperaDng Expenses (approx. 65% exposure to USD, 5% forex movement): - Aircran fuel expenses (51%) - Aircran leases (10%) - Maintenance and Overhaul (4%)

2014 Strategic PrioriDes

24
Four Top PrioriDes for 2014
Target 1. Increase DistribuDon
a. Fly-‐Thru on Mobile (launched 24 Feb) b. Fly-‐Thru on GDS plaqorms c. Full Network on OTAs and Metasearch plaqorms d. Origin-‐Des(na(on Fly-‐Thru Pricing
2. Increase Ancillary Income Per Passenger a. Fly-‐Thru fees b. Duty Free and Wifi (2nd Half 2014) c. BIG Loyalty d. Op(onTown Flexibility
3. Aggressively Drive Down Cost a. Manpower produc(vity through workload merger with AirAsia b. Less Sales & Marke(ng with less new routes and denser
frequencies
4. Manage Cashflow
12% Third Party +2% LF pts
35% Fly-‐Thru pax
+RM7-‐9 per pax
7% reducDon in CASK ex-‐Fuel in
US cents

25
Hub Progress
Sep13 Oct13 Nov13 Dec13 Jan14 Feb14 Mar14
TAAX JV Agreement
TAAX Obtained
AOL
TAAX Obtained
AOC
Target Opening of Bangkok Hub
IAAX JV Agreement
IAAX Obtained
ASL
Target Opening of Bali Hub
InformaDon On Hubs:
ü Start-‐up aircrans for TAAX: 2 A330s ü Start-‐up routes for TAAX: Japan and Korea ü Start-‐up aircrans for IAAX: 2 A330s ü Start-‐up routes for IAAX: Australia + North Asia

7
5
3
1
3
4
7
7
4
2
2
1
1
2013 2014 2015 2016 2017 2018 2019
A330-‐300 ExisDng A330-‐300 Previous Order A330-‐300 New Order A340-‐300 ExisDng A330-‐200 ExisDng
38
+37%
+19%
+23%
+21%
+15% +8%
19
26
31
46
53 57
Young Fleet Age of less than 5 years old
26
Fleet Size and Delivery Schedule

255 0 0
192 0 0
128 0 0
150 150 150
255 255
0
255 204 153
255 179 179
Thank You