news & information tokyo 108-0075 japan...tokyo 108-0075 japan no.10-016e 3:00 p.m. jst,...
TRANSCRIPT

1
No.10-016E
3:00 P.M. JST, February 4, 2010
Consolidated Financial Results for the Third Quarter Ended December 31, 2009
Tokyo, February 4, 2010 -- Sony Corporation today announced its consolidated results for the third quarter ended December 31, 2009 (October 1, 2009 to December 31, 2009).
Quarterly operating results improved significantly, with all segments except All Other recording an improvement in operating results year-on-year.
Structural transformation initiatives are proceeding as planned. Sony’s operating results forecast for the fiscal year has been revised upward, reflecting that third
quarter results significantly exceeded expectations. For the full fiscal year, Sony expects positive cash flow from operating and investing activities
combined, excluding the Financial Services segment’s activities. (Billions of yen, millions of U.S. dollars, except per share amounts)
Third quarter ended December 31 2008 2009
Change in yen 2009*
Sales and operating revenue ¥2,154.6 ¥2,237.9 +3.9% $24,325 Operating income (loss) (18.0) 146.1 - 1,588 Income before income taxes 66.5 123.9 +86.4 1,346 Net income attributable to
Sony Corporation’s stockholders ** 10.4 79.2 +660.6 861 Net income attributable to
Sony Corporation’s stockholders per share of common stock:
— Basic ¥10.37 ¥78.89 +660.8% $0.86 — Diluted 9.98 78.76 +689.2 0.86 Unless otherwise specified, all amounts are presented on the basis of Generally Accepted Accounting Principles in the U.S. (“U.S. GAAP”). Supplemental Information In addition to operating income (loss), Sony’s management also evaluates Sony’s performance using non-U.S. GAAP adjusted operating income. Operating income, as adjusted, which excludes equity in net income (loss) of affiliated companies and restructuring charges, is not a presentation in accordance with U.S. GAAP, and is presented to enhance investors’ understanding of Sony’s operating income (loss) by providing an alternative measure that may be useful to understand Sony’s historical and prospective operating performance. Sony’s management uses this measure to review operating trends, perform analytical comparisons, and assess whether its structural transformation initiatives are achieving their objectives.
(Billions of yen, millions of U.S. dollars) Third quarter ended December 31
2008 2009 Change in yen 2009Operating income (loss) ¥(18.0) ¥146.1 - % $1,588Less: Equity in net income (loss) of affiliated companies (10.8) (5.9) - (64)Add: Restructuring charges recorded within operating expenses 12.0 13.5 +12.1 147
Operating income, as adjusted ¥4.8 ¥165.5 +3,347.9% $1,799
News & Information
1-7-1 Konan, Minato-ku Tokyo 108-0075 Japan

2
This supplemental non-U.S. GAAP measure should be considered in addition to, not as a substitute for, Sony’s operating income (loss) in accordance with U.S. GAAP. * U.S. dollar amounts have been translated from yen, for convenience only, at the rate of ¥92=U.S. $1, the approximate Tokyo foreign exchange market rate as of December 31, 2009. ** Net income attributable to Sony Corporation’s stockholders is equivalent to net income in the consolidated financial statements for the fiscal years ended March 31, 2009 and prior. Modification of the presentation format of the consolidated statement of income is required by new accounting guidance for noncontrolling interests in consolidated financial statements, which Sony adopted effective April 1, 2009. Consolidated Results for the Third Quarter Ended December 31, 2009 Sales and operating revenue (“sales”) increased 3.9% compared to the same quarter of the previous fiscal year (“year-on-year”) primarily due to an increase in revenue in the Financial Services and Pictures segments, partially offset by a decrease in revenue in the Consumer Products & Devices segment. During the quarter ended December 31, 2009, the average rate of the yen was ¥88.7 against the U.S. dollar and ¥131.2 against the euro, which was 7.4% higher and 4.5% lower respectively, than for the prior year’s third quarter. On a local currency basis, sales increased 6% year-on-year. For references to sales on a local currency basis, see Note on page 8. Operating income was ¥146.1 billion ($1,588 million), an improvement of ¥164.1 billion year-on-year. Operating results improved significantly due to increased sales and reductions in both cost of sales and selling, general and administrative expenses. Excluding equity in net loss of affiliated companies and restructuring charges, operating income on an as adjusted basis improved ¥160.7 billion to ¥165.5 billion. Equity in net loss of affiliated companies, recorded within operating income, was ¥5.9 billion ($64 million), a reduced loss of ¥4.9 billion year-on-year. Sony recorded equity in net loss of Sony Ericsson Mobile Communication AB (“Sony Ericsson”) of ¥10.2 billion ($111 million), an improvement of ¥1.2 billion from the prior year’s third quarter mainly due to benefits from cost reduction activities. Equity in net income for S-LCD Corporation (“S-LCD”), a joint venture with Samsung Electronics Co., Ltd., increased ¥2.1 billion year-on-year to ¥3.0 billion ($32 million). The net effect of other income and expenses deteriorated ¥106.7 billion primarily due to the recording of a net foreign exchange loss in the current quarter versus a significant net foreign exchange gain recorded in the prior year’s third quarter. Income before income taxes of ¥123.9 billion ($1,346 million) was recorded, an 86.4% increase year-on-year. Income taxes: During the third quarter of the current fiscal year, Sony recorded ¥33.2 billion ($361 million) of income taxes, resulting in an effective tax rate of 27%. This effective tax rate was lower than the Japanese statutory tax rate primarily as a result of an increase in profits at foreign subsidiaries subject to lower tax rates. Net income attributable to Sony Corporation’s stockholders was ¥79.2 billion ($861 million), compared to ¥10.4 billion in the previous year’s third quarter.
3
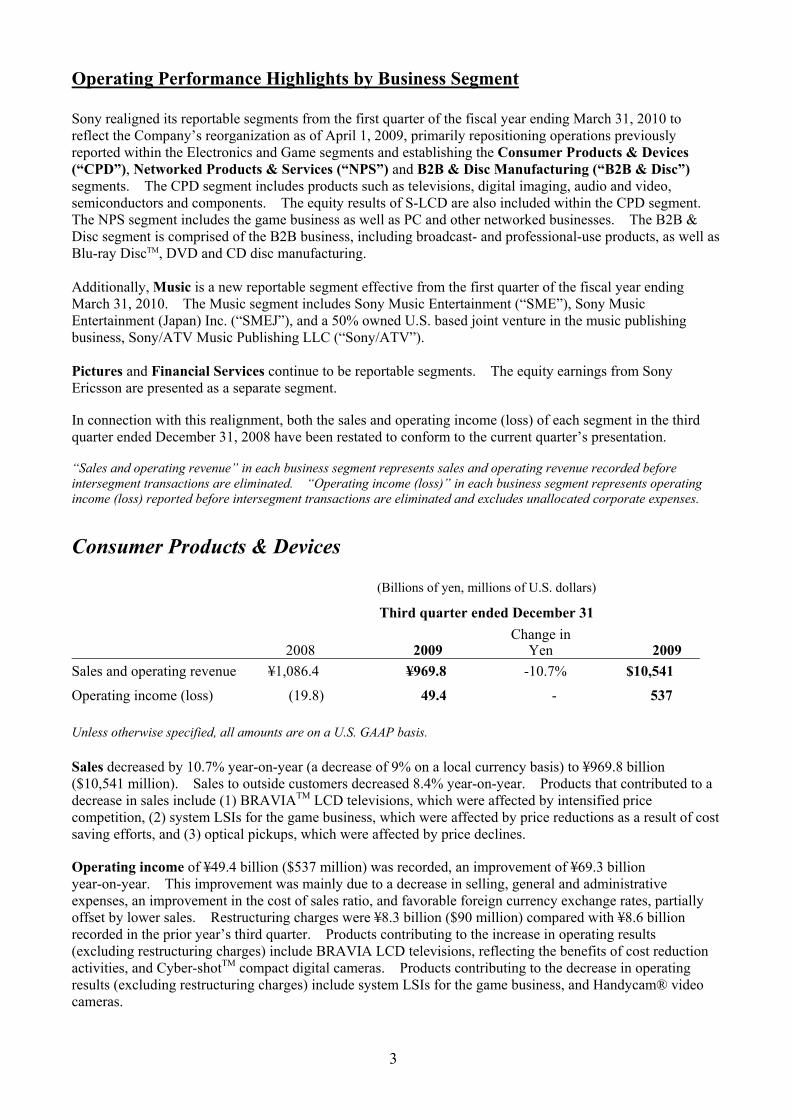
Operating Performance Highlights by Business Segment Sony realigned its reportable segments from the first quarter of the fiscal year ending March 31, 2010 to reflect the Company’s reorganization as of April 1, 2009, primarily repositioning operations previously reported within the Electronics and Game segments and establishing the Consumer Products & Devices (“CPD”), Networked Products & Services (“NPS”) and B2B & Disc Manufacturing (“B2B & Disc”) segments. The CPD segment includes products such as televisions, digital imaging, audio and video, semiconductors and components. The equity results of S-LCD are also included within the CPD segment. The NPS segment includes the game business as well as PC and other networked businesses. The B2B & Disc segment is comprised of the B2B business, including broadcast- and professional-use products, as well as Blu-ray DiscTM, DVD and CD disc manufacturing. Additionally, Music is a new reportable segment effective from the first quarter of the fiscal year ending March 31, 2010. The Music segment includes Sony Music Entertainment (“SME”), Sony Music Entertainment (Japan) Inc. (“SMEJ”), and a 50% owned U.S. based joint venture in the music publishing business, Sony/ATV Music Publishing LLC (“Sony/ATV”). Pictures and Financial Services continue to be reportable segments. The equity earnings from Sony Ericsson are presented as a separate segment. In connection with this realignment, both the sales and operating income (loss) of each segment in the third quarter ended December 31, 2008 have been restated to conform to the current quarter’s presentation. “Sales and operating revenue” in each business segment represents sales and operating revenue recorded before intersegment transactions are eliminated. “Operating income (loss)” in each business segment represents operating income (loss) reported before intersegment transactions are eliminated and excludes unallocated corporate expenses.
Consumer Products & Devices (Billions of yen, millions of U.S. dollars)
Third quarter ended December 31
2008 2009 Change in
Yen 2009Sales and operating revenue ¥1,086.4 ¥969.8 -10.7% $10,541
Operating income (loss) (19.8) 49.4 - 537 Unless otherwise specified, all amounts are on a U.S. GAAP basis. Sales decreased by 10.7% year-on-year (a decrease of 9% on a local currency basis) to ¥969.8 billion ($10,541 million). Sales to outside customers decreased 8.4% year-on-year. Products that contributed to a decrease in sales include (1) BRAVIATM LCD televisions, which were affected by intensified price competition, (2) system LSIs for the game business, which were affected by price reductions as a result of cost saving efforts, and (3) optical pickups, which were affected by price declines. Operating income of ¥49.4 billion ($537 million) was recorded, an improvement of ¥69.3 billion year-on-year. This improvement was mainly due to a decrease in selling, general and administrative expenses, an improvement in the cost of sales ratio, and favorable foreign currency exchange rates, partially offset by lower sales. Restructuring charges were ¥8.3 billion ($90 million) compared with ¥8.6 billion recorded in the prior year’s third quarter. Products contributing to the increase in operating results (excluding restructuring charges) include BRAVIA LCD televisions, reflecting the benefits of cost reduction activities, and Cyber-shotTM compact digital cameras. Products contributing to the decrease in operating results (excluding restructuring charges) include system LSIs for the game business, and Handycam® video cameras.
4
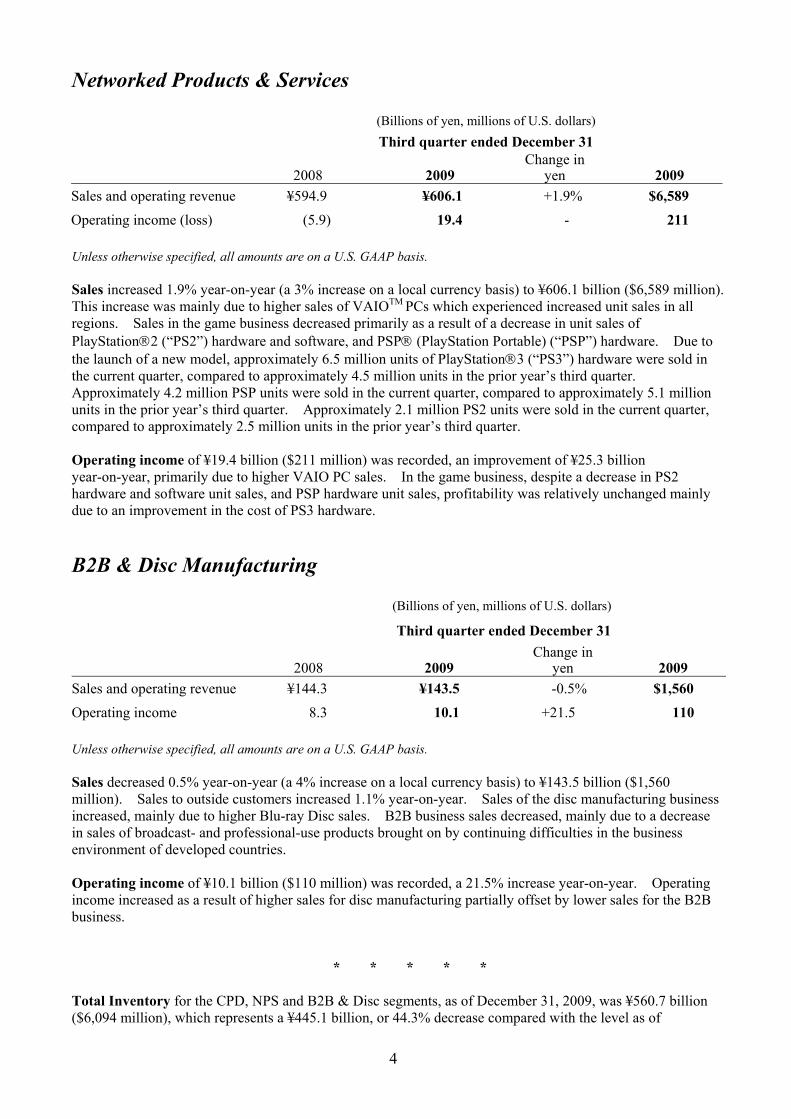
Networked Products & Services (Billions of yen, millions of U.S. dollars) Third quarter ended December 31
2008 2009 Change in
yen 2009Sales and operating revenue ¥594.9 ¥606.1 +1.9% $6,589 Operating income (loss) (5.9) 19.4 - 211 Unless otherwise specified, all amounts are on a U.S. GAAP basis. Sales increased 1.9% year-on-year (a 3% increase on a local currency basis) to ¥606.1 billion ($6,589 million). This increase was mainly due to higher sales of VAIOTM PCs which experienced increased unit sales in all regions. Sales in the game business decreased primarily as a result of a decrease in unit sales of PlayStation®2 (“PS2”) hardware and software, and PSP® (PlayStation Portable) (“PSP”) hardware. Due to the launch of a new model, approximately 6.5 million units of PlayStation®3 (“PS3”) hardware were sold in the current quarter, compared to approximately 4.5 million units in the prior year’s third quarter. Approximately 4.2 million PSP units were sold in the current quarter, compared to approximately 5.1 million units in the prior year’s third quarter. Approximately 2.1 million PS2 units were sold in the current quarter, compared to approximately 2.5 million units in the prior year’s third quarter. Operating income of ¥19.4 billion ($211 million) was recorded, an improvement of ¥25.3 billion year-on-year, primarily due to higher VAIO PC sales. In the game business, despite a decrease in PS2 hardware and software unit sales, and PSP hardware unit sales, profitability was relatively unchanged mainly due to an improvement in the cost of PS3 hardware. B2B & Disc Manufacturing
(Billions of yen, millions of U.S. dollars)
Third quarter ended December 31
2008 2009 Change in
yen 2009Sales and operating revenue ¥144.3 ¥143.5 -0.5% $1,560 Operating income 8.3 10.1 +21.5 110 Unless otherwise specified, all amounts are on a U.S. GAAP basis. Sales decreased 0.5% year-on-year (a 4% increase on a local currency basis) to ¥143.5 billion ($1,560 million). Sales to outside customers increased 1.1% year-on-year. Sales of the disc manufacturing business increased, mainly due to higher Blu-ray Disc sales. B2B business sales decreased, mainly due to a decrease in sales of broadcast- and professional-use products brought on by continuing difficulties in the business environment of developed countries. Operating income of ¥10.1 billion ($110 million) was recorded, a 21.5% increase year-on-year. Operating income increased as a result of higher sales for disc manufacturing partially offset by lower sales for the B2B business.
* * * * * Total Inventory for the CPD, NPS and B2B & Disc segments, as of December 31, 2009, was ¥560.7 billion ($6,094 million), which represents a ¥445.1 billion, or 44.3% decrease compared with the level as of
5
December 31, 2008. Inventory decreased by ¥218.4 billion, or 28.0% compared with the level as of September 30, 2009.
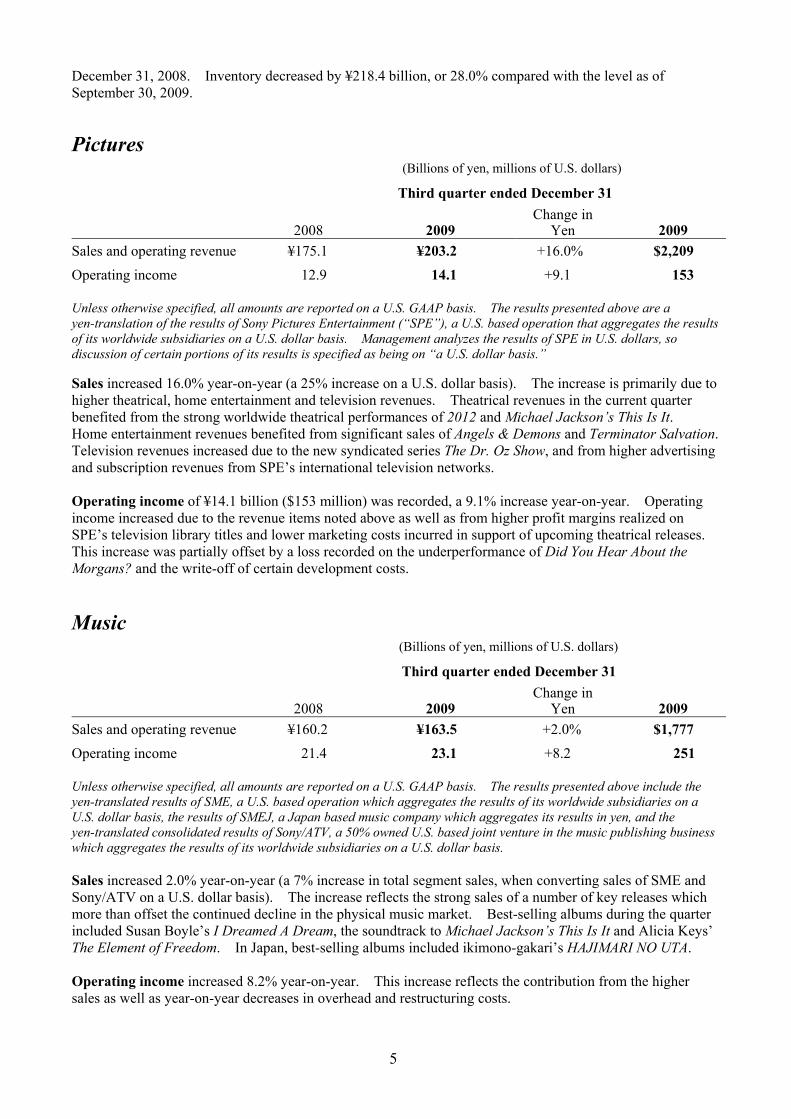
Pictures (Billions of yen, millions of U.S. dollars)
Third quarter ended December 31
2008 2009 Change in
Yen 2009Sales and operating revenue ¥175.1 ¥203.2 +16.0% $2,209 Operating income 12.9 14.1 +9.1 153 Unless otherwise specified, all amounts are reported on a U.S. GAAP basis. The results presented above are a yen-translation of the results of Sony Pictures Entertainment (“SPE”), a U.S. based operation that aggregates the results of its worldwide subsidiaries on a U.S. dollar basis. Management analyzes the results of SPE in U.S. dollars, so discussion of certain portions of its results is specified as being on “a U.S. dollar basis.” Sales increased 16.0% year-on-year (a 25% increase on a U.S. dollar basis). The increase is primarily due to higher theatrical, home entertainment and television revenues. Theatrical revenues in the current quarter benefited from the strong worldwide theatrical performances of 2012 and Michael Jackson’s This Is It. Home entertainment revenues benefited from significant sales of Angels & Demons and Terminator Salvation. Television revenues increased due to the new syndicated series The Dr. Oz Show, and from higher advertising and subscription revenues from SPE’s international television networks. Operating income of ¥14.1 billion ($153 million) was recorded, a 9.1% increase year-on-year. Operating income increased due to the revenue items noted above as well as from higher profit margins realized on SPE’s television library titles and lower marketing costs incurred in support of upcoming theatrical releases. This increase was partially offset by a loss recorded on the underperformance of Did You Hear About the Morgans? and the write-off of certain development costs. Music
(Billions of yen, millions of U.S. dollars)
Third quarter ended December 31
2008 2009 Change in
Yen 2009Sales and operating revenue ¥160.2 ¥163.5 +2.0% $1,777 Operating income 21.4 23.1 +8.2 251 Unless otherwise specified, all amounts are reported on a U.S. GAAP basis. The results presented above include the yen-translated results of SME, a U.S. based operation which aggregates the results of its worldwide subsidiaries on a U.S. dollar basis, the results of SMEJ, a Japan based music company which aggregates its results in yen, and the yen-translated consolidated results of Sony/ATV, a 50% owned U.S. based joint venture in the music publishing business which aggregates the results of its worldwide subsidiaries on a U.S. dollar basis. Sales increased 2.0% year-on-year (a 7% increase in total segment sales, when converting sales of SME and Sony/ATV on a U.S. dollar basis). The increase reflects the strong sales of a number of key releases which more than offset the continued decline in the physical music market. Best-selling albums during the quarter included Susan Boyle’s I Dreamed A Dream, the soundtrack to Michael Jackson’s This Is It and Alicia Keys’ The Element of Freedom. In Japan, best-selling albums included ikimono-gakari’s HAJIMARI NO UTA. Operating income increased 8.2% year-on-year. This increase reflects the contribution from the higher sales as well as year-on-year decreases in overhead and restructuring costs.

6
Financial Services (Billions of yen, millions of U.S. dollars)
Third quarter ended December 31
2008 2009 Change in
yen 2009Financial services revenue ¥103.1 ¥205.6 +99.5% $2,235 Operating income (loss) (37.4) 35.0 - 381 In Sony’s Financial Services segment, the results include Sony Financial Holdings, Inc. (“SFH”) and SFH’s consolidated subsidiaries such as Sony Life Insurance Co., Ltd. (“Sony Life”), Sony Assurance Inc. and Sony Bank Inc.(“Sony Bank”), as well as the results for Sony Finance International Inc. Unless otherwise specified, all amounts are reported on a U.S. GAAP basis. Therefore, the results of Sony Life shown below differ from the results that SFH and Sony Life disclose on a Japanese statutory basis. Financial services revenue increased 99.5% year-on-year mainly due to an increase in revenue at Sony Life. Revenue at Sony Life was ¥180.0 billion ($1,956 million), a ¥107.2 billion or 147.1% increase year-on-year. Revenue increased mainly due to an improvement in net gains from investments in the separate account, significant impairment losses on equity securities in the general account recorded during the prior year’s third quarter, and an improvement in net valuation gains from investments in convertible bonds in the general account, all as a result of the relatively stable situation in the Japanese stock market, as compared with a significant decline following the global financial crisis in the prior year’s third quarter. Revenue from insurance premiums increased year-on-year, reflecting a steady increase in policy amount in force. Operating income of ¥35.0 billion ($381 million) was recorded as compared to an operating loss of ¥37.4 billion in the prior year’s third quarter mainly as a result of an improvement in operating results at Sony Life. Operating income at Sony Life was ¥36.4 billion ($396 million), as compared to an operating loss of ¥37.7 billion in the prior year’s third quarter, mainly due to the additional recording of policy reserves because of the revision of the future investment yield of variable life insurance products in the separate account and the significant impairment losses on equity securities in the general account, as a result of the significant decline in the Japanese stock market in the prior year’s third quarter, and the improvement in net valuation gains from investments in convertible bonds in the general account during the current quarter. Sony Ericsson Mobile Communications AB The following operating results for Sony Ericsson, which is accounted for by the equity method as Sony Corporation’s ownership percentage is 50%, are not consolidated in Sony’s consolidated financial statements. However, Sony believes that this disclosure provides additional useful analytical information to investors regarding operating performance of Sony.
(Millions of euro)
Quarter ended December 31 2008 2009 Change in euroSales and operating revenue €2,914 €1,750 -40% Income (loss) before taxes (256) (180) - Net income (loss) (183) (159) - Unless otherwise specified, all amounts are on a U.S. GAAP basis.

7
Sales for the quarter ended December 31, 2009 decreased 40% year-on-year, due to a decrease in unit sales mainly driven by a downturn in the global handset market and a faster than anticipated shift to touch screen phones in the mid-priced sector of the market. A loss before taxes of €180 million was recorded, compared to a loss of €256 million in the same quarter of the previous year, primarily due to a decrease in research and development expenses as well as a decrease in selling and administrative expenses, which was partly offset by the above-mentioned lower sales and a year-on-year increase in restructuring charges. As a result, Sony recorded equity in net loss of Sony Ericsson of ¥10.2 billion ($111 million) for the current quarter. Cash Flows
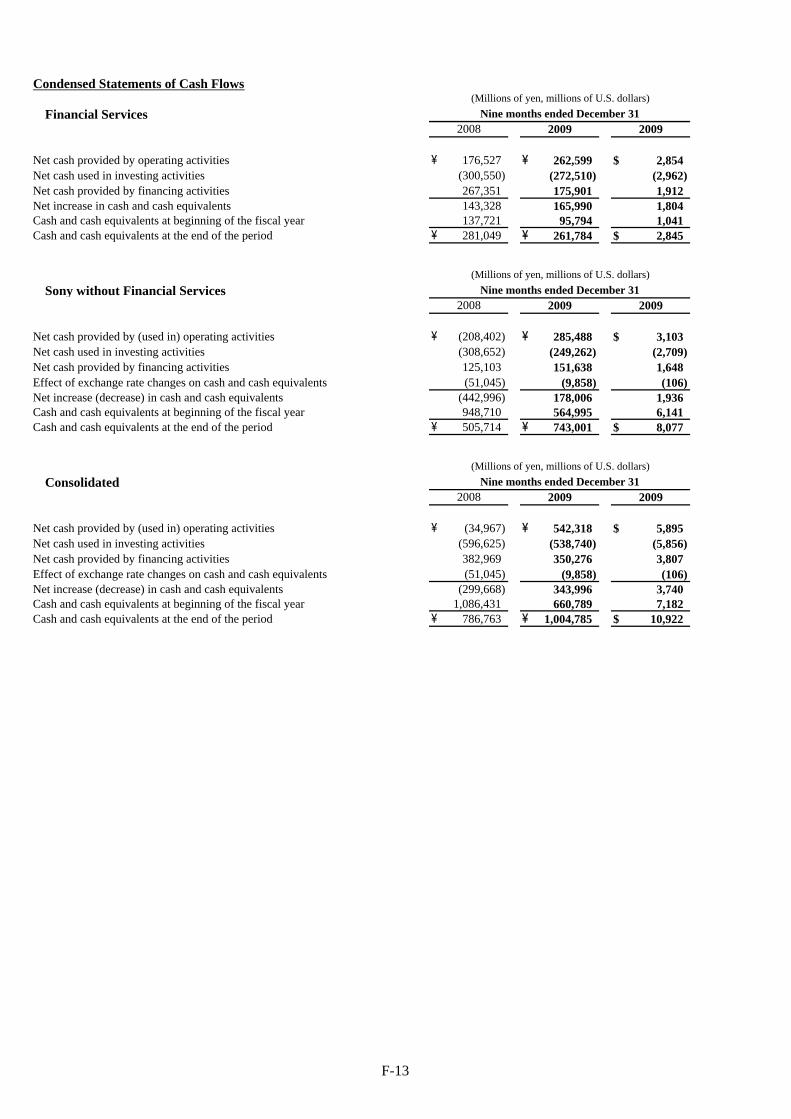
For Consolidated Statements of Cash Flows, charts showing Sony’s cash flow information for all segments, all segments excluding the Financial Services segment and the Financial Services segment alone, please refer to pages F-4 and F-13 respectively. Operating Activities: During the nine months ended December 31, 2009, there was a net cash inflow of ¥542.3 billion ($5,895 million) from operating activities, an improvement of ¥577.3 billion year-on-year. For all segments excluding the Financial Services segment, there was a net cash inflow of ¥285.5 billion ($3,103 million) in the current period, an improvement of ¥493.9 billion from a net cash outflow during the same period of the previous fiscal year. During the current period, the major cash inflow factors included a cash contribution from net income after taking into account depreciation and amortization (including amortization of film costs), an increase in notes and accounts payable, trade, a decrease in inventories, and income tax refunds. This exceeded cash outflow, which included increases in notes and accounts receivable, trade and in film costs. Compared with the same period of the prior fiscal year, cash flow improved mainly due to a decrease in inventories during the current period compared to an increase in the prior year, an increase in notes and accounts payable, trade, and lower income tax payments. The Financial Services segment had a net cash inflow of ¥262.6 billion ($2,854 million), an increase of ¥86.1 billion, or 48.8% year-on-year. For the current period, net cash inflow was generated primarily due to an increase in revenue from insurance premiums as a result of a steady increase in policy amount in force at Sony Life. Compared with the same period of the prior fiscal year, net cash inflow increased primarily reflecting an increase in revenue from insurance premiums at Sony Life noted above. Investing Activities: During the current nine months, Sony used ¥538.7 billion ($5,856 million) of net cash in investing activities, a decrease of ¥57.9 billion, or 9.7% year-on-year.
For all segments excluding the Financial Services segment, there was ¥249.3 billion ($2,709 million) of net cash used, a decrease of ¥59.4 billion, or 19.2% year-on-year. During the current period, net cash was used mainly for purchases of manufacturing equipment. The net cash used decreased year-on-year primarily as a result of lower investments in and purchases of manufacturing equipment, although the same period of the prior fiscal year benefited from proceeds generated from the sale of semiconductor fabrication equipment. The Financial Services segment used ¥272.5 billion ($2,962 million) of net cash, a decrease of ¥28.0 billion, or 9.3% year-on-year. Payments for investments and advances, carried out primarily at Sony Life and Sony Bank, where operations are expanding, exceeded proceeds from the maturities of marketable securities, sales of securities investments and collections of advances. The net cash used within the Financial Services segment decreased year-on-year primarily due to a decrease in investments at Sony Bank. In all segments excluding the Financial Services segment, net cash generated by operating and investing activities combined for the current nine months was ¥36.2 billion ($394 million), an improvement of ¥553.3 billion compared to net cash used in the same period of the previous fiscal year. Financing Activities: During the current nine months, ¥350.3 billion ($3,807 million) of net cash was provided by financing activities, a decrease of ¥32.7 billion, or 8.5% year-on-year. For all segments excluding the Financial Services segment, there was a ¥151.6 billion ($1,648 million) net cash inflow, an increase of ¥26.5 billion or 21.2% year-on year. This was primarily due to issuances of long-term corporate

8
bonds and borrowings from banks in the current period, which were partially offset by net repayments of short-term borrowings including commercial paper. In June 2009, Sony Corporation issued domestic straight bonds totaling ¥220 billion ($2,391 million) in Japan with maturities of 3 to 10 years. In the Financial Services segment, financing activities generated ¥175.9 billion ($1,912 million) of net cash, a decrease of ¥91.5 billion, or 34.2% year-on-year, primarily due to a lower increase in deposits from customers at Sony Bank compared to the same period of the previous fiscal year. Total Cash and Cash Equivalents: Accounting for the above factors and the effect of fluctuations in the exchange rates, the total outstanding balance of cash and cash equivalents as of December 31, 2009 was ¥1,004.8 billion ($10,922 million). The outstanding balance of cash and cash equivalents of all segments excluding the Financial Services segment was ¥743.0 billion ($8,077 million), an increase of ¥178.0 billion, or 31.5%, compared with the balance as of March 31, 2009. This is an increase of ¥237.3 billion, or 46.9%, compared with the balance as of December 31, 2008. Sony believes it continues to maintain sufficient liquidity through access to a total, translated into yen, of approximately ¥785 billion of unused committed lines of credit with financial institutions in addition to the cash and cash equivalents balance at December 31, 2009. Within the Financial Services segment, the outstanding balance of cash and cash equivalents was ¥261.8 billion ($2,845 million), an increase of ¥166.0 billion, or 173.3%, compared with the balance as of March 31, 2009. This is a decrease of ¥19.3 billion, or 6.9%, compared with the balance as of December 31, 2008. Note Sales on a local currency basis described herein reflect sales obtained by applying the yen’s monthly average exchange rate in the same quarter of the previous fiscal year to local currency-denominated monthly sales in the current quarter. Sales on a local currency basis are not reflected in Sony’s consolidated financial statements and are not measures in accordance with U.S. GAAP. Sony does not believe that these measures are a substitute for U.S. GAAP measures. However, Sony believes that disclosing sales information on a local currency basis provides additional useful analytical information to investors regarding the operating performance of Sony.

9
Outlook for the Fiscal Year ending March 31, 2010
Sony’s consolidated results forecast for the fiscal year ending March 31, 2010, as announced on October 30, 2009, has been revised as per the table below. (Billions of yen)
Revised Forecast
Change from October Forecast
October Forecast
Change from March 31, 2009 Actual Results
March 31, 2009 Actual Results
Sales and operating revenue ¥7,300 0% ¥7,300 -6% ¥7,730.0Operating income (loss) (30) - (60) - (227.8)Income (loss) before
income taxes (40) - (70) - (175.0)
Net income (loss) attributable to Sony Corporation’s stockholders
(70) - (95) - (98.9)
Assumed foreign currency exchange rates for the fourth quarter ending March 31, 2010: approximately ¥90 to the U.S. dollar and approximately ¥126 to the euro. (Assumed foreign exchange rates for the second half of the current fiscal year at the time of the October forecast: approximately ¥90 to the U.S. dollar and approximately ¥130 to the euro.) Supplemental Information In addition to operating income (loss), Sony’s management also evaluates Sony’s performance using non-U.S. GAAP adjusted operating income (loss). Operating income (loss), as adjusted, which excludes equity in net income (loss) of affiliated companies and restructuring charges, is not a presentation in accordance with U.S. GAAP, and is presented to enhance investors’ understanding of Sony’s operating income (loss) by providing an alternative measure that may be useful to understand Sony’s historical and prospective operating performance. Sony’s management uses this measure to review operating trends, perform analytical comparisons and assess whether its structural transformation initiatives are achieving its objectives. (Billions of yen)
Revised Forecast
Change fromOctober Forecast
October Forecast
Change from March 31,
2009 Actual Results
March 31, 2009 Actual Results
Operating income (loss) ¥(30) -% ¥(60) -% ¥(227.8) Less: Equity in net income (loss) of
affiliated companies (40) 0 (40) - (25.1)
Add: Restructuring charges recorded within operating expenses 130 0 130 +72 75.4
Operating income (loss), as adjusted ¥140 +27% ¥110 -% ¥ (127.3) This supplemental non-U.S. GAAP measure should be considered in addition to, not as a substitute for, Sony’s operating income (loss) in accordance with U.S. GAAP. The revision in the operating income (loss) forecast for the current fiscal year is primarily due to the following factors: 1. Results in the CPD segment are expected to exceed the October forecast by approximately ¥25 billion,
primarily due to the strong performance of televisions and semiconductors in the third quarter of the current fiscal year.
2. Results in the Financial Services segment are expected to exceed the October forecast by approximately
¥25 billion due to a continued improvement in market conditions.
10
3. Results in the B2B & Disc Manufacturing segment are expected to be approximately ¥10 billion less than the October forecast due to continuing difficulties in the business environment.
4. Results in the NPS segment are expected to be approximately ¥5 billion less than the October forecast
mainly due to lower than expected results in the game business. 5. Results in the Pictures segment are expected to be approximately ¥5 billion less than the October forecast
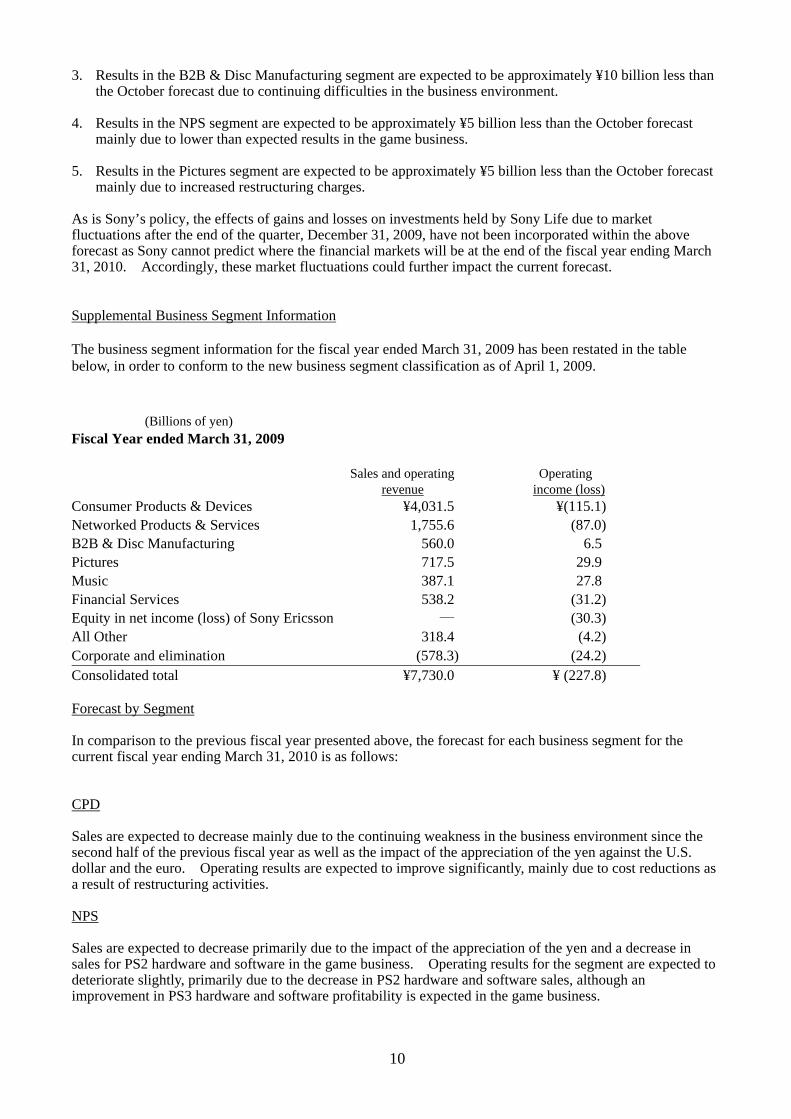
mainly due to increased restructuring charges. As is Sony’s policy, the effects of gains and losses on investments held by Sony Life due to market fluctuations after the end of the quarter, December 31, 2009, have not been incorporated within the above forecast as Sony cannot predict where the financial markets will be at the end of the fiscal year ending March 31, 2010. Accordingly, these market fluctuations could further impact the current forecast. Supplemental Business Segment Information The business segment information for the fiscal year ended March 31, 2009 has been restated in the table below, in order to conform to the new business segment classification as of April 1, 2009. (Billions of yen) Fiscal Year ended March 31, 2009 Sales and operating
revenue Operating
income (loss) Consumer Products & Devices ¥4,031.5 ¥(115.1) Networked Products & Services 1,755.6 (87.0) B2B & Disc Manufacturing 560.0 6.5 Pictures 717.5 29.9 Music 387.1 27.8 Financial Services 538.2 (31.2) Equity in net income (loss) of Sony Ericsson ― (30.3) All Other 318.4 (4.2) Corporate and elimination (578.3) (24.2) Consolidated total ¥7,730.0 ¥ (227.8) Forecast by Segment In comparison to the previous fiscal year presented above, the forecast for each business segment for the current fiscal year ending March 31, 2010 is as follows: CPD Sales are expected to decrease mainly due to the continuing weakness in the business environment since the second half of the previous fiscal year as well as the impact of the appreciation of the yen against the U.S. dollar and the euro. Operating results are expected to improve significantly, mainly due to cost reductions as a result of restructuring activities. NPS Sales are expected to decrease primarily due to the impact of the appreciation of the yen and a decrease in sales for PS2 hardware and software in the game business. Operating results for the segment are expected to deteriorate slightly, primarily due to the decrease in PS2 hardware and software sales, although an improvement in PS3 hardware and software profitability is expected in the game business.

11
B2B & Disc Manufacturing Sales are expected to decrease and operating results are expected to deteriorate mainly due to the impact of the appreciation of the yen and the economic slowdown. Pictures Although sales are expected to decrease slightly, primarily due to the impact of the appreciation of the yen, operating income is expected to increase primarily due to certain asset sales. Music Sales and operating income are expected to increase significantly this fiscal year due to the fact that SME was consolidated by Sony as a wholly-owned subsidiary beginning October 1, 2008. On a pro forma basis, had SME been consolidated for the entire previous fiscal year, sales would be expected to decrease due to the appreciation of the yen; however, operating income would be expected to increase mainly due to a decrease in restructuring charges. Financial Services Revenue and operating results are expected to improve significantly compared to the fiscal year ended March 31, 2009, which experienced the effect of a downturn in the Japanese stock market. Our forecasts for capital expenditures and research and development expenses for the current fiscal year ending March 31, 2010, as announced on October 30, 2009, have been revised as per the table below. Our current fiscal year forecast for depreciation and amortization is unchanged. (Billions of yen)
Revised Forecast
Change from October Forecast
October Forecast
Change from March 31, 2009 Actual Results
March 31, 2009Actual Results
Capital expenditures* (additions to Property, Plant and Equipment)
¥220 -12% ¥250 -34% ¥332.1
Depreciation and amortization** 370 0 370 -9 405.4
[for Property, Plant and Equipment (included above)
270 0 270 -8 293.7]
Research and development expenses
450 -2 460 -10 497.3
* Investments in equity affiliates are not included within the forecast for capital expenditures. ** The forecast for depreciation and amortization includes amortization of intangible assets and amortization of
deferred insurance acquisition costs. This forecast is based on management’s current expectations and is subject to uncertainties and changes in circumstances. Actual results may differ materially from those included in this forecast due to a variety of factors. See “Cautionary Statement” below.

12
Cautionary Statement Statements made in this release with respect to Sony’s current plans, estimates, strategies and beliefs and other statements that are not historical facts are forward-looking statements about the future performance of Sony. Forward-looking statements include, but are not limited to, those statements using words such as “believe,” “expect,” “plans,” “strategy,” “prospects,” “forecast,” “estimate,” “project,” “anticipate,” “aim,” “intend,” “seek,” “may,” “might,” “could” or “should,” and words of similar meaning in connection with a discussion of future operations, financial performance, events or conditions. From time to time, oral or written forward-looking statements may also be included in other materials released to the public. These statements are based on management’s assumptions and beliefs in light of the information currently available to it. Sony cautions you that a number of important risks and uncertainties could cause actual results to differ materially from those discussed in the forward-looking statements, and therefore you should not place undue reliance on them. You also should not rely on any obligation of Sony to update or revise any forward-looking statements, whether as a result of new information, future events or otherwise. Sony disclaims any such obligation. Risks and uncertainties that might affect Sony include, but are not limited to (i) the global economic environment in which Sony operates and the economic conditions in Sony’s markets, particularly levels of consumer spending as well as the worldwide crisis in the financial markets and housing sectors which began in 2008; (ii) exchange rates, particularly between the yen and the U.S. dollar, the euro and other currencies in which Sony makes significant sales and incurs production costs, or in which Sony’s assets and liabilities are denominated; (iii) Sony’s ability to continue to design and develop and win acceptance of, as well as achieve sufficient cost reductions for, its products and services, including platforms within the game business, which are offered in highly competitive markets characterized by continual new product introductions, rapid development in technology and subjective and changing consumer preferences. (iv) Sony’s ability and timing to recoup large-scale investments required for technology development and increasing production capacity; (v) Sony’s ability to implement successfully business restructuring and transformation efforts; (vi) Sony’s ability to implement successfully its hardware, software, and content integration strategy and to develop and implement successful sales and distribution strategies in light of the Internet and other technological developments; (vii) Sony’s continued ability to devote sufficient resources to research and development and, with respect to capital expenditures, to correctly prioritize investments; (viii) Sony’s ability to maintain product quality; (ix) Sony’s ability to secure adequate funding to finance restructuring activities and capital investments given the current state of global capital markets; (x) the success of Sony’s joint ventures and alliances; (xi) the outcome of pending legal and/or regulatory proceedings; (xii) shifts in customer demand for financial services such as life insurance and Sony’s ability to conduct successful asset liability management in the Financial Services segment; and (xiii) the impact of unfavorable conditions or developments (including market fluctuations or volatility) in the Japanese equity markets on the revenue and operating income of the Financial Services segment. Risks and uncertainties also include the impact of any future events with material adverse impacts. Investor Relations Contacts: Tokyo New York London Gen Tsuchikawa Sam Levenson Shinji Tomita +81-(0)3-6748-2180 +1-212-833-6722 +44-(0)20-7426-8696 Home Page: http://www.sony.net/IR/ Presentation Slides: http://www.sony.net/SonyInfo/IR/financial/fr/09q3_sonypre.pdf

(Unaudited)Consolidated Financial StatementsConsolidated Balance Sheets
Current assets:Cash and cash equivalents \ 786,763 \ 1,004,785 \ +218,022 +27.7 % $ 10,922 \ 660,789 Call loan in the banking business 125,062 56,841 -68,221 -54.5 618 49,909 Marketable securities 530,317 526,229 -4,088 -0.8 5,720 466,912 Notes and accounts receivable, trade 1,327,287 1,293,176 -34,111 -2.6 14,056 963,837 Allowance for doubtful accounts and sales returns (111,757) (120,606) -8,849 +7.9 (1,311) (110,383) Inventories 1,082,772 637,790 -444,982 -41.1 6,933 813,068 Deferred income taxes 180,664 231,434 +50,770 +28.1 2,516 189,703 Prepaid expenses and other current assets 796,895 582,703 -214,192 -26.9 6,332 586,800
4,718,003 4,212,352 -505,651 -10.7 45,786 3,620,635
Film costs 295,801 323,849 +28,048 +9.5 3,520 306,877
Investments and advances:Affiliated companies 251,059 227,928 -23,131 -9.2 2,477 236,779 Securities investments and other 4,203,391 4,912,621 +709,230 +16.9 53,399 4,561,651
4,454,450 5,140,549 +686,099 +15.4 55,876 4,798,430
Property, plant and equipment:Land 153,720 156,487 +2,767 +1.8 1,701 155,665 Buildings 889,285 914,740 +25,455 +2.9 9,943 911,269 Machinery and equipment 2,350,687 2,286,852 -63,835 -2.7 24,857 2,343,839 Construction in progress 84,491 79,670 -4,821 -5.7 866 100,027 Less - Accumulated depreciation (2,300,074) (2,350,866) -50,792 +2.2 (25,553) (2,334,937)
1,178,109 1,086,883 -91,226 -7.7 11,814 1,175,863 Other assets:
Intangibles, net 374,189 388,781 +14,592 +3.9 4,226 396,348 Goodwill 426,210 429,005 +2,795 +0.7 4,663 443,958 Deferred insurance acquisition costs 398,219 413,001 +14,782 +3.7 4,489 400,412 Deferred income taxes 220,814 357,996 +137,182 +62.1 3,891 359,050 Other 497,089 469,434 -27,655 -5.6 5,103 511,938
1,916,521 2,058,217 +141,696 +7.4 22,372 2,111,706 \ 12,562,884 \ 12,821,850 \ +258,966 +2.1 % $ 139,368 \ 12,013,511
Current liabilities:Short-term borrowings \ 411,898 \ 80,251 \ -331,647 -80.5 % $ 872 \ 303,615 Current portion of long-term debt 100,367 258,414 +158,047 +157.5 2,809 147,540 Notes and accounts payable, trade 852,284 734,324 -117,960 -13.8 7,982 560,795 Accounts payable, other and accrued expenses 1,080,718 1,030,870 -49,848 -4.6 11,205 1,036,830 Accrued income and other taxes 80,088 93,191 +13,103 +16.4 1,013 46,683 Deposits from customers in the banking business 1,339,213 1,441,851 +102,638 +7.7 15,672 1,326,360 Other 423,954 371,197 -52,757 -12.4 4,035 389,077
4,288,522 4,010,098 -278,424 -6.5 43,588 3,810,900
Long-term debt 685,005 966,328 +281,323 +41.1 10,504 660,147 Accrued pension and severance costs 227,808 340,345 +112,537 +49.4 3,699 365,706 Deferred income taxes 220,054 198,426 -21,628 -9.8 2,157 188,359 Future insurance policy benefits and other 3,462,544 3,793,842 +331,298 +9.6 41,237 3,521,060 Other 222,506 205,201 -17,305 -7.8 2,231 250,737 Total liabilities 9,106,439 9,514,240 +407,801 +4.5 103,416 8,796,909
Equity:Sony Corporation's stockholders' equity:
Common stock 630,765 630,765 — - 6,856 630,765 Additional paid-in capital 1,154,279 1,157,136 +2,857 +0.2 12,578 1,155,034 Retained earnings 2,095,453 1,920,173 -175,280 -8.4 20,871 1,916,951 Accumulated other comprehensive income (680,085) (698,288) -18,203 +2.7 (7,589) (733,443) Treasury stock, at cost (4,690) (4,650) +40 -0.9 (51) (4,654)
3,195,722 3,005,136 -190,586 -6.0 32,665 2,964,653
Noncontrolling interests 260,723 302,474 +41,751 +16.0 3,287 251,949 Total equity 3,456,445 3,307,610 -148,835 -4.3 35,952 3,216,602
\ 12,562,884 \ 12,821,850 \ +258,966 +2.1 % $ 139,368 \ 12,013,511
LIABILITIES AND EQUITY
ASSETS
(Millions of yen, millions of U.S. dollars)
20092008 2009 2009Change from 2008December 31 March 31
F-1

Consolidated Statements of Income
Sales and operating revenue:Net sales \ 2,029,451 \ 2,014,145 \ -15,306 -0.8 % $ 21,893 Financial service revenue 99,558 202,580 +103,022 +103.5 2,202 Other operating revenue 25,575 21,140 -4,435 -17.3 230
2,154,584 2,237,865 +83,281 +3.9 24,325 Costs and expenses:
Cost of sales 1,564,079 1,510,841 -53,238 -3.4 16,423 Selling, general and administrative 461,903 402,440 -59,463 -12.9 4,375 Financial service expenses 132,782 167,201 +34,419 +25.9 1,817 (Gain) loss on sale, disposal or impairment of assets, net 2,973 5,353 +2,380 +80.1 58
2,161,737 2,085,835 -75,902 -3.5 22,673
Equity in net loss of affiliated companies (10,809) (5,927) +4,882 - (64)
Operating income (loss) (17,962) 146,103 +164,065 - 1,588
Other income:Interest and dividends 4,220 2,060 -2,160 -51.2 22 Gain on sale of securities investments, net 365 2,271 +1,906 +522.2 25 Foreign exchange gain, net 79,802 — -79,802 - — Other 11,701 3,391 -8,310 -71.0 37
96,088 7,722 -88,366 -92.0 84
Other expenses:Interest 6,863 5,717 -1,146 -16.7 62 Loss on devaluation of securities investments 1,358 5 -1,353 -99.6 — Foreign exchange loss, net — 19,947 +19,947 - 217 Other 3,454 4,291 +837 +24.2 47
11,675 29,960 +18,285 +156.6 326
Income before income taxes 66,451 123,865 +57,414 +86.4 1,346
Income taxes 64,395 33,244 -31,151 -48.4 361
2,056 90,621 +88,565 - 985
Less - Net income (loss) attributable to noncontrolling interests
Per share data:Net income attributable to Sony Corporation's stockholders — Basic \ 10.37 \ 78.89 \ +68.52 +660.8 % $ 0.86 — Diluted 9.98 78.76 +68.78 +689.2 0.86
(Millions of yen, millions of U.S. dollars, except per share amounts)
2008 2009 Change from 2008
79,167 \ +68,758 +660.6 $
Three months ended December 31
+19,807 124 -
Net income
% 861
2009
Net income attributable to Sony Corporation's stockholders
\ 10,409 \
(8,353) 11,454
F-2

Consolidated Statements of Income
Sales and operating revenue:Net sales \ 5,755,002 \ 4,811,827 \ -943,175 -16.4 % $ 52,303 Financial service revenue 375,409 625,238 +249,829 +66.5 6,796 Other operating revenue 75,522 61,863 -13,659 -18.1 672
6,205,933 5,498,928 -707,005 -11.4 59,771 Costs and expenses:
Cost of sales 4,446,556 3,707,085 -739,471 -16.6 40,295 Selling, general and administrative 1,276,040 1,150,745 -125,295 -9.8 12,508 Financial service expenses 402,207 507,269 +105,062 +26.1 5,514 (Gain) loss on sale, disposal or impairment of assets, net 7,181 12,686 +5,505 +76.7 138
6,131,984 5,377,785 -754,199 -12.3 58,455
Equity in net loss of affiliated companies (7,424) (33,332) -25,908 - (362)
Operating income 66,525 87,811 +21,286 +32.0 954
Other income:Interest and dividends 18,533 10,141 -8,392 -45.3 110 Gain on sale of securities investments, net 826 2,584 +1,758 +212.8 28 Foreign exchange gain, net 60,072 — -60,072 - — Other 23,828 15,960 -7,868 -33.0 174
103,259 28,685 -74,574 -72.2 312
Other expenses:Interest 18,290 17,883 -407 -2.2 194 Loss on devaluation of securities investments 2,800 1,140 -1,660 -59.3 12 Foreign exchange loss, net — 13,312 +13,312 - 145 Other 12,014 10,266 -1,748 -14.5 112
33,104 42,601 +9,497 +28.7 463
Income before income taxes 136,680 73,895 -62,785 -45.9 803
Income taxes 74,461 19,357 -55,104 -74.0 210
62,219 54,538 -7,681 -12.3 593
Less - Net income (loss) attributable to noncontrolling interests
Per share data:Net income attributable to Sony Corporation's stockholders — Basic \ 65.97 \ 15.71 \ -50.26 -76.2 % $ 0.17 — Diluted 63.16 15.69 -47.47 -75.2 0.17
+42,755 - 422
15,766 \ -76.2 $
(Millions of yen, millions of U.S. dollars, except per share amounts)
2008 2009 Change from 2008 2009Nine months ended December 31
Net income
%-50,436 171 Net income attributable to Sony Corporation's stockholders
\ 66,202 \
(3,983) 38,772
F-3

Consolidated Statements of Cash Flows
Cash flows from operating activities:Net income \ 62,219 \ 54,538 $ 593 Adjustments to reconcile net income to net cash provided by (used in) operating activities-
Depreciation and amortization, including amortization of deferred insurance acquisition costsAmortization of film costs 185,256 199,534 2,169 Stock-based compensation expense 2,825 1,611 18 Accrual for pension and severance costs, less payments (11,983) (21,526) (234) Loss on sale, disposal or impairment of assets, net 7,181 12,686 138 (Gain) loss on sale or devaluation of securities investments, net 1,974 (1,444) (16) (Gain) loss on revaluation of marketable securities held in the financial service business for trading purpose, net(Gain) loss on revaluation or impairment of securities investments held in the financial service business, netDeferred income taxes (17,496) (29,566) (321) Equity in net (income) losses of affiliated companies, net of dividends 39,077 34,958 380 Changes in assets and liabilities: Increase in notes and accounts receivable, trade (228,616) (330,197) (3,589) (Increase) decrease in inventories (182,727) 158,058 1,718 Increase in film costs (206,931) (235,838) (2,563) Increase (decrease) in notes and accounts payable, trade (79,919) 181,701 1,975 Increase (decrease) in accrued income and other taxes (130,840) 81,993 891 Increase in future insurance policy benefits and other 102,242 221,764 2,410 Increase in deferred insurance acquisition costs (51,868) (51,923) (564) Increase in marketable securities held in the financial service business for trading purpose Increase in other current assets (150,292) (38,075) (414) Increase in other current liabilities 92,129 24,109 262 Other 114,632 99,592 1,082 Net cash provided by (used in) operating activities (34,967) 542,318 5,895
Cash flows from investing activities:Payments for purchases of fixed assets (360,339) (278,894) (3,031) Proceeds from sales of fixed assets 152,474 9,203 100 Payments for investments and advances by financial service business (1,613,519) (1,103,707) (11,997) Payments for investments and advances (other than financial service business) (115,329) (30,849) (335) Proceeds from maturities of marketable securities, sales of securities investments and collections of advances by financial service businessProceeds from maturities of marketable securities, sales of securities investments and collections of advances (other than financial service business)Other 1,463 2,710 29
Net cash used in investing activities (596,625) (538,740) (5,856)
Cash flows from financing activities:Proceeds from issuance of long-term debt 50,454 509,874 5,542 Payments of long-term debt (260,987) (92,383) (1,004) Increase (decrease) in short-term borrowings, net 384,129 (241,181) (2,622) Increase in deposits from customers in the financial service business, net 255,444 182,452 1,983 Increase in call money in the banking business, net — 21,400 233 Dividends paid (42,669) (25,116) (273) Proceeds from issuance of shares under stock-based compensation plans 378 — — Other (3,780) (4,770) (52)
Net cash provided by financing activities 382,969 350,276 3,807
Effect of exchange rate changes on cash and cash equivalents (51,045) (9,858) (106)
Net increase (decrease) in cash and cash equivalents (299,668) 343,996 3,740 Cash and cash equivalents at beginning of the fiscal year 1,086,431 660,789 7,182
Cash and cash equivalents at the end of the period \ 786,763 \ 1,004,785 $ 10,922
78,283 (40,273)
300,585 276,065
20092008Nine months ended December 31
(Millions of yen, millions of U.S. dollars)
2009
3,001
(32,758) (1,999) (22)
(438)
72,060 (53,450) (581)
1,330,046 849,609 9,235
8,579 13,188 143
F-4

Business Segment Information
Sales and operating revenueConsumer Products & Devices
Customers \ 965,953 \ 884,925 -8.4 % $ 9,619 Intersegment 120,450 84,830 922 Total 1,086,403 969,755 -10.7 10,541
Networked Products & ServicesCustomers 570,249 580,633 +1.8 6,311 Intersegment 24,690 25,511 278 Total 594,939 606,144 +1.9 6,589
B2B & Disc ManufacturingCustomers 113,194 114,470 +1.1 1,244 Intersegment 31,070 29,009 316 Total 144,264 143,479 -0.5 1,560
PicturesCustomers 175,117 203,190 +16.0 2,209 Intersegment — — — Total 175,117 203,190 +16.0 2,209
MusicCustomers 154,342 160,813 +4.2 1,748 Intersegment 5,893 2,662 29 Total 160,235 163,475 +2.0 1,777
Financial ServicesCustomers 99,558 202,580 +103.5 2,202 Intersegment 3,526 3,027 33 Total 103,084 205,607 +99.5 2,235
All OtherCustomers 78,535 77,557 -1.2 843 Intersegment — — — Total 78,535 77,557 -1.2 843
Corporate and elimination (187,993) (131,342) - (1,429) Consolidated total \ 2,154,584 \ 2,237,865 +3.9 % $ 24,325
Consumer Products & Devices ("CPD") intersegment amounts primarily consist of transactions with the Networked Products & Services ("NPS") segment.NPS intersegment amounts primarily consist of transactions with the CPD segment.B2B & Disc Manufacturing intersegment amounts primarily consist of transactions with the NPS, Pictures and Music segments.Corporate and elimination includes certain brand, patent and royalty income.
Operating income (loss)Consumer Products & Devices \ (19,827) \ 49,432 - % $ 537 Networked Products & Services (5,855) 19,399 - 211 B2B & Disc Manufacturing 8,305 10,089 +21.5 110 Pictures 12,949 14,121 +9.1 153 Music 21,359 23,119 +8.2 251 Financial Services (37,399) 35,045 - 381 Equity in net loss of Sony Ericsson (11,451) (10,227) - (111) All Other 2,011 1,530 -23.9 17 Total (29,908) 142,508 - 1,549
Corporate and elimination 11,946 3,595 -69.9 39 Consolidated total \ (17,962) \ 146,103 - % $ 1,588
The 2008 segment disclosure above has been restated to reflect the change in business segment classification discussed in Note 15.Operating income (loss) is Sales and operating revenue less Costs and expenses, and includes Equity in net income (loss) of affiliated companies. Corporate and elimination includes certain restructuring costs and other corporate expenses, which are related principally to headquartersand are not allocated to each segment.As a result of a modification of internal management reporting during the three months ended December 31, 2009, certain amountspreviously included within corporate and elimination have been reclassified into the segment operating income (loss) for all periods presented.
The revision had no impact on the consolidated results.
Change 2009
(Millions of yen, millions of U.S. dollars)Three months ended December 31
2008 2009
2008 2009 2009Change
F-5

Business Segment Information
Sales and operating revenueConsumer Products & Devices
Customers \ 3,000,995 \ 2,278,231 -24.1 % $ 24,763 Intersegment 409,614 264,822 2,879 Total 3,410,609 2,543,053 -25.4 27,642
Networked Products & ServicesCustomers 1,390,928 1,155,139 -17.0 12,556 Intersegment 63,566 50,459 548 Total 1,454,494 1,205,598 -17.1 13,104
B2B & Disc ManufacturingCustomers 366,181 299,043 -18.3 3,250 Intersegment 71,379 68,077 740 Total 437,560 367,120 -16.1 3,990
PicturesCustomers 530,834 509,646 -4.0 5,540 Intersegment — — — Total 530,834 509,646 -4.0 5,540
MusicCustomers 248,519 388,613 +56.4 4,224 Intersegment 17,627 8,161 89 Total 266,146 396,774 +49.1 4,313
Financial ServicesCustomers 375,409 625,238 +66.5 6,796 Intersegment 11,403 10,022 109 Total 386,812 635,260 +64.2 6,905
All OtherCustomers 240,589 201,358 -16.3 2,189 Intersegment — — — Total 240,589 201,358 -16.3 2,189
Corporate and elimination (521,111) (359,881) - (3,912) Consolidated total \ 6,205,933 \ 5,498,928 -11.4 % $ 59,771
Consumer Products & Devices ("CPD") intersegment amounts primarily consist of transactions with the Networked Products & Services ("NPS") segment.NPS intersegment amounts primarily consist of transactions with the CPD segment.B2B & Disc Manufacturing intersegment amounts primarily consist of transactions with the NPS, Pictures and Music segments.Corporate and elimination includes certain brand, patent and royalty income.
Operating income (loss)Consumer Products & Devices \ 89,972 \ 54,299 -39.6 % $ 590 Networked Products & Services (46,617) (76,066) - (827) B2B & Disc Manufacturing 27,881 (5,640) - (61) Pictures 15,674 9,543 -39.1 104 Music 27,098 37,121 +37.0 403 Financial Services (32,101) 116,056 - 1,261 Equity in net loss of Sony Ericsson (12,450) (35,570) - (387) All Other 5,358 1,321 -75.3 16 Total 74,815 101,064 +35.1 1,099
Corporate and elimination (8,290) (13,253) - (145) Consolidated total \ 66,525 \ 87,811 +32.0 % $ 954
The 2008 segment disclosure above has been restated to reflect the change in business segment classification discussed in Note 15.Operating income (loss) is Sales and operating revenue less Costs and expenses, and includes Equity in net income (loss) of affiliated companies. Corporate and elimination includes certain restructuring costs and other corporate expenses, which are related principally to headquartersand are not allocated to each segment.As a result of a modification of internal management reporting during the three months ended December 31, 2009, certain amountspreviously included within corporate and elimination have been reclassified into the segment operating income (loss) for all periods presented.
The revision had no impact on the consolidated results.
Change 2009
(Millions of yen, millions of U.S. dollars)Nine months ended December 31
2008 2009
2008 2009 2009Change
F-6

Sales to Customers by Product Category
Sales and operating revenue (to external customers)
Consumer Products & DevicesTelevisions \ 372,701 \ 346,432 -7.0 % $ 3,766 Digital Imaging 208,396 188,384 -9.6 2,048 Audio and Video 172,731 163,339 -5.4 1,775 Semiconductors 70,483 68,721 -2.5 747 Components 139,648 115,562 -17.2 1,256 Other 1,994 2,487 +24.7 27 Total 965,953 884,925 -8.4 9,619
Networked Products & ServicesGame 369,609 355,221 -3.9 3,861 PC and Other Networked Businesses 200,640 225,412 +12.3 2,450 Total 570,249 580,633 +1.8 6,311
B2B & Disc Manufacturing 113,194 114,470 +1.1 1,244 Pictures 175,117 203,190 +16.0 2,209 Music 154,342 160,813 +4.2 1,748 Financial Services 99,558 202,580 +103.5 2,202 All Other 78,535 77,557 -1.2 843 Corporate (2,364) 13,697 - 149
Consolidated total \ 2,154,584 \ 2,237,865 +3.9 % $ 24,325
Sales and operating revenue (to external customers)
Consumer Products & DevicesTelevisions \ 1,048,680 \ 803,052 -23.4 % $ 8,729 Digital Imaging 737,089 543,494 -26.3 5,908 Audio and Video 460,515 373,908 -18.8 4,064 Semiconductors 227,140 198,618 -12.6 2,159 Components 519,111 353,807 -31.8 3,846 Other 8,460 5,352 -36.7 57 Total 3,000,995 2,278,231 -24.1 24,763
Networked Products & ServicesGame 830,028 662,550 -20.2 7,202 PC and Other Networked Businesses 560,900 492,589 -12.2 5,354 Total 1,390,928 1,155,139 -17.0 12,556
B2B & Disc Manufacturing 366,181 299,043 -18.3 3,250 Pictures 530,834 509,646 -4.0 5,540 Music 248,519 388,613 +56.4 4,224 Financial Services 375,409 625,238 +66.5 6,796 All Other 240,589 201,358 -16.3 2,189 Corporate 52,478 41,660 -20.6 453
Consolidated total \ 6,205,933 \ 5,498,928 -11.4 % $ 59,771
The above table includes a breakdown of CPD segment and NPS segment sales and operating revenue to customers in the Business Segment Information on page F-5 and F-6.Sony management views the CPD segment and the NPS segment as single operating segments. However, Sony believes that the breakdown of CPDsegment and NPS segment sales and operating revenue to customers in this table is useful to investors in understanding sales by the product categoryin these business segments. Additionally, Sony realigned its product category configuration from the first quarter of the fiscal year ending March 31, 2010 to reflect the segment reclassification. In connection with the realignment, all prior period sales amounts by product category in the table above have been restated to conform to the current presentation. In the CPD segment Televisions includes LCD televisions; Digital Imaging includes compact digital cameras, digital SLR cameras and video cameras; Audio and Video includes home audio, Blu-ray disc players and recorders; Semiconductors includes image sensors and small and medium sized LCD panels; and Components includes batteries, recording media and datarecording systems. In the NPS segment Game includes game consoles and software; PC and Other Networked Businesses includes personal computers and memory-based portable audio devices.
(Millions of yen, millions of U.S. dollars)Nine months ended December 31
2008 2009 Change 2009
(Millions of yen, millions of U.S. dollars)Three months ended December 31
2008 2009 Change 2009
F-7

Geographic Segment Information
Sales and operating revenue (to external customers)Japan \ 482,649 \ 584,359 +21.1 % $ 6,352 United States 542,185 524,511 -3.3 5,701 Europe 654,613 592,571 -9.5 6,441 Other Areas 475,137 536,424 +12.9 5,831 Total \ 2,154,584 \ 2,237,865 +3.9 % $ 24,325
Sales and operating revenue (to external customers)Japan \ 1,420,814 \ 1,570,690 +10.5 % $ 17,073 United States 1,471,527 1,229,085 -16.5 13,360 Europe 1,635,720 1,285,765 -21.4 13,976 Other Areas 1,677,872 1,413,388 -15.8 15,362 Total \ 6,205,933 \ 5,498,928 -11.4 % $ 59,771
Classification of Geographic Segment Information shows sales and operating revenue recognized by location of customers.
(Millions of yen, millions of U.S. dollars)Nine months ended December 31
2008 2009 Change 2009
(Millions of yen, millions of U.S. dollars)Three months ended December 31
2008 2009 Change 2009
F-8

Condensed Financial Services Financial Statements
The results of the Financial Services segment are included in Sony’s consolidated financial statements. The following schedules showunaudited condensed financial statements for the Financial Services segment and all other segments excluding Financial Services.These presentations are not in accordance with U.S. GAAP, which is used by Sony to prepare its consolidated financial statements. However, because the Financial Services segment is different in nature from Sony’s other segments, Sony believes that a comparativepresentation may be useful in understanding and analyzing Sony’s consolidated financial statements. Transactions between the Financial Services segment and Sony without Financial Services are eliminated in the consolidated figures shown below.
Condensed Balance Sheet
Financial Services
Current assets:Cash and cash equivalents \ 281,049 \ 261,784 $ 2,845 \ 95,794 Call loan in the banking business 125,062 56,841 618 49,909 Marketable securities 527,209 522,920 5,684 463,809 Other 280,444 195,379 2,124 221,633
1,213,764 1,036,924 11,271 831,145
Investments and advances 4,144,033 4,810,524 52,288 4,510,668 Property, plant and equipment 30,406 35,234 383 30,778 Other assets:
Deferred insurance acquisition costs 398,219 413,001 4,489 400,412 Other 125,037 111,992 1,218 132,654
523,256 524,993 5,707 533,066 \ 5,911,459 \ 6,407,675 $ 69,649 \ 5,905,657
Current liabilities:Short-term borrowings \ 71,726 \ 81,386 $ 885 \ 65,636 Notes and accounts payable, trade 19,846 16,170 176 16,855 Deposits from customers in the banking business 1,339,213 1,441,851 15,672 1,326,360 Other 145,634 169,596 1,843 143,781
1,576,419 1,709,003 18,576 1,552,632
Long-term debt 103,015 80,724 877 97,296 Future insurance policy benefits and other 3,462,544 3,793,842 41,237 3,521,060 Other 193,888 169,874 1,848 168,409 Total liabilities 5,335,866 5,753,443 62,538 5,339,397
Equity:Sony Corporation's stockholders' equity 574,533 652,931 7,097 565,135 Noncontrolling interests 1,060 1,301 14 1,125 Total equity 575,593 654,232 7,111 566,260
\ 5,911,459 \ 6,407,675 $ 69,649 \ 5,905,657
LIABILITIES AND EQUITY
2008 2009December 31
ASSETS
(Millions of yen, millions of U.S. dollars)
2009 2009March 31
F-9

Sony without Financial Services
Current assets:Cash and cash equivalents \ 505,714 \ 743,001 $ 8,077 \ 564,995 Marketable securities 3,108 3,309 36 3,103 Notes and accounts receivable, trade 1,210,688 1,166,622 12,681 847,214 Other 1,833,995 1,300,022 14,129 1,426,045
3,553,505 3,212,954 34,923 2,841,357
Film costs 295,801 323,849 3,520 306,877 Investments and advances 366,674 375,984 4,087 339,389 Investments in Financial Services, at cost 116,843 116,843 1,270 116,843 Property, plant and equipment 1,147,703 1,051,649 11,431 1,145,085 Other assets 1,438,082 1,574,436 17,114 1,621,396
\ 6,918,608 \ 6,655,715 $ 72,345 \ 6,370,947
Current liabilities:Short-term borrowings \ 491,235 \ 293,829 $ 3,194 \ 431,536 Notes and accounts payable, trade 834,472 719,471 7,820 546,125 Other 1,445,678 1,331,524 14,473 1,336,947
2,771,385 2,344,824 25,487 2,314,608
Long-term debt 605,296 898,839 9,770 585,636 Accrued pension and severance costs 220,100 328,652 3,572 354,817 Other 324,115 313,161 3,405 348,684 Total liabilities 3,920,896 3,885,476 42,234 3,603,745
Equity:Sony Corporation's stockholders' equity 2,951,145 2,718,755 29,552 2,727,562 Noncontrolling interests 46,567 51,484 559 39,640 Total equity 2,997,712 2,770,239 30,111 2,767,202
\ 6,918,608 \ 6,655,715 $ 72,345 \ 6,370,947
Consolidated
Current assets:Cash and cash equivalents \ 786,763 \ 1,004,785 $ 10,922 \ 660,789 Call loan in the banking business 125,062 56,841 618 49,909 Marketable securities 530,317 526,229 5,720 466,912 Notes and accounts receivable, trade 1,215,530 1,172,570 12,745 853,454 Other 2,060,331 1,451,927 15,781 1,589,571
4,718,003 4,212,352 45,786 3,620,635
Film costs 295,801 323,849 3,520 306,877 Investments and advances 4,454,450 5,140,549 55,876 4,798,430 Property, plant and equipment 1,178,109 1,086,883 11,814 1,175,863 Other assets:
Deferred insurance acquisition costs 398,219 413,001 4,489 400,412 Other 1,518,302 1,645,216 17,883 1,711,294
1,916,521 2,058,217 22,372 2,111,706 \ 12,562,884 \ 12,821,850 $ 139,368 \ 12,013,511
Current liabilities:Short-term borrowings \ 512,265 \ 338,665 $ 3,681 \ 451,155 Notes and accounts payable, trade 852,284 734,324 7,982 560,795 Deposits from customers in the banking business 1,339,213 1,441,851 15,672 1,326,360 Other 1,584,760 1,495,258 16,253 1,472,590
4,288,522 4,010,098 43,588 3,810,900
Long-term debt 685,005 966,328 10,504 660,147 Accrued pension and severance costs 227,808 340,345 3,699 365,706 Future insurance policy benefits and other 3,462,544 3,793,842 41,237 3,521,060 Other 442,560 403,627 4,388 439,096 Total liabilities 9,106,439 9,514,240 103,416 8,796,909
Equity:Sony Corporation's stockholders' equity 3,195,722 3,005,136 32,665 2,964,653 Noncontrolling interests 260,723 302,474 3,287 251,949 Total equity 3,456,445 3,307,610 35,952 3,216,602
\ 12,562,884 \ 12,821,850 $ 139,368 \ 12,013,511
ASSETS
ASSETS
LIABILITIES AND EQUITY
2008December 31
2009
LIABILITIES AND EQUITY
(Millions of yen, millions of U.S. dollars)
2009 2009March 31
(Millions of yen, millions of U.S. dollars)
2008 2009 2009 2009March 31December 31
F-10

Condensed Statements of Income
Financial Services
Financial service revenue \ 103,084 \ 205,607 +99.5 % $ 2,235 Financial service expenses 140,136 170,243 +21.5 1,851 Equity in net loss of affiliated companies (347) (319) - (3) Operating income (loss) (37,399) 35,045 - 381 Other income (expenses), net (81) (41) - (1)Income (loss) before income taxes (37,480) 35,004 - 380 Income taxes and other (14,856) 12,303 - 133
Sony without Financial Services
Net sales and operating revenue \ 2,056,085 \ 2,037,360 -0.9 % $ 22,145 Costs and expenses 2,026,577 1,921,097 -5.2 20,881 Equity in net loss of affiliated companies (10,462) (5,608) - (61) Operating income 19,046 110,655 +481.0 1,203 Other income (expenses), net 84,934 (21,745) - (237) Income before income taxes 103,980 88,910 -14.5 966 Income taxes and other 79,918 23,151 -71.0 251
Consolidated
Financial service revenue \ 99,558 \ 202,580 +103.5 % $ 2,202 Net sales and operating revenue 2,055,026 2,035,285 -1.0 22,123
2,154,584 2,237,865 +3.9 24,325 Costs and expenses 2,161,737 2,085,835 -3.5 22,673 Equity in net loss of affiliated companies (10,809) (5,927) - (64) Operating income (loss) (17,962) 146,103 - 1,588 Other income (expenses), net 84,413 (22,238) - (242) Income before income taxes 66,451 123,865 +86.4 1,346 Income taxes and other 56,042 44,698 -20.2 485
10,409 \ 79,167
Three months ended December 31
+660.6
2009
% $
Change
861
$
2009
(Millions of yen, millions of U.S. dollars)
+173.3
$
24,062
247 -
\ 715
(22,624)
2008 2009 2009
Net income (loss) attributable to Sony Corporation's stockholders
Net income attributable to Sony Corporation's stockholders
22,701 %
%
Net income attributable to Sony Corporation's stockholders
\
\
\
2008
Three months ended December 31(Millions of yen, millions of U.S. dollars)
Change
\
65,759
(Millions of yen, millions of U.S. dollars)Three months ended December 31
2008 2009 2009Change
F-11

Financial Services
Financial service revenue \ 386,812 \ 635,260 +64.2 % $ 6,905 Financial service expenses 417,498 518,254 +24.1 5,634 Equity in net loss of affiliated companies (1,415) (950) - (10) Operating income (loss) (32,101) 116,056 - 1,261 Other income (expenses), net 117 (863) - (9)Income (loss) before income taxes (31,984) 115,193 - 1,252 Income taxes and other (10,779) 39,724 - 432
Sony without Financial Services
Net sales and operating revenue \ 5,834,522 \ 4,878,768 -16.4 % $ 53,030 Costs and expenses 5,730,921 4,875,831 -14.9 52,998 Equity in net loss of affiliated companies (6,009) (32,382) - (352) Operating income (loss) 97,592 (29,445) - (320) Other income (expenses), net 75,095 (7,841) - (85) Income (loss) before income taxes 172,687 (37,286) - (405) Income taxes and other 89,660 (15,416) - (167)
Consolidated
Financial service revenue \ 375,409 \ 625,238 +66.5 % $ 6,796 Net sales and operating revenue 5,830,524 4,873,690 -16.4 52,975
6,205,933 5,498,928 -11.4 59,771 Costs and expenses 6,131,984 5,377,785 -12.3 58,455 Equity in net loss of affiliated companies (7,424) (33,332) - (362) Operating income 66,525 87,811 +32.0 954 Other income (expenses), net 70,155 (13,916) - (151) Income before income taxes 136,680 73,895 -45.9 803 Income taxes and other 70,478 58,129 -17.5 632
2008 2009
-
(Millions of yen, millions of U.S. dollars)Nine months ended December 31
2008 2009 2009Change
\Net income (loss) attributable to Sony Corporation's stockholders
Net income (loss) attributable to Sony Corporation's stockholders
Net income attributable to Sony Corporation's stockholders
\
\
\
2008
Nine months ended December 31(Millions of yen, millions of U.S. dollars)
(21,205) 820 -
\ (21,870)
2009
Change 2009
75,469
(Millions of yen, millions of U.S. dollars)
-76.2
(238)
% $
2009 Change
171
% $
% $83,027
66,202 \ 15,766
Nine months ended December 31
F-12
Condensed Statements of Cash Flows
Financial Services
Net cash provided by operating activities \ 176,527 \ 262,599 $ 2,854 Net cash used in investing activities (300,550) (272,510) (2,962) Net cash provided by financing activities 267,351 175,901 1,912 Net increase in cash and cash equivalents 143,328 165,990 1,804 Cash and cash equivalents at beginning of the fiscal year 137,721 95,794 1,041 Cash and cash equivalents at the end of the period \ 281,049 \ 261,784 $ 2,845
Sony without Financial Services
Net cash provided by (used in) operating activities \ (208,402) \ 285,488 $ 3,103 Net cash used in investing activities (308,652) (249,262) (2,709) Net cash provided by financing activities 125,103 151,638 1,648 Effect of exchange rate changes on cash and cash equivalents (51,045) (9,858) (106) Net increase (decrease) in cash and cash equivalents (442,996) 178,006 1,936 Cash and cash equivalents at beginning of the fiscal year 948,710 564,995 6,141 Cash and cash equivalents at the end of the period \ 505,714 \ 743,001 $ 8,077
Consolidated
Net cash provided by (used in) operating activities \ (34,967) \ 542,318 $ 5,895 Net cash used in investing activities (596,625) (538,740) (5,856) Net cash provided by financing activities 382,969 350,276 3,807 Effect of exchange rate changes on cash and cash equivalents (51,045) (9,858) (106) Net increase (decrease) in cash and cash equivalents (299,668) 343,996 3,740 Cash and cash equivalents at beginning of the fiscal year 1,086,431 660,789 7,182 Cash and cash equivalents at the end of the period \ 786,763 \ 1,004,785 $ 10,922
(Millions of yen, millions of U.S. dollars)Nine months ended December 31
2008 2009 2009
2008 2009 2009
(Millions of yen, millions of U.S. dollars)Nine months ended December 31
2009 20092008
Nine months ended December 31(Millions of yen, millions of U.S. dollars)
F-13
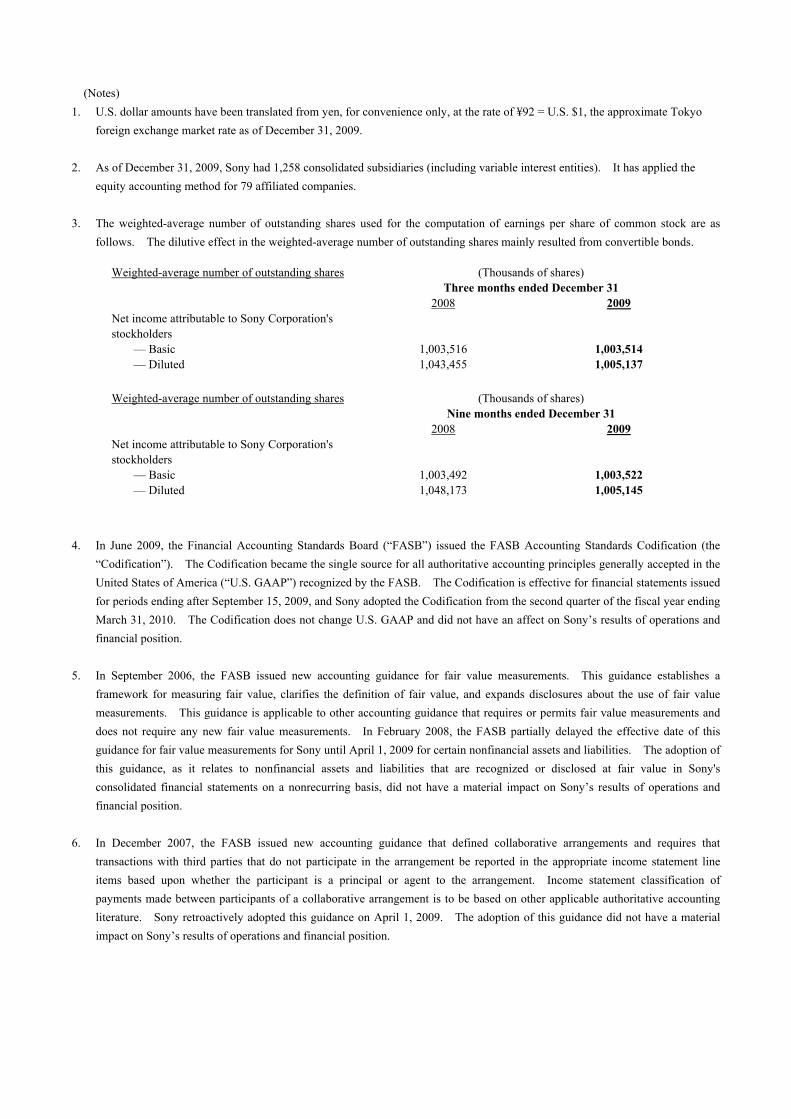
(Notes) 1. U.S. dollar amounts have been translated from yen, for convenience only, at the rate of ¥92 = U.S. $1, the approximate Tokyo
foreign exchange market rate as of December 31, 2009. 2. As of December 31, 2009, Sony had 1,258 consolidated subsidiaries (including variable interest entities). It has applied the
equity accounting method for 79 affiliated companies. 3. The weighted-average number of outstanding shares used for the computation of earnings per share of common stock are as
follows. The dilutive effect in the weighted-average number of outstanding shares mainly resulted from convertible bonds.
Weighted-average number of outstanding shares (Thousands of shares) Three months ended December 31 2008 2009 Net income attributable to Sony Corporation's stockholders
— Basic 1,003,516 1,003,514 — Diluted 1,043,455 1,005,137
Weighted-average number of outstanding shares (Thousands of shares) Nine months ended December 31 2008 2009 Net income attributable to Sony Corporation's stockholders
— Basic 1,003,492 1,003,522 — Diluted 1,048,173 1,005,145
4. In June 2009, the Financial Accounting Standards Board (“FASB”) issued the FASB Accounting Standards Codification (the
“Codification”). The Codification became the single source for all authoritative accounting principles generally accepted in the United States of America (“U.S. GAAP”) recognized by the FASB. The Codification is effective for financial statements issued for periods ending after September 15, 2009, and Sony adopted the Codification from the second quarter of the fiscal year ending March 31, 2010. The Codification does not change U.S. GAAP and did not have an affect on Sony’s results of operations and financial position.
5. In September 2006, the FASB issued new accounting guidance for fair value measurements. This guidance establishes a
framework for measuring fair value, clarifies the definition of fair value, and expands disclosures about the use of fair value measurements. This guidance is applicable to other accounting guidance that requires or permits fair value measurements and does not require any new fair value measurements. In February 2008, the FASB partially delayed the effective date of this guidance for fair value measurements for Sony until April 1, 2009 for certain nonfinancial assets and liabilities. The adoption of this guidance, as it relates to nonfinancial assets and liabilities that are recognized or disclosed at fair value in Sony's consolidated financial statements on a nonrecurring basis, did not have a material impact on Sony’s results of operations and financial position.
6. In December 2007, the FASB issued new accounting guidance that defined collaborative arrangements and requires that
transactions with third parties that do not participate in the arrangement be reported in the appropriate income statement line items based upon whether the participant is a principal or agent to the arrangement. Income statement classification of payments made between participants of a collaborative arrangement is to be based on other applicable authoritative accounting literature. Sony retroactively adopted this guidance on April 1, 2009. The adoption of this guidance did not have a material impact on Sony’s results of operations and financial position.

7. In December 2007, the FASB issued new accounting guidance for business combinations, which applies prospectively to Sony for business combinations for which the acquisition date is on or after April 1, 2009. This guidance requires that the acquisition method of accounting be applied to a broader range of business combinations, amends the definition of a business combination, provides a definition of a business, requires an acquirer to recognize an acquired business at its fair value at the acquisition date, and requires the assets acquired and liabilities assumed in a business combination to be measured and recognized at their fair values as of the acquisition date, with limited exceptions. Also, under this guidance, changes in deferred tax asset valuation allowances and acquired income tax uncertainties after the acquisition date generally will affect income tax expense in periods subsequent to the acquisition date. Adjustments made to valuation allowances on deferred taxes and acquired tax contingencies associated with acquisitions that closed prior to April 1, 2009 would also apply the provisions of this guidance. The adoption of this guidance did not have a material impact on Sony’s results of operations and financial position.
8. In December 2007, the FASB issued new accounting guidance for noncontrolling interests in consolidated financial statements.
This guidance requires that the noncontrolling interests in the equity of a subsidiary be accounted for and reported as equity, provides revised guidance on the treatment of net income and losses attributable to the noncontrolling interests and changes in ownership interests in a subsidiary and requires additional disclosures that identify and distinguish between the interests of the controlling and noncontrolling owners. As required, Sony adopted this guidance on April 1, 2009, via retrospective application of the presentation and disclosure requirements. Upon the adoption of this guidance, noncontrolling interests, which were previously referred to as minority interest and classified between total liabilities and stockholders’ equity on the consolidated balance sheets, are now included as a separate component of total equity. In addition, the net income (loss) on the consolidated statements of income now includes the net income (loss) attributable to noncontrolling interests. Consistent with the retrospective application required by this guidance, the prior year amounts in the consolidated financial statements have been reclassified or adjusted to conform to the current presentation. The adoption of this guidance did not have a material impact on Sony’s results of operations and financial position.
9. In April 2008, the FASB issued new accounting guidance for the determination of the useful life of intangible assets, which
amends the list of factors an entity should consider in developing renewal or extension assumptions used in determining the useful life of recognized intangible assets. This guidance applies to (1) intangible assets that are acquired individually or with a group of other assets and (2) intangible assets acquired in both business combinations and asset acquisitions. Under this guidance, entities estimating the useful life of a recognized intangible asset must consider their historical experience in renewing or extending similar arrangements or, in the absence of historical experience, must consider assumptions that market participants would use about renewal or extension. For Sony, this guidance will require certain additional disclosures in the periods after the effective date of April 1, 2009, and application to useful life estimates prospectively for intangible assets acquired after March 31, 2009. The adoption of this guidance did not have a material impact on Sony’s results of operations and financial position.
10. In November 2008, the FASB issued new accounting guidance, which addresses certain effects that the guidance for business
combinations and noncontrolling interests in consolidated financial statements has on an entity’s accounting for equity-method investments. This guidance indicates, among other things, that transaction costs for an investment should be included in the cost of the equity-method investment (and not expensed) and shares subsequently issued by the equity-method investee that reduce the investor’s ownership percentage should be accounted for as if the investor had sold a proportionate share of its investment, with gains or losses recorded through earnings. Sony adopted this guidance on April 1, 2009. The adoption of this guidance did not have a material impact on Sony’s results of operations and financial position.
11. In April 2009, the FASB issued new accounting guidance for assets acquired and liabilities assumed in a business combination
that arise from contingencies. This guidance addresses the initial recognition, measurement and subsequent accounting for assets and liabilities arising from contingencies in a business combination, and requires that such assets acquired or liabilities assumed be initially recognized at fair value at the acquisition date if fair value can be determined during the measurement period. If the acquisition-date fair value cannot be determined, the asset acquired or liability assumed arising from a contingency is recognized only if certain criteria are met. For Sony, this guidance is effective for assets acquired or liabilities assumed arising from contingencies in business combinations for which the acquisition date is on or after April 1, 2009. The adoption of this guidance did not have a material impact on Sony’s results of operations and financial position.

12. In April 2009, the FASB issued new accounting guidance for the recognition and presentation of other-than-temporary impairments for debt securities. This guidance is intended to provide greater clarity to investors about the credit and noncredit component of an other-than-temporary impairment event and to more effectively communicate when an other-than-temporary impairment event has occurred. This guidance applies to debt securities only and requires the separate display of losses related to credit deterioration and losses related to other market factors. When an entity does not intend to sell a debt security and it is more likely than not that the entity will not have to sell the debt security before recovery of its cost basis, it must recognize the credit component of an other-than-temporary impairment in earnings and the remaining portion in other comprehensive income. In addition, upon adoption of this guidance, an entity is required to record a cumulative-effect adjustment as of the beginning of the period of adoption to reclassify the noncredit component of a previously recognized other-than-temporary impairment from retained earnings to accumulated other comprehensive income. Sony adopted this guidance on April 1, 2009. The adoption of this guidance did not have a material impact on Sony’s results of operations and financial position.
13. In April 2009, the FASB issued new accounting guidance for determining fair value when there is no active market for an asset or
when the pricing inputs used in determining the fair value of an asset represent a distressed sale. This guidance also reaffirms that the objective of fair value measurement is to reflect an asset’s sale price in an orderly transaction at the date of the financial statements. This guidance was effective for Sony as of April 1, 2009, and was applied prospectively. The adoption of this guidance did not have a material impact on Sony’s results of operations and financial position.
14. In May 2009, the FASB issued new accounting guidance for subsequent events, the objective of which was to establish general
standards of accounting for and disclosure of events that occur after the balance sheet date but before financial statements are issued or are available to be issued. This guidance sets forth: (1) the period after the balance sheet date during which management of a reporting entity should evaluate events or transactions that may occur for potential recognition or disclosure in the financial statements; (2) the circumstances under which an entity should recognize events or transactions occurring after the balance sheet date in its financial statements; and (3) the disclosures that an entity should make about events or transactions that occurred after the balance sheet date. This guidance was effective for Sony from the first quarter of the fiscal year ending March 31, 2010, and its adoption did not have a material impact on Sony’s results of operations and financial position.
15. Sony realigned its reportable segments effective from the first quarter of the fiscal year ending March 31, 2010 to reflect Sony’s
reorganization as of April 1, 2009, primarily repositioning operations previously reported within the Electronics and Game segments and establishing the Consumer Products & Devices, Networked Products & Services and B2B & Disc Manufacturing segments. The Consumer Products & Devices segment includes products such as televisions, digital imaging, audio and video, semiconductors, and components. The equity results of S-LCD Corporation, a joint-venture with Samsung Electronics Co., Ltd., are also included within the Consumer Products & Devices segment. The Networked Products & Services segment includes game products as well as PC and other networked products. The B2B & Disc Manufacturing segment is comprised of the B2B business, including broadcast and professional-use products, as well as the Blu-ray Disc™, DVD and CD disc manufacturing business. Additionally, Music is a new segment effective from the first quarter of the fiscal year ending March 31, 2010. The Music segment includes Sony Music Entertainment, Sony Music Entertainment (Japan) Inc., and a 50% owned U.S. based joint-venture in the music publishing business, Sony/ATV Music Publishing LLC. For the nine months ended December 31, 2008, the Music segment’s operating income includes the equity results for SONY BMG MUSIC ENTERTAINMENT that were recorded through the six months ended September 30, 2008. The equity earnings from Sony Ericsson Mobile Communications AB are presented as a separate segment and were previously included in the Electronics segment. All Other consists of various operating activities, including So-net Entertainment Corporation and an advertising agency business in Japan. In connection with the realignment, all prior period amounts in the segment disclosures have been restated to conform to the current presentation.
16. Sony estimates the annual effective tax rate (“ETR”) derived from a projected annual net income before taxes and calculates
interim period income tax provision based on the year-to-date income tax provision computed by applying the ETR to the year-to-date net income before taxes at the end of each interim period. The income tax provision based on the ETR reflects anticipated income tax credits and net operating loss carryforwards; however, it excludes income tax provision related to significant unusual or extraordinary transactions. Such income tax provision will be separately reported from the provision based on the ETR in the interim period in which they occur.

Other Consolidated Financial Data (Millions of yen, millions of U.S. dollars) Three months ended December 31 2008 2009 Change 2009Capital expenditures (additions to property, plant and equipment) ¥ 73,596 ¥ 43,681 -40.6% $ 475Depreciation and amortization expenses* 105,559 95,039 -10.0 1,033(Depreciation expenses for property, plant and equipment) (73,043) (66,144) -9.4 (719)Research and development expenses 117,121 106,733 -8.9 1,160 Nine months ended December 31 2008 2009 Change 2009Capital expenditures (additions to property, plant and equipment) ¥ 258,347 ¥ 148,785 -42.4% $ 1,617Depreciation and amortization expenses* 300,585 276,065 -8.2 3,001(Depreciation expenses for property, plant and equipment) (215,271) (194,953) -9.4 (2,119)Research and development expenses 373,711 315,714 -15.5 3,432 * Including amortization expenses for intangible assets and for deferred insurance acquisition costs