news release - anglo american plc/media/files/a/anglo-american-plc-v2/press... · news release 29...
TRANSCRIPT
NEWS RELEASE
29 January 2014
Anglo American plc Production Report for the fourth quarter ended 31 December 2013
Overview
Kumba Iron Ore production increased by 25% to 11.3 Mt following the strike in Q4 2012
Export metallurgical coal production increased by 3% to 4.7 Mt due to sustained longwall productivity improvements
Export thermal coal production increased by 8% to 7.9 Mt. Export thermal coal production from South Africa decreased by 1% to 4.6 Mt. Cerrejón production increased by 24% to 3.3 Mt, maintaining the strong recovery following the strike in Q1 2013
Copper production(1) increased by 24% to a record 214,400 tonnes, driven by continued strong performance at Los Bronces, and higher grades at Collahuasi
Nickel(2) production increased by 38% to 10,200 tonnes. Higher production at Barro Alto was driven by improved operational stability of the furnaces
Niobium production increased by 20% to 1,200 tonnes, reflecting operational improvements at the plants and higher grades
Fertiliser production increased 2% due to increased plant availability
Platinum equivalent refined production increased by 25% to 520,300 ounces as a result of an increase in production from Mogalakwena, and the normalisation of production at Rustenburg (Bathopele, Siphumelele and Thembelani), Amandelbult (Dishaba and Tumela) and Union mines that were impacted by the illegal industrial action in 2012
The restructuring of Platinum has commenced with baseline production of 2.2 - 2.4 million ounces per annum, with 250,000 annualised low margin, high cost, and unprofitable ounces no longer in production
Diamond production increased by 13% to 9.1 million carats, primarily due to increased output from Jwaneng following the recovery after the slope failure in June 2012, together with higher grades at Orapa and Venetia
The Production Report for the fourth quarter ended 31 December 2013 is unaudited. Preliminary Results for the full year to 31 December 2013 will be announced on 14 February 2014.
(1) Copper production from the Copper business unit
(2) Nickel production from the Nickel business unit
2
IRON ORE AND MANGANESE
Iron Ore and Manganese Q4
2013 Q4
2012
Q4 2013 vs.
Q4 2012
Q3 2013
Q4 2013 vs.
Q3 2013
FY 2013
FY 2012
FY 2013 vs.
FY 2012
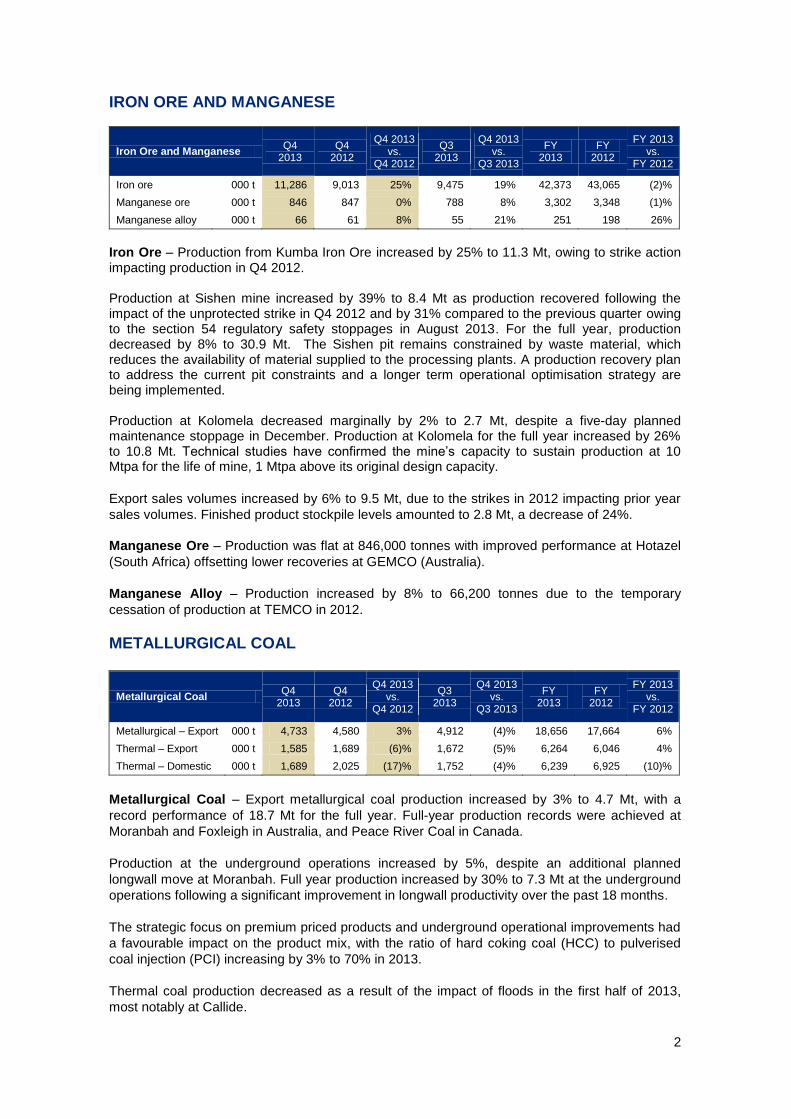
Iron ore 000 t 11,286 9,013 25% 9,475 19% 42,373 43,065 (2)%
Manganese ore 000 t 846 847 0% 788 8% 3,302 3,348 (1)%
Manganese alloy 000 t 66 61 8% 55 21% 251 198 26%
Iron Ore – Production from Kumba Iron Ore increased by 25% to 11.3 Mt, owing to strike action impacting production in Q4 2012. Production at Sishen mine increased by 39% to 8.4 Mt as production recovered following the impact of the unprotected strike in Q4 2012 and by 31% compared to the previous quarter owing to the section 54 regulatory safety stoppages in August 2013. For the full year, production decreased by 8% to 30.9 Mt. The Sishen pit remains constrained by waste material, which reduces the availability of material supplied to the processing plants. A production recovery plan to address the current pit constraints and a longer term operational optimisation strategy are being implemented. Production at Kolomela decreased marginally by 2% to 2.7 Mt, despite a five-day planned maintenance stoppage in December. Production at Kolomela for the full year increased by 26% to 10.8 Mt. Technical studies have confirmed the mine’s capacity to sustain production at 10 Mtpa for the life of mine, 1 Mtpa above its original design capacity.
Export sales volumes increased by 6% to 9.5 Mt, due to the strikes in 2012 impacting prior year
sales volumes. Finished product stockpile levels amounted to 2.8 Mt, a decrease of 24%.
Manganese Ore – Production was flat at 846,000 tonnes with improved performance at Hotazel
(South Africa) offsetting lower recoveries at GEMCO (Australia).
Manganese Alloy – Production increased by 8% to 66,200 tonnes due to the temporary
cessation of production at TEMCO in 2012.
METALLURGICAL COAL
Metallurgical Coal Q4
2013 Q4
2012
Q4 2013 vs.
Q4 2012
Q3 2013
Q4 2013 vs.
Q3 2013
FY 2013
FY 2012
FY 2013 vs.
FY 2012
Metallurgical – Export 000 t 4,733 4,580 3% 4,912 (4)% 18,656 17,664 6%
Thermal – Export 000 t 1,585 1,689 (6)% 1,672 (5)% 6,264 6,046 4%
Thermal – Domestic 000 t 1,689 2,025 (17)% 1,752 (4)% 6,239 6,925 (10)%
Metallurgical Coal – Export metallurgical coal production increased by 3% to 4.7 Mt, with a
record performance of 18.7 Mt for the full year. Full-year production records were achieved at
Moranbah and Foxleigh in Australia, and Peace River Coal in Canada.
Production at the underground operations increased by 5%, despite an additional planned
longwall move at Moranbah. Full year production increased by 30% to 7.3 Mt at the underground
operations following a significant improvement in longwall productivity over the past 18 months.
The strategic focus on premium priced products and underground operational improvements had
a favourable impact on the product mix, with the ratio of hard coking coal (HCC) to pulverised
coal injection (PCI) increasing by 3% to 70% in 2013.
Thermal coal production decreased as a result of the impact of floods in the first half of 2013,
most notably at Callide.
3
THERMAL COAL
Thermal Coal Q4
2013 Q4
2012
Q4 2013 vs.
Q4 2012
Q3 2013
Q4 2013 vs.
Q3 2013
FY 2013
FY 2012
FY 2013 vs.
FY 2012
South Africa
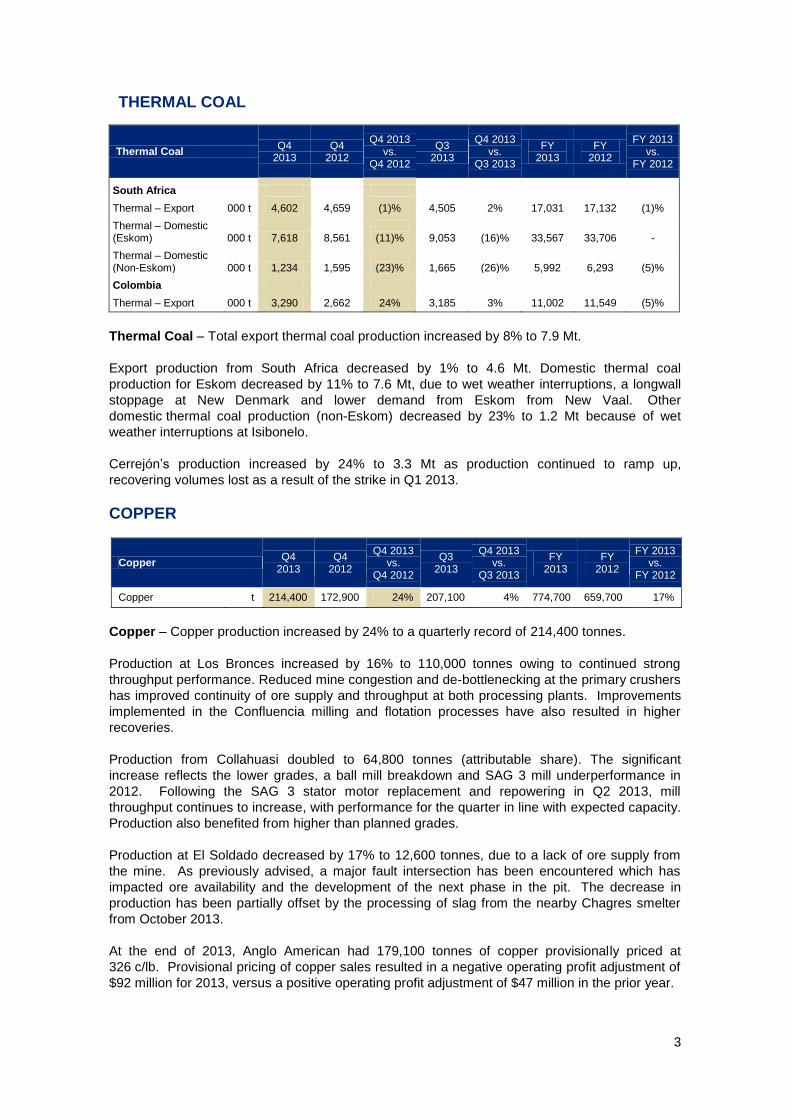
Thermal – Export 000 t 4,602 4,659 (1)% 4,505 2% 17,031 17,132 (1)%
Thermal – Domestic (Eskom) 000 t 7,618
8,561
(11)% 9,053 (16)% 33,567 33,706 -
Thermal – Domestic (Non-Eskom) 000 t 1,234
1,595
(23)% 1,665 (26)% 5,992 6,293 (5)%
Colombia
Thermal – Export 000 t 3,290 2,662 24% 3,185 3% 11,002 11,549 (5)%
Thermal Coal – Total export thermal coal production increased by 8% to 7.9 Mt.
Export production from South Africa decreased by 1% to 4.6 Mt. Domestic thermal coal
production for Eskom decreased by 11% to 7.6 Mt, due to wet weather interruptions, a longwall
stoppage at New Denmark and lower demand from Eskom from New Vaal. Other
domestic thermal coal production (non-Eskom) decreased by 23% to 1.2 Mt because of wet
weather interruptions at Isibonelo.
Cerrejón’s production increased by 24% to 3.3 Mt as production continued to ramp up,
recovering volumes lost as a result of the strike in Q1 2013.
COPPER
Copper Q4
2013 Q4
2012
Q4 2013 vs.
Q4 2012
Q3 2013
Q4 2013 vs.
Q3 2013
FY 2013
FY 2012
FY 2013 vs.
FY 2012
Copper t 214,400 172,900 24% 207,100 4% 774,700 659,700 17%
Copper – Copper production increased by 24% to a quarterly record of 214,400 tonnes.
Production at Los Bronces increased by 16% to 110,000 tonnes owing to continued strong
throughput performance. Reduced mine congestion and de-bottlenecking at the primary crushers
has improved continuity of ore supply and throughput at both processing plants. Improvements
implemented in the Confluencia milling and flotation processes have also resulted in higher
recoveries.
Production from Collahuasi doubled to 64,800 tonnes (attributable share). The significant
increase reflects the lower grades, a ball mill breakdown and SAG 3 mill underperformance in
2012. Following the SAG 3 stator motor replacement and repowering in Q2 2013, mill
throughput continues to increase, with performance for the quarter in line with expected capacity.
Production also benefited from higher than planned grades.
Production at El Soldado decreased by 17% to 12,600 tonnes, due to a lack of ore supply from
the mine. As previously advised, a major fault intersection has been encountered which has
impacted ore availability and the development of the next phase in the pit. The decrease in
production has been partially offset by the processing of slag from the nearby Chagres smelter
from October 2013.
At the end of 2013, Anglo American had 179,100 tonnes of copper provisionally priced at
326 c/lb. Provisional pricing of copper sales resulted in a negative operating profit adjustment of
$92 million for 2013, versus a positive operating profit adjustment of $47 million in the prior year.
4
NICKEL
Nickel Q4
2013 Q4
2012
Q4 2013 vs.
Q4 2012
Q3 2013
Q4 2013 vs.
Q3 2013
FY 2013
FY 2012
FY 2013 vs.
FY 2012
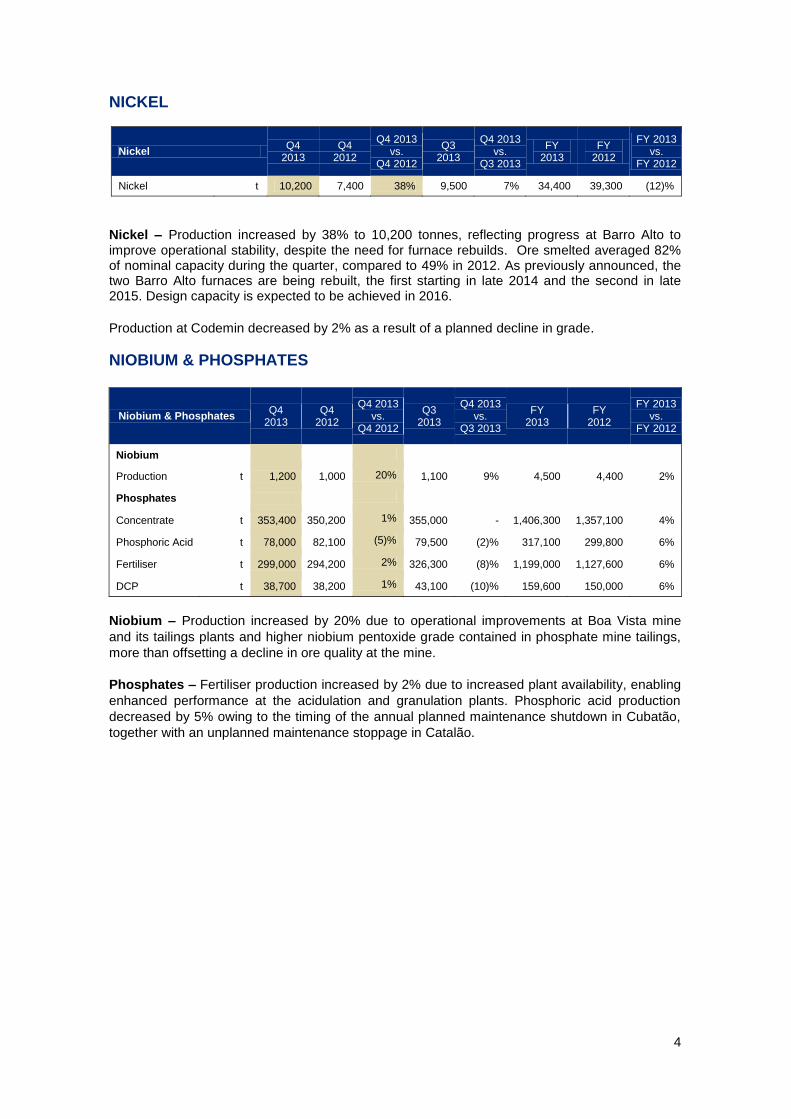
Nickel t 10,200 7,400 38% 9,500 7% 34,400 39,300 (12)%
Nickel – Production increased by 38% to 10,200 tonnes, reflecting progress at Barro Alto to improve operational stability, despite the need for furnace rebuilds. Ore smelted averaged 82% of nominal capacity during the quarter, compared to 49% in 2012. As previously announced, the two Barro Alto furnaces are being rebuilt, the first starting in late 2014 and the second in late 2015. Design capacity is expected to be achieved in 2016.
Production at Codemin decreased by 2% as a result of a planned decline in grade.
NIOBIUM & PHOSPHATES
Niobium & Phosphates Q4
2013 Q4
2012
Q4 2013 vs.
Q4 2012
Q3 2013
Q4 2013 vs.
Q3 2013
FY 2013
FY 2012
FY 2013 vs.
FY 2012
Niobium
Production t 1,200 1,000 20% 1,100 9% 4,500 4,400 2%
Phosphates
Concentrate t 353,400 350,200 1% 355,000 - 1,406,300 1,357,100 4%
Phosphoric Acid t 78,000 82,100 (5)% 79,500 (2)% 317,100 299,800 6%
Fertiliser t 299,000 294,200 2% 326,300 (8)% 1,199,000 1,127,600 6%
DCP t 38,700 38,200 1% 43,100 (10)% 159,600 150,000 6%
Niobium – Production increased by 20% due to operational improvements at Boa Vista mine
and its tailings plants and higher niobium pentoxide grade contained in phosphate mine tailings,
more than offsetting a decline in ore quality at the mine.
Phosphates – Fertiliser production increased by 2% due to increased plant availability, enabling
enhanced performance at the acidulation and granulation plants. Phosphoric acid production
decreased by 5% owing to the timing of the annual planned maintenance shutdown in Cubatão,
together with an unplanned maintenance stoppage in Catalão.
5
PLATINUM
Platinum Q4
2013 Q4
2012
Q4 2013 vs.
Q4 2012
Q3 2013
Q4 2013 vs.
Q3 2013
FY 2013
FY 2012
FY 2013 vs.
FY 2012
Refined
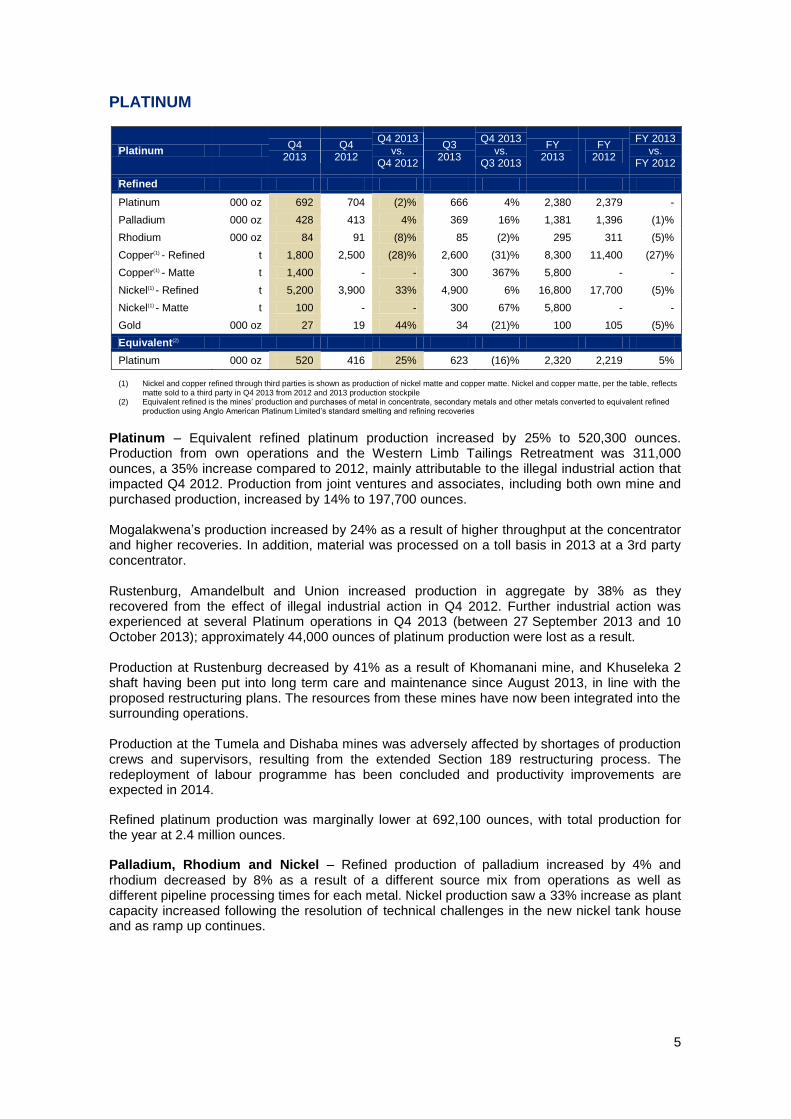
Platinum 000 oz 692 704 (2)% 666 4% 2,380 2,379 -
Palladium 000 oz 428 413 4% 369 16% 1,381 1,396 (1)%
Rhodium 000 oz 84 91 (8)% 85 (2)% 295 311 (5)%
Copper(1) - Refined t 1,800 2,500 (28)% 2,600 (31)% 8,300 11,400 (27)%
Copper(1) - Matte t 1,400 - - 300 367% 5,800 - -
Nickel(1) - Refined t 5,200 3,900 33% 4,900 6% 16,800 17,700 (5)%
Nickel(1) - Matte t 100 - - 300 67% 5,800 - -
Gold 000 oz 27 19 44% 34 (21)% 100 105 (5)%
Equivalent(2)
Platinum 000 oz 520 416 25% 623 (16)% 2,320 2,219 5%
(1) Nickel and copper refined through third parties is shown as production of nickel matte and copper matte. Nickel and copper matte, per the table, reflects
matte sold to a third party in Q4 2013 from 2012 and 2013 production stockpile (2) Equivalent refined is the mines’ production and purchases of metal in concentrate, secondary metals and other metals converted to equivalent refined
production using Anglo American Platinum Limited’s standard smelting and refining recoveries
Platinum – Equivalent refined platinum production increased by 25% to 520,300 ounces. Production from own operations and the Western Limb Tailings Retreatment was 311,000 ounces, a 35% increase compared to 2012, mainly attributable to the illegal industrial action that impacted Q4 2012. Production from joint ventures and associates, including both own mine and purchased production, increased by 14% to 197,700 ounces. Mogalakwena’s production increased by 24% as a result of higher throughput at the concentrator and higher recoveries. In addition, material was processed on a toll basis in 2013 at a 3rd party concentrator. Rustenburg, Amandelbult and Union increased production in aggregate by 38% as they recovered from the effect of illegal industrial action in Q4 2012. Further industrial action was experienced at several Platinum operations in Q4 2013 (between 27 September 2013 and 10 October 2013); approximately 44,000 ounces of platinum production were lost as a result. Production at Rustenburg decreased by 41% as a result of Khomanani mine, and Khuseleka 2 shaft having been put into long term care and maintenance since August 2013, in line with the proposed restructuring plans. The resources from these mines have now been integrated into the surrounding operations. Production at the Tumela and Dishaba mines was adversely affected by shortages of production crews and supervisors, resulting from the extended Section 189 restructuring process. The redeployment of labour programme has been concluded and productivity improvements are expected in 2014.
Refined platinum production was marginally lower at 692,100 ounces, with total production for the year at 2.4 million ounces.
Palladium, Rhodium and Nickel – Refined production of palladium increased by 4% and rhodium decreased by 8% as a result of a different source mix from operations as well as different pipeline processing times for each metal. Nickel production saw a 33% increase as plant capacity increased following the resolution of technical challenges in the new nickel tank house and as ramp up continues.
6
DIAMONDS
Diamonds Q4
2013 Q4
2012
Q4 2013 vs.
Q4 2012
Q3 2013
Q4 2013 vs.
Q3 2013
FY 2013
FY 2012
FY 2013 vs.
FY 2012
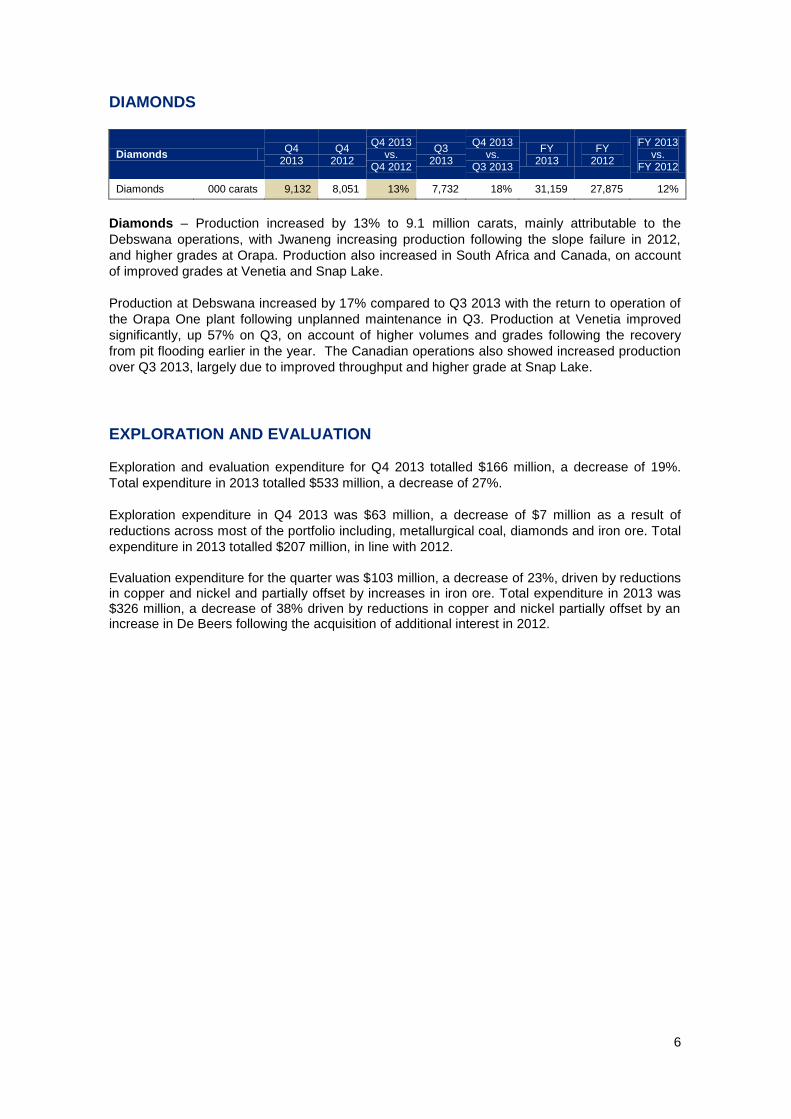
Diamonds 000 carats 9,132 8,051 13% 7,732 18% 31,159 27,875 12%
Diamonds – Production increased by 13% to 9.1 million carats, mainly attributable to the
Debswana operations, with Jwaneng increasing production following the slope failure in 2012,
and higher grades at Orapa. Production also increased in South Africa and Canada, on account
of improved grades at Venetia and Snap Lake.
Production at Debswana increased by 17% compared to Q3 2013 with the return to operation of
the Orapa One plant following unplanned maintenance in Q3. Production at Venetia improved
significantly, up 57% on Q3, on account of higher volumes and grades following the recovery
from pit flooding earlier in the year. The Canadian operations also showed increased production
over Q3 2013, largely due to improved throughput and higher grade at Snap Lake.
EXPLORATION AND EVALUATION
Exploration and evaluation expenditure for Q4 2013 totalled $166 million, a decrease of 19%.
Total expenditure in 2013 totalled $533 million, a decrease of 27%.
Exploration expenditure in Q4 2013 was $63 million, a decrease of $7 million as a result of
reductions across most of the portfolio including, metallurgical coal, diamonds and iron ore. Total
expenditure in 2013 totalled $207 million, in line with 2012.
Evaluation expenditure for the quarter was $103 million, a decrease of 23%, driven by reductions in copper and nickel and partially offset by increases in iron ore. Total expenditure in 2013 was $326 million, a decrease of 38% driven by reductions in copper and nickel partially offset by an increase in De Beers following the acquisition of additional interest in 2012.

7
PRODUCTION SUMMARY
The figures below include the entire output of consolidated entities and the Group’s attributable share of joint ventures, joint arrangements and associates where applicable, except for Collahuasi in the Copper segment and De Beers’ joint ventures which are quoted on a 100% basis.
Iron Ore (tonnes) Q4 2013 Q3 2013 Q2 2013 Q1 2013 Q4 2012
Q4 2013 vs.
Q3 2013
Q4 2013 vs.
Q4 2012
2013 2012
2013 vs.
2012
Lump 6,825,200 5,614,100 6,866,400 6,190,300 5,551,000 22% 23% 25,496,000 26,580,500 (4)%
Fines 4,460,500 3,860,500 4,411,400 4,144,700 3,461,500 16% 29% 16,877,100 16,484,600 2%
Total Kumba production 11,285,700 9,474,600 11,277,800 10,335,000 9,012,500 19% 25% 42,373,100 43,065,100 (2)%
Sishen 8,395,000 6,429,100 8,562,100 7,552,300 6,037,800 31% 39% 30,938,500 33,696,700 (8)%
Kolomela 2,739,500 2,806100 2,583,600 2,679,500 2,792,700 (2)% (2)% 10,808,700 8,544,900 26%
Thabazimbi 151,200 239,400 132,100 103,200 182,000 (37)% (17)% 625,900 823,500 (24)%
Total Kumba production 11,285,700 9,474,600 11,277,800 10,335,000 9,012,500 19% 25% 42,373,100 43,065,100 (2)%
Kumba sales volumes
RSA export iron ore 9,530,200 9,422,400 10,178,300 9,945,100 8,979,600 1% 6% 39,076,000 39,657,000 (1)%
RSA domestic iron ore 1,305,700 1,312,200 1,131,500 882,000 833,100 - 57% 4,631,400 4,683,000 (1)%
Samancor
Manganese ore(1)
846,000 788,100 864,200 803,400 846,800 8% - 3,301,700 3,347,800 (1)%
Manganese alloys(1)(2)
66,200 54,800 72,800 57,300 61,200 21% 8% 251,100 198,400 26%
Samancor sales volumes
Manganese ore 837,900 766,100 793,800 864,300 714,800 9% 17% 3,262,100 3,212,400 1%
Manganese alloys 60,400 56,800 68,400 63,100 65,600 6% (8)% 248,700 236,000 5%

8
Metallurgical Coal segment tonnes Q4 2013 Q3 2013 Q2 2013 Q1 2013 Q4 2012
Q4 2013 vs.
Q3 2013
Q4 2013 vs.
Q4 2012
2013 2012
2013 vs.
2012
Australia
Metallurgical - Export coking coal 3,133,900 3,053,000 2,663,400 2,861,300 3,020,700 3% 4% 11,711,600 10,484,700 12%
Metallurgical - Export PCI 1,241,900 1,444,700 1,283,800 1,289,800 1,193,000 (14)% 4% 5,260,200 5,802,700 (9)%
Thermal -Export 1,584,700 1,672,400 1,513,100 1,493,800 1,689,400 (5)% (6)% 6,264,000 6,045,900 4%
Thermal -Domestic 1,688,800 1,752,300 1,725,300 1,073,000 2,025,300 (4)% (17)% 6,239,400 6,924,600 (10)%
Total Australian Metallurgical Coal segment coal production 7,649,300 7,922,400 7,185,600 6,717,900 7,928,400 (3)% (4)% 29,475,200 29,257,900 1%
Canada
Metallurgical – Export coking coal 339,300 412,500 448,500 463,500 366,300 (18)% (7)% 1,663,800 1,376,900 21%
Metallurgical - Export PCI 18,300 1,700 - - - - - 20,000 - -
Total Metallurgical Coal segment coal production 8,006,900 8,336,600 7,634,100 7,181,400 8,294,700 (4)% (3)% 31,159,000 30,634,800 2%
Australia
Callide 1,688,800 1,752,300 1,725,300 1,151,400 2,148,800 (4)% (21)% 6,317,800 7,464,000 (15)%
Capcoal 1,578,800 1,606,000 1,461,100 1,415,500 1,387,200 (2)% 14% 6,061,400 6,022,400 1%
Dawson 1,162,700 993,300 1,077,100 752,600 1,190,100 17% (2)% 3,985,700 4,593,500 (13)%
Drayton 976,400 1,055,900 785,000 893,400 955,200 (8)% 2% 3,710,700 3,663,300 1%
Foxleigh 421,900 541,000 475,700 528,000 470,200 (22)% (10)% 1,966,600 1,896,000 4%
Jellinbah 755,900 673,400 610,000 477,200 584,900 12% 29% 2,516,500 2,073,200 21%
Moranbah North 1,064,800 1,300,500 1,051,400 1,499,800 1,192,000 (18)% (11)% 4,916,500 3,545,500 39%
Total Australian Metallurgical segment coal production 7,649,300 7,922,400 7,185,600 6,717,900 7,928,400 (3)% (4)% 29,475,200 29,257,900 1%
Canada
Peace River Coal 357,600 414,200 448,500 463,500 366,300 (14)% (2)% 1,683,800 1,376,900 22%
Total Metallurgical Coal segment coal production 8,006,900 8,336,600 7,634,100 7,181,400 8,294,700 (4)% (3)% 31,159,000 30,634,800 2%
Weighted average achieved FOB prices
Metallurgical – Export
(3) US$/t 133 129 153 148 146 3% (9)% 140 178 (21)%
Thermal – Export US$/t 78 82 84 90 83 (5)% (6)% 84 96 (13)%
Thermal – Domestic US$/t 40 39 40 37 37 3% 8% 39 37 5%
Sales volumes
Metallurgical - Export
(4) 5,182,200 4,859,000 4,667,100 4,336,200 4,714,000 7% 10% 19,044,500 17,413,000 9%
Thermal – Export 1,881,800 1,477,900 1,505,300 1,506,600 1,518,800 27% 24% 6,371,600 6,042,600 5%
Thermal – Domestic 1,632,000 1,684,300 1,700,000 1,109,100 1,920,800 (3)% (15)% 6,125,400 6,920,900 (11)%
9
Thermal Coal segment tonnes Q4 2013 Q3 2013 Q2 2013 Q1 2013 Q4 2012
Q4 2013 vs.
Q3 2013
Q4 2013 vs.
Q4 2012
2013 2012
2013 vs.
2012
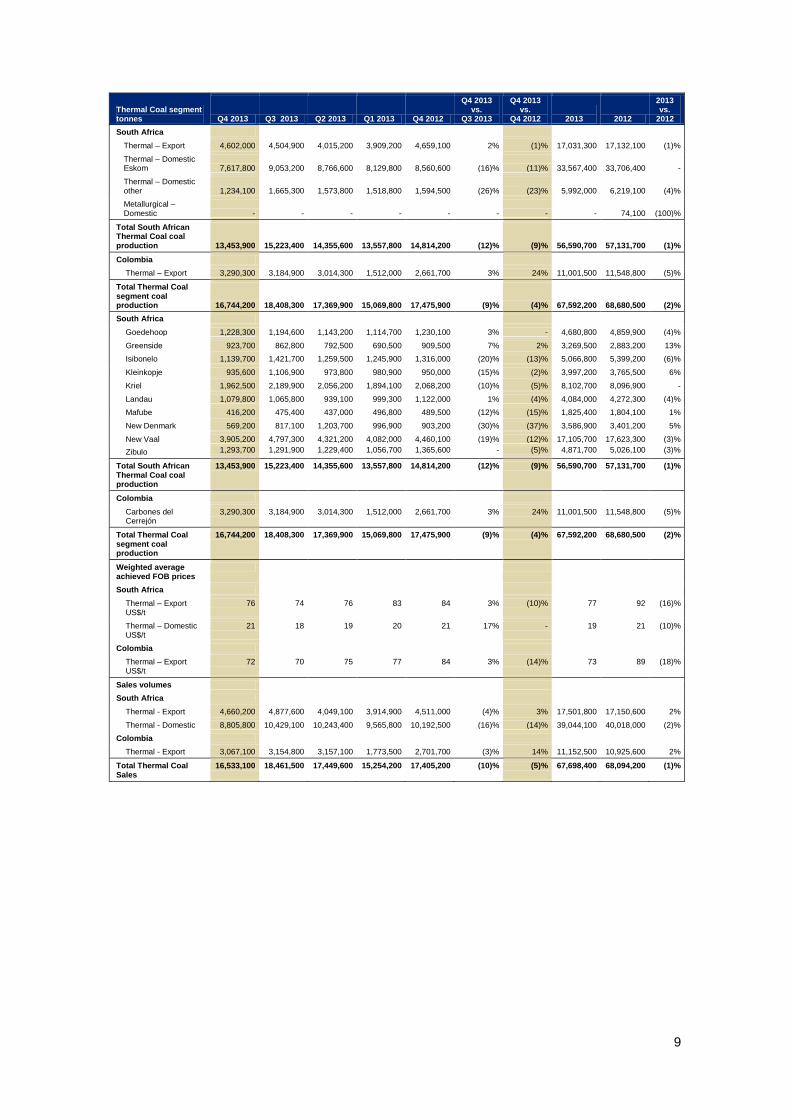
South Africa
Thermal – Export 4,602,000 4,504,900 4,015,200 3,909,200 4,659,100 2% (1)% 17,031,300 17,132,100 (1)%
Thermal – Domestic Eskom 7,617,800 9,053,200 8,766,600 8,129,800 8,560,600 (16)% (11)% 33,567,400 33,706,400 -
Thermal – Domestic other 1,234,100 1,665,300 1,573,800 1,518,800 1,594,500 (26)% (23)% 5,992,000 6,219,100 (4)%
Metallurgical – Domestic
- - - - - - - - 74,100 (100)%
Total South African Thermal Coal coal production 13,453,900 15,223,400 14,355,600 13,557,800 14,814,200 (12)% (9)% 56,590,700 57,131,700 (1)%
Colombia
Thermal – Export 3,290,300 3,184,900 3,014,300 1,512,000 2,661,700 3% 24% 11,001,500 11,548,800 (5)%
Total Thermal Coal segment coal production
16,744,200 18,408,300 17,369,900 15,069,800 17,475,900 (9)% (4)% 67,592,200 68,680,500 (2)%
South Africa
Goedehoop 1,228,300 1,194,600 1,143,200 1,114,700 1,230,100 3% - 4,680,800 4,859,900 (4)%
Greenside 923,700 862,800 792,500 690,500 909,500 7% 2% 3,269,500 2,883,200 13%
Isibonelo 1,139,700 1,421,700 1,259,500 1,245,900 1,316,000 (20)% (13)% 5,066,800 5,399,200 (6)%
Kleinkopje 935,600 1,106,900 973,800 980,900 950,000 (15)% (2)% 3,997,200 3,765,500 6%
Kriel 1,962,500 2,189,900 2,056,200 1,894,100 2,068,200 (10)% (5)% 8,102,700 8,096,900 -
Landau 1,079,800 1,065,800 939,100 999,300 1,122,000 1% (4)% 4,084,000 4,272,300 (4)%
Mafube 416,200 475,400 437,000 496,800 489,500 (12)% (15)% 1,825,400 1,804,100 1%
New Denmark 569,200 817,100 1,203,700 996,900 903,200 (30)% (37)% 3,586,900 3,401,200 5%
New Vaal 3,905,200 4,797,300 4,321,200 4,082,000 4,460,100 (19)% (12)% 17,105,700 17,623,300 (3)%
Zibulo 1,293,700 1,291,900 1,229,400 1,056,700 1,365,600 - (5)% 4,871,700 5,026,100 (3)%
Total South African Thermal Coal coal production
13,453,900 15,223,400 14,355,600 13,557,800 14,814,200 (12)% (9)% 56,590,700 57,131,700 (1)%
Colombia
Carbones del Cerrejón
3,290,300 3,184,900 3,014,300 1,512,000 2,661,700 3% 24% 11,001,500 11,548,800 (5)%
Total Thermal Coal segment coal production
16,744,200 18,408,300 17,369,900 15,069,800 17,475,900 (9)% (4)% 67,592,200 68,680,500 (2)%
Weighted average achieved FOB prices
South Africa
Thermal – Export US$/t
76 74 76 83 84 3% (10)% 77 92 (16)%
Thermal – Domestic US$/t
21 18 19 20 21 17% - 19 21 (10)%
Colombia
Thermal – Export US$/t
72 70 75 77 84 3% (14)% 73 89 (18)%
Sales volumes
South Africa
Thermal - Export 4,660,200 4,877,600 4,049,100 3,914,900 4,511,000 (4)% 3% 17,501,800 17,150,600 2%
Thermal - Domestic 8,805,800 10,429,100 10,243,400 9,565,800 10,192,500 (16)% (14)% 39,044,100 40,018,000 (2)%
Colombia
Thermal - Export 3,067,100 3,154,800 3,157,100 1,773,500 2,701,700 (3)% 14% 11,152,500 10,925,600 2%
Total Thermal Coal Sales
16,533,100 18,461,500 17,449,600 15,254,200 17,405,200 (10)% (5)% 67,698,400 68,094,200 (1)%
10
Copper segment tonnes unless stated otherwise
(5)
Q4 2013 Q3 2013 Q2 2013 Q1 2013 Q4 2012
Q4 2013 vs.
Q3 2013
Q4 2013 vs.
Q4 2012
2013 2012
2013 vs.
2012
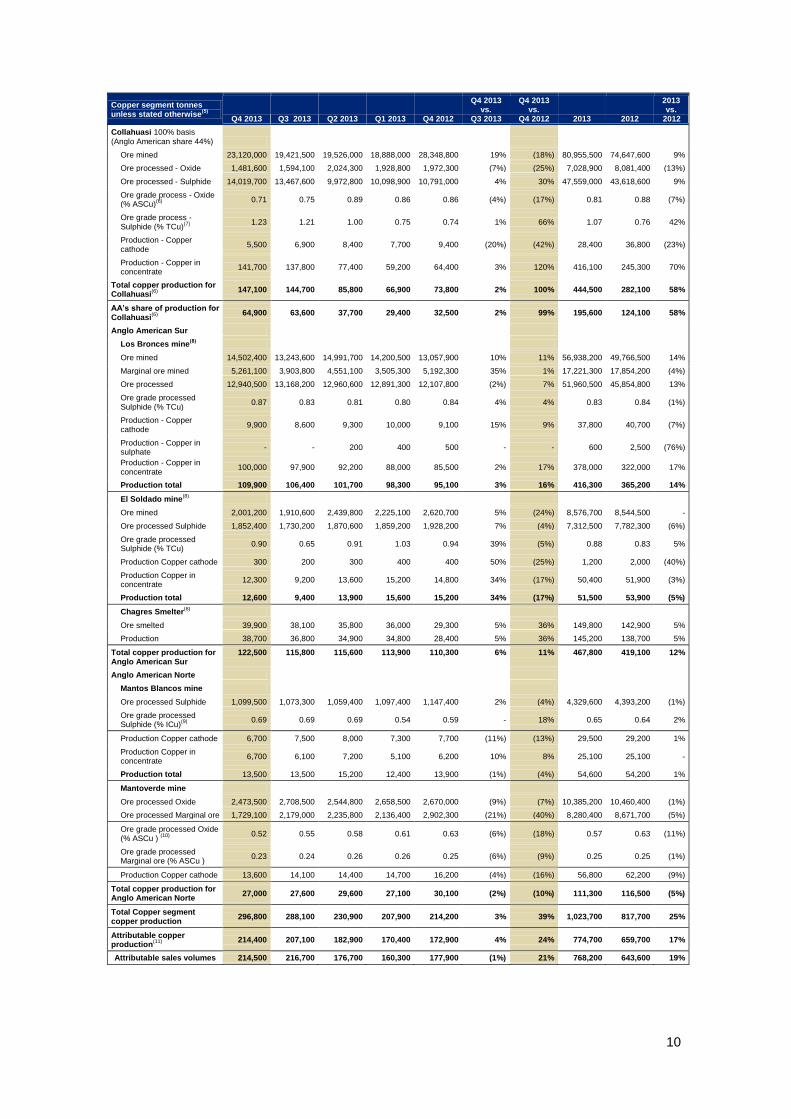
Collahuasi 100% basis
(Anglo American share 44%)
Ore mined 23,120,000 19,421,500 19,526,000 18,888,000 28,348,800 19% (18%) 80,955,500 74,647,600 9%
Ore processed - Oxide 1,481,600 1,594,100 2,024,300 1,928,800 1,972,300 (7%) (25%) 7,028,900 8,081,400 (13%)
Ore processed - Sulphide 14,019,700 13,467,600 9,972,800 10,098,900 10,791,000 4% 30% 47,559,000 43,618,600 9%
Ore grade process - Oxide (% ASCu)
(6)
0.71 0.75 0.89 0.86 0.86 (4%) (17%) 0.81 0.88 (7%)
Ore grade process - Sulphide (% TCu)
(7)
1.23 1.21 1.00 0.75 0.74 1% 66% 1.07 0.76 42%
Production - Copper cathode
5,500 6,900 8,400 7,700 9,400 (20%) (42%) 28,400 36,800 (23%)
Production - Copper in concentrate
141,700 137,800 77,400 59,200 64,400 3% 120% 416,100 245,300 70%
Total copper production for Collahuasi
(6)
147,100 144,700 85,800 66,900 73,800 2% 100% 444,500 282,100 58%
AA’s share of production for Collahuasi
(6)
64,900 63,600 37,700 29,400 32,500 2% 99% 195,600 124,100 58%
Anglo American Sur
Los Bronces mine(8)
Ore mined 14,502,400 13,243,600 14,991,700 14,200,500 13,057,900 10% 11% 56,938,200 49,766,500 14%
Marginal ore mined 5,261,100 3,903,800 4,551,100 3,505,300 5,192,300 35% 1% 17,221,300 17,854,200 (4%)
Ore processed 12,940,500 13,168,200 12,960,600 12,891,300 12,107,800 (2%) 7% 51,960,500 45,854,800 13%
Ore grade processed Sulphide (% TCu)
0.87 0.83 0.81 0.80 0.84 4% 4% 0.83 0.84 (1%)
Production - Copper cathode
9,900 8,600 9,300 10,000 9,100 15% 9% 37,800 40,700 (7%)
Production - Copper in sulphate
- - 200 400 500 - - 600 2,500 (76%)
Production - Copper in concentrate
100,000 97,900 92,200 88,000 85,500 2% 17% 378,000 322,000 17%
Production total 109,900 106,400 101,700 98,300 95,100 3% 16% 416,300 365,200 14%
El Soldado mine(8)
Ore mined 2,001,200 1,910,600 2,439,800 2,225,100 2,620,700 5% (24%) 8,576,700 8,544,500 -
Ore processed Sulphide 1,852,400 1,730,200 1,870,600 1,859,200 1,928,200 7% (4%) 7,312,500 7,782,300 (6%)
Ore grade processed Sulphide (% TCu)
0.90 0.65 0.91 1.03 0.94 39% (5%) 0.88 0.83 5%
Production Copper cathode 300 200 300 400 400 50% (25%) 1,200 2,000 (40%)
Production Copper in concentrate
12,300 9,200 13,600 15,200 14,800 34% (17%) 50,400 51,900 (3%)
Production total 12,600 9,400 13,900 15,600 15,200 34% (17%) 51,500 53,900 (5%)
Chagres Smelter(8)
Ore smelted 39,900 38,100 35,800 36,000 29,300 5% 36% 149,800 142,900 5%
Production 38,700 36,800 34,900 34,800 28,400 5% 36% 145,200 138,700 5%
Total copper production for Anglo American Sur
122,500 115,800 115,600 113,900 110,300 6% 11% 467,800 419,100 12%
Anglo American Norte
Mantos Blancos mine
Ore processed Sulphide 1,099,500 1,073,300 1,059,400 1,097,400 1,147,400 2% (4%) 4,329,600 4,393,200 (1%)
Ore grade processed Sulphide (% ICu)
(9)
0.69 0.69 0.69 0.54 0.59 - 18% 0.65 0.64 2%
Production Copper cathode 6,700 7,500 8,000 7,300 7,700 (11%) (13%) 29,500 29,200 1%
Production Copper in concentrate
6,700 6,100 7,200 5,100 6,200 10% 8% 25,100 25,100 -
Production total 13,500 13,500 15,200 12,400 13,900 (1%) (4%) 54,600 54,200 1%
Mantoverde mine
Ore processed Oxide 2,473,500 2,708,500 2,544,800 2,658,500 2,670,000 (9%) (7%) 10,385,200 10,460,400 (1%)
Ore processed Marginal ore 1,729,100 2,179,000 2,235,800 2,136,400 2,902,300 (21%) (40%) 8,280,400 8,671,700 (5%)
Ore grade processed Oxide (% ASCu )
(10)
0.52 0.55 0.58 0.61 0.63 (6%) (18%) 0.57 0.63 (11%)
Ore grade processed Marginal ore (% ASCu )
0.23 0.24 0.26 0.26 0.25 (6%) (9%) 0.25 0.25 (1%)
Production Copper cathode 13,600 14,100 14,400 14,700 16,200 (4%) (16%) 56,800 62,200 (9%)
Total copper production for Anglo American Norte
27,000 27,600 29,600 27,100 30,100 (2%) (10%) 111,300 116,500 (5%)
Total Copper segment copper production
296,800 288,100 230,900 207,900 214,200 3% 39% 1,023,700 817,700 25%
Attributable copper production
(11)
214,400 207,100 182,900 170,400 172,900 4% 24% 774,700 659,700 17%
Attributable sales volumes 214,500 216,700 176,700 160,300 177,900 (1%) 21% 768,200 643,600 19%
11
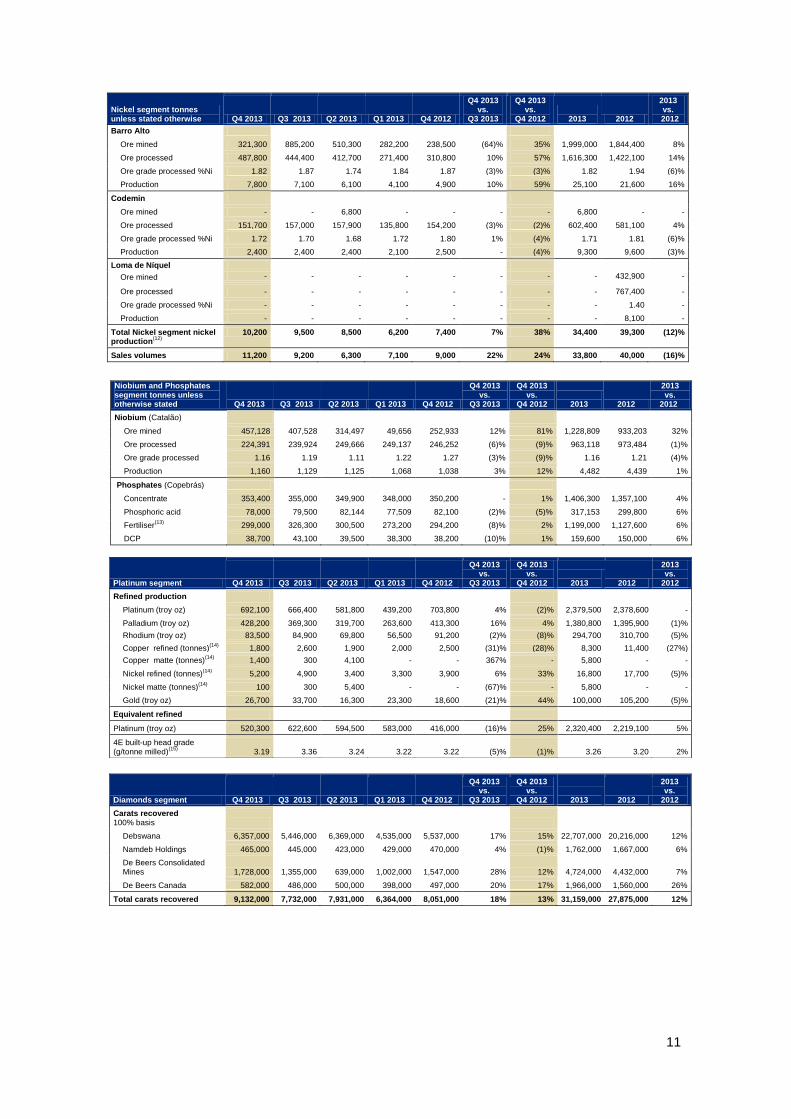
Nickel segment tonnes unless stated otherwise Q4 2013 Q3 2013 Q2 2013 Q1 2013 Q4 2012
Q4 2013 vs.
Q3 2013
Q4 2013 vs.
Q4 2012
2013 2012
2013 vs.
2012
Barro Alto
Ore mined 321,300 885,200 510,300 282,200 238,500 (64)% 35% 1,999,000 1,844,400 8%
Ore processed 487,800 444,400 412,700 271,400 310,800 10% 57% 1,616,300 1,422,100 14%
Ore grade processed %Ni 1.82 1.87 1.74 1.84 1.87 (3)% (3)% 1.82 1.94 (6)%
Production 7,800 7,100 6,100 4,100 4,900 10% 59% 25,100 21,600 16%
Codemin
Ore mined - - 6,800 - - - - 6,800 - -
Ore processed 151,700 157,000 157,900 135,800 154,200 (3)% (2)% 602,400 581,100 4%
Ore grade processed %Ni 1.72 1.70 1.68 1.72 1.80 1% (4)% 1.71 1.81 (6)%
Production 2,400 2,400 2,400 2,100 2,500 - (4)% 9,300 9,600 (3)%
Loma de Níquel
Ore mined - - - - - - - - 432,900 -
Ore processed - - - - - - - - 767,400 -
Ore grade processed %Ni - - - - - - - - 1.40 -
Production - - - - - - - - 8,100 -
Total Nickel segment nickel production
(12)
10,200 9,500 8,500 6,200 7,400 7% 38% 34,400 39,300 (12)%
Sales volumes 11,200 9,200 6,300 7,100 9,000 22% 24% 33,800 40,000 (16)%
Niobium and Phosphates segment tonnes unless otherwise stated Q4 2013 Q3 2013 Q2 2013 Q1 2013 Q4 2012
Q4 2013 vs.
Q3 2013
Q4 2013 vs.
Q4 2012
2013 2012
2013 vs.
2012
Niobium (Catalão)
Ore mined 457,128 407,528 314,497 49,656 252,933 12% 81% 1,228,809 933,203 32%
Ore processed 224,391 239,924 249,666 249,137 246,252 (6)% (9)% 963,118 973,484 (1)%
Ore grade processed 1.16 1.19 1.11 1.22 1.27 (3)% (9)% 1.16 1.21 (4)%
Production 1,160 1,129 1,125 1,068 1,038 3% 12% 4,482 4,439 1%
Phosphates (Copebrás)
Concentrate 353,400 355,000 349,900 348,000 350,200 - 1% 1,406,300 1,357,100 4%
Phosphoric acid 78,000 79,500 82,144 77,509 82,100 (2)% (5)% 317,153 299,800 6%
Fertiliser(13)
299,000 326,300 300,500 273,200 294,200 (8)% 2% 1,199,000 1,127,600 6%
DCP 38,700 43,100 39,500 38,300 38,200 (10)% 1% 159,600 150,000 6%
Platinum segment Q4 2013 Q3 2013 Q2 2013 Q1 2013 Q4 2012
Q4 2013 vs.
Q3 2013
Q4 2013 vs.
Q4 2012
2013 2012
2013 vs.
2012
Refined production
Platinum (troy oz) 692,100 666,400 581,800 439,200 703,800 4% (2)% 2,379,500 2,378,600 -
Palladium (troy oz) 428,200 369,300 319,700 263,600 413,300 16% 4% 1,380,800 1,395,900 (1)%
Rhodium (troy oz) 83,500 84,900 69,800 56,500 91,200 (2)% (8)% 294,700 310,700 (5)%
Copper refined (tonnes)(14)
1,800 2,600 1,900 2,000 2,500 (31)% (28)% 8,300 11,400 (27%)
Copper matte (tonnes)(14)
1,400 300 4,100 - - 367% - 5,800 - -
Nickel refined (tonnes)(14)
5,200 4,900 3,400 3,300 3,900 6% 33% 16,800 17,700 (5)%
Nickel matte (tonnes)(14)
100 300 5,400 - - (67)% - 5,800 - -
Gold (troy oz) 26,700 33,700 16,300 23,300 18,600 (21)% 44% 100,000 105,200 (5)%
Equivalent refined
Platinum (troy oz) 520,300 622,600 594,500 583,000 416,000 (16)% 25% 2,320,400 2,219,100 5%
4E built-up head grade (g/tonne milled)
(15) 3.19 3.36 3.24 3.22 3.22 (5)% (1)% 3.26 3.20 2%
Diamonds segment Q4 2013 Q3 2013 Q2 2013 Q1 2013 Q4 2012
Q4 2013 vs.
Q3 2013
Q4 2013 vs.
Q4 2012
2013 2012
2013 vs.
2012
Carats recovered 100% basis
Debswana 6,357,000 5,446,000 6,369,000 4,535,000 5,537,000 17% 15% 22,707,000 20,216,000 12%
Namdeb Holdings 465,000 445,000 423,000 429,000 470,000 4% (1)% 1,762,000 1,667,000 6%
De Beers Consolidated Mines 1,728,000 1,355,000 639,000 1,002,000 1,547,000 28% 12% 4,724,000 4,432,000 7%
De Beers Canada 582,000 486,000 500,000 398,000 497,000 20% 17% 1,966,000 1,560,000 26%
Total carats recovered 9,132,000 7,732,000 7,931,000 6,364,000 8,051,000 18% 13% 31,159,000 27,875,000 12%

12
(1) Saleable production
(2) Production includes medium carbon ferro-manganese
(3) Within export coking and export PCI coals there are different grades of coal with different weighted average prices compared to benchmark
(4) Includes both hard coking coal and PCI sales volumes
(5) Excludes Anglo American Platinum’s copper production
(6) ASCu = acid soluble copper
(7) TCu = total copper
(8) Anglo American’s share of Collahuasi production is 44%
(9) Anglo American previously held 74.5% of Anglo American Sur; as from 24 August 2012, it held 50.1%. Production is stated at 100% as Anglo American
continues to consolidate Anglo American Sur
(10) ICu = insoluble copper (total copper less acid soluble copper)
(11) Difference between total copper production and attributable copper production arises from Anglo American’s 44% interest in Collahuasi
(12) Excludes Anglo American Platinum’s nickel production
(13) 2012 fertiliser production restated to reflect the change in production quantification methodology in the acidulation plant at Cubatão
(14) Nickel and copper refined through third parties is now shown as production of nickel matte and copper matte. Nickel and copper matte, per the table,
reflect matte sold to a third party in Q4 2013 from 2012 and 2013 production stockpiles
(15) Equivalent refined is the mines’ production and purchases of metal in concentrate, secondary metals and other metals converted to equiva lent refined
production using Anglo American Platinum Limited’s standard smelting and refining recoveries
(16) 4E: the grade measured as the combined content of the four most valuable precious metals: platinum, palladium, rhodium and gold.
Note: Production figures are sometimes more precise than the rounded numbers shown in the commentary of this report. The percentage change reflects the percentage change using the production figures shown in the Production Summary of this report. Forward-looking statements: This release contains certain forward looking statements which involve risk and uncertainty because they relate to events and depend on circumstances that occur in the future. There are a number of factors that could cause actual results or developments to differ materially from those expressed or implied by these forward looking statements. For further information, please contact:
Media Investors UK James Wyatt-Tilby Tel: +44 (0)20 7968 8759
UK Paul Galloway Tel: +44 (0)20 7968 8718
Emily Blyth
Tel: +44 (0)20 7968 8481
Caroline Crampton Tel: +44 (0)20 7968 2192
South Africa Pranill Ramchander Tel: +27 (0)11 638 2592
Sarah McNally Tel: +44 (0)20 7968 8747
Notes to editors: Anglo American is one of the world’s largest mining companies, is headquartered in the UK and listed on the London and Johannesburg stock exchanges. Our portfolio of mining businesses meets our customers’ changing needs and spans bulk commodities – iron ore and manganese, metallurgical coal and thermal coal; base metals and minerals – copper, nickel, niobium and phosphates; and precious metals and minerals – in which we are a global leader in both platinum and diamonds. At Anglo American, we are committed to working together with our stakeholders – our investors, our partners and our employees – to create sustainable value that makes a real difference, while upholding the highest standards of safety and responsibility across all our businesses and geographies. The company’s mining operations, pipeline of growth projects and exploration activities span southern Africa, South America, Australia, North America, Asia and Europe. www.angloamerican.com