news release - vodafone.com · vodafone group plc vodafone house, the connection, newbury,...
TRANSCRIPT
Vodafone Group Plc Vodafone House, The Connection, Newbury, Berkshire RG14 2FN, England vodafone.com Investor Relations Media Relations Telephone: +44 7919 990230 www.vodafone.com/media/contact Registered Office: Vodafone House, The Connection, Newbury, Berkshire RG14 2FN, England. Registered in England No. 1833679
news release Vodafone announces results for the six months ended 30 September 2018 13 November 2018 IFRS 15 was adopted on 1 April 2018 for our statutory reporting, without restating prior year figures. As a result, the discussion of our operating results is primarily on an IAS 18 basis for all periods presented.
Highlights
• Group revenue of €21.8 billion and loss for the financial period of €7.8 billion, primarily due to a loss on the disposal of Vodafone India (following the completion of the merger with Idea Cellular) and impairments
• Organic service revenue (excluding handset financing, IAS 18 basis) up 0.8%** and Q2 up 0.5%** with good commercial and financial performance in most markets offset by increased competition in Italy and Spain
• Growth drivers: good momentum in fixed broadband (384,000 net adds) and convergence (616,000 net adds); Vodafone Business grew 1.0%*, led by strong growth in IoT; Emerging Consumer up 7.4%* driven by data growth
• Organic adjusted EBITDA up 2.9%** (excluding handset financing and settlements, IAS 18 basis), supported by a third consecutive year of net reduction in operating expenses
• Updating full year guidance: underlying organic adjusted EBITDA growth narrowed to c.3% (previously 1-5%); Free cash flow (pre-spectrum) raised to c.€5.4 billion (previously ‘at least €5.2 billion’)
• Stable interim dividend per share of 4.84 eurocents; full year dividend per share expected to be in-line with FY18 Six months ended 30 September
2018 2017 Reported IFRS 15 IAS 181 Growth Page €m €m % Group revenue 22 21,796 23,075 (5.5) Operating (loss)/profit 22 (2,071) 2,008 N/M (Loss)/profit for the financial period2 22 (7,833) 1,235 N/M Basic (loss)/earnings per share2 22 (29.00c) 4.03c N/M Interim dividend per share 40 4.84c 4.84c – Net debt 19 (32,110) (30,188) +6.4
Growth
2018 2017 Reported Organic** Alternative performance measures3 Page €m €m % % Group service revenue (IAS 18 basis) 7 19,711 20,592 (4.3) +0.8 Adjusted EBITDA (IAS 18 basis) 7 7,078 7,385 (4.2) +2.9 Adjusted EBIT (IAS 18 basis) 7 2,305 2,457 (6.2) +8.6 Adjusted earnings per share 17 3.56c 6.32c (43.7) Free cash flow pre-spectrum 18 894 1,289 (30.6) Free cash flow 18 566 415 +36.4
Nick Read, Group Chief Executive, commented:
“Our performance in the majority of our markets has been good during the first half of the year, and we have taken decisive commercial and operational actions to respond to challenging competitive conditions in Italy and Spain. We are on track to reduce net operating expenses for the third year running, and we are confirming the mid-point of our EBITDA guidance range, with an increased outlook for free cash flow generation. Looking ahead, my new strategic priorities focus on driving greater consistency of commercial execution, accelerating digital transformation, radically simplifying our operating model and generating better returns from our infrastructure assets. Our goal is to deepen customer engagement through a broader offering of products and services and to deliver the best digital customer experience, supported by consistent investment in our leading Gigabit networks. We expect that this will drive revenue growth, reduce churn and lower our European net operating expenses by at least €1.2 billion by FY2021. As part of our effort to improve returns, we are creating a virtual internal tower company across our European operations, and we are reviewing the best strategic and financial direction for these assets. Our focus on organic growth along with the strategic and financial benefits of the proposed acquisition of Liberty Global’s assets give confidence in the Group’s ability to grow free cash flow, which underpins our dividend.”
CHIEF EXECUTIVE’S STATEMENT
2
Financial review of the half year On 20 March 2017 we announced an agreement to merge Vodafone India with Idea Cellular (‘Idea’) in India, which completed on 31 August 2018. As a result, Vodafone India has been excluded from Group figures for all periods up to 31 August 2018 and the results of Vodafone Idea have been included in all Group figures for all periods thereafter, unless otherwise stated.
Financial results: Statutory performance measures
Following the adoption of IFRS 15 “Revenue from Contracts with Customers” on 1 April 2018, the Group’s statutory results for the six months ended 30 September 2018 are on an IFRS 15 basis, whereas the statutory results for the six months ended 30 September 2017 are, as previously reported, on an IAS 18 basis. Any comparison between the two bases of reporting is not meaningful. As a result, the discussion of our operating results is primarily on an IAS 18 basis for all periods presented. See “Alternative performance measures” on page 48 for more information and reconciliations to the closest respective equivalent GAAP measures.
Group revenue declined by 5.5% to €21.8 billion, reflecting foreign exchange headwinds, the impact of the adoption of IFRS 15, which nets certain components of dealer commissions from service revenues, and the sale of Qatar. Operating loss was €2.1 billion, down €4.1 billion, largely driven by impairments of €3.5 billion in Spain, Romania and Vodafone Idea.
The loss for the financial period of €7.8 billion reflects these impairments, a loss on disposal of Vodafone India of €3.4 billion recognised following the completion of the merger with Idea Cellular, higher net financing costs (following adverse foreign exchange movements, mark to market losses and higher gross borrowings) and the de-recognition of a deferred tax asset in Spain. Basic loss per share was 29.00 eurocents, compared to earnings per share of 4.03 eurocents for the period ended 30 September 2017.
Financial results: Alternative performance measures
On an IAS 18 basis, Group organic service revenue excluding handset financing grew 0.8%** (Q1: 1.1%**, Q2: 0.5%**). Growth was driven by market share gains in Europe Consumer fixed, strong mobile data demand and customer base growth in our emerging market operations, and continued momentum in Vodafone Business supported by market share gains in fixed and strong IoT sales. These offset increased competitive pressures in Italy and Spain, and the drag from lower wholesale revenue.
Group organic adjusted EBITDA grew 2.9%** excluding handset financing and settlements. This reflected broad based growth across the majority of our markets, with the exception of Italy and Spain, and was supported by operating expense reduction across both Europe and Common functions, which was only partially offset by inflationary pressures in AMAP.
Consequently, the Group’s adjusted organic EBITDA margin (excluding handset financing and settlements) increased by 0.3 percentage points to 30.8%**, and we remain on-track for a fourth consecutive year of underlying EBITDA margin expansion. Adjusted EBIT increased 8.6%** excluding handset financing and settlements, driven by adjusted EBITDA growth and lower depreciation and amortisation expenses.
On a reported basis, adjusted EBITDA and adjusted EBIT declined, reflecting foreign exchange headwinds, a lower benefit from handset financing in the UK and a regulatory settlement in the UK in the prior year.
The Group’s adjusted effective tax rate for H1 was 25.9% compared to 22.2% last year. This higher rate is primarily due to a change in the country mix of the Group’s profits, partly driven by the financing for the acquisition of Liberty Global’s assets in Germany and Central & Eastern Europe, and the impact of non-tax deductible foreign exchange losses. We expect the Group’s underlying effective tax rate for the full year to remain within our low to mid-20s range.
Adjusted earnings per share, which exclude impairment losses and the results of Vodafone India (which were included in discontinued operations), were 3.56 eurocents, a decrease of 43.7% year-on-year, as lower adjusted EBIT and higher net financing costs more than offset the decrease in income tax expense.
Liquidity and capital resources
Free cash flow pre-spectrum was €0.9 billion, compared to €1.3 billion in the prior year. The reduction year-on-year was principally driven by lower adjusted EBITDA and higher capital creditor outflows, partly offset by lower capital additions (which decreased to €3.1 billion, representing 13.6% of revenues).
Free cash flow post spectrum was €0.6 billion, compared to €0.4 billion in the prior year. Spectrum payments were €0.2 billion, principally reflecting 3500MHz spectrum acquired in the UK to support the rollout of 5G services. Cash restructuring costs of €0.1 billion were similar to the prior year.
Net debt as at 30 September 2018 was €32.1 billion compared to €29.6 billion as at 31 March 2018. This reflects free cash flow generation in the period of €0.9 billion, proceeds from Verizon loan notes of €2.1 billion, offset by FY18 final dividend payments of €2.7 billion, spectrum purchases of €1.0 billion (including €0.6 billion for the Italian auction, which was ongoing at the period end), and a net cash outflow to India from Vodafone Group of €0.8 billion in connection with the Vodafone Idea transaction.
CHIEF EXECUTIVE’S STATEMENT
3
Strategic review of the half year The Group simplified its strategy during the first half of the financial year, identifying five drivers of sustainable revenue and free cash flow growth, which are described below. The foundation of our strategy is our significant investments in leading 4G wireless and next generation fixed networks, which continue to support an excellent customer experience. Based on network net promoter scores, at the end of the period the Group was a leader or co-leader in 18 out of 20 markets for Consumer and Business, with a significant performance gap relative to value-focused competitors.
Europe Consumer: Selling ‘one more product’ per customer, lowering churn through convergence
In H1, the European Consumer segment accounted for 49.1% of Group service revenues.
We aim to drive growth in the Europe Consumer segment by developing deeper customer relationships, with a strong focus on our existing base. We intend to both cross-sell additional products (e.g., broadband, family SIMs, TV) and up-sell new experiences (including higher speeds with 4G Evo / 5G, low latency mobile gaming services and a wide range of Consumer IoT devices, enabled by our leading ‘V by Vodafone’ global platform). Our objective is to increase revenue per customer and to significantly reduce churn as an increasing proportion of our customer base becomes converged over time.
We intend to launch 5G services in-line with leading local competitors during calendar 2019 and 2020, with an initial focus on dense urban areas. 5G’s improved spectral and energy efficiency supports up to a 10x reduction in the cost per Gigabyte, which will allow the Group to limit the future growth in network operating costs despite strong expected traffic growth.
Overall, Europe Consumer service revenues excluding UK handset financing declined by 0.6%** in H1, with fixed growth of 3.6%** offset by a mobile decline of 2.1%**. Excluding Spain, Italy and the drag from UK handset financing, service revenues grew by 3.0%**, with fixed growth of 6.1%** and mobile growing by 1.8%**. Fixed represented 28.3% of segment revenues in the period.
In Consumer Fixed, we continued to expand our NGN footprint, which is the largest in Europe. On a pro-forma basis for the acquisition of Liberty Global’s cable assets (announced in May), we covered 117 million households at the end of the period, with 54 million ‘on-net’ (including VodafoneZiggo). With the potential to offer superior gigabit-speeds via DOCSIS3.1 on Cable and via FTTH to most of these homes in the next few years, we see significant scope to increase on-net broadband customer penetration, which is currently 28%, at attractive incremental margins.
Including VodafoneZiggo, the Group had 20.4 million broadband customers, 6.2 million converged customers and 13.7 million TV customers at the end of the period. We maintained good commercial momentum in all markets other than Spain, which was impacted by increased competitive intensity and by our decision not to renew unprofitable football rights. During H1 we added 384,000 broadband customers, 744,000 NGN customers and 616,000 converged customers (partially supported by the first-time recognition of prepaid customers in Germany). Our TV customer base declined by 71,000, following football customer losses in Spain.
In Consumer Mobile, data growth remained strong at 57%, with average smartphone usage increasing to 3.2 GB per month. Our ability to monetise this growth varied by market. In Germany and the UK, underlying Consumer ARPU trends improved on the back of more-for-more offers and RPI-linked price increases, respectively, although on a reported basis this was offset by a mix shift towards SIM-only / family SIMs and convergence discounts. In Italy and Spain, increased competition led to material ARPU declines.
Vodafone Business: A leading international challenger in fix ed, ‘industrialising’ IoT
In H1, Vodafone Business accounted for 29.8% of Group service revenues.
We are in the process of rebranding our former Enterprise division as ‘Vodafone Business’, which we believe will help to increase our brand recognition as we broaden our service offering. Our strategy is to drive growth and deepen our existing mobile customer relationships by cross-selling additional services including next generation fixed, IoT and Cloud services. We aim to increase revenue per account and reduce churn, while also improving productivity through our salesforce transformation initiative and the rapid digitalisation of our operations.
We believe our unique global footprint and extensive partner market relationships provide us with a competitive advantage in selling to select multinational customers, which represent c.20% of divisional service revenues and are managed centrally by our ‘Vodafone Global Enterprise’ team.
We aim to build on our strength in connectivity to become the partner of choice for local corporate / government customers (which represent c.30% of Business revenues) and for multinationals, leveraging our leading global IoT platform. We are investing in IoT solutions for specific industry verticals, expanding from our current focus on automotive to digital buildings, healthcare and logistics. Together with good growth in IoT connections (which rose 28% in Q2 to 77 million), this supported IoT revenue growth of 14.0%* in H1.
We also see significant future opportunities to gain share as the Wide Area Networking (WAN) market transitions to Software Defined Networking (SDN), which offers large enterprise customers both greater flexibility and significant cost savings compared to legacy products.
For SoHo and SME customers, which represent c.50% of divisional service revenues, we aim to cross-sell fixed and unified communications propositions and also to position Vodafone as an integrator of value added digital and IoT services, offsetting the pressure on mobile prices.
CHIEF EXECUTIVE’S STATEMENT
4
Overall, Vodafone Business service revenues grew by 1.0%* in H1 (Q1: 0.9%*, Q2 1.1%*), led by good growth in Vodacom (4.7%*) and with a stable performance in Europe (0.2%*). Within Europe, Germany and the UK improved, while southern Europe slowed. Fixed revenues, which represent 31.0% of Vodafone Business, grew at 3.9%* (Q1: 3.2%*, Q2 4.7%*), supported by ongoing market share gains in fixed, security and cloud services. Mobile declined by 0.3%* (Q1: -0.1%*, Q2 -0.5%*), as customer growth and IoT gains were offset by ARPU pressure.
The Vodafone Business contribution margin expanded by 90 basis points in H1, reflecting our salesforce transformation initiative.
Emerging Consumer: Driving data penetration, growing digital and financial serv ices
In H1, the Emerging Consumer segment accounted for 16.8% of Group service revenues.
We continue to see significant growth potential in our African and Middle Eastern markets. Data growth remained strong at 18% in Q2, however data penetration is currently still low, with only 22% of our mobile customer base using 4G services, and with smartphone penetration at only 43%. As 4G smartphone costs continue to fall, driving ongoing adoption, we aim to grow ARPU. For example, customers in South Africa typically spend 22% more when moving from 3G to 4G services.
We also see significant opportunity to grow in digital and financial services. M-Pesa, our African payments platform, has moved beyond its origins as a money transfer service, and now provides enterprise payments, financial services and merchant payment services for mobile commerce. Over US$10 billion of payments are processed over the platform every month, across the seven African markets where M-Pesa services are active. We now have 35 million M-Pesa customers, and in H1 M-Pesa grew revenues by 19.4%* to €0.4 billion. M-Pesa represented 12.0% of Emerging Consumer service revenues in H1.
During H1, the Emerging Consumer segment grew at 7.4%*. In euro terms service revenue declined by 9.3%, due to a sharp FX devaluation in Turkey.
Digital Transformation: A new radically simpler, ‘digital first’ operating model, leveraging Group scale
We see the emergence of new digital technologies, including big data analytics, artificial intelligence agents and robotic process automation (RPA) as a compelling opportunity to transform the Group’s operating model and fundamentally reshape our cost base. We are accelerating the implementation of our ‘Digital Vodafone’ programme, as speed will be a key factor in retaining the benefit of these new technologies.
During H1, we increased the proportion of mobile customers acquired through online channels to 13%, compared to less than 10% a year ago, helping to reduce commissions paid to third party distributors. In fixed, 30% of customer acquisitions are now online. In customer operations, we have deployed our TOBi chatbots in 5 markets, with a further 5 markets due to launch in H2. This contributed to a 10% year-on-year reduction in the frequency of customer contacts to our call centres in H1 (excluding the impact of our commercial repositioning in Spain). In addition, by deploying RPA ‘bots’ in our shared service centres, we reduced over 900 FTE roles in H1.
In order to gain the full benefit of this ‘digital first’ approach, we intend to shift towards a radically simpler and more flexible operating model. Over the coming quarters, we will adopt new simplified pricing models across our markets, and will proactively phase out complex legacy pricing structures. Lower complexity will allow both significant savings in IT costs and greater commercial agility. We are also introducing a number of ‘digital only’ products, starting with ‘Vodafone Bit’ in Spain, which will have lower commissions and operating costs.
We also see additional opportunities to leverage Group scale. We already have 20,000 employees in our shared service centres in India, Egypt and Eastern Europe, and have centralised over 80% of procurement. Looking ahead, we see further opportunities from centralising European network design and engineering functions, as well as IT operations.
Together with the benefits of our ongoing ‘Fit for Growth’ programme and zero based budgeting efforts, we expect that the rapid adoption of digital technologies will enable us to reduce operating expenses in our European operations (including Common functions) by at least €1.2 billion on an absolute organic basis by FY21, compared to FY18 levels. In AMAP, operating expenses are expected to continue to grow below local inflation levels, supporting margins.
In H1, we reduced net operating expenses on an organic basis by €0.2 billion in Europe and Common Functions, and by €0.1 billion for the Group overall. For the full year, we aim to reduce operating expenses on an organic basis by €400 million in Europe and Common Functions. This is the third year in a row in which we have reduced our net operating expenses, supporting organic EBITDA margin expansion.
CHIEF EXECUTIVE’S STATEMENT
5
Improving asset util isation: Capturing synergies, strategic partnerships and creating a virtual TowerCo in Europe
We aim to improve the utilisation of all of the Group’s assets as part of our focus on improving returns on capital. We have announced a number of in-market consolidation deals, which we expect to unlock significant synergies. We have a strong track record of delivering or exceeding targeted cost and capex synergies on prior deals, including KDG in Germany and ONO in Spain.
In the Netherlands, VodafoneZiggo has already delivered over one-third of targeted cost and capex synergies, and is on track to achieve its goal of €210 million of annual run-rate savings by calendar 2021 (the fifth full year post closing). In India, we are making a fast start on capturing the US$10 billion NPV of targeted cost and capex savings following the merger of Vodafone India with Idea Cellular. Our announced acquisition of Liberty Global’s cable assets in Germany and Central and Eastern Europe (“CEE”) targets expected cost and capex savings of €535 million by the fifth full year post completion, with an NPV of €6 billion including integration costs. We will remain highly focused on capturing these significant opportunities for value creation.
We also believe that strategic partnerships are another important potential route towards improving industry returns. We have been successful in agreeing capital-smart partnerships in fixed-line, notably in Italy, the UK and Portugal, and we also intend to explore opportunities for partnerships in mobile, providing that these do not compromise our network differentiation.
In this context, we are creating a virtual Tower company to manage the 58,000 towers in our controlled operations across Europe. This internal vertical organisation will have a dedicated management team solely focused on adding new tenancies and reducing operating expenses. We are also conducting due diligence in order to determine the optimal strategic and financial direction for all of our tower assets, including those held in joint ventures.
Notes: * All amounts in this document marked with an “*” represent organic growth which presents performance on a comparable basis, both in terms of merger and
acquisition activity and movements in foreign exchange rates. “Change at constant exchange rates” presents performance on a comparable basis in terms of foreign exchange rates only. Organic growth and change at constant exchange rates are alternative performance measures. See “Alternative performance measures” on page 48 for further details and reconciliations to the respective closest equivalent GAAP measure.
** Organic growth excluding the impact of UK handset financing and settlements (see page 53 for further details). 1. Following the adoption of IFRS 15 “Revenue from Contracts with Customers” on 1 April 2018, the Group’s statutory results for the six months ended 30
September 2018 are on an IFRS 15 basis, whereas the statutory results for the six months ended 30 September 2017 are on an IAS 18 basis as previously reported.
2. Six months ended 30 September 2018 includes €3.5 billion of impairment charges in respect of the Group’s investments in Spain, Romania and Vodafone Idea and a €3.4 billion loss on the disposal of Vodafone India. See note 8 “Acquisitions and disposals” for further details.
3. Alternative performance measures are non-GAAP measures that are presented to provide readers with additional financial information that is regularly reviewed by management and should not be viewed in isolation or as an alternative to the equivalent GAAP measure. Group service revenue, adjusted EBITDA and adjusted EBIT are presented on an IAS 18 basis. See “Alternative performance measures” on page 48 for reconciliations to the closest respective equivalent GAAP measure and “Definition of terms” on page 59 for further details.
GUIDANCE
6
Please see page 48 for “Alternative performance measures”, page 59 for “Definition of terms” and page 61 for “Forward-looking statements”.
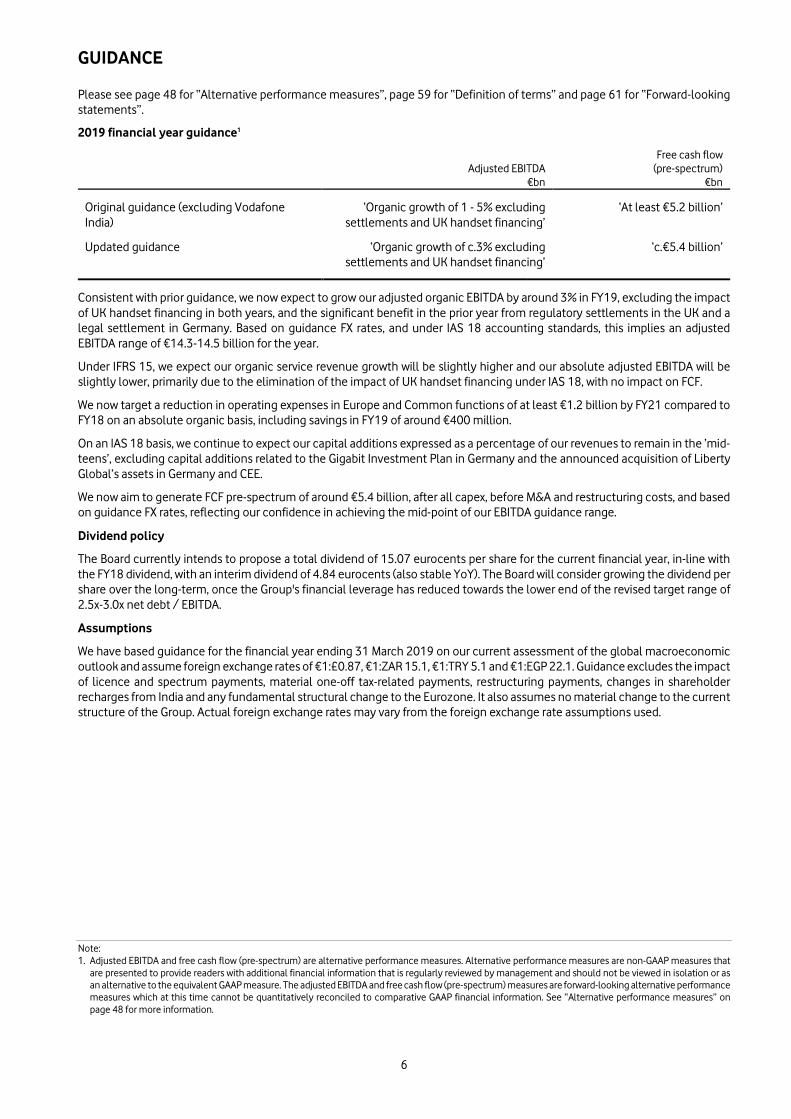
2019 financial year guidance1
Adjusted EBITDA
€bn
Free cash flow (pre-spectrum)
€bn
Original guidance (excluding Vodafone India)
‘Organic growth of 1 - 5% excluding settlements and UK handset financing’
‘At least €5.2 billion’
Updated guidance ‘Organic growth of c.3% excluding settlements and UK handset financing’
‘c.€5.4 billion’
Consistent with prior guidance, we now expect to grow our adjusted organic EBITDA by around 3% in FY19, excluding the impact of UK handset financing in both years, and the significant benefit in the prior year from regulatory settlements in the UK and a legal settlement in Germany. Based on guidance FX rates, and under IAS 18 accounting standards, this implies an adjusted EBITDA range of €14.3-14.5 billion for the year.
Under IFRS 15, we expect our organic service revenue growth will be slightly higher and our absolute adjusted EBITDA will be slightly lower, primarily due to the elimination of the impact of UK handset financing under IAS 18, with no impact on FCF.
We now target a reduction in operating expenses in Europe and Common functions of at least €1.2 billion by FY21 compared to FY18 on an absolute organic basis, including savings in FY19 of around €400 million.
On an IAS 18 basis, we continue to expect our capital additions expressed as a percentage of our revenues to remain in the ‘mid-teens’, excluding capital additions related to the Gigabit Investment Plan in Germany and the announced acquisition of Liberty Global’s assets in Germany and CEE.
We now aim to generate FCF pre-spectrum of around €5.4 billion, after all capex, before M&A and restructuring costs, and based on guidance FX rates, reflecting our confidence in achieving the mid-point of our EBITDA guidance range.
Dividend policy
The Board currently intends to propose a total dividend of 15.07 eurocents per share for the current financial year, in-line with the FY18 dividend, with an interim dividend of 4.84 eurocents (also stable YoY). The Board will consider growing the dividend per share over the long-term, once the Group's financial leverage has reduced towards the lower end of the revised target range of 2.5x-3.0x net debt / EBITDA.
Assumptions
We have based guidance for the financial year ending 31 March 2019 on our current assessment of the global macroeconomic outlook and assume foreign exchange rates of €1:£0.87, €1:ZAR 15.1, €1:TRY 5.1 and €1:EGP 22.1. Guidance excludes the impact of licence and spectrum payments, material one-off tax-related payments, restructuring payments, changes in shareholder recharges from India and any fundamental structural change to the Eurozone. It also assumes no material change to the current structure of the Group. Actual foreign exchange rates may vary from the foreign exchange rate assumptions used.
Note: 1. Adjusted EBITDA and free cash flow (pre-spectrum) are alternative performance measures. Alternative performance measures are non-GAAP measures that
are presented to provide readers with additional financial information that is regularly reviewed by management and should not be viewed in isolation or as an alternative to the equivalent GAAP measure. The adjusted EBITDA and free cash flow (pre-spectrum) measures are forward-looking alternative performance measures which at this time cannot be quantitatively reconciled to comparative GAAP financial information. See “Alternative performance measures” on page 48 for more information.
CONTENTS
7
Page Financial results 7 Liquidity and capital resources 18 Risk factors 20 Responsibility statement 21 Unaudited condensed consolidated financial statements 22 Alternative performance measurements 48 Additional information 56 Other information (including forward-looking statements) 59
FINANCIAL RESULTS
Group1, 2
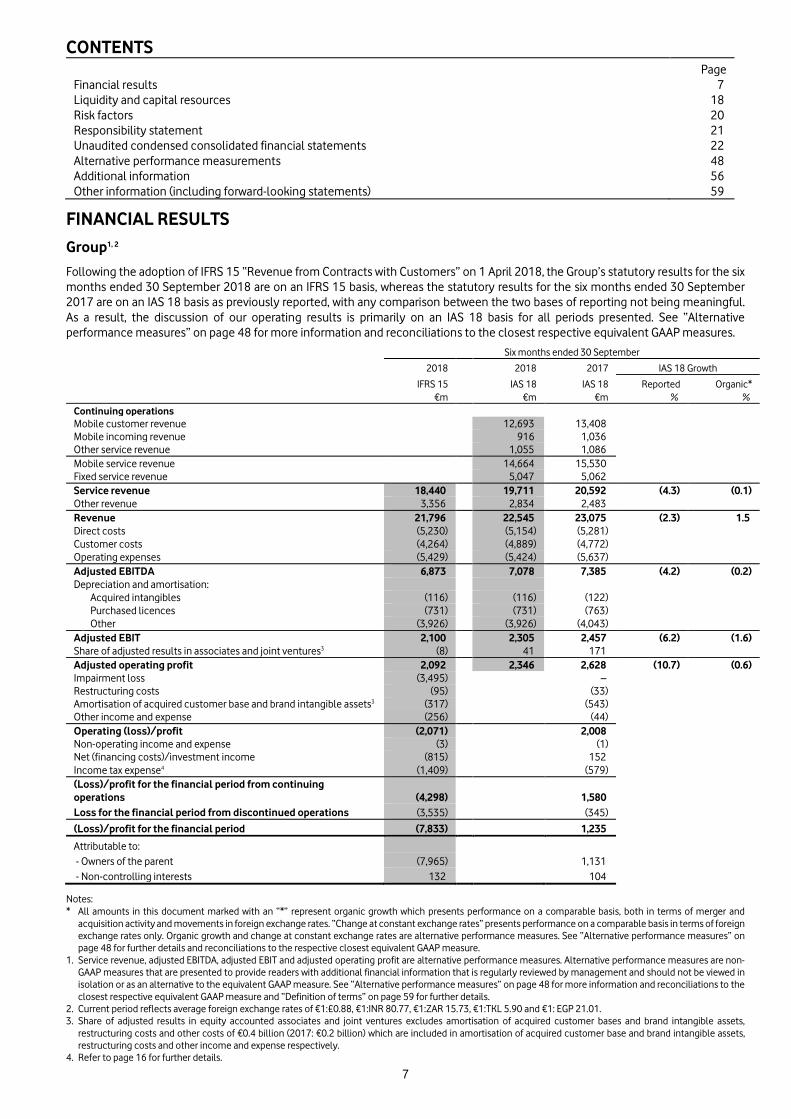
Following the adoption of IFRS 15 “Revenue from Contracts with Customers” on 1 April 2018, the Group’s statutory results for the six months ended 30 September 2018 are on an IFRS 15 basis, whereas the statutory results for the six months ended 30 September 2017 are on an IAS 18 basis as previously reported, with any comparison between the two bases of reporting not being meaningful. As a result, the discussion of our operating results is primarily on an IAS 18 basis for all periods presented. See “Alternative performance measures” on page 48 for more information and reconciliations to the closest respective equivalent GAAP measures.
Six months ended 30 September
2018 2018 2017 IAS 18 Growth
IFRS 15 IAS 18 IAS 18 Reported Organic* €m €m €m % % Continuing operations
Mobile customer revenue 12,693 13,408
Mobile incoming revenue 916 1,036
Other service revenue 1,055 1,086
Mobile service revenue 14,664 15,530
Fixed service revenue 5,047 5,062
Service revenue 18,440 19,711 20,592 (4.3) (0.1) Other revenue 3,356 2,834 2,483
Revenue 21,796 22,545 23,075 (2.3) 1.5 Direct costs (5,230) (5,154) (5,281)
Customer costs (4,264) (4,889) (4,772)
Operating expenses (5,429) (5,424) (5,637)
Adjusted EBITDA 6,873 7,078 7,385 (4.2) (0.2) Depreciation and amortisation:
Acquired intangibles (116) (116) (122)
Purchased licences (731) (731) (763)
Other (3,926) (3,926) (4,043)
Adjusted EBIT 2,100 2,305 2,457 (6.2) (1.6) Share of adjusted results in associates and joint ventures3 (8) 41 171
Adjusted operating profit 2,092 2,346 2,628 (10.7) (0.6) Impairment loss (3,495) –
Restructuring costs (95) (33)
Amortisation of acquired customer base and brand intangible assets3 (317) (543)
Other income and expense (256) (44)
Operating (loss)/profit (2,071) 2,008
Non-operating income and expense (3) (1)
Net (financing costs)/investment income (815) 152
Income tax expense4 (1,409) (579)
(Loss)/profit for the financial period from continuing operations (4,298) 1,580
Loss for the financial period from discontinued operations (3,535) (345)
(Loss)/profit for the financial period (7,833) 1,235
Attributable to:
- Owners of the parent (7,965) 1,131
- Non-controlling interests 132 104
Notes: * All amounts in this document marked with an “*” represent organic growth which presents performance on a comparable basis, both in terms of merger and
acquisition activity and movements in foreign exchange rates. “Change at constant exchange rates” presents performance on a comparable basis in terms of foreign exchange rates only. Organic growth and change at constant exchange rates are alternative performance measures. See “Alternative performance measures” on page 48 for further details and reconciliations to the respective closest equivalent GAAP measure.
1. Service revenue, adjusted EBITDA, adjusted EBIT and adjusted operating profit are alternative performance measures. Alternative performance measures are non-GAAP measures that are presented to provide readers with additional financial information that is regularly reviewed by management and should not be viewed in isolation or as an alternative to the equivalent GAAP measure. See “Alternative performance measures” on page 48 for more information and reconciliations to the closest respective equivalent GAAP measure and “Definition of terms” on page 59 for further details.
2. Current period reflects average foreign exchange rates of €1:£0.88, €1:INR 80.77, €1:ZAR 15.73, €1:TKL 5.90 and €1: EGP 21.01. 3. Share of adjusted results in equity accounted associates and joint ventures excludes amortisation of acquired customer bases and brand intangible assets,
restructuring costs and other costs of €0.4 billion (2017: €0.2 billion) which are included in amortisation of acquired customer base and brand intangible assets, restructuring costs and other income and expense respectively.
4. Refer to page 16 for further details.
FINANCIAL RESULTS
8
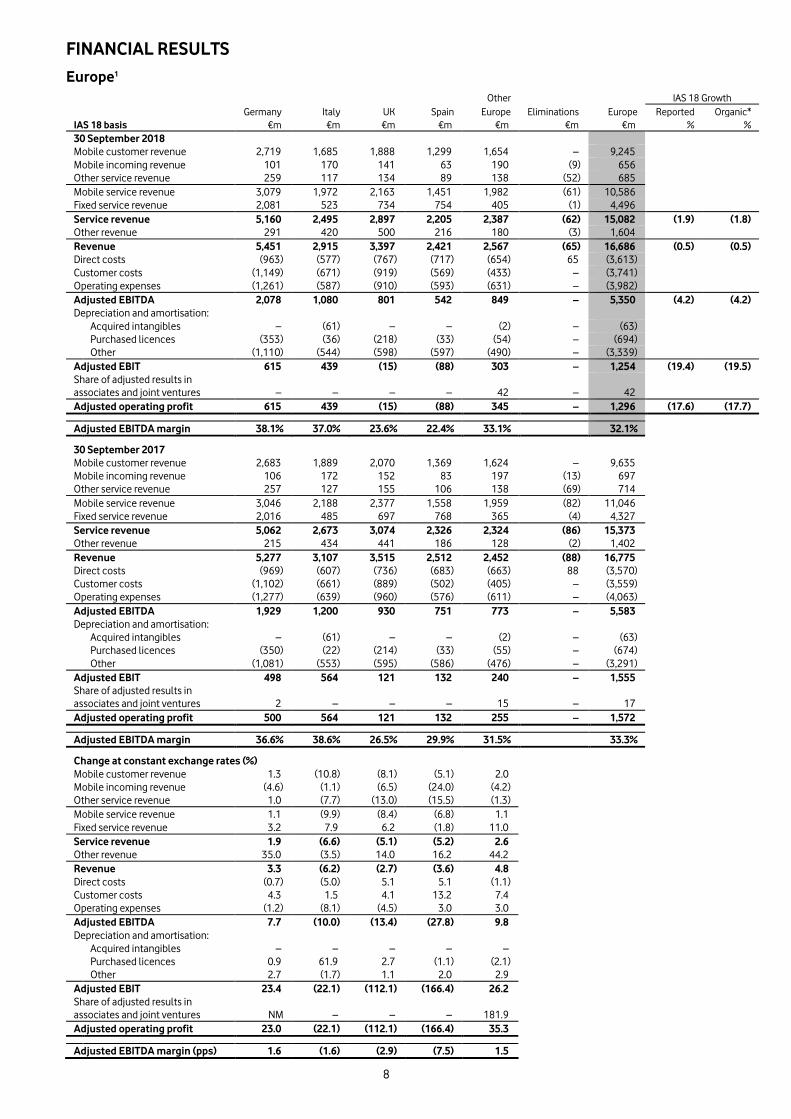
Europe1 Other IAS 18 Growth Germany Italy UK Spain Europe Eliminations Europe Reported Organic* IAS 18 basis €m €m €m €m €m €m €m % % 30 September 2018
Mobile customer revenue 2,719 1,685 1,888 1,299 1,654 – 9,245 Mobile incoming revenue 101 170 141 63 190 (9) 656 Other service revenue 259 117 134 89 138 (52) 685 Mobile service revenue 3,079 1,972 2,163 1,451 1,982 (61) 10,586 Fixed service revenue 2,081 523 734 754 405 (1) 4,496 Service revenue 5,160 2,495 2,897 2,205 2,387 (62) 15,082 (1.9) (1.8) Other revenue 291 420 500 216 180 (3) 1,604 Revenue 5,451 2,915 3,397 2,421 2,567 (65) 16,686 (0.5) (0.5) Direct costs (963) (577) (767) (717) (654) 65 (3,613) Customer costs (1,149) (671) (919) (569) (433) – (3,741) Operating expenses (1,261) (587) (910) (593) (631) – (3,982) Adjusted EBITDA 2,078 1,080 801 542 849 – 5,350 (4.2) (4.2) Depreciation and amortisation:
Acquired intangibles – (61) – – (2) – (63) Purchased licences (353) (36) (218) (33) (54) – (694) Other (1,110) (544) (598) (597) (490) – (3,339) Adjusted EBIT 615 439 (15) (88) 303 – 1,254 (19.4) (19.5) Share of adjusted results in associates and joint ventures – – – – 42 – 42 Adjusted operating profit 615 439 (15) (88) 345 – 1,296 (17.6) (17.7)
Adjusted EBITDA margin 38.1% 37.0% 23.6% 22.4% 33.1% 32.1%
30 September 2017
Mobile customer revenue 2,683 1,889 2,070 1,369 1,624 – 9,635 Mobile incoming revenue 106 172 152 83 197 (13) 697 Other service revenue 257 127 155 106 138 (69) 714 Mobile service revenue 3,046 2,188 2,377 1,558 1,959 (82) 11,046 Fixed service revenue 2,016 485 697 768 365 (4) 4,327 Service revenue 5,062 2,673 3,074 2,326 2,324 (86) 15,373 Other revenue 215 434 441 186 128 (2) 1,402 Revenue 5,277 3,107 3,515 2,512 2,452 (88) 16,775 Direct costs (969) (607) (736) (683) (663) 88 (3,570) Customer costs (1,102) (661) (889) (502) (405) – (3,559) Operating expenses (1,277) (639) (960) (576) (611) – (4,063) Adjusted EBITDA 1,929 1,200 930 751 773 – 5,583 Depreciation and amortisation:
Acquired intangibles – (61) – – (2) – (63) Purchased licences (350) (22) (214) (33) (55) – (674) Other (1,081) (553) (595) (586) (476) – (3,291) Adjusted EBIT 498 564 121 132 240 – 1,555 Share of adjusted results in associates and joint ventures 2 – – – 15 – 17 Adjusted operating profit 500 564 121 132 255 – 1,572
Adjusted EBITDA margin 36.6% 38.6% 26.5% 29.9% 31.5% 33.3%
Change at constant exchange rates (%) Mobile customer revenue 1.3 (10.8) (8.1) (5.1) 2.0 Mobile incoming revenue (4.6) (1.1) (6.5) (24.0) (4.2) Other service revenue 1.0 (7.7) (13.0) (15.5) (1.3) Mobile service revenue 1.1 (9.9) (8.4) (6.8) 1.1 Fixed service revenue 3.2 7.9 6.2 (1.8) 11.0 Service revenue 1.9 (6.6) (5.1) (5.2) 2.6 Other revenue 35.0 (3.5) 14.0 16.2 44.2 Revenue 3.3 (6.2) (2.7) (3.6) 4.8 Direct costs (0.7) (5.0) 5.1 5.1 (1.1) Customer costs 4.3 1.5 4.1 13.2 7.4 Operating expenses (1.2) (8.1) (4.5) 3.0 3.0 Adjusted EBITDA 7.7 (10.0) (13.4) (27.8) 9.8 Depreciation and amortisation:
Acquired intangibles – – – – – Purchased licences 0.9 61.9 2.7 (1.1) (2.1) Other 2.7 (1.7) 1.1 2.0 2.9 Adjusted EBIT 23.4 (22.1) (112.1) (166.4) 26.2 Share of adjusted results in associates and joint ventures NM – – – 181.9 Adjusted operating profit 23.0 (22.1) (112.1) (166.4) 35.3
Adjusted EBITDA margin (pps) 1.6 (1.6) (2.9) (7.5) 1.5
FINANCIAL RESULTS
9
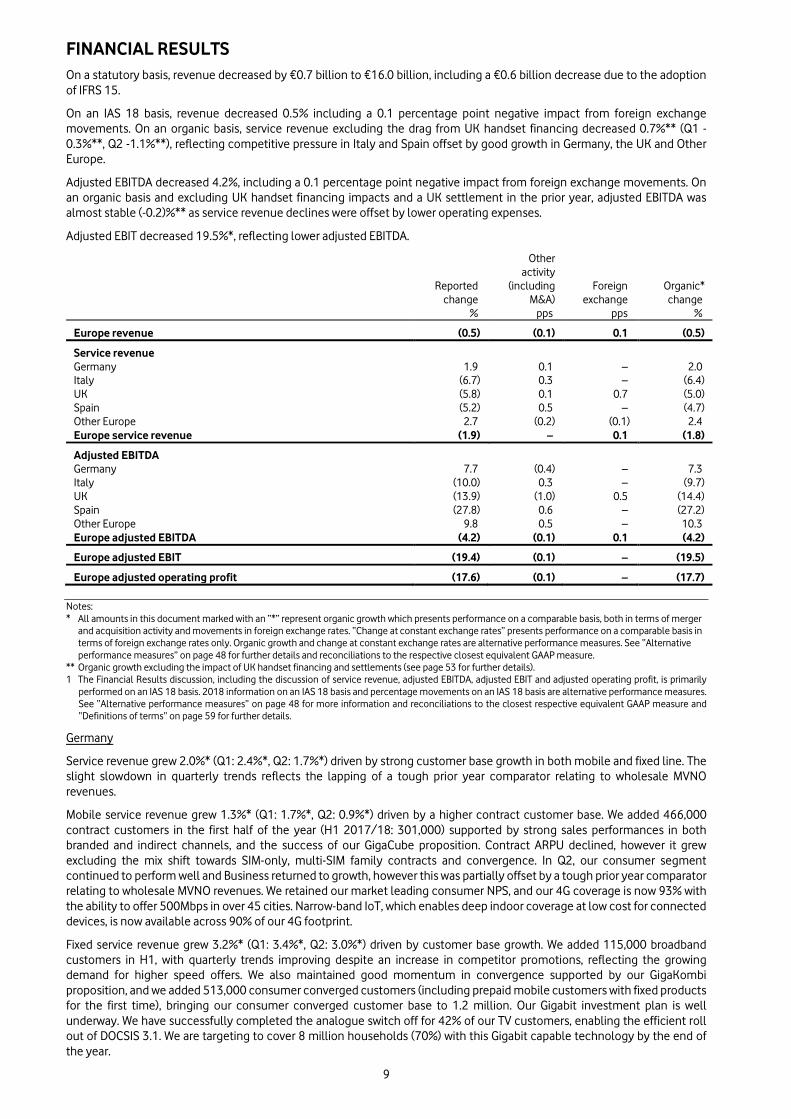
On a statutory basis, revenue decreased by €0.7 billion to €16.0 billion, including a €0.6 billion decrease due to the adoption of IFRS 15.
On an IAS 18 basis, revenue decreased 0.5% including a 0.1 percentage point negative impact from foreign exchange movements. On an organic basis, service revenue excluding the drag from UK handset financing decreased 0.7%** (Q1 -0.3%**, Q2 -1.1%**), reflecting competitive pressure in Italy and Spain offset by good growth in Germany, the UK and Other Europe.
Adjusted EBITDA decreased 4.2%, including a 0.1 percentage point negative impact from foreign exchange movements. On an organic basis and excluding UK handset financing impacts and a UK settlement in the prior year, adjusted EBITDA was almost stable (-0.2)%** as service revenue declines were offset by lower operating expenses.
Adjusted EBIT decreased 19.5%*, reflecting lower adjusted EBITDA.
Other activity
Reported (including Foreign Organic* change M&A) exchange change % pps pps %
Europe revenue (0.5) (0.1) 0.1 (0.5) Service revenue
Germany 1.9 0.1 – 2.0 Italy (6.7) 0.3 – (6.4) UK (5.8) 0.1 0.7 (5.0) Spain (5.2) 0.5 – (4.7) Other Europe 2.7 (0.2) (0.1) 2.4 Europe service revenue (1.9) – 0.1 (1.8) Adjusted EBITDA
Germany 7.7 (0.4) – 7.3 Italy (10.0) 0.3 – (9.7) UK (13.9) (1.0) 0.5 (14.4) Spain (27.8) 0.6 – (27.2) Other Europe 9.8 0.5 – 10.3 Europe adjusted EBITDA (4.2) (0.1) 0.1 (4.2) Europe adjusted EBIT (19.4) (0.1) – (19.5) Europe adjusted operating profit (17.6) (0.1) – (17.7)
Notes: * All amounts in this document marked with an “*” represent organic growth which presents performance on a comparable basis, both in terms of merger
and acquisition activity and movements in foreign exchange rates. “Change at constant exchange rates” presents performance on a comparable basis in terms of foreign exchange rates only. Organic growth and change at constant exchange rates are alternative performance measures. See “Alternative performance measures” on page 48 for further details and reconciliations to the respective closest equivalent GAAP measure.
** Organic growth excluding the impact of UK handset financing and settlements (see page 53 for further details). 1 The Financial Results discussion, including the discussion of service revenue, adjusted EBITDA, adjusted EBIT and adjusted operating profit, is primarily
performed on an IAS 18 basis. 2018 information on an IAS 18 basis and percentage movements on an IAS 18 basis are alternative performance measures. See “Alternative performance measures” on page 48 for more information and reconciliations to the closest respective equivalent GAAP measure and “Definitions of terms” on page 59 for further details.
Germany
Service revenue grew 2.0%* (Q1: 2.4%*, Q2: 1.7%*) driven by strong customer base growth in both mobile and fixed line. The slight slowdown in quarterly trends reflects the lapping of a tough prior year comparator relating to wholesale MVNO revenues.
Mobile service revenue grew 1.3%* (Q1: 1.7%*, Q2: 0.9%*) driven by a higher contract customer base. We added 466,000 contract customers in the first half of the year (H1 2017/18: 301,000) supported by strong sales performances in both branded and indirect channels, and the success of our GigaCube proposition. Contract ARPU declined, however it grew excluding the mix shift towards SIM-only, multi-SIM family contracts and convergence. In Q2, our consumer segment continued to perform well and Business returned to growth, however this was partially offset by a tough prior year comparator relating to wholesale MVNO revenues. We retained our market leading consumer NPS, and our 4G coverage is now 93% with the ability to offer 500Mbps in over 45 cities. Narrow-band IoT, which enables deep indoor coverage at low cost for connected devices, is now available across 90% of our 4G footprint.
Fixed service revenue grew 3.2%* (Q1: 3.4%*, Q2: 3.0%*) driven by customer base growth. We added 115,000 broadband customers in H1, with quarterly trends improving despite an increase in competitor promotions, reflecting the growing demand for higher speed offers. We also maintained good momentum in convergence supported by our GigaKombi proposition, and we added 513,000 consumer converged customers (including prepaid mobile customers with fixed products for the first time), bringing our consumer converged customer base to 1.2 million. Our Gigabit investment plan is well underway. We have successfully completed the analogue switch off for 42% of our TV customers, enabling the efficient roll out of DOCSIS 3.1. We are targeting to cover 8 million households (70%) with this Gigabit capable technology by the end of the year.
FINANCIAL RESULTS
10
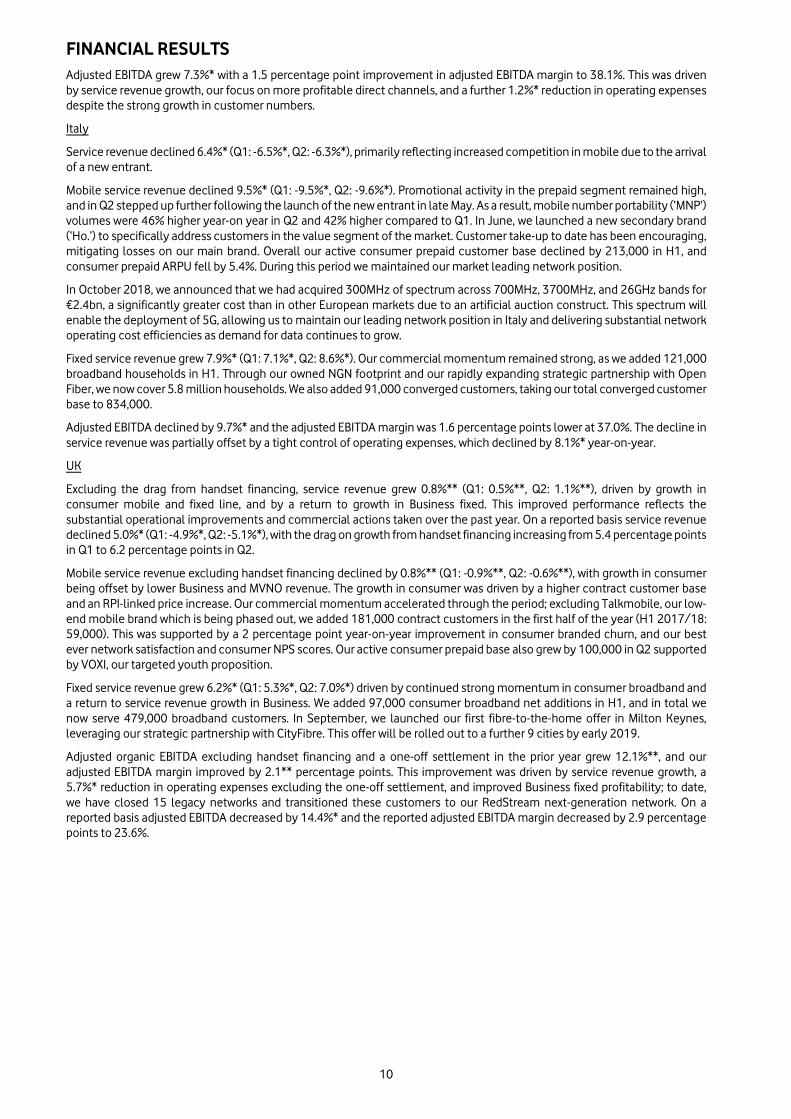
Adjusted EBITDA grew 7.3%* with a 1.5 percentage point improvement in adjusted EBITDA margin to 38.1%. This was driven by service revenue growth, our focus on more profitable direct channels, and a further 1.2%* reduction in operating expenses despite the strong growth in customer numbers.
Italy
Service revenue declined 6.4%* (Q1: -6.5%*, Q2: -6.3%*), primarily reflecting increased competition in mobile due to the arrival of a new entrant.
Mobile service revenue declined 9.5%* (Q1: -9.5%*, Q2: -9.6%*). Promotional activity in the prepaid segment remained high, and in Q2 stepped up further following the launch of the new entrant in late May. As a result, mobile number portability (‘MNP’) volumes were 46% higher year-on year in Q2 and 42% higher compared to Q1. In June, we launched a new secondary brand (‘Ho.’) to specifically address customers in the value segment of the market. Customer take-up to date has been encouraging, mitigating losses on our main brand. Overall our active consumer prepaid customer base declined by 213,000 in H1, and consumer prepaid ARPU fell by 5.4%. During this period we maintained our market leading network position.
In October 2018, we announced that we had acquired 300MHz of spectrum across 700MHz, 3700MHz, and 26GHz bands for €2.4bn, a significantly greater cost than in other European markets due to an artificial auction construct. This spectrum will enable the deployment of 5G, allowing us to maintain our leading network position in Italy and delivering substantial network operating cost efficiencies as demand for data continues to grow.
Fixed service revenue grew 7.9%* (Q1: 7.1%*, Q2: 8.6%*). Our commercial momentum remained strong, as we added 121,000 broadband households in H1. Through our owned NGN footprint and our rapidly expanding strategic partnership with Open Fiber, we now cover 5.8 million households. We also added 91,000 converged customers, taking our total converged customer base to 834,000.
Adjusted EBITDA declined by 9.7%* and the adjusted EBITDA margin was 1.6 percentage points lower at 37.0%. The decline in service revenue was partially offset by a tight control of operating expenses, which declined by 8.1%* year-on-year.
UK
Excluding the drag from handset financing, service revenue grew 0.8%** (Q1: 0.5%**, Q2: 1.1%**), driven by growth in consumer mobile and fixed line, and by a return to growth in Business fixed. This improved performance reflects the substantial operational improvements and commercial actions taken over the past year. On a reported basis service revenue declined 5.0%* (Q1: -4.9%*, Q2: -5.1%*), with the drag on growth from handset financing increasing from 5.4 percentage points in Q1 to 6.2 percentage points in Q2.
Mobile service revenue excluding handset financing declined by 0.8%** (Q1: -0.9%**, Q2: -0.6%**), with growth in consumer being offset by lower Business and MVNO revenue. The growth in consumer was driven by a higher contract customer base and an RPI-linked price increase. Our commercial momentum accelerated through the period; excluding Talkmobile, our low-end mobile brand which is being phased out, we added 181,000 contract customers in the first half of the year (H1 2017/18: 59,000). This was supported by a 2 percentage point year-on-year improvement in consumer branded churn, and our best ever network satisfaction and consumer NPS scores. Our active consumer prepaid base also grew by 100,000 in Q2 supported by VOXI, our targeted youth proposition.
Fixed service revenue grew 6.2%* (Q1: 5.3%*, Q2: 7.0%*) driven by continued strong momentum in consumer broadband and a return to service revenue growth in Business. We added 97,000 consumer broadband net additions in H1, and in total we now serve 479,000 broadband customers. In September, we launched our first fibre-to-the-home offer in Milton Keynes, leveraging our strategic partnership with CityFibre. This offer will be rolled out to a further 9 cities by early 2019.
Adjusted organic EBITDA excluding handset financing and a one-off settlement in the prior year grew 12.1%**, and our adjusted EBITDA margin improved by 2.1** percentage points. This improvement was driven by service revenue growth, a 5.7%* reduction in operating expenses excluding the one-off settlement, and improved Business fixed profitability; to date, we have closed 15 legacy networks and transitioned these customers to our RedStream next-generation network. On a reported basis adjusted EBITDA decreased by 14.4%* and the reported adjusted EBITDA margin decreased by 2.9 percentage points to 23.6%.
FINANCIAL RESULTS
11
Spain
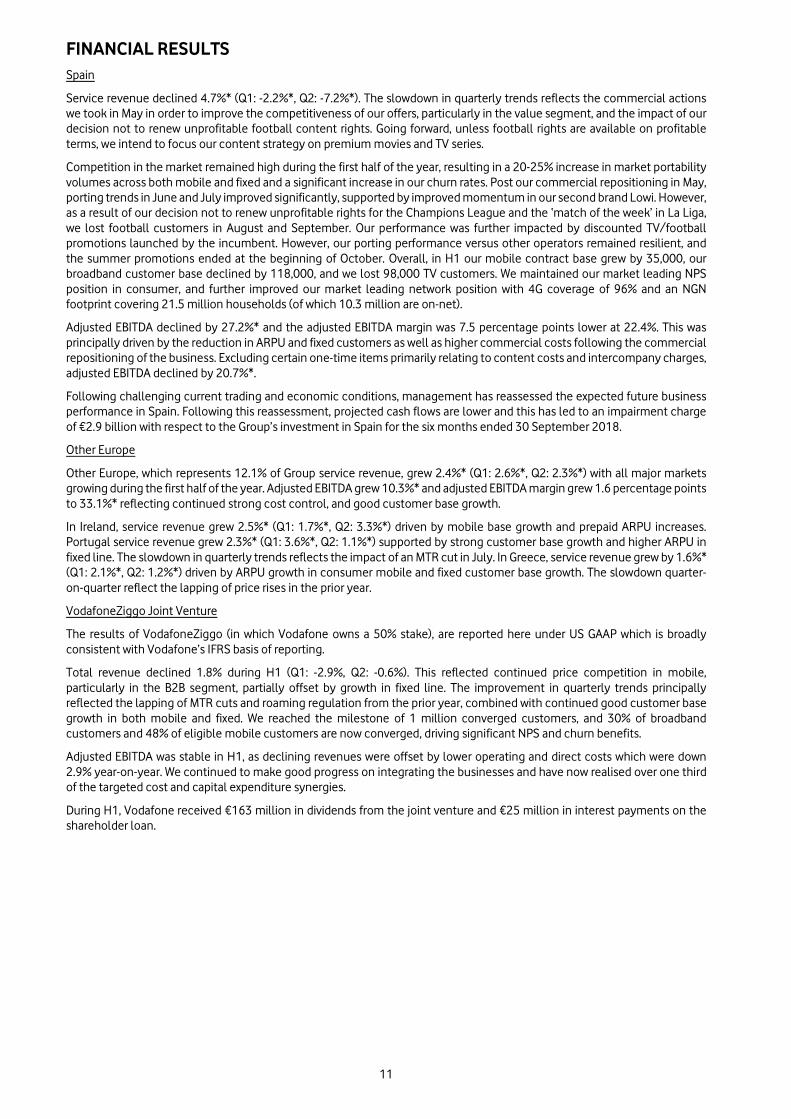
Service revenue declined 4.7%* (Q1: -2.2%*, Q2: -7.2%*). The slowdown in quarterly trends reflects the commercial actions we took in May in order to improve the competitiveness of our offers, particularly in the value segment, and the impact of our decision not to renew unprofitable football content rights. Going forward, unless football rights are available on profitable terms, we intend to focus our content strategy on premium movies and TV series.
Competition in the market remained high during the first half of the year, resulting in a 20-25% increase in market portability volumes across both mobile and fixed and a significant increase in our churn rates. Post our commercial repositioning in May, porting trends in June and July improved significantly, supported by improved momentum in our second brand Lowi. However, as a result of our decision not to renew unprofitable rights for the Champions League and the ‘match of the week’ in La Liga, we lost football customers in August and September. Our performance was further impacted by discounted TV/football promotions launched by the incumbent. However, our porting performance versus other operators remained resilient, and the summer promotions ended at the beginning of October. Overall, in H1 our mobile contract base grew by 35,000, our broadband customer base declined by 118,000, and we lost 98,000 TV customers. We maintained our market leading NPS position in consumer, and further improved our market leading network position with 4G coverage of 96% and an NGN footprint covering 21.5 million households (of which 10.3 million are on-net).
Adjusted EBITDA declined by 27.2%* and the adjusted EBITDA margin was 7.5 percentage points lower at 22.4%. This was principally driven by the reduction in ARPU and fixed customers as well as higher commercial costs following the commercial repositioning of the business. Excluding certain one-time items primarily relating to content costs and intercompany charges, adjusted EBITDA declined by 20.7%*.
Following challenging current trading and economic conditions, management has reassessed the expected future business performance in Spain. Following this reassessment, projected cash flows are lower and this has led to an impairment charge of €2.9 billion with respect to the Group’s investment in Spain for the six months ended 30 September 2018.
Other Europe
Other Europe, which represents 12.1% of Group service revenue, grew 2.4%* (Q1: 2.6%*, Q2: 2.3%*) with all major markets growing during the first half of the year. Adjusted EBITDA grew 10.3%* and adjusted EBITDA margin grew 1.6 percentage points to 33.1%* reflecting continued strong cost control, and good customer base growth.
In Ireland, service revenue grew 2.5%* (Q1: 1.7%*, Q2: 3.3%*) driven by mobile base growth and prepaid ARPU increases. Portugal service revenue grew 2.3%* (Q1: 3.6%*, Q2: 1.1%*) supported by strong customer base growth and higher ARPU in fixed line. The slowdown in quarterly trends reflects the impact of an MTR cut in July. In Greece, service revenue grew by 1.6%* (Q1: 2.1%*, Q2: 1.2%*) driven by ARPU growth in consumer mobile and fixed customer base growth. The slowdown quarter-on-quarter reflect the lapping of price rises in the prior year.
VodafoneZiggo Joint Venture
The results of VodafoneZiggo (in which Vodafone owns a 50% stake), are reported here under US GAAP which is broadly consistent with Vodafone’s IFRS basis of reporting.
Total revenue declined 1.8% during H1 (Q1: -2.9%, Q2: -0.6%). This reflected continued price competition in mobile, particularly in the B2B segment, partially offset by growth in fixed line. The improvement in quarterly trends principally reflected the lapping of MTR cuts and roaming regulation from the prior year, combined with continued good customer base growth in both mobile and fixed. We reached the milestone of 1 million converged customers, and 30% of broadband customers and 48% of eligible mobile customers are now converged, driving significant NPS and churn benefits.
Adjusted EBITDA was stable in H1, as declining revenues were offset by lower operating and direct costs which were down 2.9% year-on-year. We continued to make good progress on integrating the businesses and have now realised over one third of the targeted cost and capital expenditure synergies.
During H1, Vodafone received €163 million in dividends from the joint venture and €25 million in interest payments on the shareholder loan.
FINANCIAL RESULTS
12
Africa, Middle East and Asia Pacific (‘AMAP’)1 IAS 18 Growth
Vodacom Other AMAP Eliminations AMAP Reported Organic* IAS 18 basis €m €m €m €m % % 30 September 2018
Mobile customer revenue 2,014 1,424 – 3,438 Mobile incoming revenue 84 205 – 289 Other service revenue 115 72 – 187 Mobile service revenue 2,213 1,701 – 3,914 Fixed service revenue 127 332 – 459 Service revenue 2,340 2,033 – 4,373 (9.0) 7.4 Other revenue 484 426 – 910 Revenue 2,824 2,459 – 5,283 (7.3) 9.2 Direct costs (399) (776) – (1,175) Customer costs (691) (482) – (1,173) Operating expenses (668) (535) – (1,203) Adjusted EBITDA 1,066 666 – 1,732 (6.5) 6.8 Depreciation and amortisation:
Acquired intangibles (41) (12) – (53) Purchased licences (2) (35) – (37) Other (335) (292) – (627) Adjusted EBIT 688 327 – 1,015 1.3 6.9 Share of adjusted results in associates and joint ventures 106 (107) – (1) Adjusted operating profit 794 220 – 1,014 (12.4) 5.8 Adjusted EBITDA margin 37.7% 27.1% 32.8% 30 September 2017
Mobile customer revenue 1,996 1,761 – 3,757 Mobile incoming revenue 80 262 – 342 Other service revenue 121 88 – 209 Mobile service revenue 2,197 2,111 – 4,308 Fixed service revenue 113 382 – 495 Service revenue 2,310 2,493 – 4,803 Other revenue 489 407 – 896 Revenue 2,799 2,900 – 5,699 Direct costs (361) (937) – (1,298) Customer costs (737) (493) – (1,230) Operating expenses (638) (680) – (1,318) Adjusted EBITDA 1,063 790 – 1,853 Depreciation and amortisation:
Acquired intangibles (43) (16) – (59) Purchased licences (2) (87) – (89) Other (325) (378) – (703) Adjusted EBIT 693 309 – 1,002 Share of adjusted results in associates and joint ventures 29 126 – 155 Adjusted operating profit 722 435 – 1,157 Adjusted EBITDA margin 38.0% 27.2% 32.5%
Change at constant exchange rates (%) Mobile customer revenue 5.2 (1.7) Mobile incoming revenue 9.3 (1.9) Other service revenue (0.4) (1.6) Mobile service revenue 5.1 (1.7) Other service revenue 16.8 (2.2) Service revenue 5.7 (1.8) Other revenue 3.5 39.5 Revenue 5.3 3.5 Direct costs 15.2 1.6 Customer costs (2.2) 29.7 Operating expenses 9.1 (7.2) Adjusted EBITDA 4.8 0.3 Depreciation and amortisation:
Acquired intangibles – – Purchased licences (17.4) (53.1) Other 8.2 (8.6) Adjusted EBIT 3.6 26.9 Share of adjusted results in associates and joint ventures NM NM Adjusted operating profit 14.4 (41.6)
Adjusted EBITDA margin (pps) (0.2) (0.9)
FINANCIAL RESULTS
13
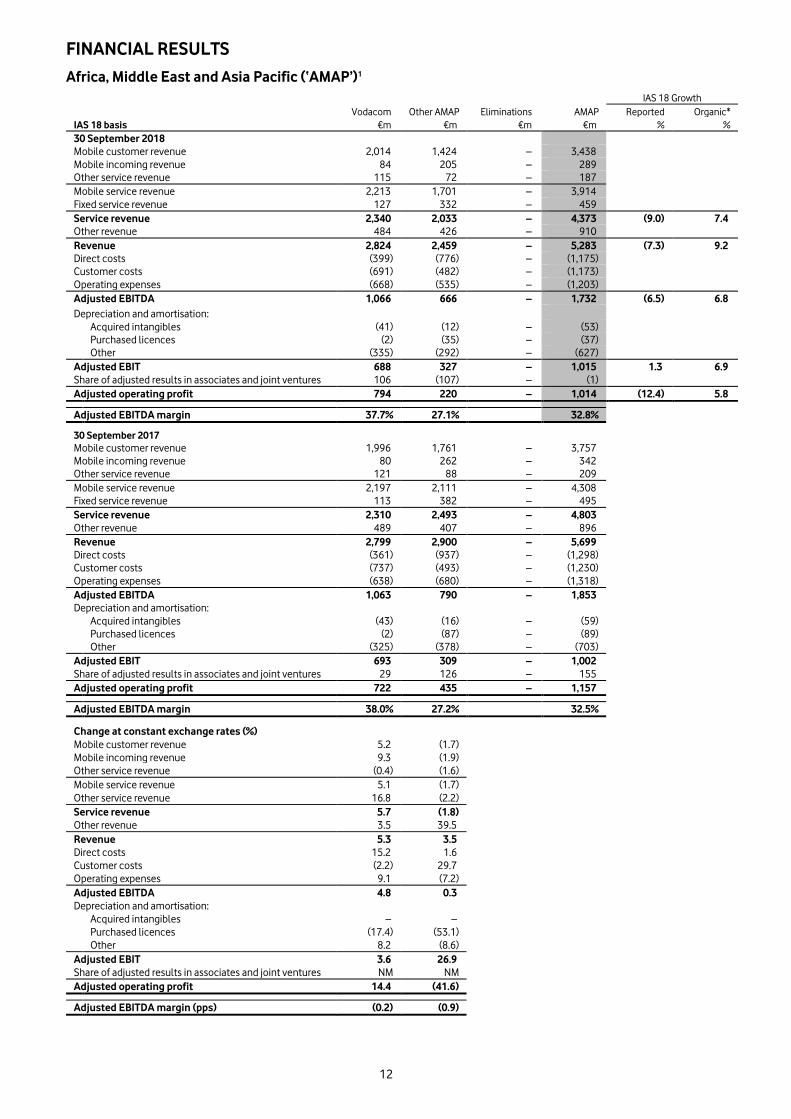
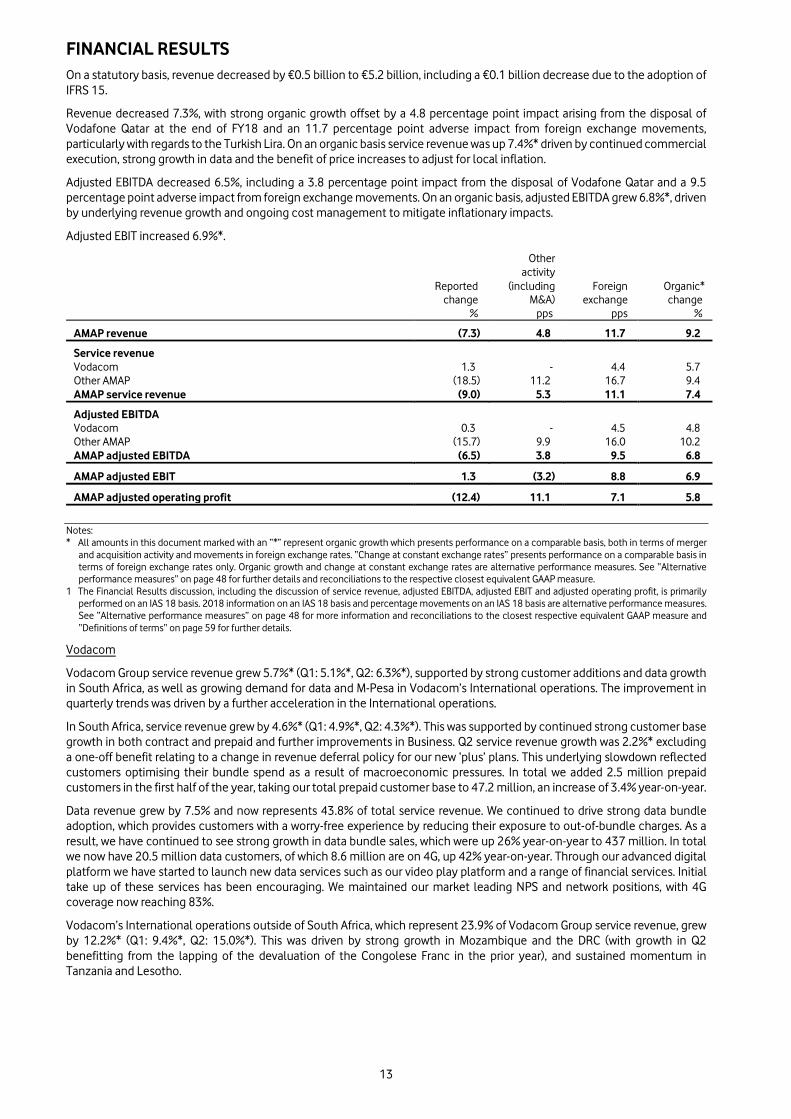
On a statutory basis, revenue decreased by €0.5 billion to €5.2 billion, including a €0.1 billion decrease due to the adoption of IFRS 15.
Revenue decreased 7.3%, with strong organic growth offset by a 4.8 percentage point impact arising from the disposal of Vodafone Qatar at the end of FY18 and an 11.7 percentage point adverse impact from foreign exchange movements, particularly with regards to the Turkish Lira. On an organic basis service revenue was up 7.4%* driven by continued commercial execution, strong growth in data and the benefit of price increases to adjust for local inflation.
Adjusted EBITDA decreased 6.5%, including a 3.8 percentage point impact from the disposal of Vodafone Qatar and a 9.5 percentage point adverse impact from foreign exchange movements. On an organic basis, adjusted EBITDA grew 6.8%*, driven by underlying revenue growth and ongoing cost management to mitigate inflationary impacts.
Adjusted EBIT increased 6.9%*.
Other activity
Reported (including Foreign Organic* change M&A) exchange change % pps pps %
AMAP revenue (7.3) 4.8 11.7 9.2 Service revenue
Vodacom 1.3 - 4.4 5.7 Other AMAP (18.5) 11.2 16.7 9.4 AMAP service revenue (9.0) 5.3 11.1 7.4 Adjusted EBITDA
Vodacom 0.3 - 4.5 4.8 Other AMAP (15.7) 9.9 16.0 10.2 AMAP adjusted EBITDA (6.5) 3.8 9.5 6.8
AMAP adjusted EBIT 1.3 (3.2) 8.8 6.9
AMAP adjusted operating profit (12.4) 11.1 7.1 5.8
Notes: * All amounts in this document marked with an “*” represent organic growth which presents performance on a comparable basis, both in terms of merger
and acquisition activity and movements in foreign exchange rates. “Change at constant exchange rates” presents performance on a comparable basis in terms of foreign exchange rates only. Organic growth and change at constant exchange rates are alternative performance measures. See “Alternative performance measures” on page 48 for further details and reconciliations to the respective closest equivalent GAAP measure.
1 The Financial Results discussion, including the discussion of service revenue, adjusted EBITDA, adjusted EBIT and adjusted operating profit, is primarily performed on an IAS 18 basis. 2018 information on an IAS 18 basis and percentage movements on an IAS 18 basis are alternative performance measures. See “Alternative performance measures” on page 48 for more information and reconciliations to the closest respective equivalent GAAP measure and “Definitions of terms” on page 59 for further details.
Vodacom
Vodacom Group service revenue grew 5.7%* (Q1: 5.1%*, Q2: 6.3%*), supported by strong customer additions and data growth in South Africa, as well as growing demand for data and M-Pesa in Vodacom’s International operations. The improvement in quarterly trends was driven by a further acceleration in the International operations.
In South Africa, service revenue grew by 4.6%* (Q1: 4.9%*, Q2: 4.3%*). This was supported by continued strong customer base growth in both contract and prepaid and further improvements in Business. Q2 service revenue growth was 2.2%* excluding a one-off benefit relating to a change in revenue deferral policy for our new ‘plus’ plans. This underlying slowdown reflected customers optimising their bundle spend as a result of macroeconomic pressures. In total we added 2.5 million prepaid customers in the first half of the year, taking our total prepaid customer base to 47.2 million, an increase of 3.4% year-on-year.
Data revenue grew by 7.5% and now represents 43.8% of total service revenue. We continued to drive strong data bundle adoption, which provides customers with a worry-free experience by reducing their exposure to out-of-bundle charges. As a result, we have continued to see strong growth in data bundle sales, which were up 26% year-on-year to 437 million. In total we now have 20.5 million data customers, of which 8.6 million are on 4G, up 42% year-on-year. Through our advanced digital platform we have started to launch new data services such as our video play platform and a range of financial services. Initial take up of these services has been encouraging. We maintained our market leading NPS and network positions, with 4G coverage now reaching 83%.
Vodacom’s International operations outside of South Africa, which represent 23.9% of Vodacom Group service revenue, grew by 12.2%* (Q1: 9.4%*, Q2: 15.0%*). This was driven by strong growth in Mozambique and the DRC (with growth in Q2 benefitting from the lapping of the devaluation of the Congolese Franc in the prior year), and sustained momentum in Tanzania and Lesotho.
FINANCIAL RESULTS
14
Vodacom’s adjusted EBITDA grew by 4.8%*, supported by revenue growth. Adjusted EBITDA margins reduced modestly to 37.7%, reflecting increased roaming costs in South Africa following a change in accounting treatment, with these costs now reflected in operating expenses.
In September 2018, Vodacom concluded its second broad-based BEE (black economic empowerment) transaction replacing the existing deal from 2008. This new scheme, valued at €1 billion, is the biggest ever in the telecommunications industry and makes YeboYethu (Vodacom South Africa BEE shareholders) the third largest shareholder. The deal secures Vodacom’s Level 3 BEE scorecard credentials, specifically in relation to black ownership, with effective black ownership of c.20%. This is a key input in assessments for spectrum allocation, and Government/corporate business. As a result of this transaction Vodafone Group’s shareholding in Vodacom will fall from 64.5% to 60.5%.
Other AMAP
Service revenue grew 9.4%* (Q1: 9.4%*, Q2: 9.4%*), supported by continued strong operational performances and local currency service revenue growth in both Turkey and Egypt. Adjusted EBITDA grew 10.2%* and the adjusted EBITDA margin declined by 0.1 percentage points to 27.1%.
In Turkey, service revenue grew 14.6%* (Q1: 14.0%*, Q2: 15.2%*) supported by strong net adds in consumer contract, increased mobile data revenue, and good fixed line customer base growth. Adjusted EBITDA grew 17.9%*, however the adjusted EBITDA margin declined by 1.4 percentage points to 21.4% reflecting an increase in costs as a result of greater inflationary pressures and a 30% devaluation in the Turkish Lira during H1.
Egypt service revenue grew 16.9%* (Q1: 16.7%*, Q2: 17.0%*) with successful segmented campaigns, rising data penetration and price increases supporting ARPU. Adjusted EBITDA grew 17.3%* and the adjusted EBITDA margin improved by 0.5 percentage points to 45.6% with revenue growth and strong cost discipline more than offsetting inflationary pressures.
Associates and joint ventures
Vodafone Idea
On 31 August 2018, the Group completed the transaction to combine its subsidiary, Vodafone India (excluding its 42% stake in Indus Towers), with Idea Cellular to form Vodafone Idea, with the combined company being jointly controlled by Vodafone and the Aditya Birla Group. See note 5 “Discontinued operations and assets and liabilities held for sale” for the results of Vodafone India for the five months ended 31 August 2018 and note 8 “Acquisition and disposals” for details on the formation of Vodafone Idea.
The Vodafone Idea joint venture’s net loss for the month of September 2018 is reported within ‘Share of adjusted results for associates and joint ventures’. In accordance with applicable IFRS, the Group also recognised an impairment charge of €0.3 billion to reduce the Group’s carrying value of its investment in Vodafone Idea to fair value at 30 September 2018. See note 3 “Impairment review” for further details. Note 3 also sets out the primary assumptions underlying the carrying value of Vodafone Idea, the risks that these may not materialise and the consequential potential impact on our investment carrying value.
Vodafone Idea will report its second quarter results on 14 November 2018.
FINANCIAL RESULTS
15
Group results
Revenue
On a statutory basis, Group revenue decreased €1.3 billion to €21.8 billion, including a €0.7 billion decrease due to the adoption of IFRS 15 as set out on page 26. On an IAS 18 basis, Group revenue decreased by 2.3% reflecting the disposal of Vodafone Qatar in the prior period and adverse foreign exchange movements.
On an IAS 18 basis, Group service revenue decreased by 0.1%* as market share gains in European Consumer fixed, strong mobile data demand and customer base growth in our emerging market operations and continued momentum in Vodafone Business were offset by increased competitive pressures in Italy and Spain, the drag from lower wholesale revenue and the impact of handset financing.
Adjusted EBITDA
On a statutory basis, Group adjusted EBITDA decreased €0.5 billion to €6.9 billion, including a €0.2 billion decrease due to the adoption of IFRS 15 (see page 26), the disposal of Vodafone Qatar in the prior period and adverse foreign exchange movements. On an IAS 18 basis, Group adjusted EBITDA decreased by 0.2%* and the Group’s adjusted EBITDA margin decreased 0.5* percentage points driven by a lower benefit from handset financing and settlements in the UK.
Adjusted EBIT
On a statutory basis, adjusted EBIT decreased by €0.4 billion to €2.1 billion, including a €0.2 billion decrease due to the adoption of IFRS 15. On an IAS 18 basis, adjusted EBIT decreased by 6.2% to €2.3 billion driven as a result of lower adjusted EBITDA partially offset by lower depreciation and amortisation expenses.
Operating (loss)/profit
Adjusted EBIT excludes certain income and expenses that we have identified separately to allow their effect on the results of the Group to be assessed. The items that are included in statutory operating (loss)/profit but are excluded from adjusted EBIT are discussed below.
For the six months ended 30 September 2018, the Group recorded impairment charges of €3.5 billion. The impairment charges relate solely to goodwill and are recognised in the consolidated income statement within operating (loss)/profit.
The Group’s share of adjusted results in associates and joint ventures was a loss of €0.0 billion, down from a profit of €0.2 billion in the prior year, partly due to the inclusion of the results of Vodafone Idea following the completion of the merger on 31 August 2018.
Restructuring costs and other income and expense increased by €0.3 billion during the period. Amortisation of intangible assets in relation to customer bases and brands, which are recognised on the acquisition of businesses, was €0.3 billion, a decrease of €0.2 billion compared to the prior period.
Including the above items, the Group reported an operating loss of €2.1 billion, a decrease of €4.1 billion on the prior period.
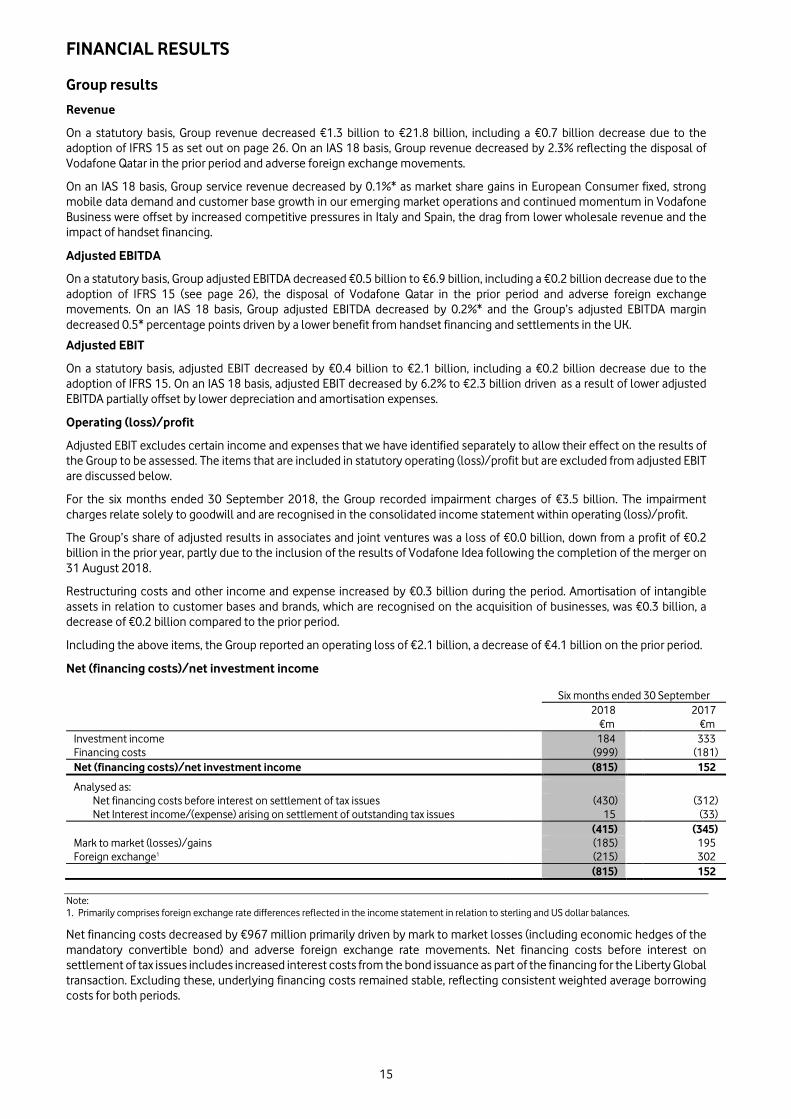
Net (financing costs)/net investment income
Six months ended 30 September
2018 2017 €m €m Investment income 184 333 Financing costs (999) (181) Net (financing costs)/net investment income (815) 152 Analysed as:
Net financing costs before interest on settlement of tax issues (430) (312) Net Interest income/(expense) arising on settlement of outstanding tax issues 15 (33) (415) (345) Mark to market (losses)/gains (185) 195 Foreign exchange1 (215) 302 (815) 152
Note: 1. Primarily comprises foreign exchange rate differences reflected in the income statement in relation to sterling and US dollar balances.
Net financing costs decreased by €967 million primarily driven by mark to market losses (including economic hedges of the mandatory convertible bond) and adverse foreign exchange rate movements. Net financing costs before interest on settlement of tax issues includes increased interest costs from the bond issuance as part of the financing for the Liberty Global transaction. Excluding these, underlying financing costs remained stable, reflecting consistent weighted average borrowing costs for both periods.
FINANCIAL RESULTS
16
Taxation Six months ended 30 September
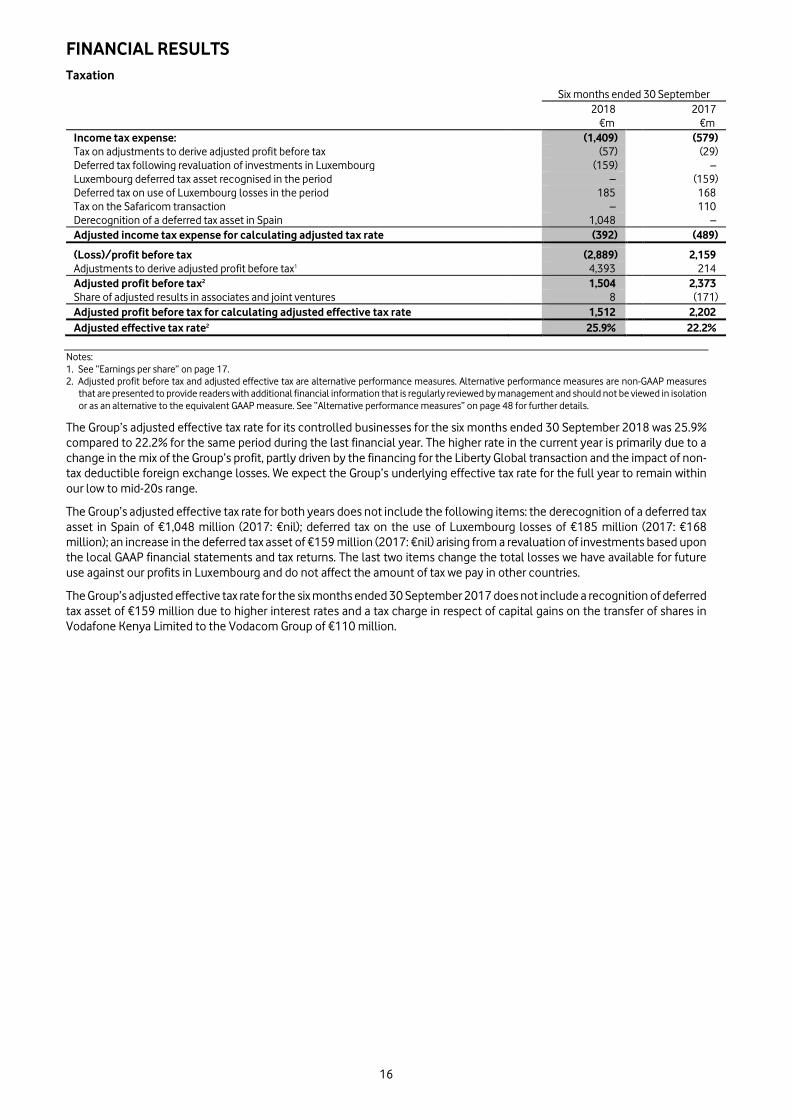
2018 2017 €m €m Income tax expense: (1,409) (579) Tax on adjustments to derive adjusted profit before tax (57) (29) Deferred tax following revaluation of investments in Luxembourg (159) – Luxembourg deferred tax asset recognised in the period – (159) Deferred tax on use of Luxembourg losses in the period 185 168 Tax on the Safaricom transaction – 110 Derecognition of a deferred tax asset in Spain 1,048 – Adjusted income tax expense for calculating adjusted tax rate (392) (489) (Loss)/profit before tax (2,889) 2,159 Adjustments to derive adjusted profit before tax1 4,393 214 Adjusted profit before tax2 1,504 2,373 Share of adjusted results in associates and joint ventures 8 (171) Adjusted profit before tax for calculating adjusted effective tax rate 1,512 2,202 Adjusted effective tax rate2 25.9% 22.2%
Notes: 1. See “Earnings per share” on page 17. 2. Adjusted profit before tax and adjusted effective tax are alternative performance measures. Alternative performance measures are non-GAAP measures
that are presented to provide readers with additional financial information that is regularly reviewed by management and should not be viewed in isolation or as an alternative to the equivalent GAAP measure. See “Alternative performance measures” on page 48 for further details.
The Group’s adjusted effective tax rate for its controlled businesses for the six months ended 30 September 2018 was 25.9% compared to 22.2% for the same period during the last financial year. The higher rate in the current year is primarily due to a change in the mix of the Group’s profit, partly driven by the financing for the Liberty Global transaction and the impact of non-tax deductible foreign exchange losses. We expect the Group’s underlying effective tax rate for the full year to remain within our low to mid-20s range.
The Group’s adjusted effective tax rate for both years does not include the following items: the derecognition of a deferred tax asset in Spain of €1,048 million (2017: €nil); deferred tax on the use of Luxembourg losses of €185 million (2017: €168 million); an increase in the deferred tax asset of €159 million (2017: €nil) arising from a revaluation of investments based upon the local GAAP financial statements and tax returns. The last two items change the total losses we have available for future use against our profits in Luxembourg and do not affect the amount of tax we pay in other countries.
The Group’s adjusted effective tax rate for the six months ended 30 September 2017 does not include a recognition of deferred tax asset of €159 million due to higher interest rates and a tax charge in respect of capital gains on the transfer of shares in Vodafone Kenya Limited to the Vodacom Group of €110 million.
FINANCIAL RESULTS
17
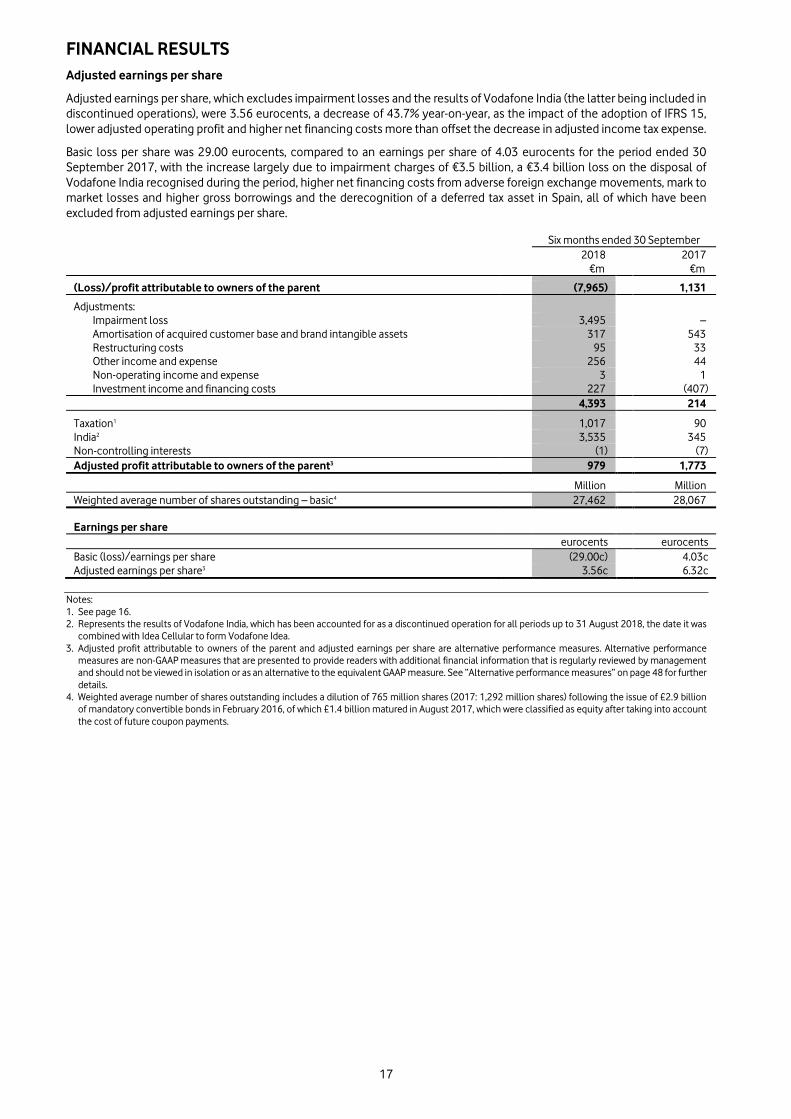
Adjusted earnings per share
Adjusted earnings per share, which excludes impairment losses and the results of Vodafone India (the latter being included in discontinued operations), were 3.56 eurocents, a decrease of 43.7% year-on-year, as the impact of the adoption of IFRS 15, lower adjusted operating profit and higher net financing costs more than offset the decrease in adjusted income tax expense.
Basic loss per share was 29.00 eurocents, compared to an earnings per share of 4.03 eurocents for the period ended 30 September 2017, with the increase largely due to impairment charges of €3.5 billion, a €3.4 billion loss on the disposal of Vodafone India recognised during the period, higher net financing costs from adverse foreign exchange movements, mark to market losses and higher gross borrowings and the derecognition of a deferred tax asset in Spain, all of which have been excluded from adjusted earnings per share.
Six months ended 30 September
2018 2017 €m €m (Loss)/profit attributable to owners of the parent (7,965) 1,131 Adjustments:
Impairment loss 3,495 – Amortisation of acquired customer base and brand intangible assets 317 543 Restructuring costs 95 33 Other income and expense 256 44 Non-operating income and expense 3 1 Investment income and financing costs 227 (407) 4,393 214
Taxation1 1,017 90 India2 3,535 345 Non-controlling interests (1) (7) Adjusted profit attributable to owners of the parent3 979 1,773 Million Million Weighted average number of shares outstanding – basic4 27,462 28,067
Earnings per share
eurocents eurocents Basic (loss)/earnings per share (29.00c) 4.03c Adjusted earnings per share3 3.56c 6.32c
Notes: 1. See page 16. 2. Represents the results of Vodafone India, which has been accounted for as a discontinued operation for all periods up to 31 August 2018, the date it was
combined with Idea Cellular to form Vodafone Idea. 3. Adjusted profit attributable to owners of the parent and adjusted earnings per share are alternative performance measures. Alternative performance
measures are non-GAAP measures that are presented to provide readers with additional financial information that is regularly reviewed by management and should not be viewed in isolation or as an alternative to the equivalent GAAP measure. See “Alternative performance measures” on page 48 for further details.
4. Weighted average number of shares outstanding includes a dilution of 765 million shares (2017: 1,292 million shares) following the issue of £2.9 billion of mandatory convertible bonds in February 2016, of which £1.4 billion matured in August 2017, which were classified as equity after taking into account the cost of future coupon payments.
LIQUIDITY AND CAPITAL RESOURCES
18
Cash flows and funding Six months ended 30 September
IFRS 15 basis IAS 18 basis IAS 18 basis 2018 2018 2017 €m €m €m
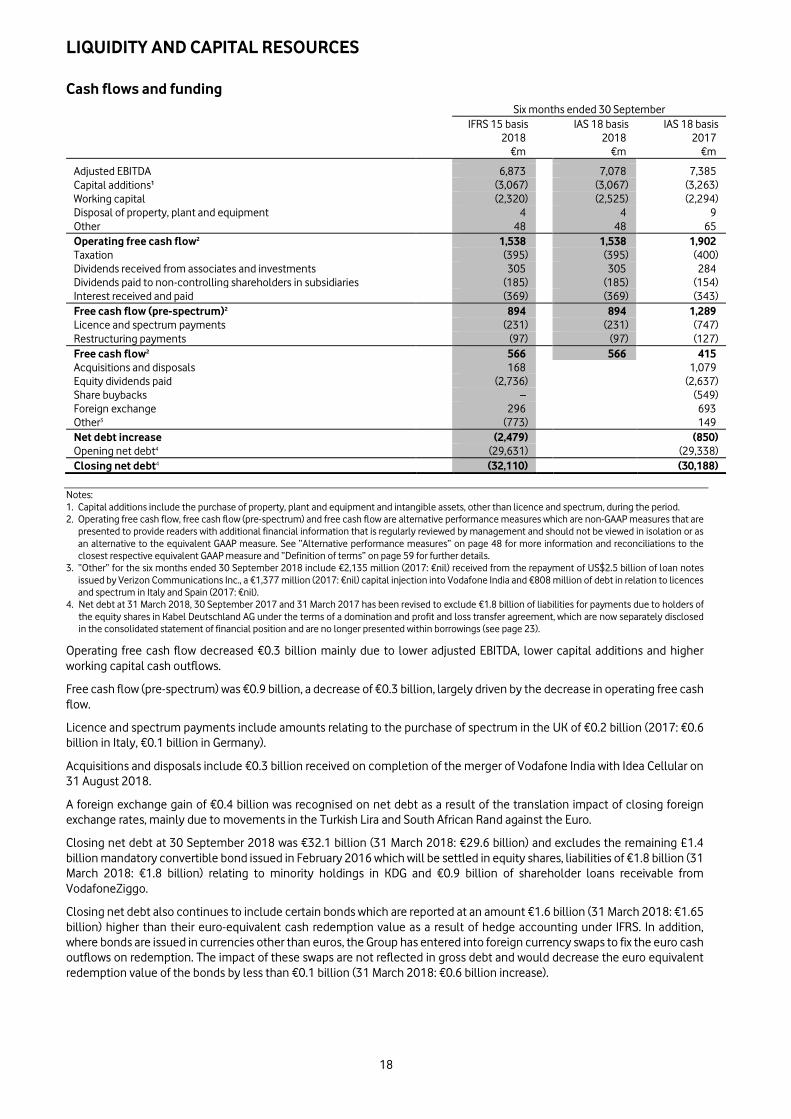
Adjusted EBITDA 6,873 7,078 7,385 Capital additions1 (3,067) (3,067) (3,263) Working capital (2,320) (2,525) (2,294) Disposal of property, plant and equipment 4 4 9 Other 48 48 65 Operating free cash flow2 1,538 1,538 1,902 Taxation (395) (395) (400) Dividends received from associates and investments 305 305 284 Dividends paid to non-controlling shareholders in subsidiaries (185) (185) (154) Interest received and paid (369) (369) (343) Free cash flow (pre-spectrum)2 894 894 1,289 Licence and spectrum payments (231) (231) (747) Restructuring payments (97) (97) (127) Free cash flow2 566 566 415 Acquisitions and disposals 168 1,079 Equity dividends paid (2,736) (2,637) Share buybacks – (549) Foreign exchange 296 693 Other3 (773) 149 Net debt increase (2,479) (850) Opening net debt4 (29,631) (29,338) Closing net debt4 (32,110) (30,188)
Notes: 1. Capital additions include the purchase of property, plant and equipment and intangible assets, other than licence and spectrum, during the period. 2. Operating free cash flow, free cash flow (pre-spectrum) and free cash flow are alternative performance measures which are non-GAAP measures that are
presented to provide readers with additional financial information that is regularly reviewed by management and should not be viewed in isolation or as an alternative to the equivalent GAAP measure. See “Alternative performance measures” on page 48 for more information and reconciliations to the closest respective equivalent GAAP measure and “Definition of terms” on page 59 for further details.
3. “Other” for the six months ended 30 September 2018 include €2,135 million (2017: €nil) received from the repayment of US$2.5 billion of loan notes issued by Verizon Communications Inc., a €1,377 million (2017: €nil) capital injection into Vodafone India and €808 million of debt in relation to licences and spectrum in Italy and Spain (2017: €nil).
4. Net debt at 31 March 2018, 30 September 2017 and 31 March 2017 has been revised to exclude €1.8 billion of liabilities for payments due to holders of the equity shares in Kabel Deutschland AG under the terms of a domination and profit and loss transfer agreement, which are now separately disclosed in the consolidated statement of financial position and are no longer presented within borrowings (see page 23).
Operating free cash flow decreased €0.3 billion mainly due to lower adjusted EBITDA, lower capital additions and higher working capital cash outflows.
Free cash flow (pre-spectrum) was €0.9 billion, a decrease of €0.3 billion, largely driven by the decrease in operating free cash flow.
Licence and spectrum payments include amounts relating to the purchase of spectrum in the UK of €0.2 billion (2017: €0.6 billion in Italy, €0.1 billion in Germany).
Acquisitions and disposals include €0.3 billion received on completion of the merger of Vodafone India with Idea Cellular on 31 August 2018.
A foreign exchange gain of €0.4 billion was recognised on net debt as a result of the translation impact of closing foreign exchange rates, mainly due to movements in the Turkish Lira and South African Rand against the Euro.
Closing net debt at 30 September 2018 was €32.1 billion (31 March 2018: €29.6 billion) and excludes the remaining £1.4 billion mandatory convertible bond issued in February 2016 which will be settled in equity shares, liabilities of €1.8 billion (31 March 2018: €1.8 billion) relating to minority holdings in KDG and €0.9 billion of shareholder loans receivable from VodafoneZiggo.
Closing net debt also continues to include certain bonds which are reported at an amount €1.6 billion (31 March 2018: €1.65 billion) higher than their euro-equivalent cash redemption value as a result of hedge accounting under IFRS. In addition, where bonds are issued in currencies other than euros, the Group has entered into foreign currency swaps to fix the euro cash outflows on redemption. The impact of these swaps are not reflected in gross debt and would decrease the euro equivalent redemption value of the bonds by less than €0.1 billion (31 March 2018: €0.6 billion increase).
LIQUIDITY AND CAPITAL RESOURCES
19
Analysis of net debt: Restated1
30 September 31 March 2018 2018 €m €m
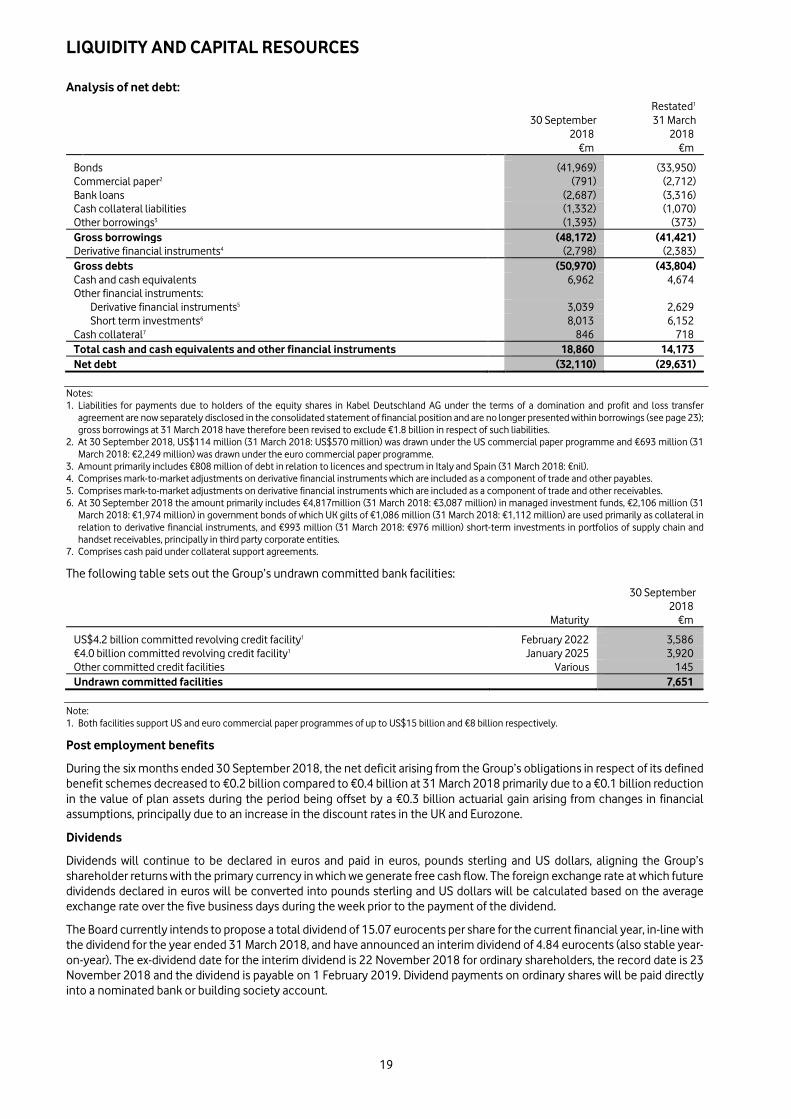
Bonds (41,969) (33,950) Commercial paper2 (791) (2,712) Bank loans (2,687) (3,316) Cash collateral liabilities (1,332) (1,070) Other borrowings3 (1,393) (373) Gross borrowings (48,172) (41,421) Derivative financial instruments4 (2,798) (2,383) Gross debts (50,970) (43,804) Cash and cash equivalents 6,962 4,674 Other financial instruments:
Derivative financial instruments5 3,039 2,629 Short term investments6 8,013 6,152 Cash collateral7 846 718 Total cash and cash equivalents and other financial instruments 18,860 14,173 Net debt (32,110) (29,631)
Notes: 1. Liabilities for payments due to holders of the equity shares in Kabel Deutschland AG under the terms of a domination and profit and loss transfer
agreement are now separately disclosed in the consolidated statement of financial position and are no longer presented within borrowings (see page 23); gross borrowings at 31 March 2018 have therefore been revised to exclude €1.8 billion in respect of such liabilities.
2. At 30 September 2018, US$114 million (31 March 2018: US$570 million) was drawn under the US commercial paper programme and €693 million (31 March 2018: €2,249 million) was drawn under the euro commercial paper programme.
3. Amount primarily includes €808 million of debt in relation to licences and spectrum in Italy and Spain (31 March 2018: €nil). 4. Comprises mark-to-market adjustments on derivative financial instruments which are included as a component of trade and other payables. 5. Comprises mark-to-market adjustments on derivative financial instruments which are included as a component of trade and other receivables. 6. At 30 September 2018 the amount primarily includes €4,817million (31 March 2018: €3,087 million) in managed investment funds, €2,106 million (31
March 2018: €1,974 million) in government bonds of which UK gilts of €1,086 million (31 March 2018: €1,112 million) are used primarily as collateral in relation to derivative financial instruments, and €993 million (31 March 2018: €976 million) short-term investments in portfolios of supply chain and handset receivables, principally in third party corporate entities.
7. Comprises cash paid under collateral support agreements.
The following table sets out the Group’s undrawn committed bank facilities: 30 September
2018
Maturity €m
US$4.2 billion committed revolving credit facility1 February 2022 3,586 €4.0 billion committed revolving credit facility1 January 2025 3,920 Other committed credit facilities Various 145 Undrawn committed facilities 7,651
Note: 1. Both facilities support US and euro commercial paper programmes of up to US$15 billion and €8 billion respectively.
Post employment benefits
During the six months ended 30 September 2018, the net deficit arising from the Group’s obligations in respect of its defined benefit schemes decreased to €0.2 billion compared to €0.4 billion at 31 March 2018 primarily due to a €0.1 billion reduction in the value of plan assets during the period being offset by a €0.3 billion actuarial gain arising from changes in financial assumptions, principally due to an increase in the discount rates in the UK and Eurozone.
Dividends Dividends will continue to be declared in euros and paid in euros, pounds sterling and US dollars, aligning the Group’s shareholder returns with the primary currency in which we generate free cash flow. The foreign exchange rate at which future dividends declared in euros will be converted into pounds sterling and US dollars will be calculated based on the average exchange rate over the five business days during the week prior to the payment of the dividend.
The Board currently intends to propose a total dividend of 15.07 eurocents per share for the current financial year, in-line with the dividend for the year ended 31 March 2018, and have announced an interim dividend of 4.84 eurocents (also stable year-on-year). The ex-dividend date for the interim dividend is 22 November 2018 for ordinary shareholders, the record date is 23 November 2018 and the dividend is payable on 1 February 2019. Dividend payments on ordinary shares will be paid directly into a nominated bank or building society account.
RISK FACTORS
20
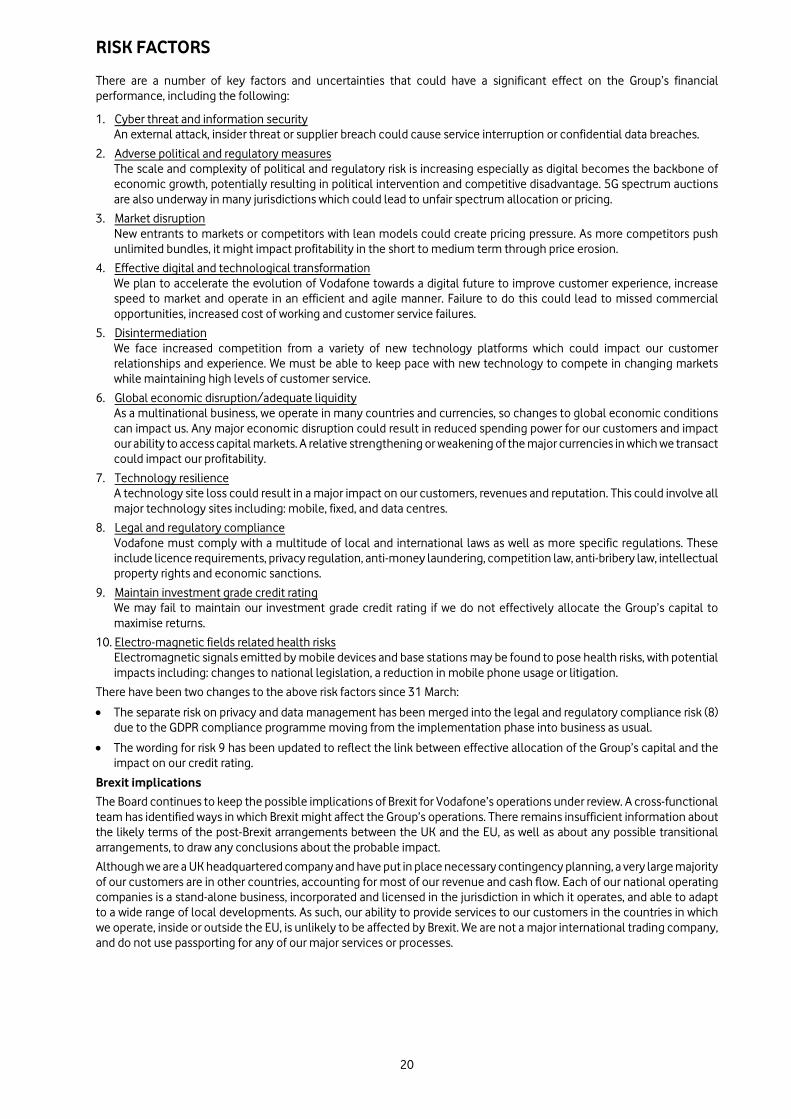
There are a number of key factors and uncertainties that could have a significant effect on the Group’s financial performance, including the following:
1. Cyber threat and information security An external attack, insider threat or supplier breach could cause service interruption or confidential data breaches.
2. Adverse political and regulatory measures The scale and complexity of political and regulatory risk is increasing especially as digital becomes the backbone of economic growth, potentially resulting in political intervention and competitive disadvantage. 5G spectrum auctions are also underway in many jurisdictions which could lead to unfair spectrum allocation or pricing.
3. Market disruption New entrants to markets or competitors with lean models could create pricing pressure. As more competitors push unlimited bundles, it might impact profitability in the short to medium term through price erosion.
4. Effective digital and technological transformation We plan to accelerate the evolution of Vodafone towards a digital future to improve customer experience, increase speed to market and operate in an efficient and agile manner. Failure to do this could lead to missed commercial opportunities, increased cost of working and customer service failures.
5. Disintermediation We face increased competition from a variety of new technology platforms which could impact our customer relationships and experience. We must be able to keep pace with new technology to compete in changing markets while maintaining high levels of customer service.
6. Global economic disruption/adequate liquidity As a multinational business, we operate in many countries and currencies, so changes to global economic conditions can impact us. Any major economic disruption could result in reduced spending power for our customers and impact our ability to access capital markets. A relative strengthening or weakening of the major currencies in which we transact could impact our profitability.
7. Technology resilience A technology site loss could result in a major impact on our customers, revenues and reputation. This could involve all major technology sites including: mobile, fixed, and data centres.
8. Legal and regulatory compliance Vodafone must comply with a multitude of local and international laws as well as more specific regulations. These include licence requirements, privacy regulation, anti-money laundering, competition law, anti-bribery law, intellectual property rights and economic sanctions.
9. Maintain investment grade credit rating We may fail to maintain our investment grade credit rating if we do not effectively allocate the Group’s capital to maximise returns.
10. Electro-magnetic fields related health risks Electromagnetic signals emitted by mobile devices and base stations may be found to pose health risks, with potential impacts including: changes to national legislation, a reduction in mobile phone usage or litigation.
There have been two changes to the above risk factors since 31 March:
• The separate risk on privacy and data management has been merged into the legal and regulatory compliance risk (8) due to the GDPR compliance programme moving from the implementation phase into business as usual.
• The wording for risk 9 has been updated to reflect the link between effective allocation of the Group’s capital and the impact on our credit rating.
Brexit implications
The Board continues to keep the possible implications of Brexit for Vodafone’s operations under review. A cross-functional team has identified ways in which Brexit might affect the Group’s operations. There remains insufficient information about the likely terms of the post-Brexit arrangements between the UK and the EU, as well as about any possible transitional arrangements, to draw any conclusions about the probable impact.
Although we are a UK headquartered company and have put in place necessary contingency planning, a very large majority of our customers are in other countries, accounting for most of our revenue and cash flow. Each of our national operating companies is a stand-alone business, incorporated and licensed in the jurisdiction in which it operates, and able to adapt to a wide range of local developments. As such, our ability to provide services to our customers in the countries in which we operate, inside or outside the EU, is unlikely to be affected by Brexit. We are not a major international trading company, and do not use passporting for any of our major services or processes.
RISK FACTORS
21
Depending on the arrangements agreed between the UK and the EU, there are two primary issues that could directly affect our operations, in both cases potentially causing us to incur additional cost:
• Creation of a data frontier between the UK and the EU: the inability to move data freely between the UK and EU countries might cause us to have to move some technical facilities, and affect future network design; and
• Inability to access the talent we need to run a multinational Group operation from the UK: increased controls over or restrictions to our ability to employ leading talent from non UK markets could cause us to have to adjust our operating model to ensure that we attract and retain the best people for the roles we have.
As far as our UK operations are concerned, we are reviewing the impact of a no deal scenario. One potential impact may be on our processes for the procurement of handsets and technical equipment, which may result in a greater investment in working capital at 31 March 2019 and consequently lower cash flow, although this would be unlikely to have a material impact at a Group level.
A further, indirect, issue that could affect our future performance would be if the Brexit process caused downward revisions to macro-economic performance in our major markets including the UK, impacting the performance of the operating companies in those markets.
Further information in relation to these risk factors and uncertainties can be found on pages 38 to 45 of the Group’s annual report for the financial year ended 31 March 2018, which is available at http://www.vodafone.com/investor.
RESPONSIBILITY STATEMENT We confirm that to the best of our knowledge:
• the unaudited condensed consolidated financial statements have been prepared in accordance with IAS 34, “Interim Financial Reporting”, as issued by the International Accounting Standards Board and as adopted by the European Union; and
• the interim management report includes a fair review of the information required by Disclosure Guidance and Transparency Rules sourcebook 4.2.7 and Disclosure Guidance and Transparency Rules sourcebook 4.2.8.
Neither the Company nor the directors accept any liability to any person in relation to the half-year financial report except to the extent that such liability could arise under English law. Accordingly, any liability to a person who has demonstrated reliance on any untrue or misleading statement or omission shall be determined in accordance with section 90A and schedule 10A of the Financial Services and Markets Act 2000. The names and functions of the Vodafone Group Plc board can be found at: http://www.vodafone.com/board By Order of the Board Rosemary Martin Group General Counsel and Company Secretary 13 November 2018
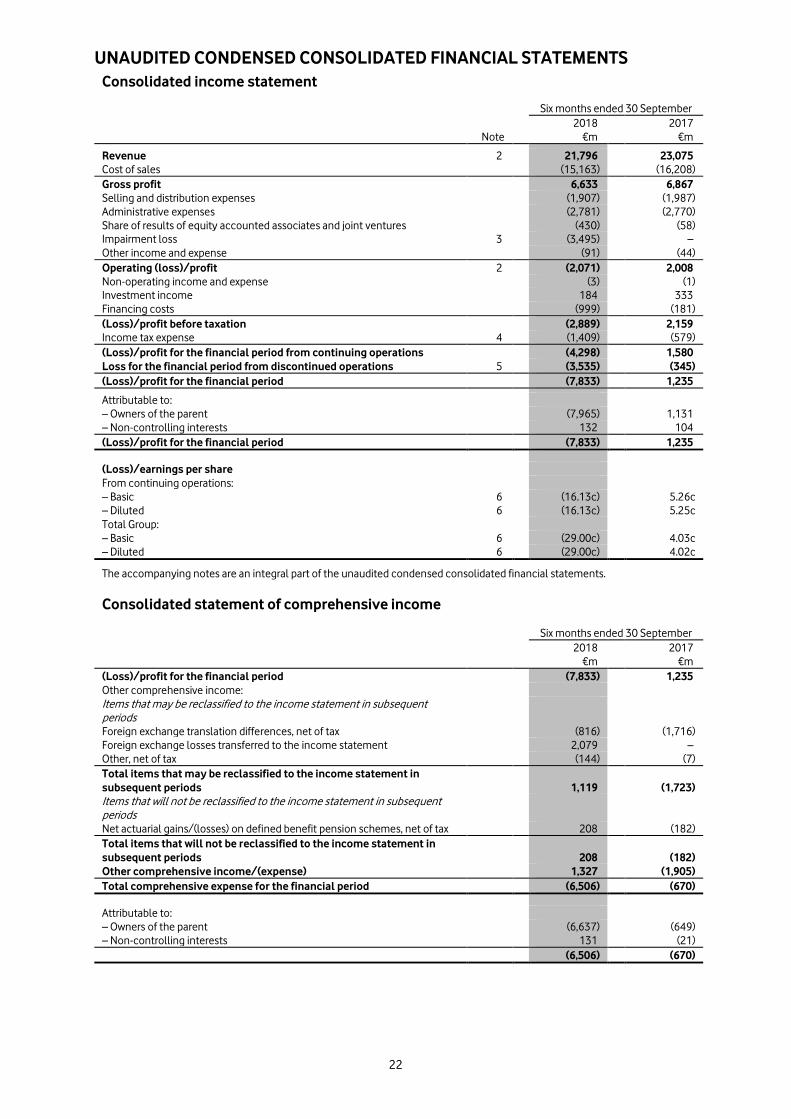
UNAUDITED CONDENSED CONSOLIDATED FINANCIAL STATEMENTS
22
Consolidated income statement
Six months ended 30 September
2018 2017 Note €m €m Revenue 2 21,796 23,075 Cost of sales (15,163) (16,208) Gross profit 6,633 6,867 Selling and distribution expenses (1,907) (1,987) Administrative expenses (2,781) (2,770) Share of results of equity accounted associates and joint ventures (430) (58) Impairment loss 3 (3,495) – Other income and expense (91) (44) Operating (loss)/profit 2 (2,071) 2,008 Non-operating income and expense (3) (1) Investment income 184 333 Financing costs (999) (181) (Loss)/profit before taxation (2,889) 2,159 Income tax expense 4 (1,409) (579) (Loss)/profit for the financial period from continuing operations (4,298) 1,580 Loss for the financial period from discontinued operations 5 (3,535) (345) (Loss)/profit for the financial period (7,833) 1,235 Attributable to:
– Owners of the parent (7,965) 1,131 – Non-controlling interests 132 104 (Loss)/profit for the financial period (7,833) 1,235
(Loss)/earnings per share
From continuing operations:
– Basic 6 (16.13c) 5.26c – Diluted 6 (16.13c) 5.25c Total Group:
– Basic 6 (29.00c) 4.03c – Diluted 6 (29.00c) 4.02c
The accompanying notes are an integral part of the unaudited condensed consolidated financial statements.
Consolidated statement of comprehensive income
Six months ended 30 September
2018 2017 €m €m (Loss)/profit for the financial period (7,833) 1,235 Other comprehensive income:
Items that may be reclassified to the income statement in subsequent periods
Foreign exchange translation differences, net of tax (816) (1,716) Foreign exchange losses transferred to the income statement 2,079 – Other, net of tax (144) (7) Total items that may be reclassified to the income statement in subsequent periods 1,119 (1,723) Items that will not be reclassified to the income statement in subsequent periods
Net actuarial gains/(losses) on defined benefit pension schemes, net of tax 208 (182) Total items that will not be reclassified to the income statement in subsequent periods 208 (182) Other comprehensive income/(expense) 1,327 (1,905) Total comprehensive expense for the financial period (6,506) (670)
Attributable to:
– Owners of the parent (6,637) (649) – Non-controlling interests 131 (21) (6,506) (670)
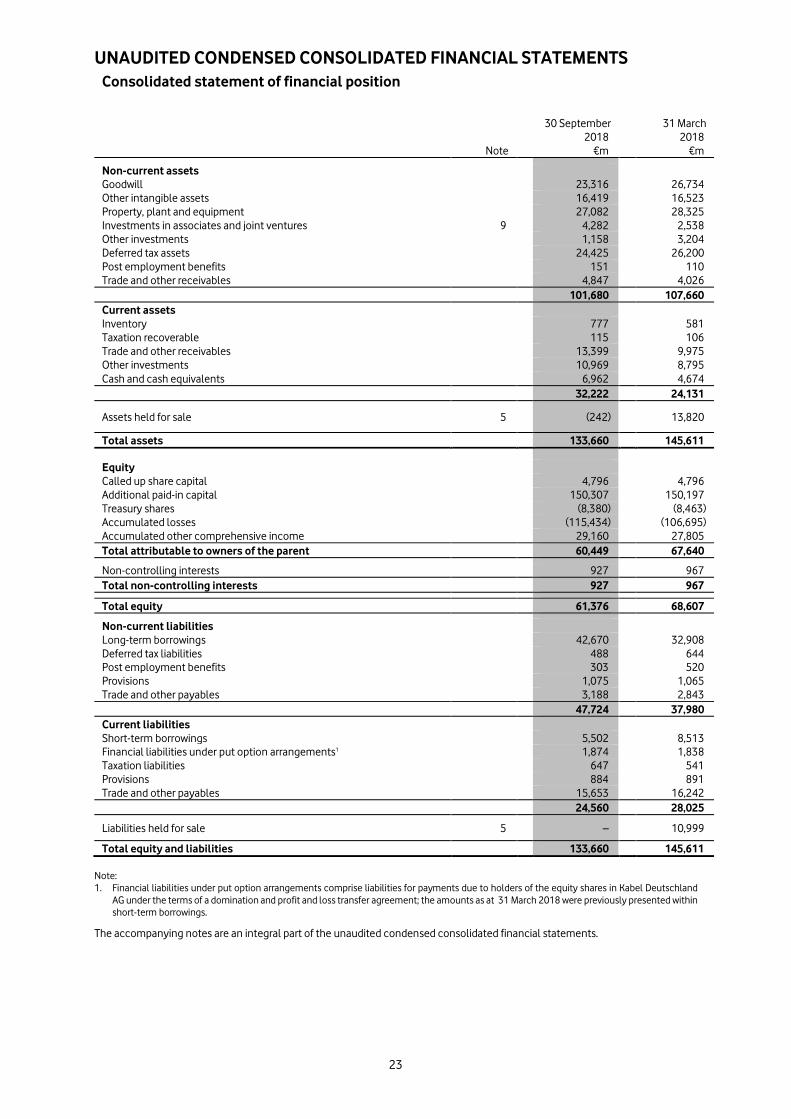
UNAUDITED CONDENSED CONSOLIDATED FINANCIAL STATEMENTS
23
Consolidated statement of financial position
30 September 31 March 2018 2018 Note €m €m
Non-current assets
Goodwill 23,316 26,734 Other intangible assets 16,419 16,523 Property, plant and equipment 27,082 28,325 Investments in associates and joint ventures 9 4,282 2,538 Other investments 1,158 3,204 Deferred tax assets 24,425 26,200 Post employment benefits 151 110 Trade and other receivables 4,847 4,026 101,680 107,660 Current assets
Inventory 777 581 Taxation recoverable 115 106 Trade and other receivables 13,399 9,975 Other investments 10,969 8,795 Cash and cash equivalents 6,962 4,674 32,222 24,131
Assets held for sale 5 (242) 13,820
Total assets 133,660 145,611
Equity
Called up share capital 4,796 4,796 Additional paid-in capital 150,307 150,197 Treasury shares (8,380) (8,463) Accumulated losses (115,434) (106,695) Accumulated other comprehensive income 29,160 27,805 Total attributable to owners of the parent 60,449 67,640
Non-controlling interests 927 967 Total non-controlling interests 927 967
Total equity 61,376 68,607
Non-current liabilities
Long-term borrowings 42,670 32,908 Deferred tax liabilities 488 644 Post employment benefits 303 520 Provisions 1,075 1,065 Trade and other payables 3,188 2,843 47,724 37,980 Current liabilities
Short-term borrowings 5,502 8,513 Financial liabilities under put option arrangements1 1,874 1,838 Taxation liabilities 647 541 Provisions 884 891 Trade and other payables 15,653 16,242 24,560 28,025
Liabilities held for sale 5 – 10,999
Total equity and liabilities 133,660 145,611 Note: 1. Financial liabilities under put option arrangements comprise liabilities for payments due to holders of the equity shares in Kabel Deutschland
AG under the terms of a domination and profit and loss transfer agreement; the amounts as at 31 March 2018 were previously presented within short-term borrowings.
The accompanying notes are an integral part of the unaudited condensed consolidated financial statements.
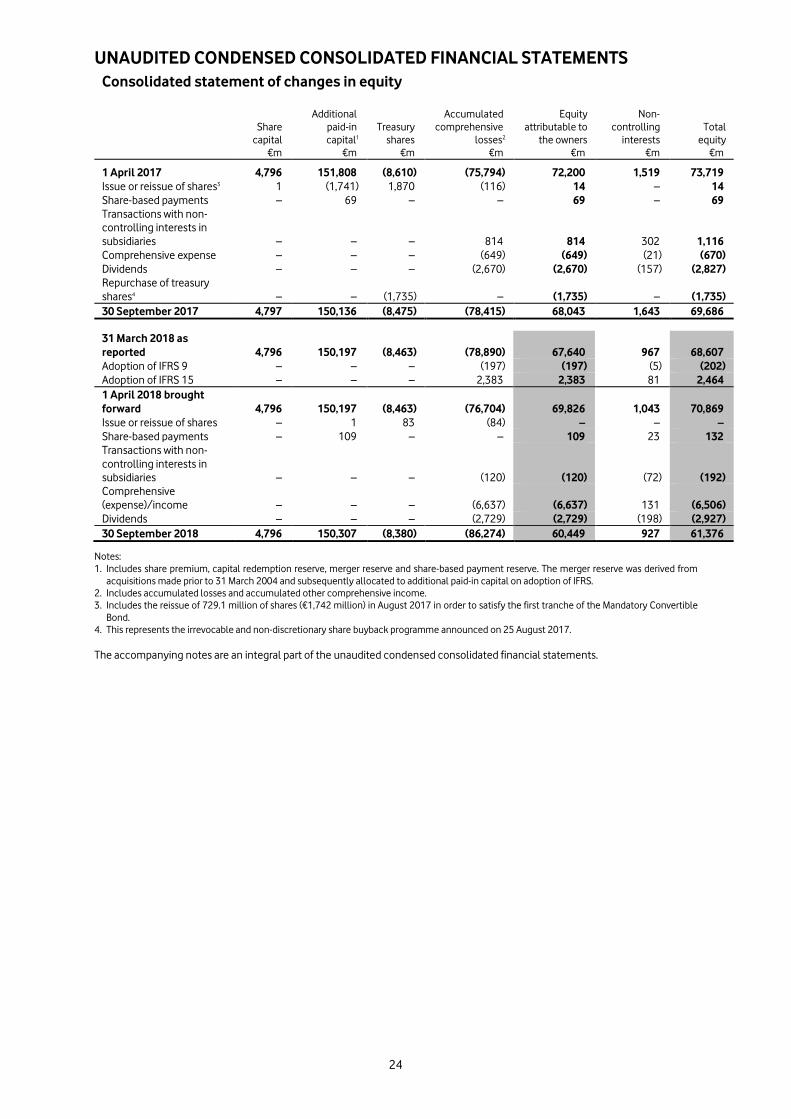
UNAUDITED CONDENSED CONSOLIDATED FINANCIAL STATEMENTS
24
Consolidated statement of changes in equity
Share
capital
Additional paid-in capital1
Treasury
shares
Accumulated
comprehensive losses2
Equity attributable to
the owners
Non- controlling
interests Total
equity €m €m €m €m €m €m €m
1 April 2017 4,796 151,808 (8,610) (75,794) 72,200 1,519 73,719 Issue or reissue of shares3 1 (1,741) 1,870 (116) 14 – 14 Share-based payments – 69 – – 69 – 69 Transactions with non-controlling interests in subsidiaries – – – 814 814 302 1,116 Comprehensive expense – – – (649) (649) (21) (670) Dividends – – – (2,670) (2,670) (157) (2,827) Repurchase of treasury shares4 – – (1,735) – (1,735) – (1,735) 30 September 2017 4,797 150,136 (8,475) (78,415) 68,043 1,643 69,686
31 March 2018 as reported 4,796 150,197 (8,463) (78,890) 67,640 967 68,607 Adoption of IFRS 9 – – – (197) (197) (5) (202) Adoption of IFRS 15 – – – 2,383 2,383 81 2,464 1 April 2018 brought forward 4,796 150,197 (8,463) (76,704) 69,826 1,043 70,869 Issue or reissue of shares – 1 83 (84) – – – Share-based payments – 109 – – 109 23 132 Transactions with non-controlling interests in subsidiaries – – – (120) (120) (72) (192) Comprehensive (expense)/income – – – (6,637) (6,637) 131 (6,506) Dividends – – – (2,729) (2,729) (198) (2,927) 30 September 2018 4,796 150,307 (8,380) (86,274) 60,449 927 61,376
Notes: 1. Includes share premium, capital redemption reserve, merger reserve and share-based payment reserve. The merger reserve was derived from
acquisitions made prior to 31 March 2004 and subsequently allocated to additional paid-in capital on adoption of IFRS. 2. Includes accumulated losses and accumulated other comprehensive income. 3. Includes the reissue of 729.1 million of shares (€1,742 million) in August 2017 in order to satisfy the first tranche of the Mandatory Convertible
Bond. 4. This represents the irrevocable and non-discretionary share buyback programme announced on 25 August 2017. The accompanying notes are an integral part of the unaudited condensed consolidated financial statements.
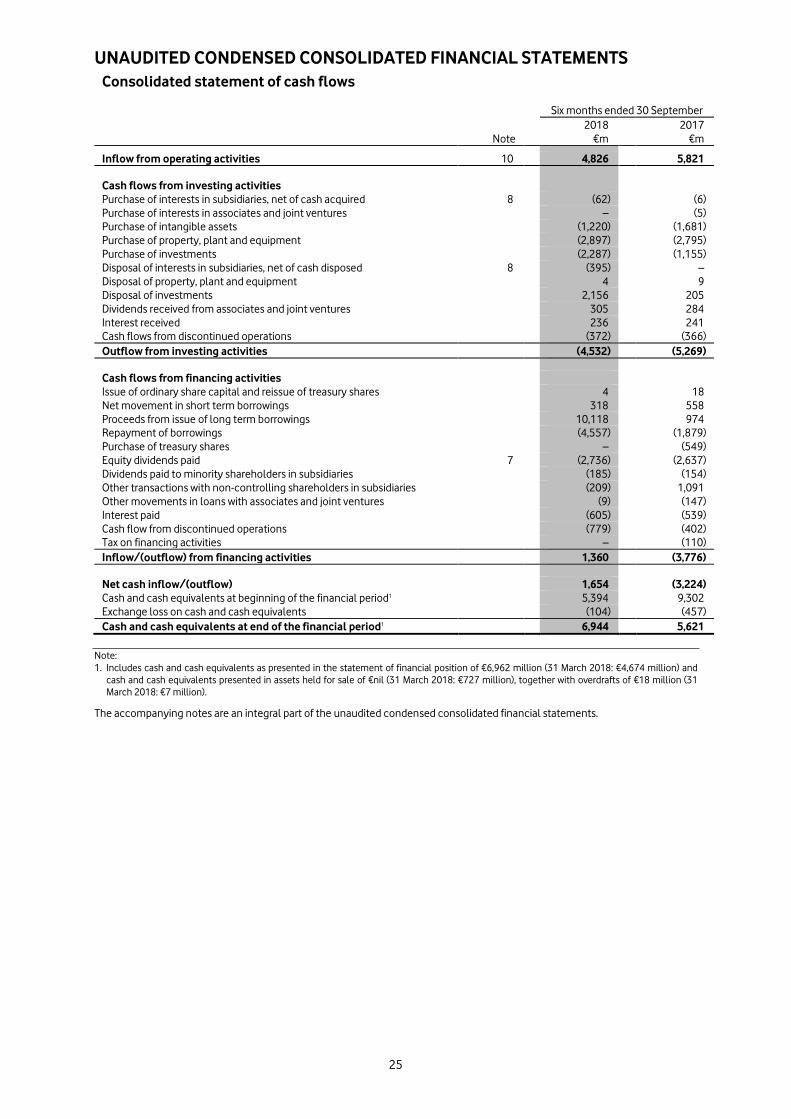
UNAUDITED CONDENSED CONSOLIDATED FINANCIAL STATEMENTS
25
Consolidated statement of cash flows
Six months ended 30 September
2018 2017 Note €m €m
Inflow from operating activities 10 4,826 5,821
Cash flows from investing activities
Purchase of interests in subsidiaries, net of cash acquired 8 (62) (6) Purchase of interests in associates and joint ventures – (5) Purchase of intangible assets (1,220) (1,681) Purchase of property, plant and equipment (2,897) (2,795) Purchase of investments (2,287) (1,155) Disposal of interests in subsidiaries, net of cash disposed 8 (395) – Disposal of property, plant and equipment 4 9 Disposal of investments 2,156 205 Dividends received from associates and joint ventures 305 284 Interest received 236 241 Cash flows from discontinued operations (372) (366) Outflow from investing activities (4,532) (5,269)
Cash flows from financing activities
Issue of ordinary share capital and reissue of treasury shares 4 18 Net movement in short term borrowings 318 558 Proceeds from issue of long term borrowings 10,118 974 Repayment of borrowings (4,557) (1,879) Purchase of treasury shares – (549) Equity dividends paid 7 (2,736) (2,637) Dividends paid to minority shareholders in subsidiaries (185) (154) Other transactions with non-controlling shareholders in subsidiaries (209) 1,091 Other movements in loans with associates and joint ventures (9) (147) Interest paid (605) (539) Cash flow from discontinued operations (779) (402) Tax on financing activities – (110) Inflow/(outflow) from financing activities 1,360 (3,776)
Net cash inflow/(outflow) 1,654 (3,224) Cash and cash equivalents at beginning of the financial period1 5,394 9,302 Exchange loss on cash and cash equivalents (104) (457) Cash and cash equivalents at end of the financial period1 6,944 5,621
Note: 1. Includes cash and cash equivalents as presented in the statement of financial position of €6,962 million (31 March 2018: €4,674 million) and
cash and cash equivalents presented in assets held for sale of €nil (31 March 2018: €727 million), together with overdrafts of €18 million (31 March 2018: €7 million).
The accompanying notes are an integral part of the unaudited condensed consolidated financial statements.
Notes to the unaudited condensed consolidated financial statements For the six months ended 30 September 2018
26
1 Basis of preparation
The unaudited condensed consolidated financial statements for the six months ended 30 September 2018:
• were prepared in accordance with International Accounting Standard 34 “Interim Financial Reporting” (‘IAS 34’) as issued by the International Accounting Standards Board and as adopted by the European Union;
• are presented on a condensed basis as permitted by IAS 34 and therefore do not include all disclosures that would otherwise be required in a full set of financial statements and should be read in conjunction with the Group’s annual report for the year ended 31 March 2018;
• apply the same accounting policies, presentation and methods of calculation as those followed in the preparation of the Group’s consolidated financial statements for the year ended 31 March 2018, which were prepared in accordance with International Financial Reporting Standards (‘IFRS’) as issued by the International Accounting Standards Board and were also prepared in accordance with IFRS adopted by the European Union (‘EU’), the Companies Act 2006 and Article 4 of the EU IAS Regulations, with the exception of the adoption of IFRS 15 “Revenue from Contracts with Customers” and IFRS 9 “Financial Instruments” as set out below. Income taxes are accrued using the tax rate that is expected to be applicable for the full financial year, adjusted for certain discrete items which occurred in the interim period in accordance with IAS 34;
• include all adjustments, consisting of normal recurring adjustments, necessary for a fair statement of the results for the periods presented;
• do not constitute statutory accounts within the meaning of section 434(3) of the Companies Act 2006; and
• were approved by the Board of directors on 13 November 2018.
The information relating to the year ended 31 March 2018 is an extract from the Group’s published annual report for that year, which has been delivered to the Registrar of Companies, and on which the auditors’ report was unqualified and did not contain any emphasis of matter or statements under section 498(2) or 498(3) of the UK Companies Act 2006.
After reviewing the Group’s budget for the remainder of the financial year, and longer term plans, the directors are satisfied that, at the time of approving the unaudited condensed consolidated financial statements, it is appropriate to continue to adopt a going concern basis of accounting.
The preparation of the unaudited condensed consolidated financial statements requires management to make estimates and assumptions that affect the reported amounts of assets and liabilities and disclosure of contingent assets and liabilities at the end of the reporting period, and the reported amounts of revenue and expenses during the reporting period. Actual results could vary from these estimates. The estimates and underlying assumptions are reviewed on an ongoing basis. Revisions to accounting estimates are recognised in the period in which the estimate is revised if the revision affects only that period or in the period of the revision and future periods if the revision affects both current and future periods.
New accounting pronouncements adopted
On 1 April 2018 the Group adopted new accounting policies where necessary to comply with amendments to International Financial Reporting Standards; the accounting pronouncements considered by the Group as significant on adoption are IFRS 9 “Financial Instruments” and IFRS 15 “Revenue from Contracts with Customers” as set out below.
Other IFRS changes adopted on 1 April 2018, which had also been issued by the IASB and endorsed by the EU, have no material impact on the consolidated results, financial position or cash flows of the Group. Further details are provided on all changes to IFRS impacting the Group in the Group’s annual report for the year ended 31 March 2018.
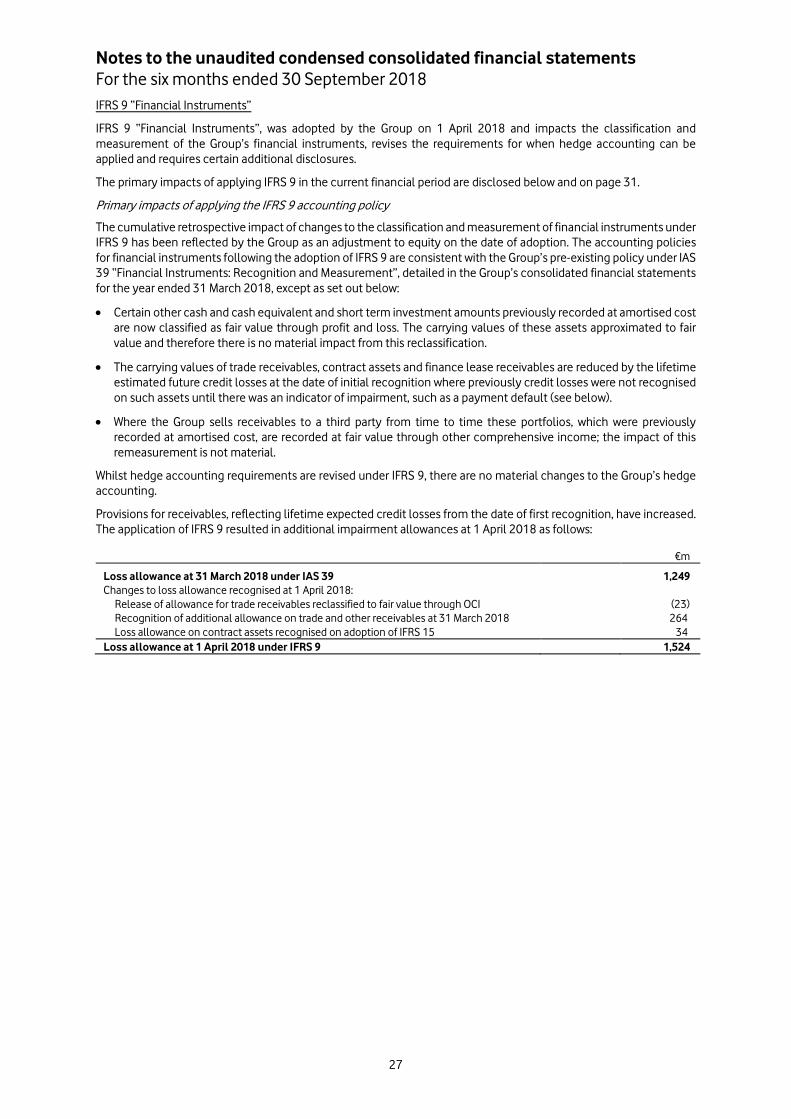
Notes to the unaudited condensed consolidated financial statements For the six months ended 30 September 2018
27
IFRS 9 “Financial Instruments”
IFRS 9 “Financial Instruments”, was adopted by the Group on 1 April 2018 and impacts the classification and measurement of the Group’s financial instruments, revises the requirements for when hedge accounting can be applied and requires certain additional disclosures.
The primary impacts of applying IFRS 9 in the current financial period are disclosed below and on page 31.
Primary impacts of applying the IFRS 9 accounting policy
The cumulative retrospective impact of changes to the classification and measurement of financial instruments under IFRS 9 has been reflected by the Group as an adjustment to equity on the date of adoption. The accounting policies for financial instruments following the adoption of IFRS 9 are consistent with the Group’s pre-existing policy under IAS 39 “Financial Instruments: Recognition and Measurement”, detailed in the Group’s consolidated financial statements for the year ended 31 March 2018, except as set out below:
• Certain other cash and cash equivalent and short term investment amounts previously recorded at amortised cost are now classified as fair value through profit and loss. The carrying values of these assets approximated to fair value and therefore there is no material impact from this reclassification.
• The carrying values of trade receivables, contract assets and finance lease receivables are reduced by the lifetime estimated future credit losses at the date of initial recognition where previously credit losses were not recognised on such assets until there was an indicator of impairment, such as a payment default (see below).
• Where the Group sells receivables to a third party from time to time these portfolios, which were previously recorded at amortised cost, are recorded at fair value through other comprehensive income; the impact of this remeasurement is not material.
Whilst hedge accounting requirements are revised under IFRS 9, there are no material changes to the Group’s hedge accounting.
Provisions for receivables, reflecting lifetime expected credit losses from the date of first recognition, have increased. The application of IFRS 9 resulted in additional impairment allowances at 1 April 2018 as follows:
€m
Loss allowance at 31 March 2018 under IAS 39 1,249
Changes to loss allowance recognised at 1 April 2018:
Release of allowance for trade receivables reclassified to fair value through OCI (23) Recognition of additional allowance on trade and other receivables at 31 March 2018 264
Loss allowance on contract assets recognised on adoption of IFRS 15 34
Loss allowance at 1 April 2018 under IFRS 9 1,524
Notes to the unaudited condensed consolidated financial statements For the six months ended 30 September 2018
28
IFRS 15 “Revenue from Contracts with Customers”
IFRS 15 “Revenue from Contracts with Customers” was adopted by the Group on 1 April 2018 with the cumulative retrospective impact reflected as an adjustment to equity on the date of adoption.
The key differences between the Group’s IAS 18 accounting policy (which is disclosed in the Group’s Annual Report and Accounts for the year ended 31 March 2018) and the Group’s IFRS 15 accounting policy (which is provided below), as well as the primary impacts of applying IFRS 15 in the current financial period are disclosed on pages 31 to 33 and below.
Primary impacts of applying the IFRS 15 accounting policy
The primary impacts of applying the IFRS 15 (‘current’) accounting policy in place of the accounting policy applied in the annual report and accounts for the year ended 31 March 2018 (the ‘previous policy’) are:
• Under the previous policy, revenue allocated to obligations was restricted to the amount receivable without the delivery of additional goods or services; this restriction no longer applies under current policy. The primary impact is that revenue allocated to equipment typically increases and revenue subsequently recognised for service delivery during the contract period typically decreases when the Group sells subsidised devices, such as handsets, together with airtime service agreements. The recognition of additional up-front unbilled equipment revenue is the primary driver for the increase in the contract asset value recorded under IFRS 15 (see pages 31 to 33).
• Under current policy, direct and incremental contract acquisition costs, such as commissions, are typically recognised in expenses over the related contract period; this generally leads to the later recognition of charges for such costs compared with the previous policy. Deferred contract acquisition costs recorded under the current policy are disclosed on pages 31 to 33.
• The amounts of contract acquisition costs deducted from revenue as they are considered to relate to the funding of customer discounts are higher under the current policy than under the previous policy.
• Contract fulfilment costs are deferred under current policy when the requirements for the deferral of expense recognition are met (see above); such costs were generally expensed as incurred under previous policy. Deferred contract fulfilment costs recorded under the current policy are disclosed on pages 31 to 33.
IFRS 15 Accounting Policy
When the Group enters into an agreement with a customer, goods and services deliverable under the contract are identified as separate performance obligations (‘obligations’) to the extent that the customer can benefit from the goods or services on their own and that the separate goods and services are considered distinct from other goods and services in the agreement. Where individual goods and services don’t meet the criteria to be identified as separate obligations they are aggregated with other goods and/or services in the agreement until a separate obligation is identified. The obligations identified will depend on the nature of individual customer contracts, but might typically be separately identified for mobile handsets, other equipment provided to customers and services provided to customers such as mobile and fixed line communication services.
The Group determines the transaction price to which it expects to be entitled to in return for providing the promised obligations to the customer based on the committed contractual amounts, net of sales taxes and discounts. Where indirect channel dealers, such as retailers, acquire customer contracts on behalf of the Group and receive commission, any commissions that the dealer is compelled to use to fund discounts or other incentives to the customer are treated as payments to the customer when determining the transaction price and consequently are not included in contract acquisition costs.
The transaction price is allocated between the identified obligations according to the relative standalone selling prices of the obligations. The standalone selling price of each obligation deliverable in the contract is determined according to the prices that the Group would achieve by selling the same goods and/or services included in the obligation to a similar customer on a standalone basis; where standalone selling prices are not directly observable, estimation techniques are used maximising the use of external inputs (see further commentary regarding estimations below).
Revenue is recognised when the respective obligations in the contract are delivered to the customer and payment remains probable.
• Revenue for the provision of services, such as mobile airtime and fixed line broadband, is recognised when or as the Group performs the related service during the agreed service period.
• Revenue for device sales to end customers is generally recognised when the device is delivered to the end customer. For device sales made to intermediaries such as indirect channel dealers, revenue is recognised if control of the device has transferred to the intermediary and the intermediary has no right to return the device to receive a refund; otherwise revenue recognition is deferred until sale of the device to an end customer by the intermediary or the expiry of any right of return.
Notes to the unaudited condensed consolidated financial statements For the six months ended 30 September 2018
29
When the Group has control of goods or services prior to delivery to a customer, then the Group is the principal in the sale to the customer. As a principal, receipts from, and payments to, suppliers are reported on a gross basis in revenue and operating costs. If another party has control of goods or services prior to transfer to a customer, then the Group is acting as an agent for the other party and revenue in respect of the relevant obligations is recognised net of any related payments to the supplier and recognised revenue represents the margin earned by the Group.
When revenue recognised in respect of a customer contract exceeds amounts received or receivable from a customer a contract asset is recognised; contract assets will typically be recognised for handsets or other equipment provided to customers where payment is recovered by the Group via future service fees. If amounts received or receivable from a customer exceed revenue recognised for a contract, for example if the Group receives an advance payment from a customer, a contract liability is recognised.
When contract assets or liabilities are recognised, a financing component may exist in the contract; this is typically the case when a handset or other equipment is provided to a customer up-front but payment is received over the term of the related service agreement, in which case the customer is deemed to have received financing. If a significant financing component is provided to the customer, the transaction price is reduced and interest revenue is recognised over the customer’s payment period using an interest rate reflecting the relevant central bank rates and customer credit risk.
Contract-related costs
When costs directly relating to a specific contract are incurred prior to recognising revenue for a related obligation, and those costs enhance the ability of the Group to deliver an obligation and are expected to be recovered, then those costs are recognised on the statement of financial position as fulfilment costs and are recognised as expenses in line with the recognition of revenue when the related obligation is delivered.
The direct and incremental costs of acquiring a contract including, for example, certain commissions payable to staff or agents for acquiring customers on behalf of the Group, are recognised as contract acquisition cost assets in the statement of financial position when the related payment obligation is recorded. Costs are recognised as an expense in line with the recognition of the related revenue that is expected to be earned by the Group; typically this is over the contract period as new commissions are payable on contract renewal. Certain amounts payable to agents are deducted from revenue recognised (see above).
Critical accounting judgements and key sources of estimation relating to IFRS 15
Revenue recognition under IFRS 15 is significantly more complex than under previous reporting requirements and necessitates the collation and processing of very large amounts of data and the increased use of management judgements and estimates to produce financial information. The most significant critical accounting judgement and key the source of estimation uncertainty are disclosed below. Other accounting judgements and estimations made by management are not considered to be individually critical or material, but cumulatively have a material impact on reported costs and revenues particularly as the Group offers a large variety of bundled goods and services.
Where the Group doesn’t sell equivalent goods or services in similar circumstances on a standalone basis it is necessary to estimate the standalone price. When estimating the standalone price the Group maximises the use of external inputs; methods for estimating standalone prices include determining the standalone price of similar goods and services sold by the Group, observing the standalone prices for similar goods and services when sold by third parties or using a cost-plus reasonable margin approach (which is sometimes the case for handsets and other equipment). Where it is not possible to reliably estimate standalone prices due to lack of observable standalone sales or highly variable pricing, which is sometimes the case for services, the standalone price of an obligation may be determined as the transaction price less the standalone prices of other obligations in the contract. The standalone price determined for obligations materially impacts the allocation of revenue between obligations and impacts the timing of revenue when obligations are provided to customers at different times – for example, the allocation of revenue between handsets, which are usually delivered up-front, and services which are typically delivered over the contract period. However, there is not considered to be a significant risk of material adjustment to the carrying value of contract-related assets or liabilities in the 12 months after the balance sheet date if these estimates were revised.
When the Group has control of goods or services when they are delivered to a customer, then the Group is the principal in the sale to the customer; otherwise the Group is acting as an agent. Whether the Group is considered to be the principal or an agent in the transaction depends on analysis by management of both the legal form and substance of the agreement between the Group and its business partners; such judgements impact the amount of reported revenue and operating expenses (see above) but do not impact reported assets, liabilities or cash flows. Scenarios requiring judgement to determine whether the Group is a principal or an agent include, for example, those where the Group delivers third-party branded services (such as premium music or TV content) to customers.
Notes to the unaudited condensed consolidated financial statements For the six months ended 30 September 2018
30
New accounting pronouncements to be adopted on 1 April 2019
IFRS 16 “Leases” (‘IFRS 16’)
IFRS 16 “Leases” (‘IFRS 16’) was issued in January 2016 to replace IAS 17 “Leases” and has been endorsed by the EU. The standard is effective for accounting periods beginning on or after 1 January 2019 and will be adopted by the Group on 1 April 2019.
IFRS 16 will have a material impact on Group’s consolidated financial statements. The Group will adopt IFRS 16 with the cumulative retrospective impact reflected as an adjustment to equity on the date of adoption. Descriptions of the primary impacts on the Group’s accounting and the Group’s adoption approach are disclosed in the Group’s annual report and accounts for the year ended 31 March 2018.
The impact of adopting IFRS 16 on the Group’s consolidated statement of financial position on 1 April 2019 will depend on the portfolio of leases and macroeconomic factors such as interest and foreign exchange rates at that date. The Group’s undiscounted operating lease commitments at 31 March 2018 were €9,694 million. It is expected that had the Group applied IFRS 16 on 1 April 2018 that the incremental lease liabilities recognised by the Group could have been materially higher than the disclosed commitment as revisions to estimated lease terms, which will generally increase, are unlikely to be fully offset by the impact of discounting, however, it is expected that the increase would only have been modest. However, the lease liability to be recognised on 1 April 2019 will not be prepared on the basis of factors that existed on 31 March 2018 and changes to the following items over the current financial year will each impact the amount to be recognised as an incremental lease liability on 1 April 2019:
• The Group’s lease portfolio as a result of lease terminations and inceptions;
• Further estimated lease term changes as a result of events arising during the year;
• Interest rates; and
• Foreign exchange rates.
The Group expensed €3,788 million as operating lease costs under existing reporting requirements for the year to 31 March 2018.
The recognition by the Group of an additional lease liability at 1 April 2019 will have no impact on retained earnings as a right-of-use asset equal to the additional liability will be recognised, subject to adjustments to the right-of-use asset for the derecognition of lease related accruals and prepayments and for onerous lease provisions already held in the balance sheet.
Whilst net cash flow is not impacted by IFRS 16, both net cash inflows from operating activities and payments classified within cash flow from financing activities will increase, as payments made at lease inception or subsequently will be characterised as a repayment of lease liabilities.
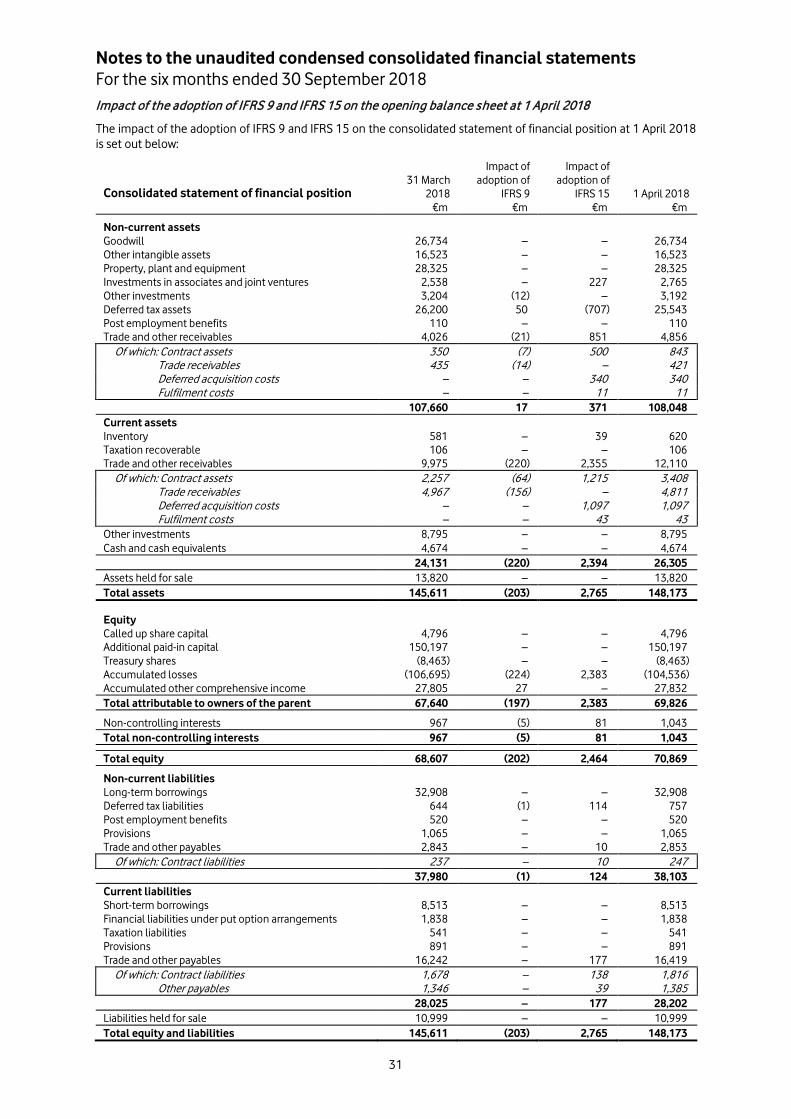
Notes to the unaudited condensed consolidated financial statements For the six months ended 30 September 2018
31
Impact of the adoption of IFRS 9 and IFRS 15 on the opening balance sheet at 1 April 2018
The impact of the adoption of IFRS 9 and IFRS 15 on the consolidated statement of financial position at 1 April 2018 is set out below:
Consolidated statement of financial position 31 March
2018
Impact of adoption of
IFRS 9
Impact of adoption of
IFRS 15 1 April 2018 €m €m €m €m
Non-current assets
Goodwill 26,734 – – 26,734 Other intangible assets 16,523 – – 16,523 Property, plant and equipment 28,325 – – 28,325 Investments in associates and joint ventures 2,538 – 227 2,765 Other investments 3,204 (12) – 3,192 Deferred tax assets 26,200 50 (707) 25,543 Post employment benefits 110 – – 110 Trade and other receivables 4,026 (21) 851 4,856 Of which: Contract assets 350 (7) 500 843 Trade receivables 435 (14) – 421 Deferred acquisition costs – – 340 340 Fulfilment costs – – 11 11 107,660 17 371 108,048 Current assets
Inventory 581 – 39 620 Taxation recoverable 106 – – 106 Trade and other receivables 9,975 (220) 2,355 12,110 Of which: Contract assets 2,257 (64) 1,215 3,408 Trade receivables 4,967 (156) – 4,811 Deferred acquisition costs – – 1,097 1,097 Fulfilment costs – – 43 43 Other investments 8,795 – – 8,795 Cash and cash equivalents 4,674 – – 4,674 24,131 (220) 2,394 26,305 Assets held for sale 13,820 – – 13,820 Total assets 145,611 (203) 2,765 148,173
Equity
Called up share capital 4,796 – – 4,796 Additional paid-in capital 150,197 – – 150,197 Treasury shares (8,463) – – (8,463) Accumulated losses (106,695) (224) 2,383 (104,536) Accumulated other comprehensive income 27,805 27 – 27,832 Total attributable to owners of the parent 67,640 (197) 2,383 69,826
Non-controlling interests 967 (5) 81 1,043 Total non-controlling interests 967 (5) 81 1,043
Total equity 68,607 (202) 2,464 70,869
Non-current liabilities
Long-term borrowings 32,908 – – 32,908 Deferred tax liabilities 644 (1) 114 757 Post employment benefits 520 – – 520 Provisions 1,065 – – 1,065 Trade and other payables 2,843 – 10 2,853 Of which: Contract liabilities 237 – 10 247 37,980 (1) 124 38,103 Current liabilities
Short-term borrowings 8,513 – – 8,513 Financial liabilities under put option arrangements 1,838 – – 1,838 Taxation liabilities 541 – – 541 Provisions 891 – – 891 Trade and other payables 16,242 – 177 16,419 Of which: Contract liabilities 1,678 – 138 1,816 Other payables 1,346 – 39 1,385 28,025 – 177 28,202 Liabilities held for sale 10,999 – – 10,999 Total equity and liabilities 145,611 (203) 2,765 148,173
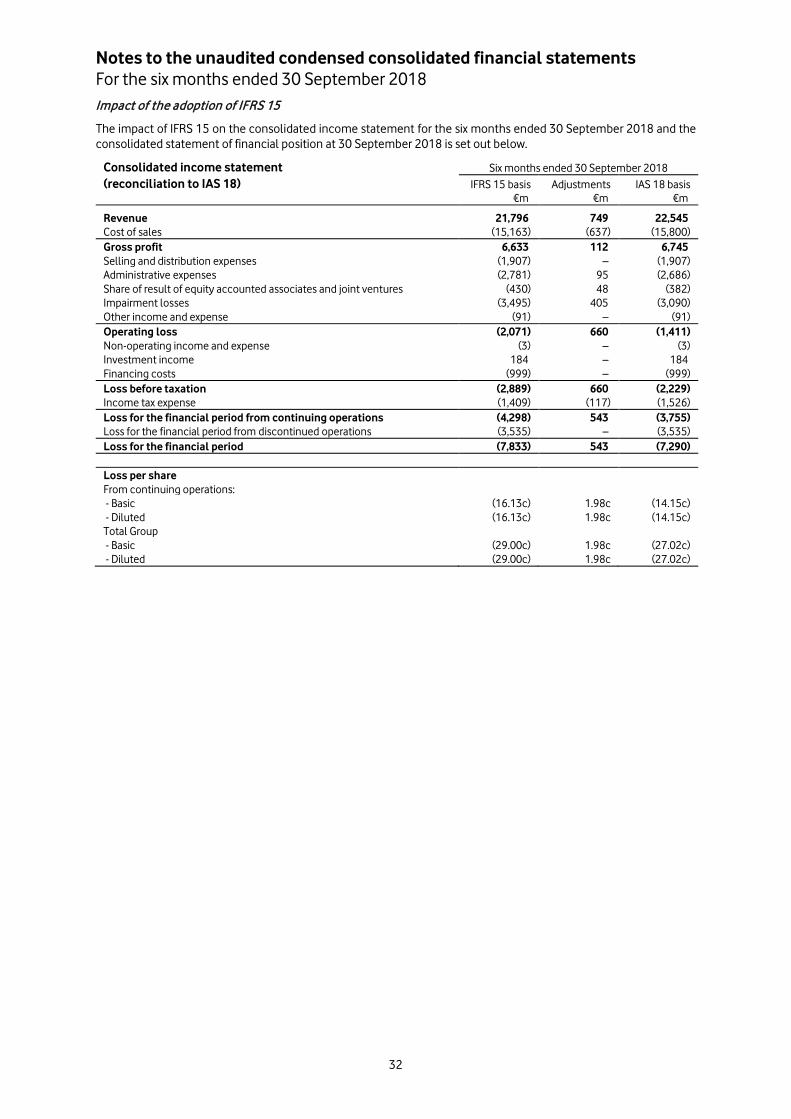
Notes to the unaudited condensed consolidated financial statements For the six months ended 30 September 2018
32
Impact of the adoption of IFRS 15
The impact of IFRS 15 on the consolidated income statement for the six months ended 30 September 2018 and the consolidated statement of financial position at 30 September 2018 is set out below.
Consolidated income statement Six months ended 30 September 2018
(reconciliation to IAS 18) IFRS 15 basis Adjustments IAS 18 basis €m €m €m
Revenue 21,796 749 22,545 Cost of sales (15,163) (637) (15,800) Gross profit 6,633 112 6,745 Selling and distribution expenses (1,907) – (1,907) Administrative expenses (2,781) 95 (2,686) Share of result of equity accounted associates and joint ventures (430) 48 (382) Impairment losses (3,495) 405 (3,090) Other income and expense (91) – (91) Operating loss (2,071) 660 (1,411) Non-operating income and expense (3) – (3) Investment income 184 – 184 Financing costs (999) – (999) Loss before taxation (2,889) 660 (2,229) Income tax expense (1,409) (117) (1,526) Loss for the financial period from continuing operations (4,298) 543 (3,755) Loss for the financial period from discontinued operations (3,535) – (3,535) Loss for the financial period (7,833) 543 (7,290)
Loss per share
From continuing operations:
- Basic (16.13c) 1.98c (14.15c) - Diluted (16.13c) 1.98c (14.15c) Total Group
- Basic (29.00c) 1.98c (27.02c) - Diluted (29.00c) 1.98c (27.02c)
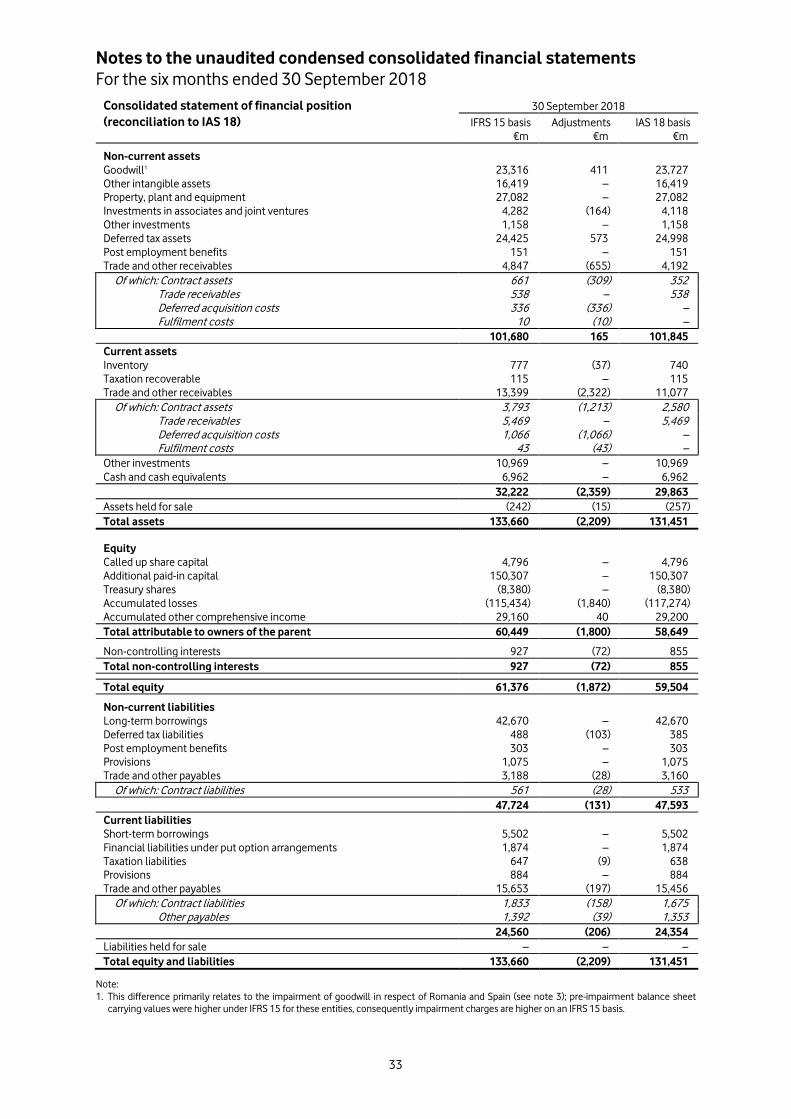
Notes to the unaudited condensed consolidated financial statements For the six months ended 30 September 2018
33
Consolidated statement of financial position 30 September 2018
(reconciliation to IAS 18) IFRS 15 basis Adjustments IAS 18 basis €m €m €m
Non-current assets
Goodwill1 23,316 411 23,727 Other intangible assets 16,419 – 16,419 Property, plant and equipment 27,082 – 27,082 Investments in associates and joint ventures 4,282 (164) 4,118 Other investments 1,158 – 1,158 Deferred tax assets 24,425 573 24,998 Post employment benefits 151 – 151 Trade and other receivables 4,847 (655) 4,192 Of which: Contract assets 661 (309) 352 Trade receivables 538 – 538 Deferred acquisition costs 336 (336) – Fulfilment costs 10 (10) – 101,680 165 101,845 Current assets
Inventory 777 (37) 740 Taxation recoverable 115 – 115 Trade and other receivables 13,399 (2,322) 11,077 Of which: Contract assets 3,793 (1,213) 2,580 Trade receivables 5,469 – 5,469 Deferred acquisition costs 1,066 (1,066) – Fulfilment costs 43 (43) – Other investments 10,969 – 10,969 Cash and cash equivalents 6,962 – 6,962 32,222 (2,359) 29,863 Assets held for sale (242) (15) (257) Total assets 133,660 (2,209) 131,451
Equity
Called up share capital 4,796 – 4,796 Additional paid-in capital 150,307 – 150,307 Treasury shares (8,380) – (8,380) Accumulated losses (115,434) (1,840) (117,274) Accumulated other comprehensive income 29,160 40 29,200 Total attributable to owners of the parent 60,449 (1,800) 58,649
Non-controlling interests 927 (72) 855 Total non-controlling interests 927 (72) 855
Total equity 61,376 (1,872) 59,504
Non-current liabilities
Long-term borrowings 42,670 – 42,670 Deferred tax liabilities 488 (103) 385 Post employment benefits 303 – 303 Provisions 1,075 – 1,075 Trade and other payables 3,188 (28) 3,160 Of which: Contract liabilities 561 (28) 533 47,724 (131) 47,593 Current liabilities
Short-term borrowings 5,502 – 5,502 Financial liabilities under put option arrangements 1,874 – 1,874 Taxation liabilities 647 (9) 638 Provisions 884 – 884 Trade and other payables 15,653 (197) 15,456 Of which: Contract liabilities 1,833 (158) 1,675 Other payables 1,392 (39) 1,353 24,560 (206) 24,354 Liabilities held for sale – – – Total equity and liabilities 133,660 (2,209) 131,451
Note: 1. This difference primarily relates to the impairment of goodwill in respect of Romania and Spain (see note 3); pre-impairment balance sheet
carrying values were higher under IFRS 15 for these entities, consequently impairment charges are higher on an IFRS 15 basis.
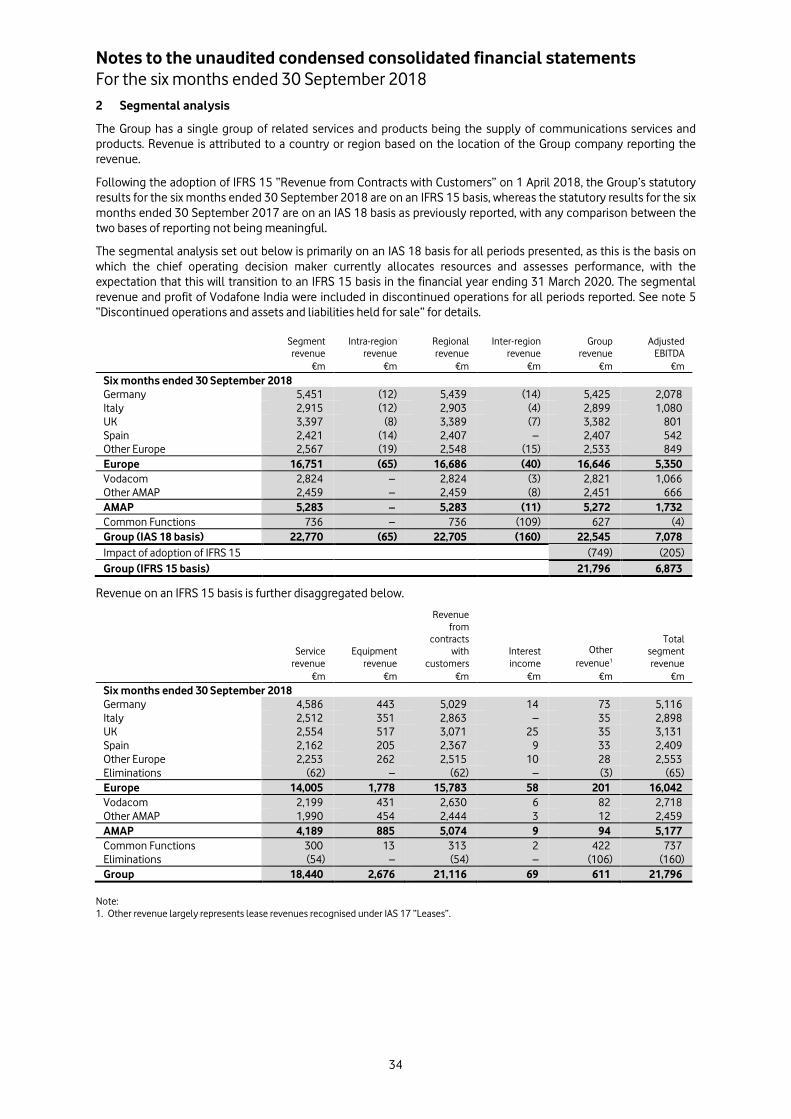
Notes to the unaudited condensed consolidated financial statements For the six months ended 30 September 2018
34
2 Segmental analysis
The Group has a single group of related services and products being the supply of communications services and products. Revenue is attributed to a country or region based on the location of the Group company reporting the revenue.
Following the adoption of IFRS 15 “Revenue from Contracts with Customers” on 1 April 2018, the Group’s statutory results for the six months ended 30 September 2018 are on an IFRS 15 basis, whereas the statutory results for the six months ended 30 September 2017 are on an IAS 18 basis as previously reported, with any comparison between the two bases of reporting not being meaningful.
The segmental analysis set out below is primarily on an IAS 18 basis for all periods presented, as this is the basis on which the chief operating decision maker currently allocates resources and assesses performance, with the expectation that this will transition to an IFRS 15 basis in the financial year ending 31 March 2020. The segmental revenue and profit of Vodafone India were included in discontinued operations for all periods reported. See note 5 “Discontinued operations and assets and liabilities held for sale” for details.
Segment revenue
Intra-region revenue
Regional revenue
Inter-region revenue
Group revenue
Adjusted EBITDA
€m €m €m €m €m €m Six months ended 30 September 2018 Germany 5,451 (12) 5,439 (14) 5,425 2,078 Italy 2,915 (12) 2,903 (4) 2,899 1,080 UK 3,397 (8) 3,389 (7) 3,382 801 Spain 2,421 (14) 2,407 – 2,407 542 Other Europe 2,567 (19) 2,548 (15) 2,533 849 Europe 16,751 (65) 16,686 (40) 16,646 5,350 Vodacom 2,824 – 2,824 (3) 2,821 1,066 Other AMAP 2,459 – 2,459 (8) 2,451 666 AMAP 5,283 – 5,283 (11) 5,272 1,732 Common Functions 736 – 736 (109) 627 (4) Group (IAS 18 basis) 22,770 (65) 22,705 (160) 22,545 7,078 Impact of adoption of IFRS 15 (749) (205) Group (IFRS 15 basis) 21,796 6,873
Revenue on an IFRS 15 basis is further disaggregated below.
Service
revenue Equipment
revenue
Revenue from
contracts with
customers Interest income
Other revenue1
Total segment revenue
€m €m €m €m €m €m
Six months ended 30 September 2018
Germany 4,586 443 5,029 14 73 5,116
Italy 2,512 351 2,863 – 35 2,898
UK 2,554 517 3,071 25 35 3,131
Spain 2,162 205 2,367 9 33 2,409
Other Europe 2,253 262 2,515 10 28 2,553
Eliminations (62) – (62) – (3) (65)
Europe 14,005 1,778 15,783 58 201 16,042
Vodacom 2,199 431 2,630 6 82 2,718
Other AMAP 1,990 454 2,444 3 12 2,459
AMAP 4,189 885 5,074 9 94 5,177
Common Functions 300 13 313 2 422 737
Eliminations (54) – (54) – (106) (160)
Group 18,440 2,676 21,116 69 611 21,796
Note: 1. Other revenue largely represents lease revenues recognised under IAS 17 “Leases”.
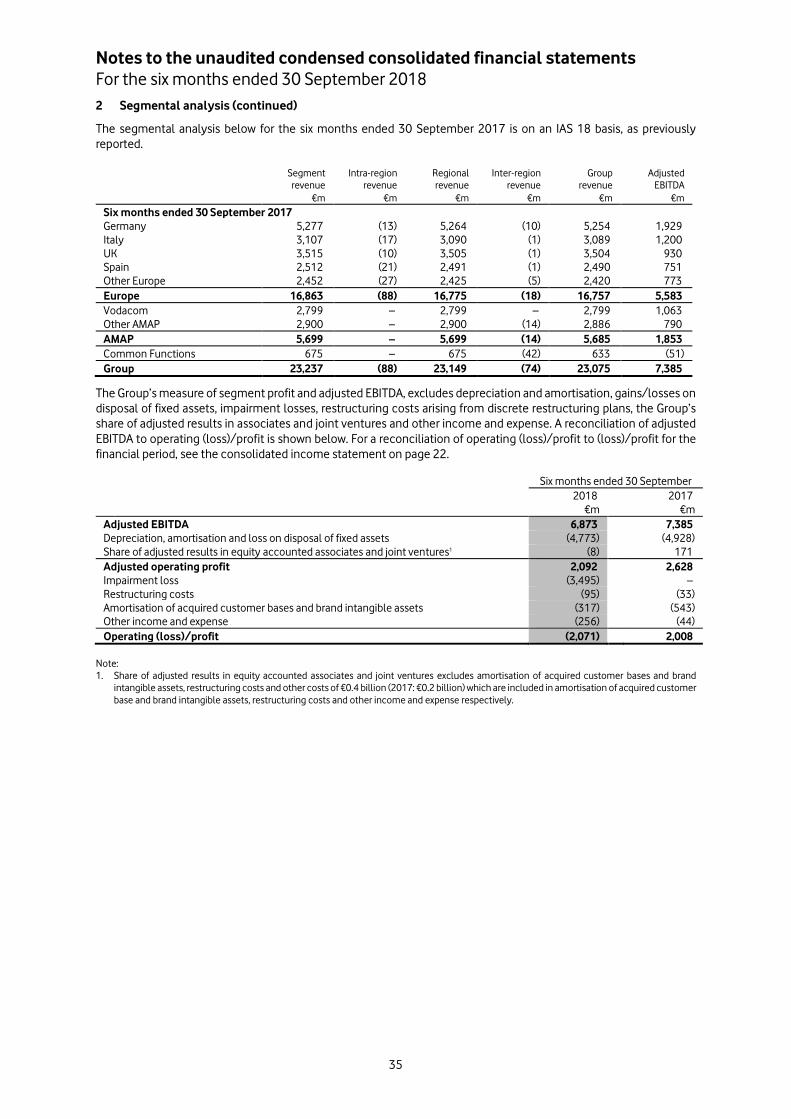
Notes to the unaudited condensed consolidated financial statements For the six months ended 30 September 2018
35
2 Segmental analysis (continued)
The segmental analysis below for the six months ended 30 September 2017 is on an IAS 18 basis, as previously reported.
Segment revenue
Intra-region revenue
Regional revenue
Inter-region revenue
Group revenue
Adjusted EBITDA
€m €m €m €m €m €m Six months ended 30 September 2017 Germany 5,277 (13) 5,264 (10) 5,254 1,929 Italy 3,107 (17) 3,090 (1) 3,089 1,200 UK 3,515 (10) 3,505 (1) 3,504 930 Spain 2,512 (21) 2,491 (1) 2,490 751 Other Europe 2,452 (27) 2,425 (5) 2,420 773 Europe 16,863 (88) 16,775 (18) 16,757 5,583 Vodacom 2,799 – 2,799 – 2,799 1,063 Other AMAP 2,900 – 2,900 (14) 2,886 790 AMAP 5,699 – 5,699 (14) 5,685 1,853 Common Functions 675 – 675 (42) 633 (51) Group 23,237 (88) 23,149 (74) 23,075 7,385
The Group’s measure of segment profit and adjusted EBITDA, excludes depreciation and amortisation, gains/losses on disposal of fixed assets, impairment losses, restructuring costs arising from discrete restructuring plans, the Group’s share of adjusted results in associates and joint ventures and other income and expense. A reconciliation of adjusted EBITDA to operating (loss)/profit is shown below. For a reconciliation of operating (loss)/profit to (loss)/profit for the financial period, see the consolidated income statement on page 22.
Six months ended 30 September
2018 2017 €m €m Adjusted EBITDA 6,873 7,385 Depreciation, amortisation and loss on disposal of fixed assets (4,773) (4,928) Share of adjusted results in equity accounted associates and joint ventures1 (8) 171 Adjusted operating profit 2,092 2,628 Impairment loss (3,495) – Restructuring costs (95) (33) Amortisation of acquired customer bases and brand intangible assets (317) (543) Other income and expense (256) (44) Operating (loss)/profit (2,071) 2,008
Note: 1. Share of adjusted results in equity accounted associates and joint ventures excludes amortisation of acquired customer bases and brand
intangible assets, restructuring costs and other costs of €0.4 billion (2017: €0.2 billion) which are included in amortisation of acquired customer base and brand intangible assets, restructuring costs and other income and expense respectively.
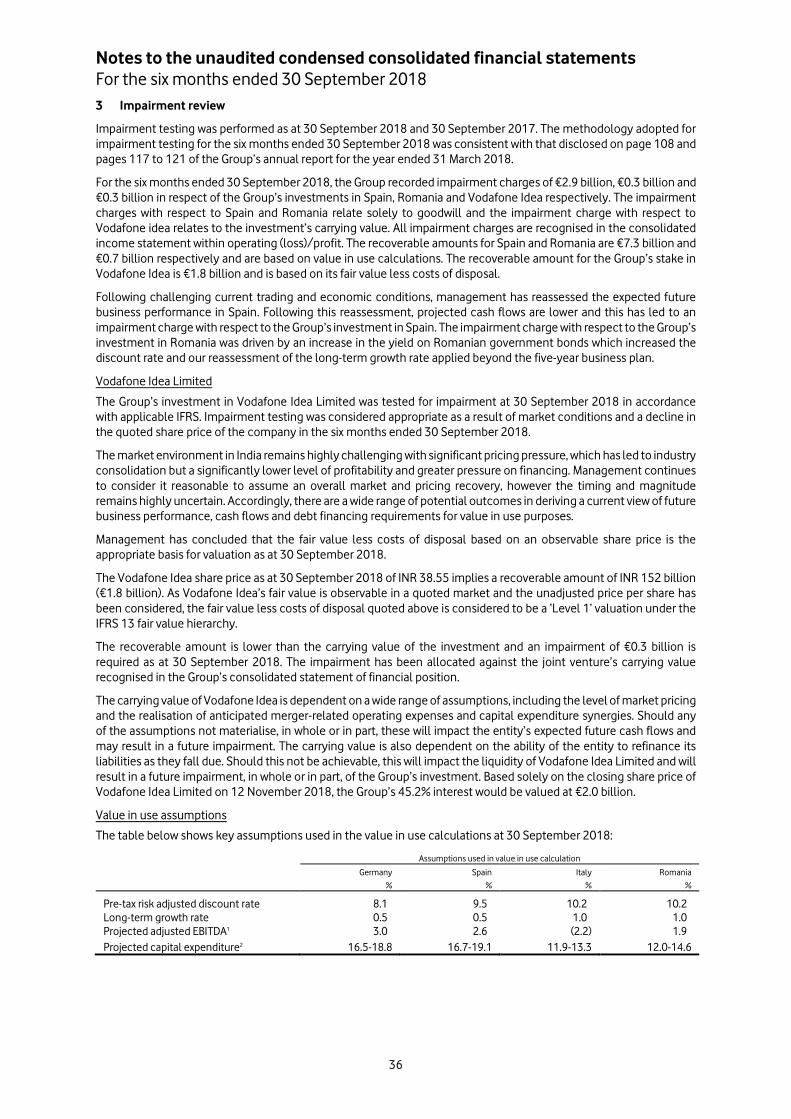
Notes to the unaudited condensed consolidated financial statements For the six months ended 30 September 2018
36
3 Impairment review
Impairment testing was performed as at 30 September 2018 and 30 September 2017. The methodology adopted for impairment testing for the six months ended 30 September 2018 was consistent with that disclosed on page 108 and pages 117 to 121 of the Group’s annual report for the year ended 31 March 2018.
For the six months ended 30 September 2018, the Group recorded impairment charges of €2.9 billion, €0.3 billion and €0.3 billion in respect of the Group’s investments in Spain, Romania and Vodafone Idea respectively. The impairment charges with respect to Spain and Romania relate solely to goodwill and the impairment charge with respect to Vodafone idea relates to the investment’s carrying value. All impairment charges are recognised in the consolidated income statement within operating (loss)/profit. The recoverable amounts for Spain and Romania are €7.3 billion and €0.7 billion respectively and are based on value in use calculations. The recoverable amount for the Group’s stake in Vodafone Idea is €1.8 billion and is based on its fair value less costs of disposal.
Following challenging current trading and economic conditions, management has reassessed the expected future business performance in Spain. Following this reassessment, projected cash flows are lower and this has led to an impairment charge with respect to the Group’s investment in Spain. The impairment charge with respect to the Group’s investment in Romania was driven by an increase in the yield on Romanian government bonds which increased the discount rate and our reassessment of the long-term growth rate applied beyond the five-year business plan.
Vodafone Idea Limited
The Group’s investment in Vodafone Idea Limited was tested for impairment at 30 September 2018 in accordance with applicable IFRS. Impairment testing was considered appropriate as a result of market conditions and a decline in the quoted share price of the company in the six months ended 30 September 2018.
The market environment in India remains highly challenging with significant pricing pressure, which has led to industry consolidation but a significantly lower level of profitability and greater pressure on financing. Management continues to consider it reasonable to assume an overall market and pricing recovery, however the timing and magnitude remains highly uncertain. Accordingly, there are a wide range of potential outcomes in deriving a current view of future business performance, cash flows and debt financing requirements for value in use purposes.
Management has concluded that the fair value less costs of disposal based on an observable share price is the appropriate basis for valuation as at 30 September 2018.
The Vodafone Idea share price as at 30 September 2018 of INR 38.55 implies a recoverable amount of INR 152 billion (€1.8 billion). As Vodafone Idea’s fair value is observable in a quoted market and the unadjusted price per share has been considered, the fair value less costs of disposal quoted above is considered to be a ‘Level 1’ valuation under the IFRS 13 fair value hierarchy.
The recoverable amount is lower than the carrying value of the investment and an impairment of €0.3 billion is required as at 30 September 2018. The impairment has been allocated against the joint venture’s carrying value recognised in the Group’s consolidated statement of financial position.
The carrying value of Vodafone Idea is dependent on a wide range of assumptions, including the level of market pricing and the realisation of anticipated merger-related operating expenses and capital expenditure synergies. Should any of the assumptions not materialise, in whole or in part, these will impact the entity’s expected future cash flows and may result in a future impairment. The carrying value is also dependent on the ability of the entity to refinance its liabilities as they fall due. Should this not be achievable, this will impact the liquidity of Vodafone Idea Limited and will result in a future impairment, in whole or in part, of the Group’s investment. Based solely on the closing share price of Vodafone Idea Limited on 12 November 2018, the Group’s 45.2% interest would be valued at €2.0 billion.
Value in use assumptions
The table below shows key assumptions used in the value in use calculations at 30 September 2018:
Assumptions used in value in use calculation
Germany Spain Italy Romania
% % % %
Pre-tax risk adjusted discount rate 8.1 9.5 10.2 10.2 Long-term growth rate 0.5 0.5 1.0 1.0 Projected adjusted EBITDA1 3.0 2.6 (2.2) 1.9 Projected capital expenditure2 16.5-18.8 16.7-19.1 11.9-13.3 12.0-14.6
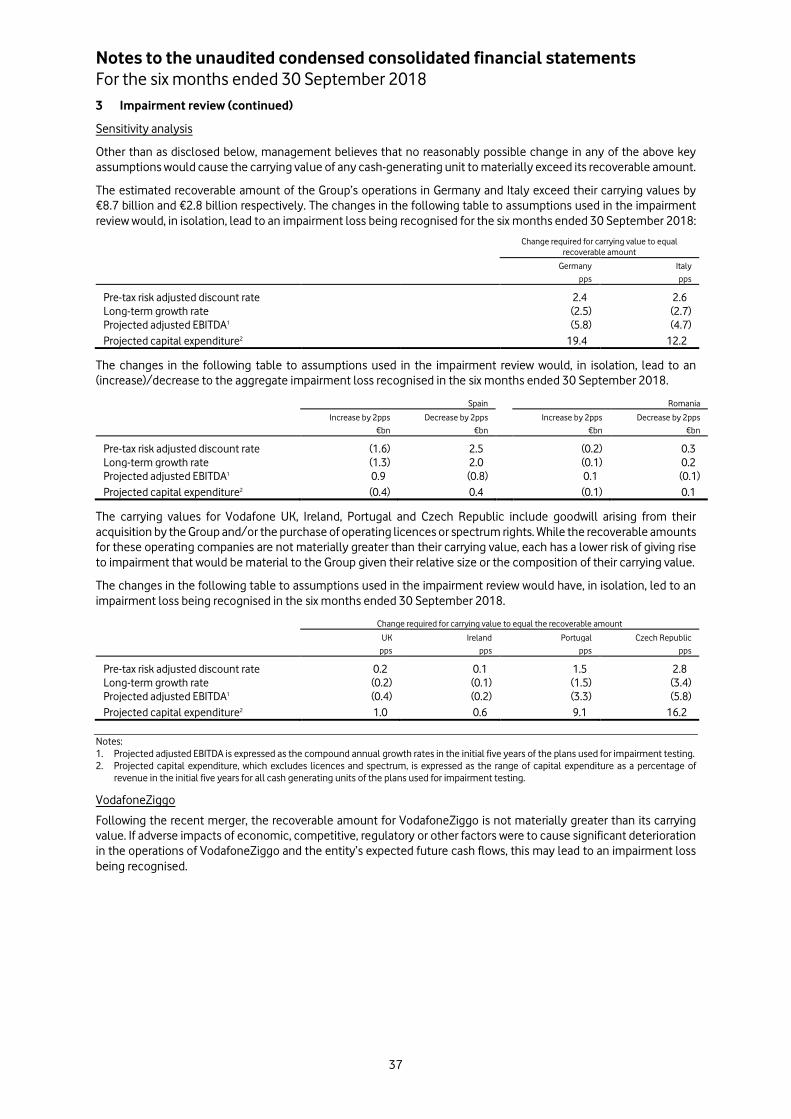
Notes to the unaudited condensed consolidated financial statements For the six months ended 30 September 2018
37
3 Impairment review (continued)
Sensitivity analysis
Other than as disclosed below, management believes that no reasonably possible change in any of the above key assumptions would cause the carrying value of any cash-generating unit to materially exceed its recoverable amount.
The estimated recoverable amount of the Group’s operations in Germany and Italy exceed their carrying values by €8.7 billion and €2.8 billion respectively. The changes in the following table to assumptions used in the impairment review would, in isolation, lead to an impairment loss being recognised for the six months ended 30 September 2018:
Change required for carrying value to equal recoverable amount
Germany Italy pps pps
Pre-tax risk adjusted discount rate 2.4 2.6 Long-term growth rate (2.5) (2.7) Projected adjusted EBITDA1 (5.8) (4.7) Projected capital expenditure2 19.4 12.2
The changes in the following table to assumptions used in the impairment review would, in isolation, lead to an (increase)/decrease to the aggregate impairment loss recognised in the six months ended 30 September 2018.
Spain Romania
Increase by 2pps Decrease by 2pps Increase by 2pps Decrease by 2pps €bn €bn €bn €bn
Pre-tax risk adjusted discount rate (1.6) 2.5 (0.2) 0.3 Long-term growth rate (1.3) 2.0 (0.1) 0.2 Projected adjusted EBITDA1 0.9 (0.8) 0.1 (0.1) Projected capital expenditure2 (0.4) 0.4 (0.1) 0.1
The carrying values for Vodafone UK, Ireland, Portugal and Czech Republic include goodwill arising from their acquisition by the Group and/or the purchase of operating licences or spectrum rights. While the recoverable amounts for these operating companies are not materially greater than their carrying value, each has a lower risk of giving rise to impairment that would be material to the Group given their relative size or the composition of their carrying value.
The changes in the following table to assumptions used in the impairment review would have, in isolation, led to an impairment loss being recognised in the six months ended 30 September 2018.
Change required for carrying value to equal the recoverable amount
UK Ireland Portugal Czech Republic pps pps pps pps
Pre-tax risk adjusted discount rate 0.2 0.1 1.5 2.8 Long-term growth rate (0.2) (0.1) (1.5) (3.4) Projected adjusted EBITDA1 (0.4) (0.2) (3.3) (5.8) Projected capital expenditure2 1.0 0.6 9.1 16.2
Notes: 1. Projected adjusted EBITDA is expressed as the compound annual growth rates in the initial five years of the plans used for impairment testing. 2. Projected capital expenditure, which excludes licences and spectrum, is expressed as the range of capital expenditure as a percentage of
revenue in the initial five years for all cash generating units of the plans used for impairment testing.
VodafoneZiggo
Following the recent merger, the recoverable amount for VodafoneZiggo is not materially greater than its carrying value. If adverse impacts of economic, competitive, regulatory or other factors were to cause significant deterioration in the operations of VodafoneZiggo and the entity’s expected future cash flows, this may lead to an impairment loss being recognised.
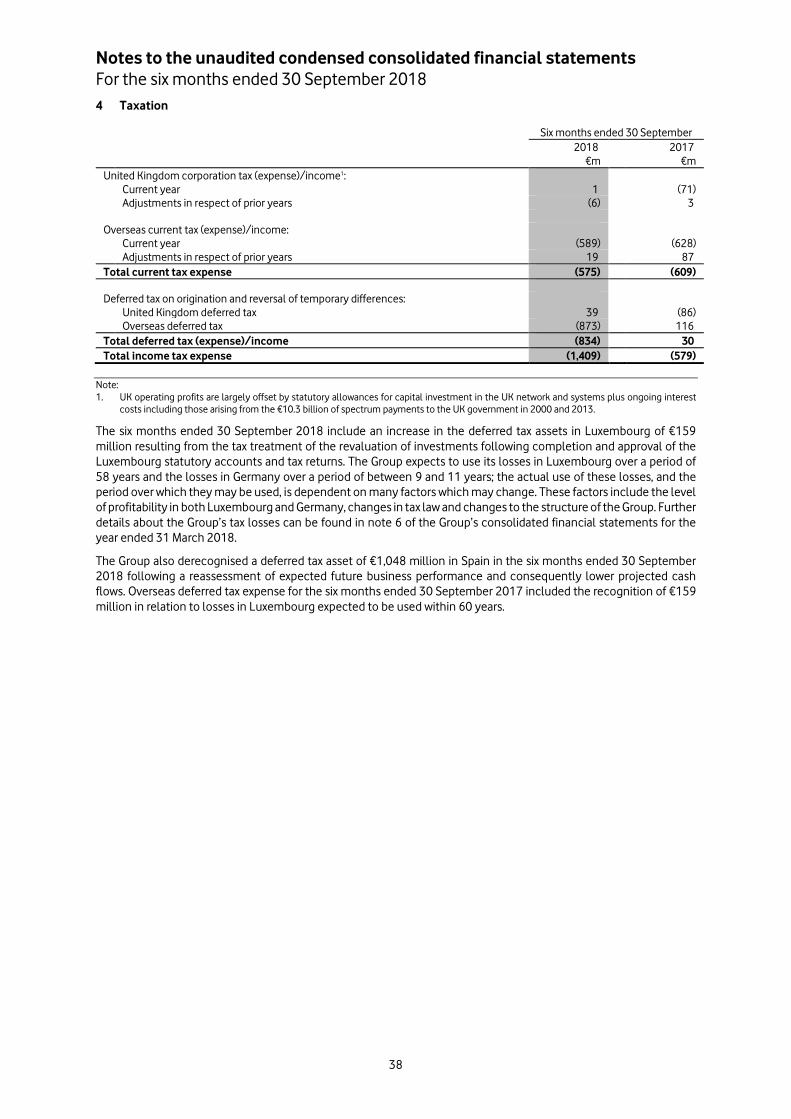
Notes to the unaudited condensed consolidated financial statements For the six months ended 30 September 2018
38
4 Taxation
Six months ended 30 September
2018 2017 €m €m United Kingdom corporation tax (expense)/income1:
Current year 1 (71) Adjustments in respect of prior years (6) 3
Overseas current tax (expense)/income:
Current year (589) (628) Adjustments in respect of prior years 19 87 Total current tax expense (575) (609)
Deferred tax on origination and reversal of temporary differences:
United Kingdom deferred tax 39 (86) Overseas deferred tax (873) 116 Total deferred tax (expense)/income (834) 30 Total income tax expense (1,409) (579)
Note: 1. UK operating profits are largely offset by statutory allowances for capital investment in the UK network and systems plus ongoing interest
costs including those arising from the €10.3 billion of spectrum payments to the UK government in 2000 and 2013.
The six months ended 30 September 2018 include an increase in the deferred tax assets in Luxembourg of €159 million resulting from the tax treatment of the revaluation of investments following completion and approval of the Luxembourg statutory accounts and tax returns. The Group expects to use its losses in Luxembourg over a period of 58 years and the losses in Germany over a period of between 9 and 11 years; the actual use of these losses, and the period over which they may be used, is dependent on many factors which may change. These factors include the level of profitability in both Luxembourg and Germany, changes in tax law and changes to the structure of the Group. Further details about the Group’s tax losses can be found in note 6 of the Group’s consolidated financial statements for the year ended 31 March 2018.
The Group also derecognised a deferred tax asset of €1,048 million in Spain in the six months ended 30 September 2018 following a reassessment of expected future business performance and consequently lower projected cash flows. Overseas deferred tax expense for the six months ended 30 September 2017 included the recognition of €159 million in relation to losses in Luxembourg expected to be used within 60 years.
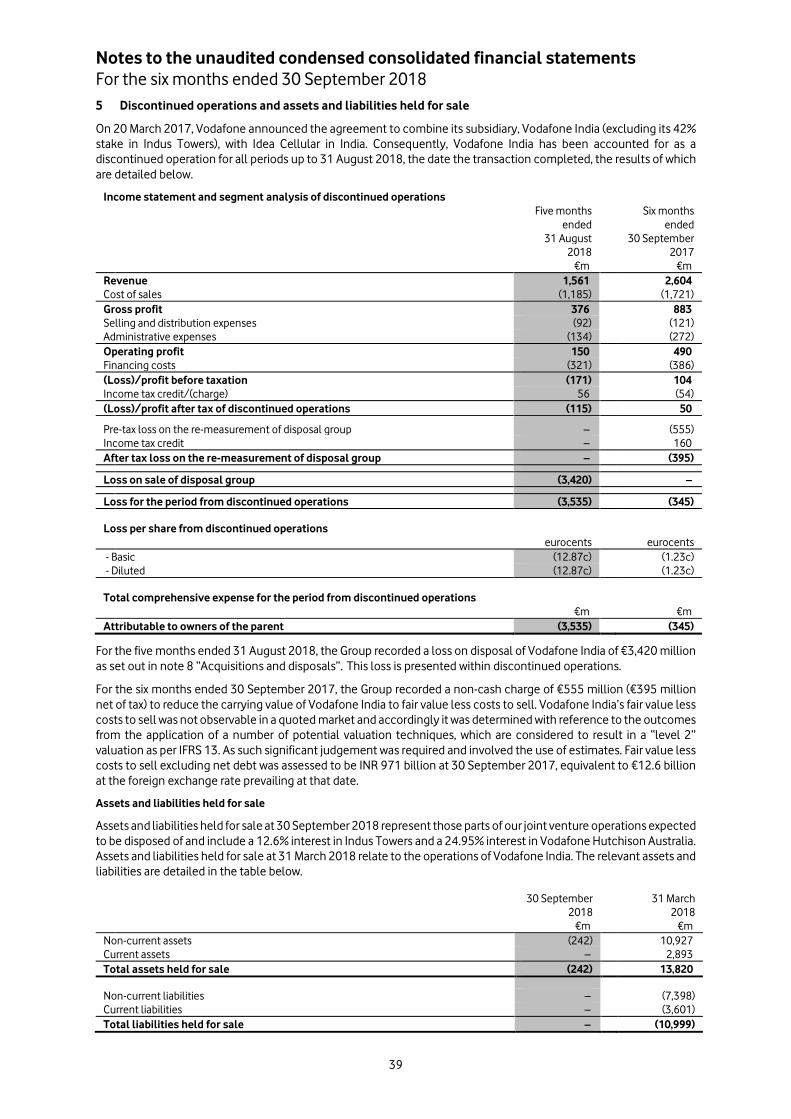
Notes to the unaudited condensed consolidated financial statements For the six months ended 30 September 2018
39
5 Discontinued operations and assets and liabilities held for sale
On 20 March 2017, Vodafone announced the agreement to combine its subsidiary, Vodafone India (excluding its 42% stake in Indus Towers), with Idea Cellular in India. Consequently, Vodafone India has been accounted for as a discontinued operation for all periods up to 31 August 2018, the date the transaction completed, the results of which are detailed below.
Income statement and segment analysis of discontinued operations
Five months Six months ended ended 31 August 30 September 2018 2017 €m €m Revenue 1,561 2,604 Cost of sales (1,185) (1,721) Gross profit 376 883 Selling and distribution expenses (92) (121) Administrative expenses (134) (272) Operating profit 150 490 Financing costs (321) (386) (Loss)/profit before taxation (171) 104 Income tax credit/(charge) 56 (54) (Loss)/profit after tax of discontinued operations (115) 50
Pre-tax loss on the re-measurement of disposal group – (555) Income tax credit – 160 After tax loss on the re-measurement of disposal group – (395)
Loss on sale of disposal group (3,420) –
Loss for the period from discontinued operations (3,535) (345)
Loss per share from discontinued operations
eurocents eurocents - Basic (12.87c) (1.23c) - Diluted (12.87c) (1.23c)
Total comprehensive expense for the period from discontinued operations
€m €m Attributable to owners of the parent (3,535) (345)
For the five months ended 31 August 2018, the Group recorded a loss on disposal of Vodafone India of €3,420 million as set out in note 8 “Acquisitions and disposals”. This loss is presented within discontinued operations.
For the six months ended 30 September 2017, the Group recorded a non-cash charge of €555 million (€395 million net of tax) to reduce the carrying value of Vodafone India to fair value less costs to sell. Vodafone India’s fair value less costs to sell was not observable in a quoted market and accordingly it was determined with reference to the outcomes from the application of a number of potential valuation techniques, which are considered to result in a “level 2” valuation as per IFRS 13. As such significant judgement was required and involved the use of estimates. Fair value less costs to sell excluding net debt was assessed to be INR 971 billion at 30 September 2017, equivalent to €12.6 billion at the foreign exchange rate prevailing at that date.
Assets and liabilities held for sale
Assets and liabilities held for sale at 30 September 2018 represent those parts of our joint venture operations expected to be disposed of and include a 12.6% interest in Indus Towers and a 24.95% interest in Vodafone Hutchison Australia. Assets and liabilities held for sale at 31 March 2018 relate to the operations of Vodafone India. The relevant assets and liabilities are detailed in the table below.
30 September 31 March 2018 2018 €m €m Non-current assets (242) 10,927 Current assets – 2,893 Total assets held for sale (242) 13,820
Non-current liabilities – (7,398) Current liabilities – (3,601) Total liabilities held for sale – (10,999)
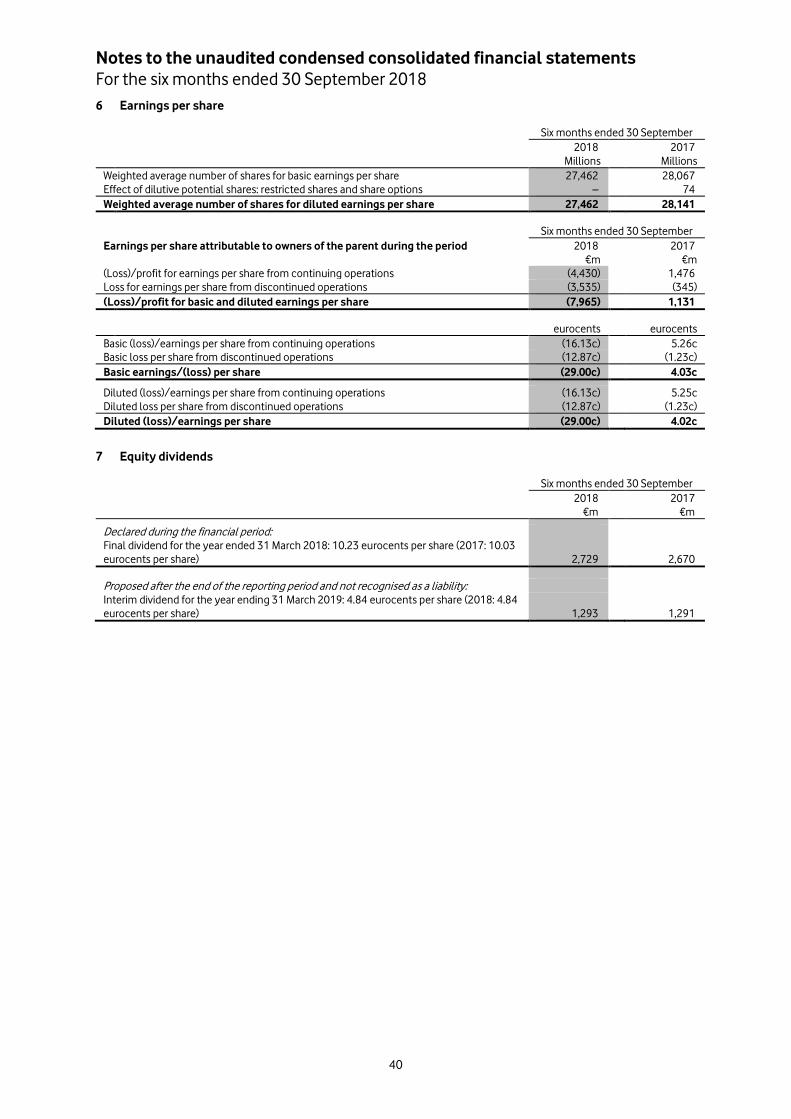
Notes to the unaudited condensed consolidated financial statements For the six months ended 30 September 2018
40
6 Earnings per share
Six months ended 30 September
2018 2017 Millions Millions Weighted average number of shares for basic earnings per share 27,462 28,067 Effect of dilutive potential shares: restricted shares and share options – 74 Weighted average number of shares for diluted earnings per share 27,462 28,141
Six months ended 30 September
Earnings per share attributable to owners of the parent during the period 2018 2017 €m €m (Loss)/profit for earnings per share from continuing operations (4,430) 1,476 Loss for earnings per share from discontinued operations (3,535) (345) (Loss)/profit for basic and diluted earnings per share (7,965) 1,131
eurocents eurocents Basic (loss)/earnings per share from continuing operations (16.13c) 5.26c Basic loss per share from discontinued operations (12.87c) (1.23c) Basic earnings/(loss) per share (29.00c) 4.03c
Diluted (loss)/earnings per share from continuing operations (16.13c) 5.25c Diluted loss per share from discontinued operations (12.87c) (1.23c) Diluted (loss)/earnings per share (29.00c) 4.02c
7 Equity dividends
Six months ended 30 September
2018 2017 €m €m
Declared during the financial period:
Final dividend for the year ended 31 March 2018: 10.23 eurocents per share (2017: 10.03 eurocents per share) 2,729 2,670
Proposed after the end of the reporting period and not recognised as a liability:
Interim dividend for the year ending 31 March 2019: 4.84 eurocents per share (2018: 4.84 eurocents per share) 1,293 1,291
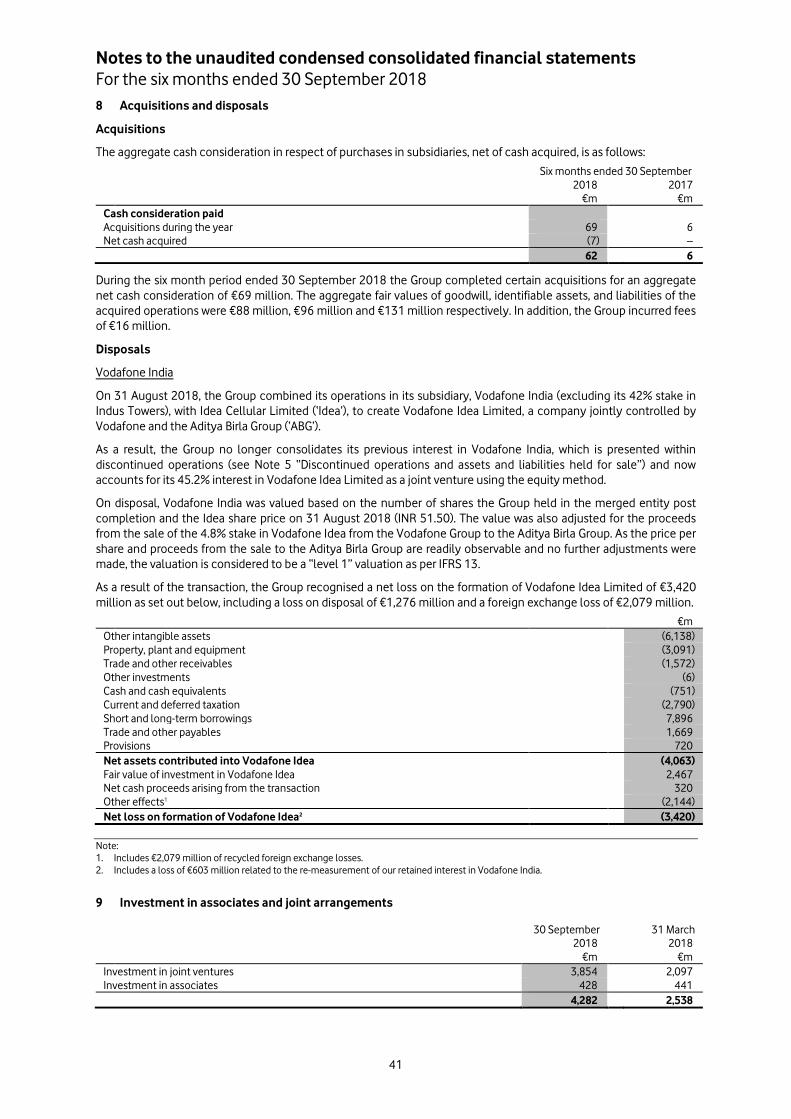
Notes to the unaudited condensed consolidated financial statements For the six months ended 30 September 2018
41
8 Acquisitions and disposals
Acquisitions
The aggregate cash consideration in respect of purchases in subsidiaries, net of cash acquired, is as follows: Six months ended 30 September
2018 2017 €m €m Cash consideration paid
Acquisitions during the year 69 6 Net cash acquired (7) – 62 6
During the six month period ended 30 September 2018 the Group completed certain acquisitions for an aggregate net cash consideration of €69 million. The aggregate fair values of goodwill, identifiable assets, and liabilities of the acquired operations were €88 million, €96 million and €131 million respectively. In addition, the Group incurred fees of €16 million.
Disposals
Vodafone India
On 31 August 2018, the Group combined its operations in its subsidiary, Vodafone India (excluding its 42% stake in Indus Towers), with Idea Cellular Limited (‘Idea’), to create Vodafone Idea Limited, a company jointly controlled by Vodafone and the Aditya Birla Group (‘ABG’).
As a result, the Group no longer consolidates its previous interest in Vodafone India, which is presented within discontinued operations (see Note 5 “Discontinued operations and assets and liabilities held for sale”) and now accounts for its 45.2% interest in Vodafone Idea Limited as a joint venture using the equity method.
On disposal, Vodafone India was valued based on the number of shares the Group held in the merged entity post completion and the Idea share price on 31 August 2018 (INR 51.50). The value was also adjusted for the proceeds from the sale of the 4.8% stake in Vodafone Idea from the Vodafone Group to the Aditya Birla Group. As the price per share and proceeds from the sale to the Aditya Birla Group are readily observable and no further adjustments were made, the valuation is considered to be a “level 1” valuation as per IFRS 13.
As a result of the transaction, the Group recognised a net loss on the formation of Vodafone Idea Limited of €3,420 million as set out below, including a loss on disposal of €1,276 million and a foreign exchange loss of €2,079 million.
€m
Other intangible assets (6,138)
Property, plant and equipment (3,091)
Trade and other receivables (1,572)
Other investments (6)
Cash and cash equivalents (751)
Current and deferred taxation (2,790)
Short and long-term borrowings 7,896
Trade and other payables 1,669
Provisions 720
Net assets contributed into Vodafone Idea (4,063)
Fair value of investment in Vodafone Idea 2,467
Net cash proceeds arising from the transaction 320
Other effects1 (2,144)
Net loss on formation of Vodafone Idea2 (3,420)
Note: 1. Includes €2,079 million of recycled foreign exchange losses. 2. Includes a loss of €603 million related to the re-measurement of our retained interest in Vodafone India.
9 Investment in associates and joint arrangements
30 September 31 March 2018 2018 €m €m Investment in joint ventures 3,854 2,097 Investment in associates 428 441 4,282 2,538
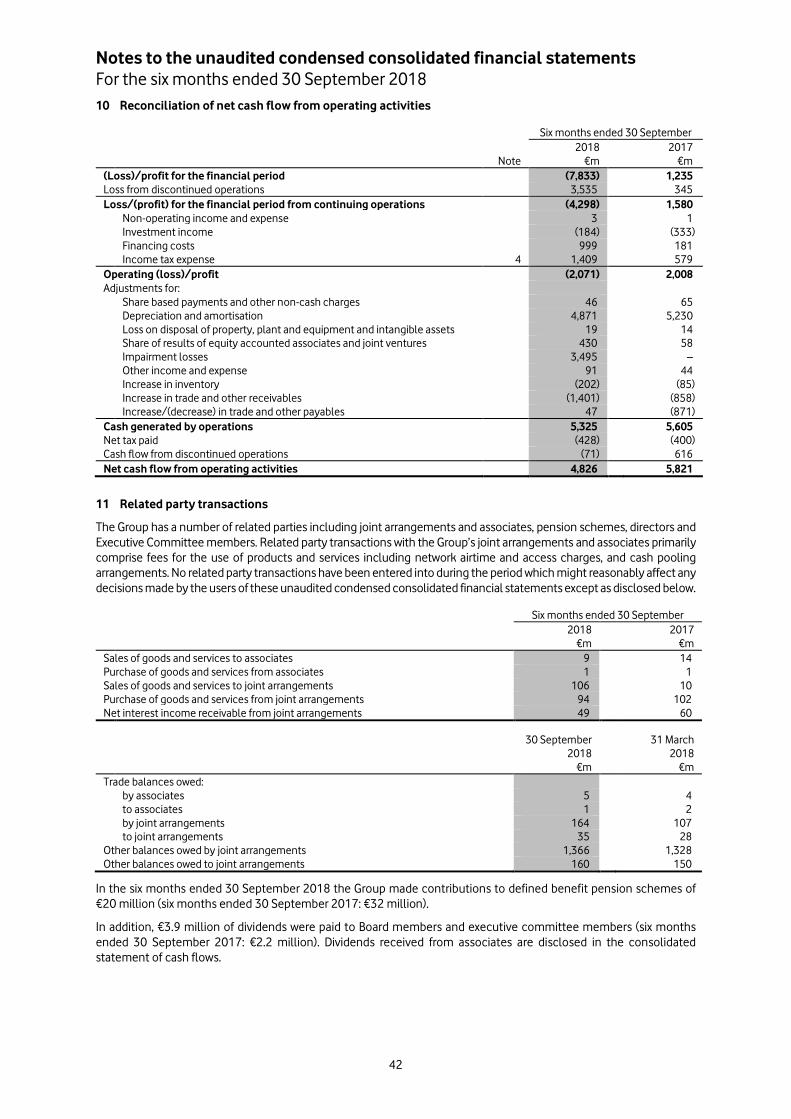
Notes to the unaudited condensed consolidated financial statements For the six months ended 30 September 2018
42
10 Reconciliation of net cash flow from operating activities
Six months ended 30 September 2018 2017 Note €m €m (Loss)/profit for the financial period (7,833) 1,235 Loss from discontinued operations 3,535 345 Loss/(profit) for the financial period from continuing operations (4,298) 1,580 Non-operating income and expense 3 1 Investment income (184) (333) Financing costs 999 181 Income tax expense 4 1,409 579 Operating (loss)/profit (2,071) 2,008 Adjustments for: Share based payments and other non-cash charges 46 65 Depreciation and amortisation 4,871 5,230 Loss on disposal of property, plant and equipment and intangible assets 19 14 Share of results of equity accounted associates and joint ventures 430 58 Impairment losses 3,495 – Other income and expense 91 44 Increase in inventory (202) (85) Increase in trade and other receivables (1,401) (858) Increase/(decrease) in trade and other payables 47 (871) Cash generated by operations 5,325 5,605 Net tax paid (428) (400) Cash flow from discontinued operations (71) 616 Net cash flow from operating activities 4,826 5,821
11 Related party transactions
The Group has a number of related parties including joint arrangements and associates, pension schemes, directors and Executive Committee members. Related party transactions with the Group’s joint arrangements and associates primarily comprise fees for the use of products and services including network airtime and access charges, and cash pooling arrangements. No related party transactions have been entered into during the period which might reasonably affect any decisions made by the users of these unaudited condensed consolidated financial statements except as disclosed below.
Six months ended 30 September
2018 2017 €m €m Sales of goods and services to associates 9 14 Purchase of goods and services from associates 1 1 Sales of goods and services to joint arrangements 106 10 Purchase of goods and services from joint arrangements 94 102 Net interest income receivable from joint arrangements 49 60
30 September 31 March 2018 2018 €m €m Trade balances owed:
by associates 5 4 to associates 1 2 by joint arrangements 164 107 to joint arrangements 35 28 Other balances owed by joint arrangements 1,366 1,328 Other balances owed to joint arrangements 160 150
In the six months ended 30 September 2018 the Group made contributions to defined benefit pension schemes of €20 million (six months ended 30 September 2017: €32 million).
In addition, €3.9 million of dividends were paid to Board members and executive committee members (six months ended 30 September 2017: €2.2 million). Dividends received from associates are disclosed in the consolidated statement of cash flows.
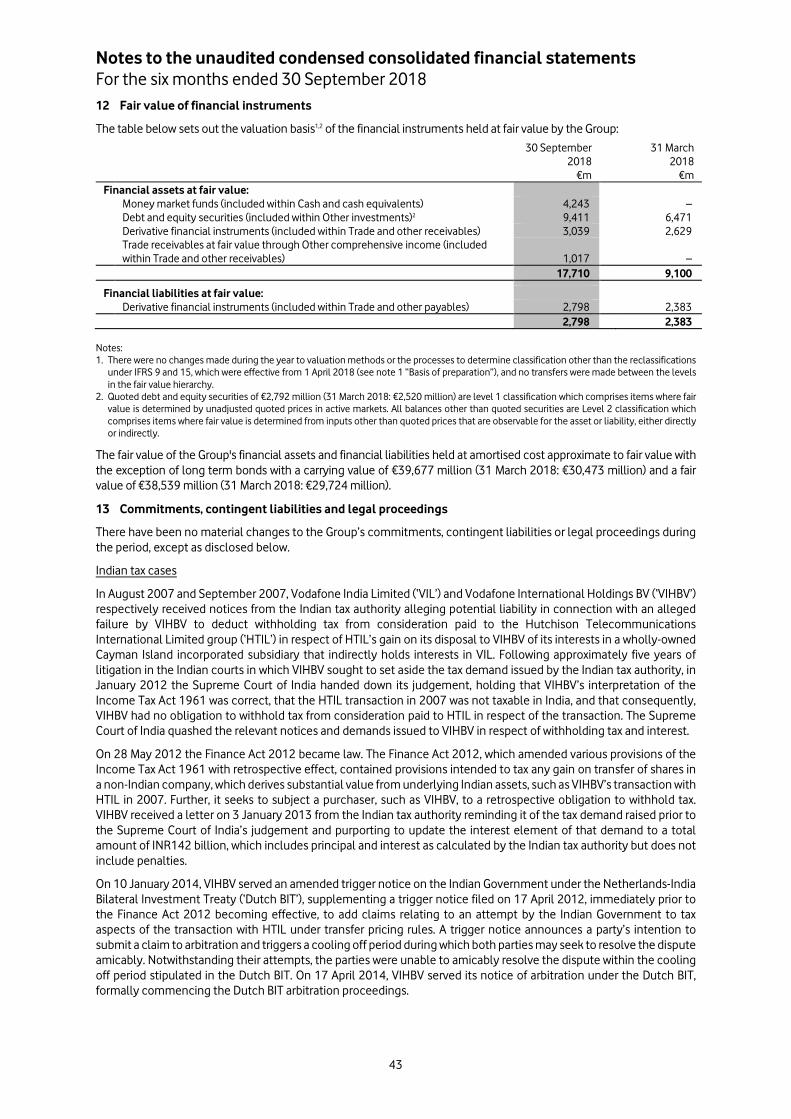
Notes to the unaudited condensed consolidated financial statements For the six months ended 30 September 2018
43
12 Fair value of financial instruments
The table below sets out the valuation basis1,2 of the financial instruments held at fair value by the Group: 30 September 31 March 2018 2018 €m €m Financial assets at fair value:
Money market funds (included within Cash and cash equivalents) 4,243 – Debt and equity securities (included within Other investments)2 9,411 6,471 Derivative financial instruments (included within Trade and other receivables) 3,039 2,629
Trade receivables at fair value through Other comprehensive income (included within Trade and other receivables) 1,017 –
17,710 9,100
Financial liabilities at fair value:
Derivative financial instruments (included within Trade and other payables) 2,798 2,383 2,798 2,383
Notes: 1. There were no changes made during the year to valuation methods or the processes to determine classification other than the reclassifications
under IFRS 9 and 15, which were effective from 1 April 2018 (see note 1 “Basis of preparation”), and no transfers were made between the levels in the fair value hierarchy.
2. Quoted debt and equity securities of €2,792 million (31 March 2018: €2,520 million) are level 1 classification which comprises items where fair value is determined by unadjusted quoted prices in active markets. All balances other than quoted securities are Level 2 classification which comprises items where fair value is determined from inputs other than quoted prices that are observable for the asset or liability, either directly or indirectly.
The fair value of the Group's financial assets and financial liabilities held at amortised cost approximate to fair value with the exception of long term bonds with a carrying value of €39,677 million (31 March 2018: €30,473 million) and a fair value of €38,539 million (31 March 2018: €29,724 million).
13 Commitments, contingent liabilities and legal proceedings
There have been no material changes to the Group’s commitments, contingent liabilities or legal proceedings during the period, except as disclosed below.
Indian tax cases
In August 2007 and September 2007, Vodafone India Limited (‘VIL’) and Vodafone International Holdings BV (‘VIHBV’) respectively received notices from the Indian tax authority alleging potential liability in connection with an alleged failure by VIHBV to deduct withholding tax from consideration paid to the Hutchison Telecommunications International Limited group (‘HTIL’) in respect of HTIL’s gain on its disposal to VIHBV of its interests in a wholly-owned Cayman Island incorporated subsidiary that indirectly holds interests in VIL. Following approximately five years of litigation in the Indian courts in which VIHBV sought to set aside the tax demand issued by the Indian tax authority, in January 2012 the Supreme Court of India handed down its judgement, holding that VIHBV’s interpretation of the Income Tax Act 1961 was correct, that the HTIL transaction in 2007 was not taxable in India, and that consequently, VIHBV had no obligation to withhold tax from consideration paid to HTIL in respect of the transaction. The Supreme Court of India quashed the relevant notices and demands issued to VIHBV in respect of withholding tax and interest.
On 28 May 2012 the Finance Act 2012 became law. The Finance Act 2012, which amended various provisions of the Income Tax Act 1961 with retrospective effect, contained provisions intended to tax any gain on transfer of shares in a non-Indian company, which derives substantial value from underlying Indian assets, such as VIHBV’s transaction with HTIL in 2007. Further, it seeks to subject a purchaser, such as VIHBV, to a retrospective obligation to withhold tax. VIHBV received a letter on 3 January 2013 from the Indian tax authority reminding it of the tax demand raised prior to the Supreme Court of India’s judgement and purporting to update the interest element of that demand to a total amount of INR142 billion, which includes principal and interest as calculated by the Indian tax authority but does not include penalties.
On 10 January 2014, VIHBV served an amended trigger notice on the Indian Government under the Netherlands-India Bilateral Investment Treaty (‘Dutch BIT’), supplementing a trigger notice filed on 17 April 2012, immediately prior to the Finance Act 2012 becoming effective, to add claims relating to an attempt by the Indian Government to tax aspects of the transaction with HTIL under transfer pricing rules. A trigger notice announces a party’s intention to submit a claim to arbitration and triggers a cooling off period during which both parties may seek to resolve the dispute amicably. Notwithstanding their attempts, the parties were unable to amicably resolve the dispute within the cooling off period stipulated in the Dutch BIT. On 17 April 2014, VIHBV served its notice of arbitration under the Dutch BIT, formally commencing the Dutch BIT arbitration proceedings.
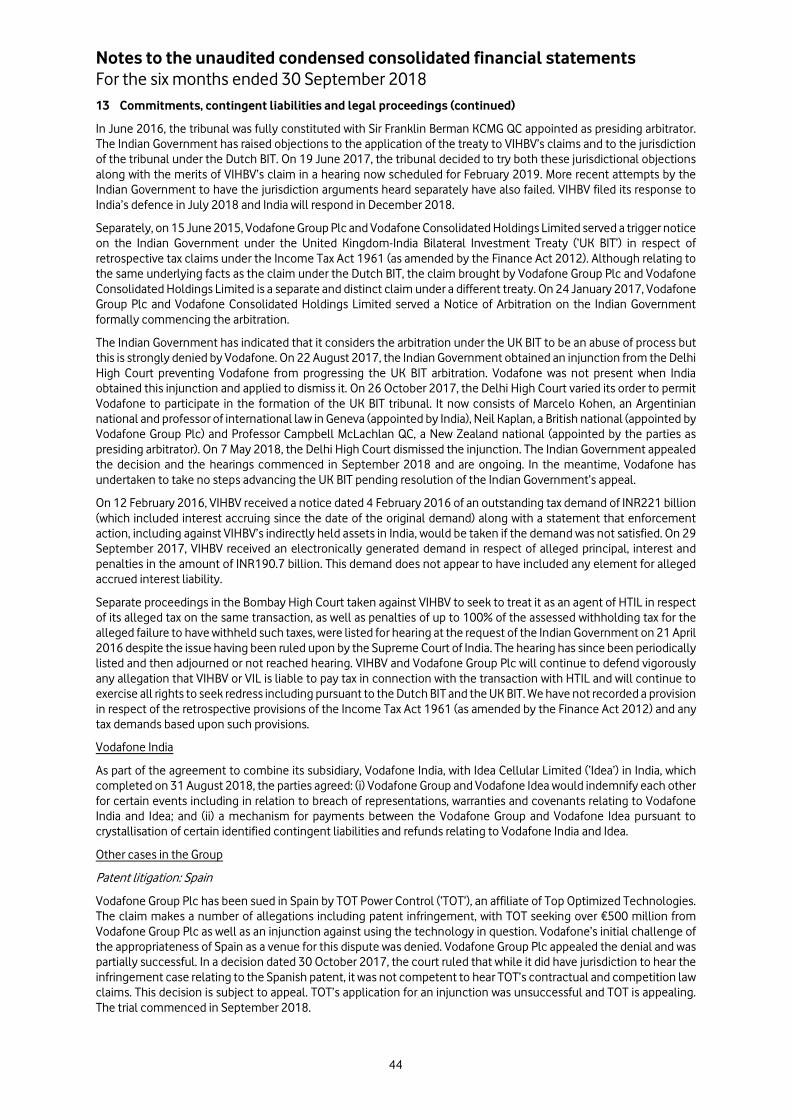
Notes to the unaudited condensed consolidated financial statements For the six months ended 30 September 2018
44
13 Commitments, contingent liabilities and legal proceedings (continued)
In June 2016, the tribunal was fully constituted with Sir Franklin Berman KCMG QC appointed as presiding arbitrator. The Indian Government has raised objections to the application of the treaty to VIHBV’s claims and to the jurisdiction of the tribunal under the Dutch BIT. On 19 June 2017, the tribunal decided to try both these jurisdictional objections along with the merits of VIHBV’s claim in a hearing now scheduled for February 2019. More recent attempts by the Indian Government to have the jurisdiction arguments heard separately have also failed. VIHBV filed its response to India’s defence in July 2018 and India will respond in December 2018.
Separately, on 15 June 2015, Vodafone Group Plc and Vodafone Consolidated Holdings Limited served a trigger notice on the Indian Government under the United Kingdom-India Bilateral Investment Treaty (‘UK BIT’) in respect of retrospective tax claims under the Income Tax Act 1961 (as amended by the Finance Act 2012). Although relating to the same underlying facts as the claim under the Dutch BIT, the claim brought by Vodafone Group Plc and Vodafone Consolidated Holdings Limited is a separate and distinct claim under a different treaty. On 24 January 2017, Vodafone Group Plc and Vodafone Consolidated Holdings Limited served a Notice of Arbitration on the Indian Government formally commencing the arbitration.
The Indian Government has indicated that it considers the arbitration under the UK BIT to be an abuse of process but this is strongly denied by Vodafone. On 22 August 2017, the Indian Government obtained an injunction from the Delhi High Court preventing Vodafone from progressing the UK BIT arbitration. Vodafone was not present when India obtained this injunction and applied to dismiss it. On 26 October 2017, the Delhi High Court varied its order to permit Vodafone to participate in the formation of the UK BIT tribunal. It now consists of Marcelo Kohen, an Argentinian national and professor of international law in Geneva (appointed by India), Neil Kaplan, a British national (appointed by Vodafone Group Plc) and Professor Campbell McLachlan QC, a New Zealand national (appointed by the parties as presiding arbitrator). On 7 May 2018, the Delhi High Court dismissed the injunction. The Indian Government appealed the decision and the hearings commenced in September 2018 and are ongoing. In the meantime, Vodafone has undertaken to take no steps advancing the UK BIT pending resolution of the Indian Government’s appeal.
On 12 February 2016, VIHBV received a notice dated 4 February 2016 of an outstanding tax demand of INR221 billion (which included interest accruing since the date of the original demand) along with a statement that enforcement action, including against VIHBV’s indirectly held assets in India, would be taken if the demand was not satisfied. On 29 September 2017, VIHBV received an electronically generated demand in respect of alleged principal, interest and penalties in the amount of INR190.7 billion. This demand does not appear to have included any element for alleged accrued interest liability.
Separate proceedings in the Bombay High Court taken against VIHBV to seek to treat it as an agent of HTIL in respect of its alleged tax on the same transaction, as well as penalties of up to 100% of the assessed withholding tax for the alleged failure to have withheld such taxes, were listed for hearing at the request of the Indian Government on 21 April 2016 despite the issue having been ruled upon by the Supreme Court of India. The hearing has since been periodically listed and then adjourned or not reached hearing. VIHBV and Vodafone Group Plc will continue to defend vigorously any allegation that VIHBV or VIL is liable to pay tax in connection with the transaction with HTIL and will continue to exercise all rights to seek redress including pursuant to the Dutch BIT and the UK BIT. We have not recorded a provision in respect of the retrospective provisions of the Income Tax Act 1961 (as amended by the Finance Act 2012) and any tax demands based upon such provisions.
Vodafone India
As part of the agreement to combine its subsidiary, Vodafone India, with Idea Cellular Limited (‘Idea’) in India, which completed on 31 August 2018, the parties agreed: (i) Vodafone Group and Vodafone Idea would indemnify each other for certain events including in relation to breach of representations, warranties and covenants relating to Vodafone India and Idea; and (ii) a mechanism for payments between the Vodafone Group and Vodafone Idea pursuant to crystallisation of certain identified contingent liabilities and refunds relating to Vodafone India and Idea.
Other cases in the Group
Patent litigation: Spain
Vodafone Group Plc has been sued in Spain by TOT Power Control (‘TOT’), an affiliate of Top Optimized Technologies. The claim makes a number of allegations including patent infringement, with TOT seeking over €500 million from Vodafone Group Plc as well as an injunction against using the technology in question. Vodafone’s initial challenge of the appropriateness of Spain as a venue for this dispute was denied. Vodafone Group Plc appealed the denial and was partially successful. In a decision dated 30 October 2017, the court ruled that while it did have jurisdiction to hear the infringement case relating to the Spanish patent, it was not competent to hear TOT’s contractual and competition law claims. This decision is subject to appeal. TOT’s application for an injunction was unsuccessful and TOT is appealing. The trial commenced in September 2018.
Notes to the unaudited condensed consolidated financial statements For the six months ended 30 September 2018
45
13 Commitments, contingent liabilities and legal proceedings (continued)
Italy: British Telecom (Italy) v Vodafone Italy
The Italian Competition Authority concluded an investigation in 2007 when Vodafone Italy gave certain undertakings in relation to allegations that it had abused its dominant position in the wholesale market for mobile termination. In 2010, British Telecom (Italy) brought a civil damages claim against Vodafone Italy on the basis of the Competition Authority’s investigation and Vodafone Italy’s undertakings. British Telecom (Italy) sought damages in the amount of €280 million for abuse of dominant position by Vodafone Italy in the wholesale fixed to mobile termination market for the period from 1999 to 2007. A court appointed expert delivered an opinion to the Court that the range of damages in the case should be in the region of €10 million to €25 million which was reduced in a further supplementary report published in September 2014 to a range of €8 million to €11 million. Judgement was handed down by the court in August 2015, awarding €12 million (including interest) to British Telecom (Italy).
British Telecom (Italy) appealed the amount of the damages to the Court of Appeal of Milan. In addition, British Telecom (Italy) has asked again for a reference to the European Court of Justice for an interpretation of the European community law on antitrust damages. Vodafone Italy also filed an appeal which was successful. British Telecom (Italy) were ordered to repay to Vodafone Italy the €12 million with interest and legal costs. BT filed an appeal to the Supreme Court in September 2018.
Italy: Telecom Italia v Vodafone Italy (‘TeleTu’)
Telecom Italia brought civil claims against Vodafone Italy in relation to TeleTu’s alleged anti-competitive retention of customers. Telecom Italia seeks damages in the amount of €101 million. The Court decided on 9 June 2015 to appoint an expert to verify whether TeleTu has put in place anticompetitive retention activities. The expert prepared a draft report with a range of damages from €nil–9 million. The final hearing is set for June 2019.
Greece: Papistas Holdings SA, Mobile Trade Stores (formerly Papistas SA) and Athanasios and Loukia Papistas v Vodafone Greece, Vodafone Group Plc and certain former Directors and Officers of Vodafone
In December 2013, Mr. and Mrs. Papistas, and companies owned or controlled by them, brought three claims in the Greek court in Athens against Vodafone Greece, Vodafone Group Plc and certain Directors and officers of Vodafone Greece and Vodafone Group Plc for purported damage caused by the alleged abuse of dominance and wrongful termination of a franchise arrangement with a Papistas company. Approximately €1.0 billion of the claim is directed exclusively at two former Directors of Vodafone. The balance of the claim (approximately €285.5 million) is sought from Vodafone Greece and Vodafone Group Plc on a joint and several basis. Both cases were adjourned to a hearing in September 2018, at which the plaintiffs withdrew all of their claims against Vodafone and its Directors. Representatives of Mr and Mrs Papistas and companies owned or controlled by them have indicated an intention to file a new claim based on the same subject matter.
Netherlands: Consumer credit/handset case
In February 2016, the Dutch Supreme Court ruled on the Dutch implementation of the EU Consumer Credit Directive and “instalment sales agreements” (a Dutch law concept), holding that bundled “all-in” mobile subscription agreements (i.e. device along with mobile services) are considered consumer credit agreements. As a result, the Group, together with the industry, has been working with the Ministry of Finance and the Competition Authority on compliance requirements going forward for such offers. The ruling also has retrospective effect.
A number of small claims have been submitted by individual customers in the small claims courts. On 15 February 2018, Consumentenbond (a claims agency) initiated collective claim proceedings against VodafoneZiggo, Tele2, T-Mobile and now KPN.
South Africa: GH Investments (‘GHI’) v Vodacom Congo
Vodacom Congo contracted with GHI to install ultra-low cost base stations on a revenue share basis. After rolling out three sites, GHI stopped and sought to renegotiate the terms. Vodacom Congo refused. GHI accused it of bad faith and infringement of intellectual property rights. In April 2015, GHI issued a formal notice for a claim of US$1.16 billion, although there does not seem to be a proper basis nor any substantiation for the compensation claimed. The dispute was submitted to mediation under the International Chamber of Commerce. A mediator was appointed in September 2015 who convened a first meeting which took place in early November 2015. A follow-up mediation meeting was scheduled for December 2015 but was postponed without a new date having been fixed. In July 2016, Vodacom filed a request for arbitration with the International Chamber of Commerce’s International Court of Arbitration. In their response GHI revised their claim down to US$256 million. Each party has appointed an arbitrator and the arbitrators have appointed a third arbitrator to act as presiding arbitrator of the tribunal. A trial was scheduled for March 2018 but GHI failed to pay its share of the arbitration fees resulting in a decision by the Court in February 2018 that GHI’s claims were considered withdrawn. In August 2018, Vodacom obtained a favourable award confirming the withdrawal of GHI’s claims and ordering GHI to pay Vodacom’s costs.
Notes to the unaudited condensed consolidated financial statements For the six months ended 30 September 2018
46
14 Other matters
Vodacom Group
On 11 June 2018, the Group announced that Vodacom intended to support incremental broad-based BEE (black economic empowerment) and ownership in Vodacom. The transaction completed in September 2018 and, as a result, Vodacom’s BEE ownership moved from Vodacom South Africa to Vodacom Group and Vodafone Group’s shareholding in Vodacom will fall from 64.5% to 60.5%.
Vodafone Greece
On 11 July 2018, Vodafone announced that Vodafone-Panafon Hellenic Telecommunications Company S.A. (‘Vodafone Greece’) had completed the acquisition of CYTA Telecommunications Hellas S.A. (“CYTA Hellas”), a provider of fixed and mobile telecommunication services in Greece, for a total enterprise value of €118 million.
Vodafone Spain
On 25 July 2018, Vodafone Spain acquired 90 MHz of contiguous spectrum in the 3700 MHz band for mobile data services in the Economic Ministry’s auction for a total cost of €198.1 million. The fee will be paid by 20 equal annual instalments at a 2.35% interest rate.
Vodafone Hutchison Australia
On 30 August 2018, Vodafone announced that Vodafone Hutchison Australia Pty Limited (“VHA”) and TPG Telecom Limited (“TPG”) had agreed a merger to establish a new fully integrated telecommunications operator in Australia (“MergeCo”). Vodafone and Hutchison Telecommunications (Australia) Limited (“HTAL”) will each own an economic interest of 25.05% in MergeCo, with TPG shareholders owning the remaining 49.9%.
In parallel to the merger agreement, TPG and VHA have signed a separate Joint Venture Agreement. The scope of the joint venture is to acquire, hold and licence 3.6 GHz spectrum. It is anticipated that the merger will complete in 2019, subject to approval from TPG shareholders and regulatory authorities.
Vodafone Idea
On 31 August 2018, the Group completed both the agreement to combine Vodafone India with Idea Cellular to form Vodafone Idea and the separate purchase by the Aditya Birla Group of a 4.8% stake in Vodafone Idea from Vodafone Group for a total consideration of INR 26 billion (€0.3 billion).
After taking these proceeds into account, there is a net cash outflow to India from Vodafone Group of INR60 billion (€0.8 billion). Following completion, Vodafone owns a 45.2% stake in Vodafone Idea and Aditya Birla Group owns a 26.0% stake, both on a fully diluted basis.
Board changes
On 27 July 2018, following the Group’s Annual General Meeting, Margherita Della Valle was appointed as Group Chief Financial Officer and Director of the Company, succeeding Nick Read, who at the same time was appointed as Group Chief Executive-Designate. Nick Read succeeded Vittorio Colao as Group Chief Executive Officer on 1 October 2018.
15 Subsequent events
Vodafone Italy
On 2 October 2018, the Group announced that Vodafone Italy had acquired spectrum to enable the deployment of new 5G technology for a total cost of €2.4 billion. The spectrum acquired in the auction hosted by the Ministry of Economic Development comprised:
• 3700 MHz – 80 MHz for €1,685 million, available from 1 January 2019 with a licence duration of 19 years. • 700 MHz – 2 x 10 MHz FDD (Frequency Division Duplexing) for €683 million, available from July 2022 with licence
duration of 15.5 years (awarded and recognised prior to 30 September 2018). • 26 GHz – 200 MHz for €33 million, available from 1 January 2019 with a licence duration of 19 years.
Bonds
In accordance with the Group’s announced intention to issue hybrid bonds as part of its funding of the acquisition of Liberty Global’s cable assets in Germany and Central and Eastern Europe, the Group issued bonds amounting to €4.2 billion, euro equivalent with cash received on 3 October 2018.
Board changes
On 9 November 2018, the Group announced the appointment of Sanjiv Ahuja as a Non-Executive Director with immediate effect.
INDEPENDENT REVIEW REPORT TO VODAFONE GROUP PLC
47
Report on the unaudited condensed consolidated financial statements
Our conclusion
We have reviewed Vodafone Group Plc's unaudited condensed consolidated financial statements (the "interim financial statements") in the half-year financial report of Vodafone Group Plc for the 6 month period ended 30 September 2018. Based on our review, nothing has come to our attention that causes us to believe that the interim financial statements are not prepared, in all material respects, in accordance with International Accounting Standard 34, ‘Interim Financial Reporting’, as issued by the International Accounting Standards Board and as adopted by the European Union and the Disclosure Guidance and Transparency Rules sourcebook of the United Kingdom’s Financial Conduct Authority.
What we have reviewed
The interim financial statements comprise:
• the consolidated statement of financial position as at 30 September 2018;
• the consolidated income statement and consolidated statement of comprehensive income for the period then ended;
• the consolidated statement of cash flows for the period then ended;
• the consolidated statement of changes in equity for the period then ended; and
• the explanatory notes to the interim financial statements.
The interim financial statements included in the half-year financial report have been prepared in accordance with International Accounting Standard 34, ‘Interim Financial Reporting’, as issued by the International Accounting Standards Board and as adopted by the European Union and the Disclosure Guidance and Transparency Rules sourcebook of the United Kingdom’s Financial Conduct Authority.
As disclosed in note 1 to the interim financial statements, the financial reporting framework that has been applied in the preparation of the full annual financial statements of the Group is applicable law and International Financial Reporting Standards (IFRSs) as issued by the International Accounting Standards Board and as adopted by the European Union.
Responsibilities for the interim financial statements and the review
Our responsibilities and those of the directors
The half-year financial report, including the interim financial statements, is the responsibility of, and has been approved by, the directors. The directors are responsible for preparing the half-year financial report in accordance with the Disclosure Guidance and Transparency Rules sourcebook of the United Kingdom’s Financial Conduct Authority.
Our responsibility is to express a conclusion on the interim financial statements in the half-year financial report based on our review. This report, including the conclusion, has been prepared for and only for the company for the purpose of complying with the Disclosure Guidance and Transparency Rules sourcebook of the United Kingdom’s Financial Conduct Authority and for no other purpose. We do not, in giving this conclusion, accept or assume responsibility for any other purpose or to any other person to whom this report is shown or into whose hands it may come save where expressly agreed by our prior consent in writing.
What a review of interim financial statements involves
We conducted our review in accordance with International Standard on Review Engagements (UK and Ireland) 2410, ‘Review of Interim Financial Information Performed by the Independent Auditor of the Entity’ issued by the Auditing Practices Board for use in the United Kingdom. A review of interim financial information consists of making enquiries, primarily of persons responsible for financial and accounting matters, and applying analytical and other review procedures.
A review is substantially less in scope than an audit conducted in accordance with International Standards on Auditing (UK) and, consequently, does not enable us to obtain assurance that we would become aware of all significant matters that might be identified in an audit. Accordingly, we do not express an audit opinion.
We have read the other information contained in the half-year financial report and considered whether it contains any apparent misstatements or material inconsistencies with the information in the interim financial statements.
PricewaterhouseCoopers LLP Chartered Accountants London 13 November 2018
Notes: 1. The maintenance and integrity of the Vodafone Group Plc website is the responsibility of the directors; the work carried out by the auditors does not involve
consideration of these matters and, accordingly, the auditors accept no responsibility for any changes that may have occurred to the interim financial statements since they were initially presented on the website.
2. Legislation in the United Kingdom governing the preparation and dissemination of financial statements may differ from legislation in other jurisdictions.
ALTERNATIVE PERFORMANCE MEASURES
48
In the discussion of the Group’s reported operating results, alternative performance measures are presented to provide readers with additional financial information that is regularly reviewed by management. However, this additional information presented is not uniformly defined by all companies including those in the Group’s industry. Accordingly, it may not be comparable with similarly titled measures and disclosures by other companies. Additionally, certain information presented is derived from amounts calculated in accordance with IFRS but is not itself an expressly permitted GAAP measure. Such measures should not be viewed in isolation or as an alternative to the equivalent GAAP measure.
Further information on the use of alternative performance measures is outlined on pages 207 to 217 of the Group’s annual report for the financial year ended 31 March 2018.
IFRS 15 basis and IAS 18 basis
Following the adoption of IFRS 15 “Revenue from Contracts with Customers” on 1 April 2018, the Group’s statutory results for the six months ended 30 September 2018 are on an IFRS 15 basis, whereas the statutory results for the six months ended 30 September 2017 are on an IAS 18 basis as previously reported, with any comparison between the two bases of reporting not being meaningful. As a result, the discussion of our operating results in the Financial Results section is primarily performed on an IAS 18 basis for all periods presented.
We believe that the IAS 18 basis metrics for the six months ended 30 September 2018, which are not intended to be a substitute for, or superior to, our reported metrics on an IFRS 15 basis, provide useful information to allow comparable growth rates to be calculated. The impact of the adoption of IFRS 15 on key financial information for the six months ended 30 September 2018, and a reconciliation of these financial measures as presented on an IAS 18 basis to their closest respective GAAP measures, is set out in note 1 ‘Basis of Preparation’ to the unaudited condensed consolidated financial statements beginning on page 26.
Service revenue
Service revenue comprises all revenue related to the provision of ongoing services including, but not limited to, monthly access charges, airtime usage, roaming, incoming and outgoing network usage by non-Vodafone customers, interconnect charges for incoming calls and, with effect from 1 April 2018, excludes international wholesale voice transit revenues. We believe that it is both useful and necessary to report this measure for the following reasons:
• It is used for internal performance reporting;
• It is used in setting director and management remuneration; and
• It is useful in connection with discussion with the investment analyst community.
A reconciliation of reported service revenue to the respective closest equivalent GAAP measure, revenue, are provided in the section “Financial results” beginning on page 7.
Adjusted EBITDA
Adjusted EBITDA is operating profit excluding share of results in associates and joint ventures, depreciation and amortisation, gains/losses on the disposal of fixed assets, impairment losses, restructuring costs arising from discrete restructuring plans, other operating income and expense and significant items that are not considered by management to be reflective of the underlying performance of the Group. We use adjusted EBITDA, in conjunction with other GAAP and non-GAAP financial measures such as adjusted EBIT, adjusted operating profit, operating profit and net profit, to assess our operating performance. We believe that adjusted EBITDA is an operating performance measure, not a liquidity measure, as it includes non-cash changes in working capital and is reviewed by the Chief Executive to assess internal performance in conjunction with adjusted EBITDA margin, which is an alternative sales margin figure. We believe it is both useful and necessary to report adjusted EBITDA as a performance measure as it enhances the comparability of profit across segments.
Because adjusted EBITDA does not take into account certain items that affect operations and performance, adjusted EBITDA has inherent limitations as a performance measure. To compensate for these limitations, we analyse adjusted EBITDA in conjunction with other GAAP and non-GAAP operating performance measures. Adjusted EBITDA should not be considered in isolation or as a substitute for a GAAP measure of operating performance.
A reconciliation of adjusted EBITDA to the closest equivalent GAAP measure, operating profit, is provided in the section “Financial results” beginning on page 7.
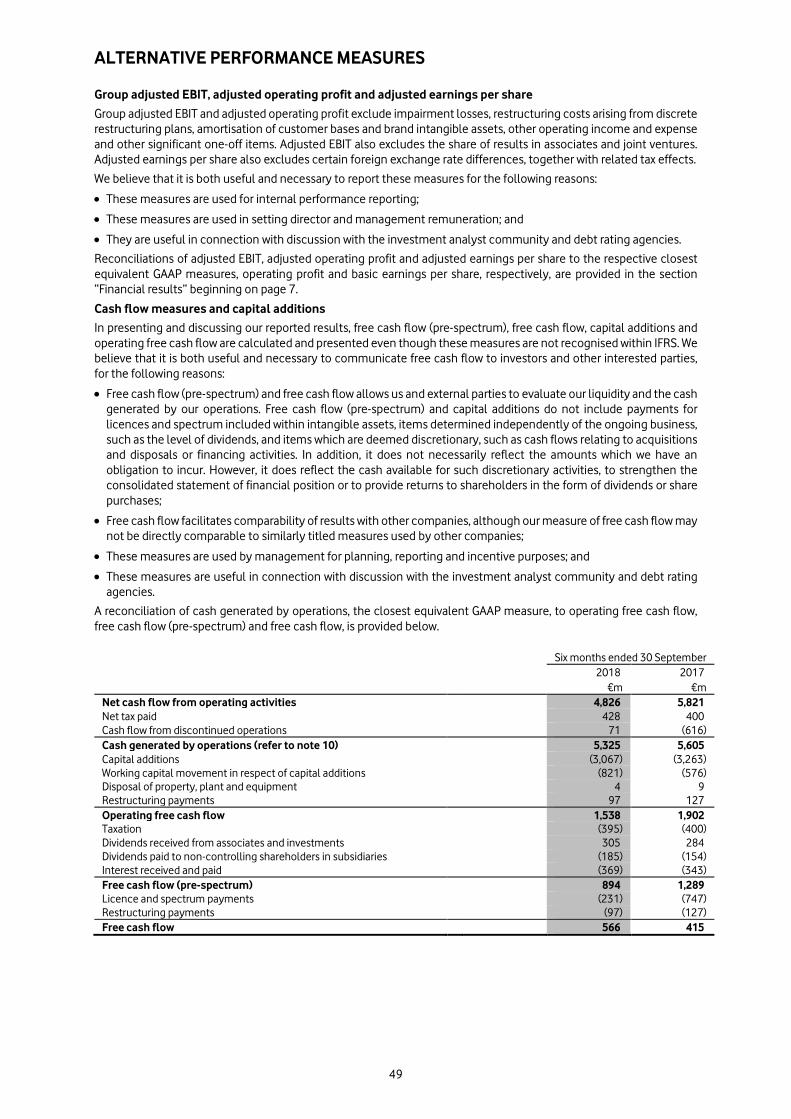
ALTERNATIVE PERFORMANCE MEASURES
49
Group adjusted EBIT, adjusted operating profit and adjusted earnings per share
Group adjusted EBIT and adjusted operating profit exclude impairment losses, restructuring costs arising from discrete restructuring plans, amortisation of customer bases and brand intangible assets, other operating income and expense and other significant one-off items. Adjusted EBIT also excludes the share of results in associates and joint ventures. Adjusted earnings per share also excludes certain foreign exchange rate differences, together with related tax effects.
We believe that it is both useful and necessary to report these measures for the following reasons:
• These measures are used for internal performance reporting;
• These measures are used in setting director and management remuneration; and
• They are useful in connection with discussion with the investment analyst community and debt rating agencies.
Reconciliations of adjusted EBIT, adjusted operating profit and adjusted earnings per share to the respective closest equivalent GAAP measures, operating profit and basic earnings per share, respectively, are provided in the section “Financial results” beginning on page 7.
Cash flow measures and capital additions
In presenting and discussing our reported results, free cash flow (pre-spectrum), free cash flow, capital additions and operating free cash flow are calculated and presented even though these measures are not recognised within IFRS. We believe that it is both useful and necessary to communicate free cash flow to investors and other interested parties, for the following reasons:
• Free cash flow (pre-spectrum) and free cash flow allows us and external parties to evaluate our liquidity and the cash generated by our operations. Free cash flow (pre-spectrum) and capital additions do not include payments for licences and spectrum included within intangible assets, items determined independently of the ongoing business, such as the level of dividends, and items which are deemed discretionary, such as cash flows relating to acquisitions and disposals or financing activities. In addition, it does not necessarily reflect the amounts which we have an obligation to incur. However, it does reflect the cash available for such discretionary activities, to strengthen the consolidated statement of financial position or to provide returns to shareholders in the form of dividends or share purchases;
• Free cash flow facilitates comparability of results with other companies, although our measure of free cash flow may not be directly comparable to similarly titled measures used by other companies;
• These measures are used by management for planning, reporting and incentive purposes; and
• These measures are useful in connection with discussion with the investment analyst community and debt rating agencies.
A reconciliation of cash generated by operations, the closest equivalent GAAP measure, to operating free cash flow, free cash flow (pre-spectrum) and free cash flow, is provided below.
Six months ended 30 September
2018 2017 €m €m Net cash flow from operating activities 4,826 5,821 Net tax paid 428 400 Cash flow from discontinued operations 71 (616) Cash generated by operations (refer to note 10) 5,325 5,605 Capital additions (3,067) (3,263) Working capital movement in respect of capital additions (821) (576) Disposal of property, plant and equipment 4 9 Restructuring payments 97 127 Operating free cash flow 1,538 1,902 Taxation (395) (400) Dividends received from associates and investments 305 284 Dividends paid to non-controlling shareholders in subsidiaries (185) (154) Interest received and paid (369) (343) Free cash flow (pre-spectrum) 894 1,289 Licence and spectrum payments (231) (747) Restructuring payments (97) (127) Free cash flow 566 415
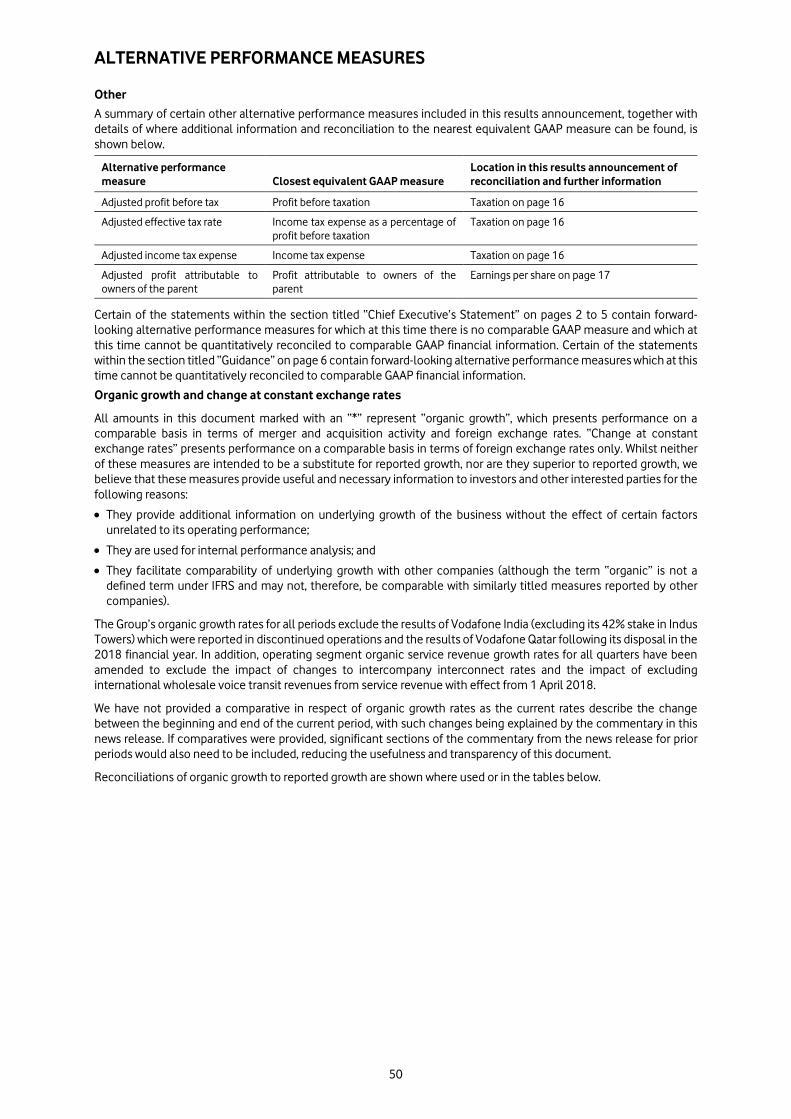
ALTERNATIVE PERFORMANCE MEASURES
50
Other
A summary of certain other alternative performance measures included in this results announcement, together with details of where additional information and reconciliation to the nearest equivalent GAAP measure can be found, is shown below.
Alternative performance measure Closest equivalent GAAP measure
Location in this results announcement of reconciliation and further information
Adjusted profit before tax Profit before taxation Taxation on page 16
Adjusted effective tax rate Income tax expense as a percentage of profit before taxation
Taxation on page 16
Adjusted income tax expense Income tax expense Taxation on page 16
Adjusted profit attributable to owners of the parent
Profit attributable to owners of the parent
Earnings per share on page 17
Certain of the statements within the section titled “Chief Executive’s Statement” on pages 2 to 5 contain forward-looking alternative performance measures for which at this time there is no comparable GAAP measure and which at this time cannot be quantitatively reconciled to comparable GAAP financial information. Certain of the statements within the section titled “Guidance” on page 6 contain forward-looking alternative performance measures which at this time cannot be quantitatively reconciled to comparable GAAP financial information.
Organic growth and change at constant exchange rates
All amounts in this document marked with an “*” represent “organic growth”, which presents performance on a comparable basis in terms of merger and acquisition activity and foreign exchange rates. “Change at constant exchange rates” presents performance on a comparable basis in terms of foreign exchange rates only. Whilst neither of these measures are intended to be a substitute for reported growth, nor are they superior to reported growth, we believe that these measures provide useful and necessary information to investors and other interested parties for the following reasons:
• They provide additional information on underlying growth of the business without the effect of certain factors unrelated to its operating performance;
• They are used for internal performance analysis; and
• They facilitate comparability of underlying growth with other companies (although the term “organic” is not a defined term under IFRS and may not, therefore, be comparable with similarly titled measures reported by other companies).
The Group’s organic growth rates for all periods exclude the results of Vodafone India (excluding its 42% stake in Indus Towers) which were reported in discontinued operations and the results of Vodafone Qatar following its disposal in the 2018 financial year. In addition, operating segment organic service revenue growth rates for all quarters have been amended to exclude the impact of changes to intercompany interconnect rates and the impact of excluding international wholesale voice transit revenues from service revenue with effect from 1 April 2018.
We have not provided a comparative in respect of organic growth rates as the current rates describe the change between the beginning and end of the current period, with such changes being explained by the commentary in this news release. If comparatives were provided, significant sections of the commentary from the news release for prior periods would also need to be included, reducing the usefulness and transparency of this document.
Reconciliations of organic growth to reported growth are shown where used or in the tables below.
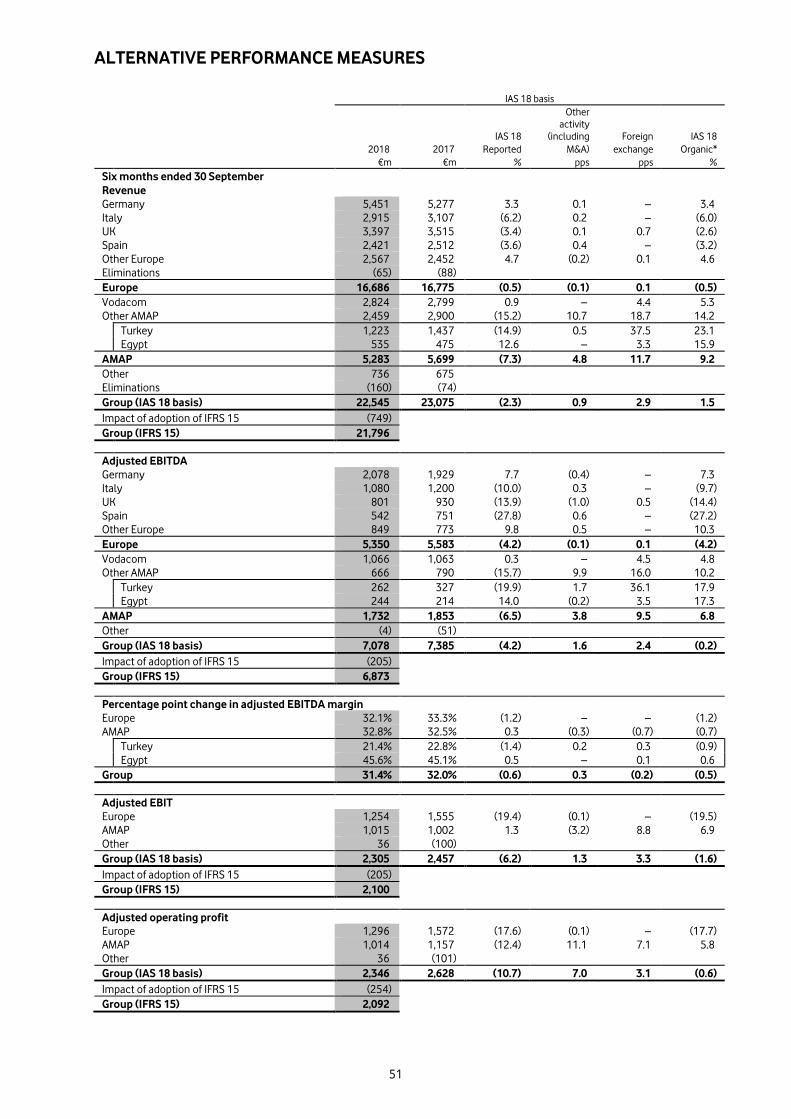
ALTERNATIVE PERFORMANCE MEASURES
51
IAS 18 basis
IAS 18
Other activity
(including Foreign IAS 18 2018 2017 Reported M&A) exchange Organic* €m €m % pps pps % Six months ended 30 September
Revenue
Germany 5,451 5,277 3.3 0.1 – 3.4 Italy 2,915 3,107 (6.2) 0.2 – (6.0) UK 3,397 3,515 (3.4) 0.1 0.7 (2.6) Spain 2,421 2,512 (3.6) 0.4 – (3.2) Other Europe 2,567 2,452 4.7 (0.2) 0.1 4.6 Eliminations (65) (88) Europe 16,686 16,775 (0.5) (0.1) 0.1 (0.5) Vodacom 2,824 2,799 0.9 – 4.4 5.3 Other AMAP 2,459 2,900 (15.2) 10.7 18.7 14.2 Turkey 1,223 1,437 (14.9) 0.5 37.5 23.1 Egypt 535 475 12.6 – 3.3 15.9 AMAP 5,283 5,699 (7.3) 4.8 11.7 9.2 Other 736 675 Eliminations (160) (74) Group (IAS 18 basis) 22,545 23,075 (2.3) 0.9 2.9 1.5 Impact of adoption of IFRS 15 (749) Group (IFRS 15) 21,796
Adjusted EBITDA
Germany 2,078 1,929 7.7 (0.4) – 7.3 Italy 1,080 1,200 (10.0) 0.3 – (9.7) UK 801 930 (13.9) (1.0) 0.5 (14.4) Spain 542 751 (27.8) 0.6 – (27.2) Other Europe 849 773 9.8 0.5 – 10.3 Europe 5,350 5,583 (4.2) (0.1) 0.1 (4.2) Vodacom 1,066 1,063 0.3 – 4.5 4.8 Other AMAP 666 790 (15.7) 9.9 16.0 10.2 Turkey 262 327 (19.9) 1.7 36.1 17.9 Egypt 244 214 14.0 (0.2) 3.5 17.3 AMAP 1,732 1,853 (6.5) 3.8 9.5 6.8 Other (4) (51) Group (IAS 18 basis) 7,078 7,385 (4.2) 1.6 2.4 (0.2) Impact of adoption of IFRS 15 (205) Group (IFRS 15) 6,873
Percentage point change in adjusted EBITDA margin Europe 32.1% 33.3% (1.2) – – (1.2) AMAP 32.8% 32.5% 0.3 (0.3) (0.7) (0.7) Turkey 21.4% 22.8% (1.4) 0.2 0.3 (0.9) Egypt 45.6% 45.1% 0.5 – 0.1 0.6 Group 31.4% 32.0% (0.6) 0.3 (0.2) (0.5)
Adjusted EBIT
Europe 1,254 1,555 (19.4) (0.1) – (19.5) AMAP 1,015 1,002 1.3 (3.2) 8.8 6.9 Other 36 (100) Group (IAS 18 basis) 2,305 2,457 (6.2) 1.3 3.3 (1.6) Impact of adoption of IFRS 15 (205) Group (IFRS 15) 2,100
Adjusted operating profit
Europe 1,296 1,572 (17.6) (0.1) – (17.7) AMAP 1,014 1,157 (12.4) 11.1 7.1 5.8 Other 36 (101) Group (IAS 18 basis) 2,346 2,628 (10.7) 7.0 3.1 (0.6) Impact of adoption of IFRS 15 (254) Group (IFRS 15) 2,092
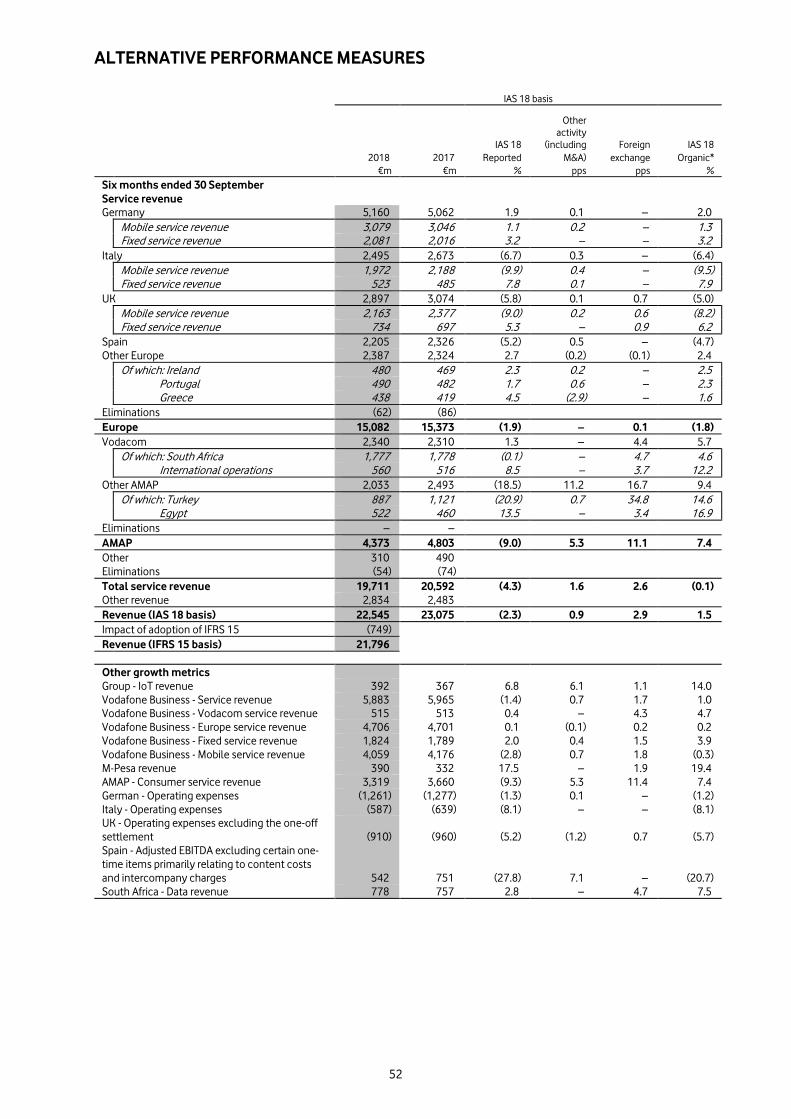
ALTERNATIVE PERFORMANCE MEASURES
52
IAS 18 basis
IAS 18
Other activity
(including Foreign IAS 18 2018 2017 Reported M&A) exchange Organic* €m €m % pps pps % Six months ended 30 September
Service revenue
Germany 5,160 5,062 1.9 0.1 – 2.0 Mobile service revenue 3,079 3,046 1.1 0.2 – 1.3 Fixed service revenue 2,081 2,016 3.2 – – 3.2 Italy 2,495 2,673 (6.7) 0.3 – (6.4) Mobile service revenue 1,972 2,188 (9.9) 0.4 – (9.5) Fixed service revenue 523 485 7.8 0.1 – 7.9 UK 2,897 3,074 (5.8) 0.1 0.7 (5.0) Mobile service revenue 2,163 2,377 (9.0) 0.2 0.6 (8.2) Fixed service revenue 734 697 5.3 – 0.9 6.2 Spain 2,205 2,326 (5.2) 0.5 – (4.7) Other Europe 2,387 2,324 2.7 (0.2) (0.1) 2.4 Of which: Ireland 480 469 2.3 0.2 – 2.5 Portugal 490 482 1.7 0.6 – 2.3 Greece 438 419 4.5 (2.9) – 1.6 Eliminations (62) (86) Europe 15,082 15,373 (1.9) – 0.1 (1.8) Vodacom 2,340 2,310 1.3 – 4.4 5.7 Of which: South Africa 1,777 1,778 (0.1) – 4.7 4.6 International operations 560 516 8.5 – 3.7 12.2 Other AMAP 2,033 2,493 (18.5) 11.2 16.7 9.4 Of which: Turkey 887 1,121 (20.9) 0.7 34.8 14.6 Egypt 522 460 13.5 – 3.4 16.9 Eliminations – – AMAP 4,373 4,803 (9.0) 5.3 11.1 7.4 Other 310 490 Eliminations (54) (74) Total service revenue 19,711 20,592 (4.3) 1.6 2.6 (0.1) Other revenue 2,834 2,483 Revenue (IAS 18 basis) 22,545 23,075 (2.3) 0.9 2.9 1.5 Impact of adoption of IFRS 15 (749) Revenue (IFRS 15 basis) 21,796
Other growth metrics
Group - IoT revenue 392 367 6.8 6.1 1.1 14.0 Vodafone Business - Service revenue 5,883 5,965 (1.4) 0.7 1.7 1.0 Vodafone Business - Vodacom service revenue 515 513 0.4 – 4.3 4.7 Vodafone Business - Europe service revenue 4,706 4,701 0.1 (0.1) 0.2 0.2 Vodafone Business - Fixed service revenue 1,824 1,789 2.0 0.4 1.5 3.9 Vodafone Business - Mobile service revenue 4,059 4,176 (2.8) 0.7 1.8 (0.3) M-Pesa revenue 390 332 17.5 – 1.9 19.4 AMAP - Consumer service revenue 3,319 3,660 (9.3) 5.3 11.4 7.4 German - Operating expenses (1,261) (1,277) (1.3) 0.1 – (1.2) Italy - Operating expenses (587) (639) (8.1) – – (8.1) UK - Operating expenses excluding the one-off settlement (910) (960) (5.2) (1.2) 0.7 (5.7) Spain - Adjusted EBITDA excluding certain one-time items primarily relating to content costs and intercompany charges 542 751 (27.8) 7.1 – (20.7) South Africa - Data revenue 778 757 2.8 – 4.7 7.5
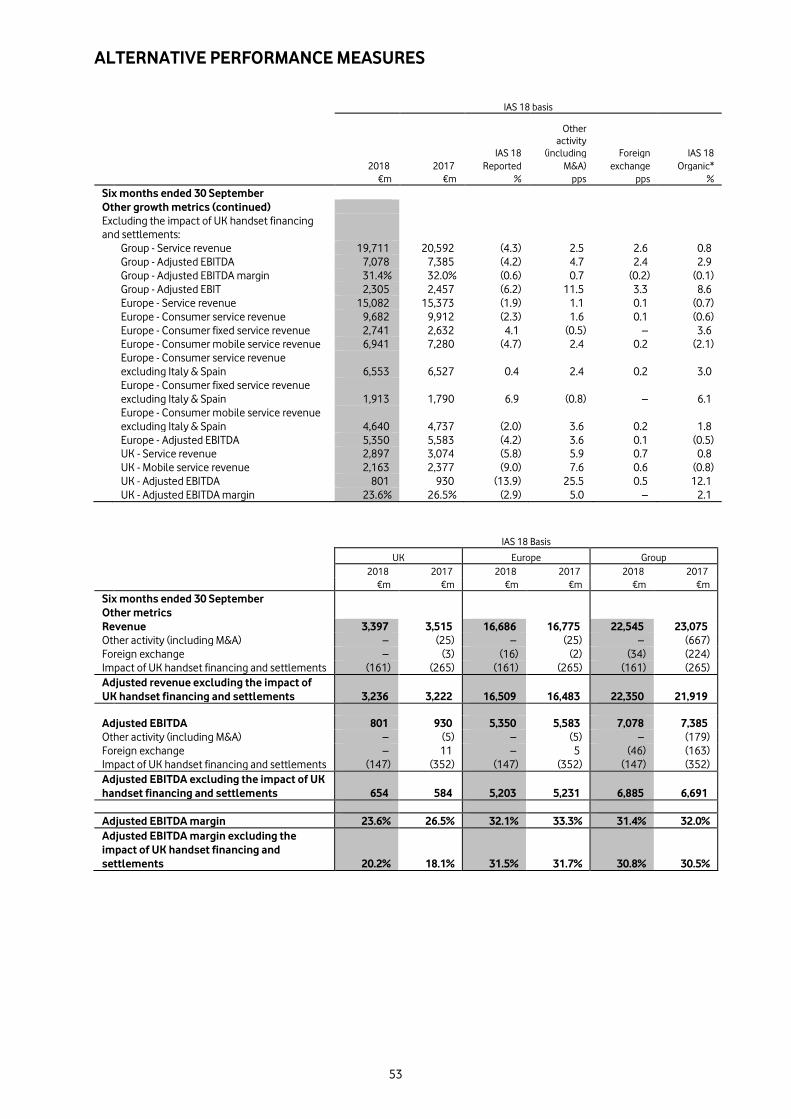
ALTERNATIVE PERFORMANCE MEASURES
53
IAS 18 basis
IAS 18
Other activity
(including Foreign IAS 18 2018 2017 Reported M&A) exchange Organic* €m €m % pps pps % Six months ended 30 September
Other growth metrics (continued)
Excluding the impact of UK handset financing and settlements:
Group - Service revenue 19,711 20,592 (4.3) 2.5 2.6 0.8 Group - Adjusted EBITDA 7,078 7,385 (4.2) 4.7 2.4 2.9 Group - Adjusted EBITDA margin 31.4% 32.0% (0.6) 0.7 (0.2) (0.1) Group - Adjusted EBIT 2,305 2,457 (6.2) 11.5 3.3 8.6 Europe - Service revenue 15,082 15,373 (1.9) 1.1 0.1 (0.7) Europe - Consumer service revenue 9,682 9,912 (2.3) 1.6 0.1 (0.6) Europe - Consumer fixed service revenue 2,741 2,632 4.1 (0.5) – 3.6 Europe - Consumer mobile service revenue 6,941 7,280 (4.7) 2.4 0.2 (2.1)
Europe - Consumer service revenue excluding Italy & Spain 6,553 6,527 0.4 2.4 0.2 3.0
Europe - Consumer fixed service revenue excluding Italy & Spain 1,913 1,790 6.9 (0.8) – 6.1
Europe - Consumer mobile service revenue excluding Italy & Spain 4,640 4,737 (2.0) 3.6 0.2 1.8
Europe - Adjusted EBITDA 5,350 5,583 (4.2) 3.6 0.1 (0.5) UK - Service revenue 2,897 3,074 (5.8) 5.9 0.7 0.8 UK - Mobile service revenue 2,163 2,377 (9.0) 7.6 0.6 (0.8) UK - Adjusted EBITDA 801 930 (13.9) 25.5 0.5 12.1 UK - Adjusted EBITDA margin 23.6% 26.5% (2.9) 5.0 – 2.1
IAS 18 Basis
UK Europe Group 2018 2017 2018 2017 2018 2017 €m €m €m €m €m €m Six months ended 30 September
Other metrics
Revenue 3,397 3,515 16,686 16,775 22,545 23,075 Other activity (including M&A) – (25) – (25) – (667) Foreign exchange – (3) (16) (2) (34) (224) Impact of UK handset financing and settlements (161) (265) (161) (265) (161) (265) Adjusted revenue excluding the impact of UK handset financing and settlements 3,236 3,222 16,509 16,483 22,350 21,919
Adjusted EBITDA 801 930 5,350 5,583 7,078 7,385 Other activity (including M&A) – (5) – (5) – (179) Foreign exchange – 11 – 5 (46) (163) Impact of UK handset financing and settlements (147) (352) (147) (352) (147) (352) Adjusted EBITDA excluding the impact of UK handset financing and settlements 654 584 5,203 5,231 6,885 6,691
Adjusted EBITDA margin 23.6% 26.5% 32.1% 33.3% 31.4% 32.0% Adjusted EBITDA margin excluding the impact of UK handset financing and settlements 20.2% 18.1% 31.5% 31.7% 30.8% 30.5%
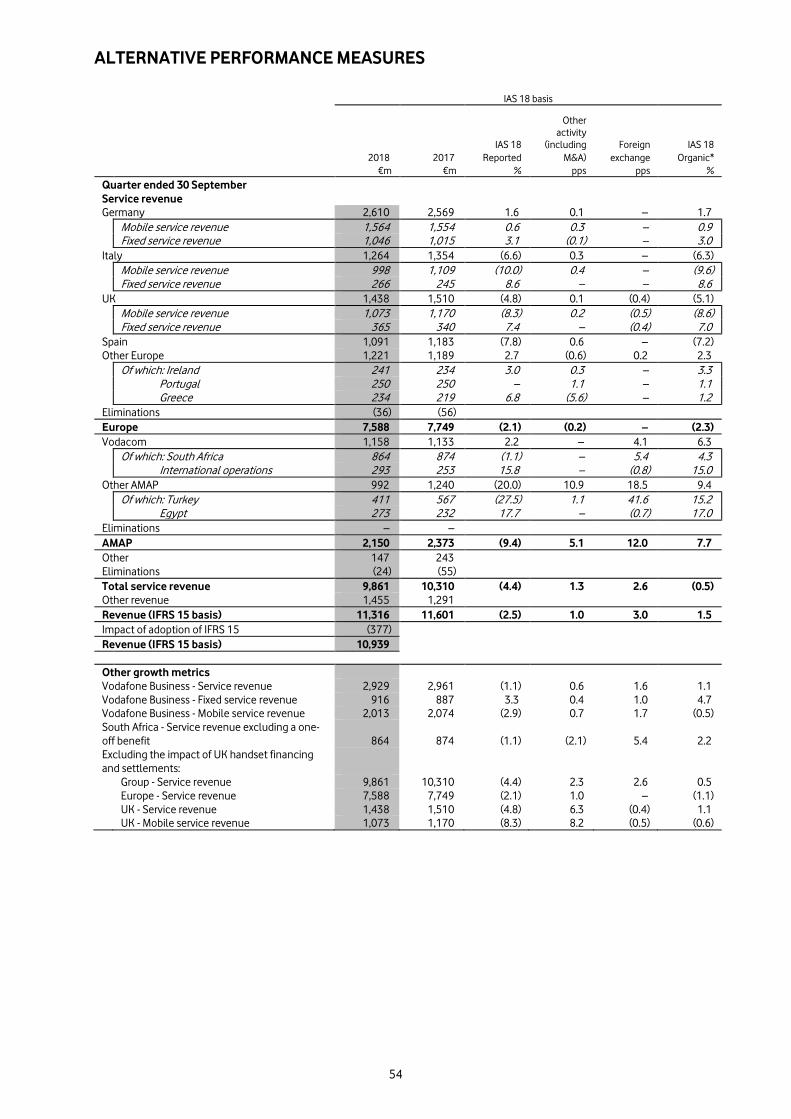
ALTERNATIVE PERFORMANCE MEASURES
54
IAS 18 basis
IAS 18
Other activity
(including Foreign IAS 18 2018 2017 Reported M&A) exchange Organic* €m €m % pps pps % Quarter ended 30 September
Service revenue
Germany 2,610 2,569 1.6 0.1 – 1.7 Mobile service revenue 1,564 1,554 0.6 0.3 – 0.9 Fixed service revenue 1,046 1,015 3.1 (0.1) – 3.0 Italy 1,264 1,354 (6.6) 0.3 – (6.3) Mobile service revenue 998 1,109 (10.0) 0.4 – (9.6) Fixed service revenue 266 245 8.6 – – 8.6 UK 1,438 1,510 (4.8) 0.1 (0.4) (5.1) Mobile service revenue 1,073 1,170 (8.3) 0.2 (0.5) (8.6) Fixed service revenue 365 340 7.4 – (0.4) 7.0 Spain 1,091 1,183 (7.8) 0.6 – (7.2) Other Europe 1,221 1,189 2.7 (0.6) 0.2 2.3 Of which: Ireland 241 234 3.0 0.3 – 3.3 Portugal 250 250 – 1.1 – 1.1 Greece 234 219 6.8 (5.6) – 1.2 Eliminations (36) (56) Europe 7,588 7,749 (2.1) (0.2) – (2.3) Vodacom 1,158 1,133 2.2 – 4.1 6.3 Of which: South Africa 864 874 (1.1) – 5.4 4.3 International operations 293 253 15.8 – (0.8) 15.0 Other AMAP 992 1,240 (20.0) 10.9 18.5 9.4 Of which: Turkey 411 567 (27.5) 1.1 41.6 15.2 Egypt 273 232 17.7 – (0.7) 17.0 Eliminations – – AMAP 2,150 2,373 (9.4) 5.1 12.0 7.7 Other 147 243 Eliminations (24) (55) Total service revenue 9,861 10,310 (4.4) 1.3 2.6 (0.5) Other revenue 1,455 1,291 Revenue (IFRS 15 basis) 11,316 11,601 (2.5) 1.0 3.0 1.5 Impact of adoption of IFRS 15 (377) Revenue (IFRS 15 basis) 10,939
Other growth metrics
Vodafone Business - Service revenue 2,929 2,961 (1.1) 0.6 1.6 1.1 Vodafone Business - Fixed service revenue 916 887 3.3 0.4 1.0 4.7 Vodafone Business - Mobile service revenue 2,013 2,074 (2.9) 0.7 1.7 (0.5) South Africa - Service revenue excluding a one-off benefit 864 874 (1.1) (2.1) 5.4 2.2 Excluding the impact of UK handset financing and settlements:
Group - Service revenue 9,861 10,310 (4.4) 2.3 2.6 0.5 Europe - Service revenue 7,588 7,749 (2.1) 1.0 – (1.1) UK - Service revenue 1,438 1,510 (4.8) 6.3 (0.4) 1.1 UK - Mobile service revenue 1,073 1,170 (8.3) 8.2 (0.5) (0.6)
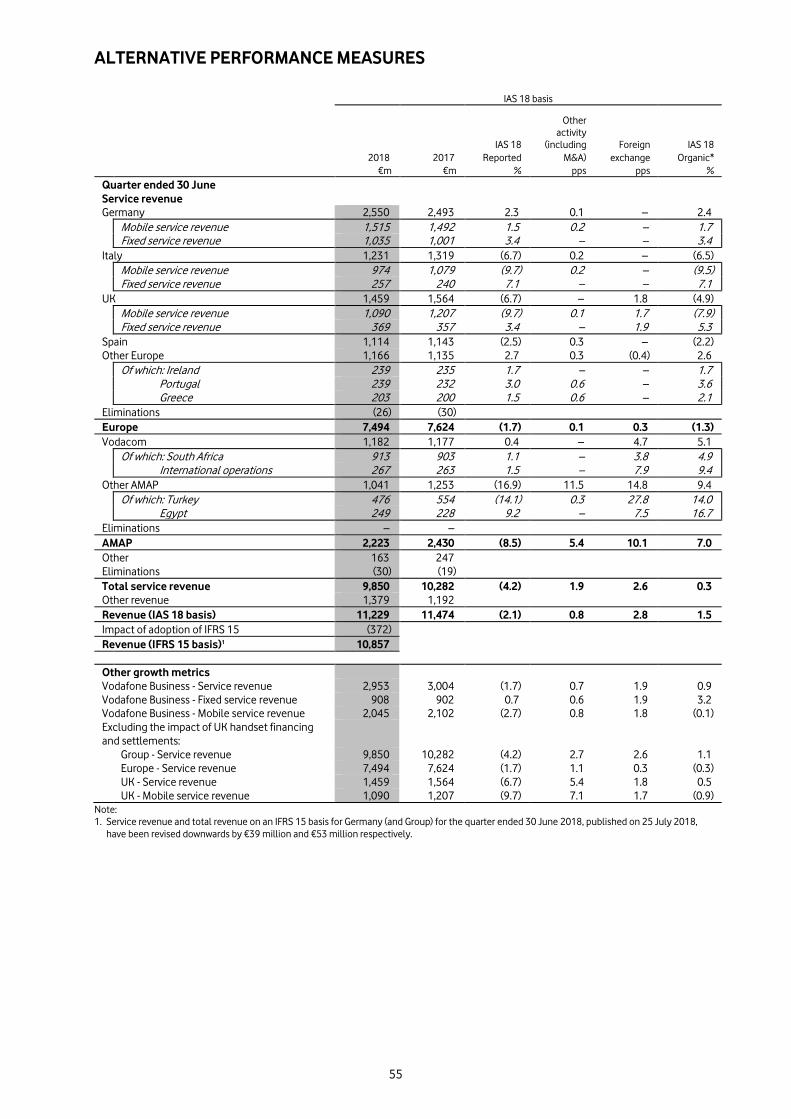
ALTERNATIVE PERFORMANCE MEASURES
55
IAS 18 basis
IAS 18
Other activity
(including Foreign IAS 18 2018 2017 Reported M&A) exchange Organic* €m €m % pps pps % Quarter ended 30 June
Service revenue
Germany 2,550 2,493 2.3 0.1 – 2.4 Mobile service revenue 1,515 1,492 1.5 0.2 – 1.7 Fixed service revenue 1,035 1,001 3.4 – – 3.4 Italy 1,231 1,319 (6.7) 0.2 – (6.5) Mobile service revenue 974 1,079 (9.7) 0.2 – (9.5) Fixed service revenue 257 240 7.1 – – 7.1 UK 1,459 1,564 (6.7) – 1.8 (4.9) Mobile service revenue 1,090 1,207 (9.7) 0.1 1.7 (7.9) Fixed service revenue 369 357 3.4 – 1.9 5.3 Spain 1,114 1,143 (2.5) 0.3 – (2.2) Other Europe 1,166 1,135 2.7 0.3 (0.4) 2.6 Of which: Ireland 239 235 1.7 – – 1.7 Portugal 239 232 3.0 0.6 – 3.6 Greece 203 200 1.5 0.6 – 2.1 Eliminations (26) (30) Europe 7,494 7,624 (1.7) 0.1 0.3 (1.3) Vodacom 1,182 1,177 0.4 – 4.7 5.1 Of which: South Africa 913 903 1.1 – 3.8 4.9 International operations 267 263 1.5 – 7.9 9.4 Other AMAP 1,041 1,253 (16.9) 11.5 14.8 9.4 Of which: Turkey 476 554 (14.1) 0.3 27.8 14.0 Egypt 249 228 9.2 – 7.5 16.7 Eliminations – – AMAP 2,223 2,430 (8.5) 5.4 10.1 7.0 Other 163 247 Eliminations (30) (19) Total service revenue 9,850 10,282 (4.2) 1.9 2.6 0.3 Other revenue 1,379 1,192 Revenue (IAS 18 basis) 11,229 11,474 (2.1) 0.8 2.8 1.5 Impact of adoption of IFRS 15 (372) Revenue (IFRS 15 basis)1 10,857
Other growth metrics
Vodafone Business - Service revenue 2,953 3,004 (1.7) 0.7 1.9 0.9 Vodafone Business - Fixed service revenue 908 902 0.7 0.6 1.9 3.2 Vodafone Business - Mobile service revenue 2,045 2,102 (2.7) 0.8 1.8 (0.1) Excluding the impact of UK handset financing and settlements:
Group - Service revenue 9,850 10,282 (4.2) 2.7 2.6 1.1 Europe - Service revenue 7,494 7,624 (1.7) 1.1 0.3 (0.3) UK - Service revenue 1,459 1,564 (6.7) 5.4 1.8 0.5 UK - Mobile service revenue 1,090 1,207 (9.7) 7.1 1.7 (0.9)
Note: 1. Service revenue and total revenue on an IFRS 15 basis for Germany (and Group) for the quarter ended 30 June 2018, published on 25 July 2018,
have been revised downwards by €39 million and €53 million respectively.
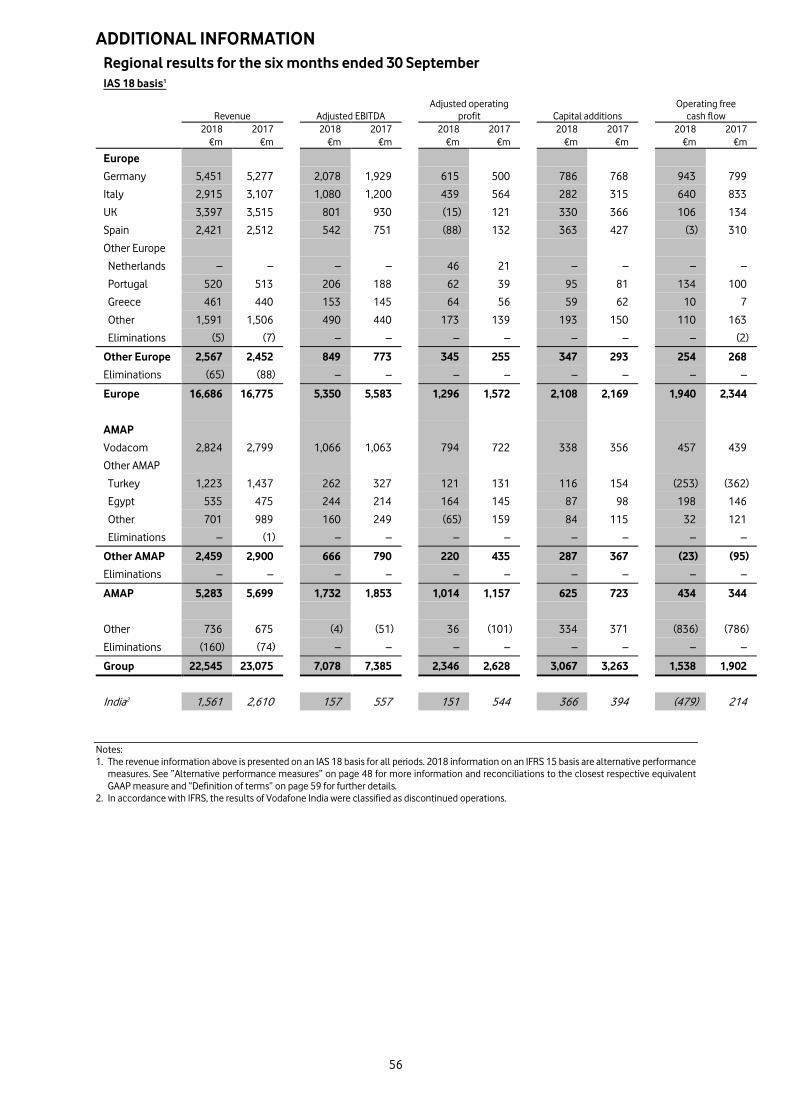
ADDITIONAL INFORMATION
56
Regional results for the six months ended 30 September IAS 18 basis1
Revenue Adjusted EBITDA Adjusted operating
profit Capital additions Operating free
cash flow 2018 2017 2018 2017 2018 2017 2018 2017 2018 2017 €m €m €m €m €m €m €m €m €m €m
Europe
Germany 5,451 5,277 2,078 1,929 615 500 786 768 943 799
Italy 2,915 3,107 1,080 1,200 439 564 282 315 640 833
UK 3,397 3,515 801 930 (15) 121 330 366 106 134
Spain 2,421 2,512 542 751 (88) 132 363 427 (3) 310
Other Europe
Netherlands – – – – 46 21 – – – –
Portugal 520 513 206 188 62 39 95 81 134 100
Greece 461 440 153 145 64 56 59 62 10 7
Other 1,591 1,506 490 440 173 139 193 150 110 163
Eliminations (5) (7) – – – – – – – (2)
Other Europe 2,567 2,452 849 773 345 255 347 293 254 268
Eliminations (65) (88) – – – – – – – –
Europe 16,686 16,775 5,350 5,583 1,296 1,572 2,108 2,169 1,940 2,344
AMAP
Vodacom 2,824 2,799 1,066 1,063 794 722 338 356 457 439
Other AMAP
Turkey 1,223 1,437 262 327 121 131 116 154 (253) (362)
Egypt 535 475 244 214 164 145 87 98 198 146
Other 701 989 160 249 (65) 159 84 115 32 121
Eliminations – (1) – – – – – – – –
Other AMAP 2,459 2,900 666 790 220 435 287 367 (23) (95)
Eliminations – – – – – – – – – –
AMAP 5,283 5,699 1,732 1,853 1,014 1,157 625 723 434 344
Other 736 675 (4) (51) 36 (101) 334 371 (836) (786)
Eliminations (160) (74) – – – – – – – –
Group 22,545 23,075 7,078 7,385 2,346 2,628 3,067 3,263 1,538 1,902
India2 1,561 2,610 157 557 151 544 366 394 (479) 214
Notes: 1. The revenue information above is presented on an IAS 18 basis for all periods. 2018 information on an IFRS 15 basis are alternative performance
measures. See “Alternative performance measures” on page 48 for more information and reconciliations to the closest respective equivalent GAAP measure and “Definition of terms” on page 59 for further details.
2. In accordance with IFRS, the results of Vodafone India were classified as discontinued operations.
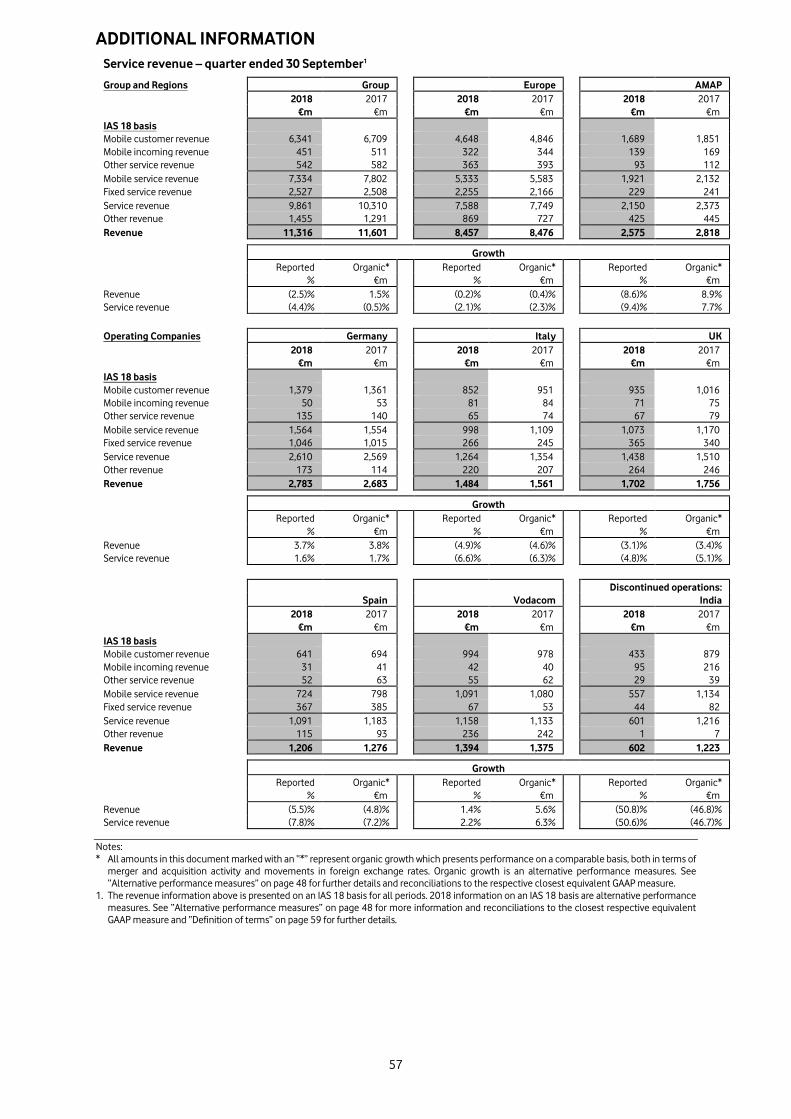
ADDITIONAL INFORMATION
57
Service revenue – quarter ended 30 September1
Group and Regions Group Europe AMAP 2018 2017 2018 2017 2018 2017 €m €m €m €m €m €m IAS 18 basis Mobile customer revenue 6,341 6,709 4,648 4,846 1,689 1,851 Mobile incoming revenue 451 511 322 344 139 169 Other service revenue 542 582 363 393 93 112 Mobile service revenue 7,334 7,802 5,333 5,583 1,921 2,132 Fixed service revenue 2,527 2,508 2,255 2,166 229 241 Service revenue 9,861 10,310 7,588 7,749 2,150 2,373 Other revenue 1,455 1,291 869 727 425 445 Revenue 11,316 11,601 8,457 8,476 2,575 2,818 Growth Reported Organic* Reported Organic* Reported Organic* % €m % €m % €m Revenue (2.5)% 1.5% (0.2)% (0.4)% (8.6)% 8.9% Service revenue (4.4)% (0.5)% (2.1)% (2.3)% (9.4)% 7.7%
Operating Companies Germany Italy UK 2018 2017 2018 2017 2018 2017 €m €m €m €m €m €m IAS 18 basis Mobile customer revenue 1,379 1,361 852 951 935 1,016 Mobile incoming revenue 50 53 81 84 71 75 Other service revenue 135 140 65 74 67 79 Mobile service revenue 1,564 1,554 998 1,109 1,073 1,170 Fixed service revenue 1,046 1,015 266 245 365 340 Service revenue 2,610 2,569 1,264 1,354 1,438 1,510 Other revenue 173 114 220 207 264 246 Revenue 2,783 2,683 1,484 1,561 1,702 1,756 Growth Reported Organic* Reported Organic* Reported Organic* % €m % €m % €m Revenue 3.7% 3.8% (4.9)% (4.6)% (3.1)% (3.4)% Service revenue 1.6% 1.7% (6.6)% (6.3)% (4.8)% (5.1)%
Discontinued operations: Spain Vodacom India 2018 2017 2018 2017 2018 2017 €m €m €m €m €m €m IAS 18 basis Mobile customer revenue 641 694 994 978 433 879 Mobile incoming revenue 31 41 42 40 95 216 Other service revenue 52 63 55 62 29 39 Mobile service revenue 724 798 1,091 1,080 557 1,134 Fixed service revenue 367 385 67 53 44 82 Service revenue 1,091 1,183 1,158 1,133 601 1,216 Other revenue 115 93 236 242 1 7 Revenue 1,206 1,276 1,394 1,375 602 1,223 Growth Reported Organic* Reported Organic* Reported Organic* % €m % €m % €m Revenue (5.5)% (4.8)% 1.4% 5.6% (50.8)% (46.8)% Service revenue (7.8)% (7.2)% 2.2% 6.3% (50.6)% (46.7)%
Notes: * All amounts in this document marked with an “*” represent organic growth which presents performance on a comparable basis, both in terms of
merger and acquisition activity and movements in foreign exchange rates. Organic growth is an alternative performance measures. See “Alternative performance measures” on page 48 for further details and reconciliations to the respective closest equivalent GAAP measure.
1. The revenue information above is presented on an IAS 18 basis for all periods. 2018 information on an IAS 18 basis are alternative performance measures. See “Alternative performance measures” on page 48 for more information and reconciliations to the closest respective equivalent GAAP measure and “Definition of terms” on page 59 for further details.
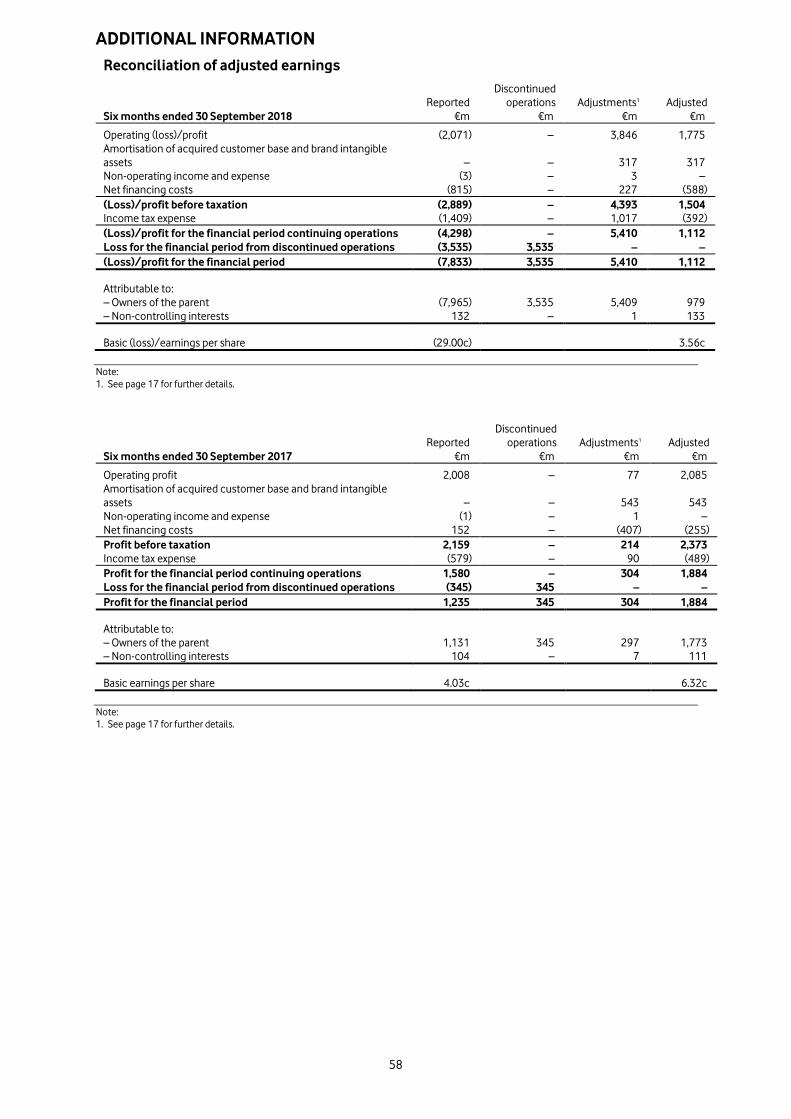
ADDITIONAL INFORMATION
58
Reconciliation of adjusted earnings
Reported
Discontinued operations Adjustments1 Adjusted
Six months ended 30 September 2018 €m €m €m €m Operating (loss)/profit (2,071) – 3,846 1,775 Amortisation of acquired customer base and brand intangible assets – – 317 317 Non-operating income and expense (3) – 3 – Net financing costs (815) – 227 (588) (Loss)/profit before taxation (2,889) – 4,393 1,504 Income tax expense (1,409) – 1,017 (392) (Loss)/profit for the financial period continuing operations (4,298) – 5,410 1,112 Loss for the financial period from discontinued operations (3,535) 3,535 – – (Loss)/profit for the financial period (7,833) 3,535 5,410 1,112
Attributable to:
– Owners of the parent (7,965) 3,535 5,409 979 – Non-controlling interests 132 – 1 133
Basic (loss)/earnings per share (29.00c) 3.56c Note: 1. See page 17 for further details.
Reported
Discontinued operations Adjustments1 Adjusted
Six months ended 30 September 2017 €m €m €m €m Operating profit 2,008 – 77 2,085 Amortisation of acquired customer base and brand intangible assets – – 543 543 Non-operating income and expense (1) – 1 – Net financing costs 152 – (407) (255) Profit before taxation 2,159 – 214 2,373 Income tax expense (579) – 90 (489) Profit for the financial period continuing operations 1,580 – 304 1,884 Loss for the financial period from discontinued operations (345) 345 – – Profit for the financial period 1,235 345 304 1,884
Attributable to:
– Owners of the parent 1,131 345 297 1,773 – Non-controlling interests 104 – 7 111
Basic earnings per share 4.03c 6.32c Note: 1. See page 17 for further details.
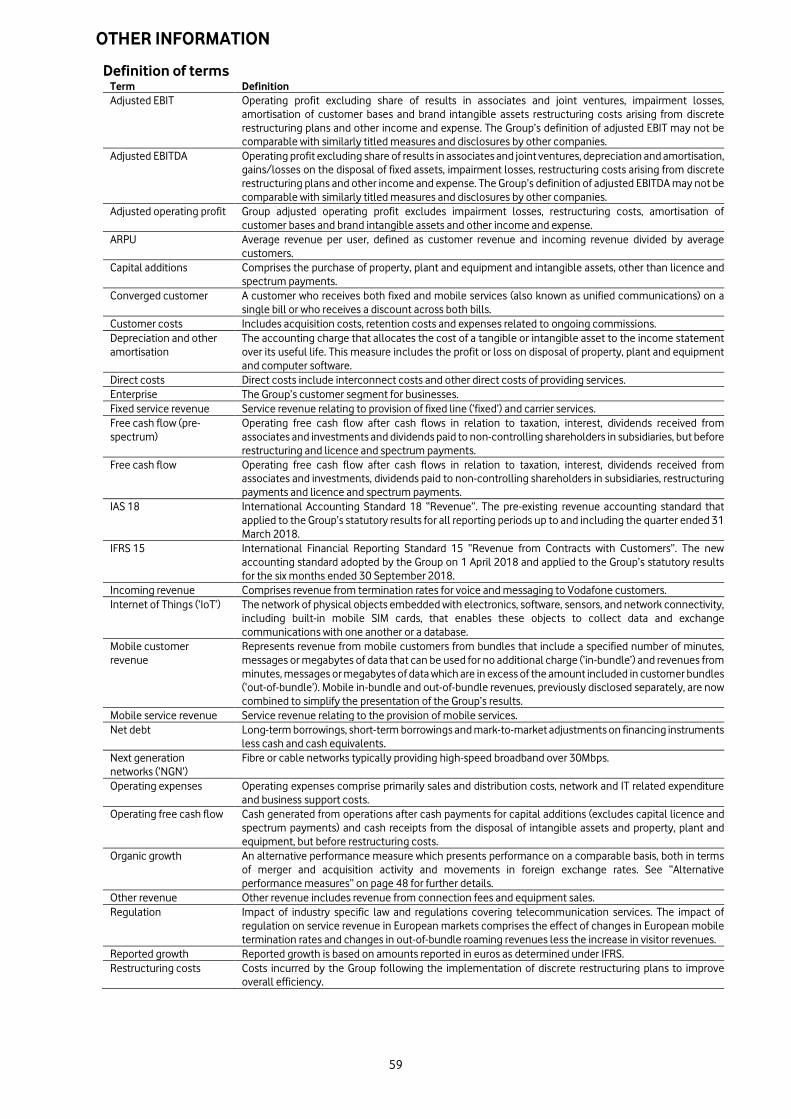
OTHER INFORMATION
59
Definition of terms Term Definition Adjusted EBIT Operating profit excluding share of results in associates and joint ventures, impairment losses,
amortisation of customer bases and brand intangible assets restructuring costs arising from discrete restructuring plans and other income and expense. The Group’s definition of adjusted EBIT may not be comparable with similarly titled measures and disclosures by other companies.
Adjusted EBITDA Operating profit excluding share of results in associates and joint ventures, depreciation and amortisation, gains/losses on the disposal of fixed assets, impairment losses, restructuring costs arising from discrete restructuring plans and other income and expense. The Group’s definition of adjusted EBITDA may not be comparable with similarly titled measures and disclosures by other companies.
Adjusted operating profit Group adjusted operating profit excludes impairment losses, restructuring costs, amortisation of customer bases and brand intangible assets and other income and expense.
ARPU Average revenue per user, defined as customer revenue and incoming revenue divided by average customers.
Capital additions Comprises the purchase of property, plant and equipment and intangible assets, other than licence and spectrum payments.
Converged customer A customer who receives both fixed and mobile services (also known as unified communications) on a single bill or who receives a discount across both bills.
Customer costs Includes acquisition costs, retention costs and expenses related to ongoing commissions. Depreciation and other amortisation
The accounting charge that allocates the cost of a tangible or intangible asset to the income statement over its useful life. This measure includes the profit or loss on disposal of property, plant and equipment and computer software.
Direct costs Direct costs include interconnect costs and other direct costs of providing services. Enterprise The Group’s customer segment for businesses. Fixed service revenue Service revenue relating to provision of fixed line (‘fixed’) and carrier services. Free cash flow (pre-spectrum)
Operating free cash flow after cash flows in relation to taxation, interest, dividends received from associates and investments and dividends paid to non-controlling shareholders in subsidiaries, but before restructuring and licence and spectrum payments.
Free cash flow Operating free cash flow after cash flows in relation to taxation, interest, dividends received from associates and investments, dividends paid to non-controlling shareholders in subsidiaries, restructuring payments and licence and spectrum payments.
IAS 18 International Accounting Standard 18 “Revenue”. The pre-existing revenue accounting standard that applied to the Group’s statutory results for all reporting periods up to and including the quarter ended 31 March 2018.
IFRS 15 International Financial Reporting Standard 15 “Revenue from Contracts with Customers”. The new accounting standard adopted by the Group on 1 April 2018 and applied to the Group’s statutory results for the six months ended 30 September 2018.
Incoming revenue Comprises revenue from termination rates for voice and messaging to Vodafone customers. Internet of Things (‘IoT’) The network of physical objects embedded with electronics, software, sensors, and network connectivity,
including built-in mobile SIM cards, that enables these objects to collect data and exchange communications with one another or a database.
Mobile customer revenue
Represents revenue from mobile customers from bundles that include a specified number of minutes, messages or megabytes of data that can be used for no additional charge (‘in-bundle’) and revenues from minutes, messages or megabytes of data which are in excess of the amount included in customer bundles (‘out-of-bundle’). Mobile in-bundle and out-of-bundle revenues, previously disclosed separately, are now combined to simplify the presentation of the Group’s results.
Mobile service revenue Service revenue relating to the provision of mobile services. Net debt Long-term borrowings, short-term borrowings and mark-to-market adjustments on financing instruments
less cash and cash equivalents. Next generation networks (‘NGN’)
Fibre or cable networks typically providing high-speed broadband over 30Mbps.
Operating expenses Operating expenses comprise primarily sales and distribution costs, network and IT related expenditure and business support costs.
Operating free cash flow Cash generated from operations after cash payments for capital additions (excludes capital licence and spectrum payments) and cash receipts from the disposal of intangible assets and property, plant and equipment, but before restructuring costs.
Organic growth An alternative performance measure which presents performance on a comparable basis, both in terms of merger and acquisition activity and movements in foreign exchange rates. See “Alternative performance measures” on page 48 for further details.
Other revenue Other revenue includes revenue from connection fees and equipment sales. Regulation Impact of industry specific law and regulations covering telecommunication services. The impact of
regulation on service revenue in European markets comprises the effect of changes in European mobile termination rates and changes in out-of-bundle roaming revenues less the increase in visitor revenues.
Reported growth Reported growth is based on amounts reported in euros as determined under IFRS. Restructuring costs Costs incurred by the Group following the implementation of discrete restructuring plans to improve
overall efficiency.
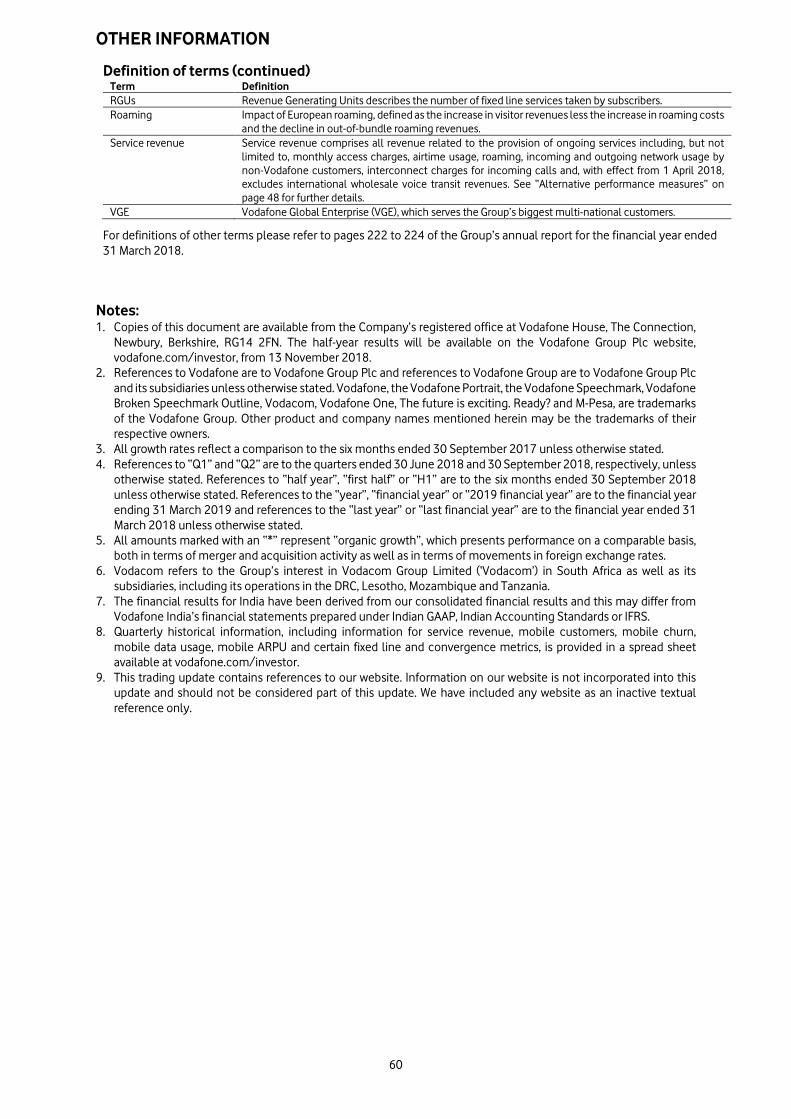
OTHER INFORMATION
60
Definition of terms (continued) Term Definition RGUs Revenue Generating Units describes the number of fixed line services taken by subscribers. Roaming Impact of European roaming, defined as the increase in visitor revenues less the increase in roaming costs
and the decline in out-of-bundle roaming revenues. Service revenue Service revenue comprises all revenue related to the provision of ongoing services including, but not
limited to, monthly access charges, airtime usage, roaming, incoming and outgoing network usage by non-Vodafone customers, interconnect charges for incoming calls and, with effect from 1 April 2018, excludes international wholesale voice transit revenues. See “Alternative performance measures” on page 48 for further details.
VGE Vodafone Global Enterprise (VGE), which serves the Group’s biggest multi-national customers.
For definitions of other terms please refer to pages 222 to 224 of the Group’s annual report for the financial year ended 31 March 2018.
Notes: 1. Copies of this document are available from the Company’s registered office at Vodafone House, The Connection,
Newbury, Berkshire, RG14 2FN. The half-year results will be available on the Vodafone Group Plc website, vodafone.com/investor, from 13 November 2018.
2. References to Vodafone are to Vodafone Group Plc and references to Vodafone Group are to Vodafone Group Plc and its subsidiaries unless otherwise stated. Vodafone, the Vodafone Portrait, the Vodafone Speechmark, Vodafone Broken Speechmark Outline, Vodacom, Vodafone One, The future is exciting. Ready? and M-Pesa, are trademarks of the Vodafone Group. Other product and company names mentioned herein may be the trademarks of their respective owners.
3. All growth rates reflect a comparison to the six months ended 30 September 2017 unless otherwise stated. 4. References to “Q1” and “Q2” are to the quarters ended 30 June 2018 and 30 September 2018, respectively, unless
otherwise stated. References to “half year”, “first half” or “H1” are to the six months ended 30 September 2018 unless otherwise stated. References to the “year”, “financial year” or “2019 financial year” are to the financial year ending 31 March 2019 and references to the “last year” or “last financial year” are to the financial year ended 31 March 2018 unless otherwise stated.
5. All amounts marked with an “*” represent “organic growth”, which presents performance on a comparable basis, both in terms of merger and acquisition activity as well as in terms of movements in foreign exchange rates.
6. Vodacom refers to the Group’s interest in Vodacom Group Limited (‘Vodacom’) in South Africa as well as its subsidiaries, including its operations in the DRC, Lesotho, Mozambique and Tanzania.
7. The financial results for India have been derived from our consolidated financial results and this may differ from Vodafone India’s financial statements prepared under Indian GAAP, Indian Accounting Standards or IFRS.
8. Quarterly historical information, including information for service revenue, mobile customers, mobile churn, mobile data usage, mobile ARPU and certain fixed line and convergence metrics, is provided in a spread sheet available at vodafone.com/investor.
9. This trading update contains references to our website. Information on our website is not incorporated into this update and should not be considered part of this update. We have included any website as an inactive textual reference only.
OTHER INFORMATION
61
Forward-looking statements
This report contains “forward-looking statements” within the meaning of the US Private Securities Litigation Reform Act of 1995 with respect to the Group’s financial condition, results of operations and businesses and certain of the Group’s plans and objectives.
In particular, such forward-looking statements include, but are not limited to, statements with respect to: expectations regarding the Group’s financial condition or results of operations, including the Group Chief Executive’s statement and financial review of the half year on pages 2 to 5 of this report and the guidance for adjusted EBITDA and free cash flow for the 2019 financial year (and the related underlying assumptions) on page 6; expectations for the Group’s future performance generally, including growth, costs and capital expenditure; expectations regarding the operating environment and market conditions and trends, including customer usage and preferences, competitive position and macroeconomic pressures, spectrum auctions and awards, price trends and opportunities in specific geographic markets; intentions and expectations regarding the development, launch and expansion of products, services and technologies, either introduced by Vodafone or by Vodafone in conjunction with third parties or by third parties independently including the rollout of TV in the United Kingdom and 5G; expectations regarding free cash flow, foreign exchange rate movements and tax rates; expectations regarding the regulatory approval, integration or performance of current and future investments, associates, joint ventures, non-controlled interests and newly acquired businesses; expectations regarding MTR rates in the jurisdictions in which Vodafone operates; expectations regarding Vodafone India, the outcome and impact of regulatory and legal proceedings involving Vodafone and of scheduled or potential legislative and regulatory changes, including approvals, reviews and consultations.
Forward-looking statements are sometimes, but not always, identified by their use of a date in the future or such words as “will”, “anticipates”, “aims”, “could”, “may”, “should”, “expects”, “believes”, “intends”, “plans”, “prepares” or “targets” (including in their negative form or other variations). By their nature, forward-looking statements are inherently predictive, speculative and involve risk and uncertainty because they relate to events and depend on circumstances that may or may not occur in the future. There are a number of factors that could cause actual results and developments to differ materially from those expressed or implied by these forward-looking statements. These factors include, but are not limited to, the following: external cyber-attacks, insider threats or supplier breaches; general economic and political conditions of the jurisdictions in which the Group operates and changes to the associated legal, regulatory and tax environments; increased competition; increased disintermediation; levels of investment in network capacity and the Group’s ability to deploy new technologies, products and services; rapid changes to existing products and services and the inability of new products and services to perform in accordance with expectations; the ability of the Group to integrate new technologies, products and services with existing networks, technologies, products and services; the Group’s ability to generate and grow revenue; a lower than expected impact of new or existing products, services or technologies on the Group’s future revenue, cost structure and capital expenditure outlays; slower than expected customer growth, reduced customer retention, reductions or changes in customer spending and increased pricing pressure; the Group’s ability to expand its spectrum position, win 3G and 4G allocations and realise expected synergies and benefits associated with 3G and 4G; the Group’s ability to secure the timely delivery of high-quality products from suppliers; loss of suppliers, disruption of supply chains and greater than anticipated prices of new mobile handsets; changes in the costs to the Group of, or the rates the Group my charge for, terminations and roaming minutes; the impact of a failure or significant interruption to the Group’s telecommunications, networks, IT systems or data protection systems; the Group’s ability to realise expected benefits from acquisitions, partnerships, joint ventures, franchises, brand licences, platform sharing or other arrangements with third parties; acquisitions and divestments of Group businesses and assets and the pursuit of new, unexpected strategic opportunities; the Group’s ability to integrate acquired business or assets; the extent of any future write-downs or impairment charges on the Group’s assets, or restructuring charges incurred as a result of an acquisition or disposition; a developments in the Group’s financial condition, earnings and distributable funds and other factors that the Board takes into account in determining the level of dividends; the Group’s ability to satisfy working capital requirements; changes in foreign exchange rates; changes in the regulatory framework in which the Group operates; the impact of legal or other proceedings against the Group or other companies in the communications industry and changes in statutory tax rates and profit mix. Furthermore, a review of the reasons why actual results and developments may differ materially from the expectations disclosed or implied within forward-looking statements can be found under “Forward-looking statements” and “Principal risk factors and uncertainties” in the Group’s annual report for the financial year ended 31 March 2018. The annual report can be found on the Group’s website (vodafone.com/investor). All subsequent written or oral forward-looking statements attributable to the Company or any member of the Group or any persons acting on their behalf are expressly qualified in their entirety by the factors referred to above. No assurances can be given that the forward-looking statements in this document will be realised. Subject to compliance with applicable law and regulations, Vodafone does not intend to update these forward-looking statements and does not undertake any obligation to do so.
For further information: Vodafone Group Plc Investor Relations Media Relations Telephone: +44 7919 990 230 www.vodafone.com/media/contact Copyright © Vodafone Group 2018
-ends-