news & analysisweb1.amchouston.com/flexshare/001/cfa/moody's/mc… · · 2016-03-09news...
TRANSCRIPT

MOODYS.COM
10 MARCH 2016
NEWS & ANALYSIS Corporates 2 » Couche-Tard Will Increase Leverage Acquiring Esso Sites » Topaz Extends BP Contract for 14 Vessels, a Credit Positive » China Railway Construction Will Benefit from China’s
Railway Spending » Korea’s Spectrum Auctions Will Raise Leverage for
Mobile Operators
Infrastructure 7 » Exelon and Pepco File Their Third Request for Merger Approval,
a Credit Positive » Vivint’s Termination of Merger with SunEdison Is Credit
Positive for TerraForm Power Operating » Transport for London’s Loss of UK Government Operating
Grants Is Credit Negative
Banks 11 » Uganda’s High Lending Rates Will Hurt Banks’ Asset Quality » Australian Regulator Alleges that ANZ Manipulated Market, a
Credit Negative » Lower Milk Prices Are Credit Negative for New Zealand Banks
US Public Finance 16 » New Jersey Retains Ability to Cut Pension Contributions,
a Credit Positive
RECENTLY IN CREDIT OUTLOOK
» Articles in Last Monday’s Credit Outlook 18 » Go to Last Monday’s Credit Outlook
Click here for Weekly Market Outlook, our sister publication containing Moody’s Analytics’ review of market activity, financial predictions, and the dates of upcoming economic releases.

NEWS & ANALYSIS Credit implications of current events
2 MOODY’S CREDIT OUTLOOK 10 MARCH 2016
Corporates
Couche-Tard Will Increase Leverage Acquiring Esso Sites On Tuesday, Alimentation Couche-Tard Inc. (Baa2 stable) said that it will pay about CAD1.7 billion to acquire 279 Esso convenience stores and gas stations in Ontario and Quebec from Imperial Oil Limited, which is majority-owned by Exxon Mobil Corporation (Aaa negative). The acquisition is credit negative because it will increase Couche-Tard’s pro forma leverage (adjusted debt/EBITDA) to 2.5x from 2.1x as of the last 12 months to 11 October 2015, according to our estimate of a 27% increase in debt and an 8% increase in EBITDA.
Couche-Tard, an operator of more than 10,000 convenience stores (including fuel stations) in North America (under the Circle K brand) and Scandinavia, did not disclose any details on EBITDA for the assets. However, we expect it to be around CAD170-CAD220 million, assuming a 7.5x-10.0x multiple, which is where most of the company’s acquisitions have been.
Using the mid-point of the EBITDA range, we expect Couche-Tard’s last-12-months adjusted EBITDA as of 11 October 2015 to increase to $2.6 billion. Couche-Tard will fund the acquisition with a combination of cash on hand and available under its $2.525 billion revolving credit facility. We assume the debt component will be CAD1.1-CAD1.4 billion. Incorporating the incremental debt and our standard adjustments for underfunded pension and operating leases, we expect Couche-Tard’s total adjusted debt to increase to $6.6 billion. As a result, leverage rises to 2.5x from 2.1x as of the last 12 months to 11 October 2015. Our debt and EBITDA numbers also include our estimate of the contribution from the 1 February acquisition of Topaz Energy Group Ltd., Ireland’s largest convenience and fuel retailer, for which the parties did not disclose the purchase price.
Couche-Tard has capacity to generate annual free cash flow in excess of $1 billion. The company’s demonstrated ability to repay debt from free cash flow is an indication that deleveraging from this transaction will happen quickly. We expect leverage to decline toward 2x within 12-18 months, which will create a cushion again in the rating to support another slightly leverage-increasing acquisition.
Peter Adu, CFA Assistant Vice President - Analyst +1.416.214.3060 [email protected]
This publication does not announce a credit rating action. For any credit ratings referenced in this publication, please see the ratings tab on the issuer/entity page on www.moodys.com for the most updated credit rating action information and rating history.

NEWS & ANALYSIS Credit implications of current events
3 MOODY’S CREDIT OUTLOOK 10 MARCH 2016
Topaz Extends BP Contract for 14 Vessels, a Credit Positive Last Thursday, Topaz Energy and Marine Limited (B2 review for downgrade) said that it had signed a long-term contract with BP Exploration (Caspian Sea) Limited, a unit of BP p.l.c. (A2 review for downgrade), to supply 14 offshore support vessels in Azerbaijan. The agreement extends existing contracts for the vessels until 2023, including all options.
The contract is credit positive for Topaz because it will generate significant revenues and increase its contract backlog at a time when the oilfield services industry is under severe pressure owing to a prolonged period of low oil prices. The deal also reflects Topaz’s leading market position in the Caspian Sea and its ability to maintain relationships with key customers, such as BP, with strong balance sheets that are able to withstand low oil prices.
Under the terms of the deal, Topaz will supply the vessels for five years, with BP having the option of two one-year extensions, primarily to support of BP’s ACG and Shah Deniz II fields off the coast of Azerbaijan. Although Topaz did not release details regarding the value of the contract in its statement, it did state that these contracts bring its global revenue backlog to $1.4 billion.
Based on the geographical split of the company’s revenues, we estimate that these contracts account for more than half of the backlog (i.e., more than $700 million) and will provide Topaz with 25%-35% of its revenues over the next five years, extending to seven years if the options are exercised. Although we expect the day rates in the new contract to be lower than in the previous contract, the deal will provide Topaz with better revenue and cash flow predictability during a period of low oil prices in which day rates and utilisation rates in the oilfield services industry have been declining.
The new contract also reflects Topaz’s healthy business profile and competitive advantage as the market leader in the Caspian Sea, where barriers to entry are high because of the logistical challenges in reaching the area. During Topaz’s operational history, which spans more than 20 years, the company has built up strong relationships with some of the major national oil companies and international oil companies, such as BP. This is an important factor in the current challenging operating environment given that international and national oil companies have strong balance sheets and are better able to withstand low oil prices than their smaller counterparts.
Topaz’s B2 corporate family rating, its B2 probability of default rating and the B3 rating on its $350 million senior unsecured notes remain on review for downgrade because of much weaker industry fundamentals, including weak oil prices. We expect reductions in capital expenditures and operating expenses by independent exploration and production and integrated oil companies to hurt utilisation and day rates, which will negatively affect the cash flows of oilfield services companies. Although we expect Topaz’s revenues to decrease by more than 10% in 2016, EBITDA is likely to remain flat over the same period, reflecting the company’s ability to cut costs and maintain its leverage and interest coverage metrics.
Julien Haddad Analyst +971.4.237.9539 [email protected]

NEWS & ANALYSIS Credit implications of current events
4 MOODY’S CREDIT OUTLOOK 10 MARCH 2016
China Railway Construction Will Benefit from China’s Railway Spending On 5 March, at the Fourth Session of the 12th National People’s Congress, Chinese Premier Li Keqiang announced that the Government of China (Aa3 negative) will invest more than RMB800 billion on railway infrastructure development this year. The Chinese government’s plan to continue spending strongly on railway construction in 2016 is credit positive for China Railway Construction Corporation Limited (CRCC, A3 negative).
CRCC will be the main beneficiary of the government’s plan to continue spending heavily on railway infrastructure development owing to its dominant position in the domestic railway construction industry. We estimate that CRCC has a 45%-50% market share of China’s railway construction industry and is effectively part of a duopoly. Revenue from railway construction accounts for about 45% of CRCC’s construction segment revenue. The construction segment contributed about 87% of CRCC’s total revenue of RMB518 billion for the 12 months that ended 30 June 2015. China’s other major railway construction company is China Railway Group Limited (unrated), which we estimate has a market share similar to CRCC’s.
The planned investment on railway infrastructure in 2016 is similar to the RMB824 billion spent in 2015 and RMB809 billion spent in 2014, but significantly higher than the RMB666 billion in 2013, RMB634 billion in 2012 and RMB591 billion in 2011 (see exhibit below).
China’s Railway Spending
Sources: The National Railway Administration of the People’s Republic of China and Wind Information Company, Ltd.
We expect CRCC to grow its revenue by mid-single-digit percentages per year over the next 12-18 months, given its large order backlog of RMB1.761 trillion at the end of June 2015, constituting around three years of revenue. Also aiding revenue growth is our expectation that spending in China on railway construction and infrastructure development, including roadways and bridges, will continue in 2016 and 2017. We also expect CRCC’s adjusted EBITDA margin to remain stable over the next 12-18 months, driven by its extended service offerings and continued cost controls.
CRCC will keep its investments in real estate and build-transfer and build-operate-transfer projects to manageable levels, limiting increases in debt over the next two years. Therefore, we expect CRCC’s adjusted debt/EBITDA to improve slightly to around 5.0x over the next 12-18 months from 5.1x for the 12 months ended 30 June 2015.
CRCC is one of the world’s largest integrated construction companies. The company mainly focuses on railway, highway, urban rail transit and housing construction.
591 634 666
809 824 800
0
100
200
300
400
500
600
700
800
900
2011 2012 2013 2014 2015 2016E
RMB
Billi
ons
Chenyi Lu Vice President - Senior Analyst +852.3758.1353 [email protected]
Tina Xu Associate Analyst +852.3758.1431 [email protected]

NEWS & ANALYSIS Credit implications of current events
5 MOODY’S CREDIT OUTLOOK 10 MARCH 2016
Korea’s Spectrum Auctions Will Raise Leverage for Mobile Operators Last Friday, Korea’s Ministry of Science, ICT and Future Planning (MSIP) released details of spectrum auctions scheduled for April, with the total minimum bid for all spectrum blocks exceeding KRW2.5 trillion. Although only 25% of the payment will be due upfront, and the remaining 75% will be paid annually over license periods of five or 10 years, successful bids by Korea’s three mobile operators, SK Telecom Co. Ltd. (SKT, A3 stable), KT Corporation (Baa1 stable) and LG Uplus (unrated), would be credit negative because leverage would increase.
Although the minimum bidding price totals KRW2.6 trillion for the 140-megahertz bandwidth available according to MSIP’s final draft (see exhibit), the final price paid could exceed KRW3.0 trillion. By comparison, Korea’s three mobile operators paid a total of KRW2.5 trillion for the 90-megahertz bandwidth auctioned in 2013.
Korean Spectrum Blocks Up for Auction in April
Blocks Spectrum (frequency) Bandwidth Period of Use Minimum Bid KRW Billions
A 700 megahertz 40 megahertz 10 years KRW762
B 1.8 gigahertz 20 megahertz 10 years 451
C 2.1 gigahertz 20 megahertz 5 years 382
D 2.6 gigahertz 40 megahertz 10 years 655
E 2.6 gigahertz 20 megahertz 10 years 328
Total 140 megahertz KRW2,578
Source: Korea’s Ministry of Science, ICT and Future Planning
We estimate that SKT’s and KT’s adjusted debt/EBITDA will increase by 0.1x-0.2x if, for instance, they pay KRW1 trillion for new spectrum. This would add pressure to SKT’s A3 rating, given the limited financial headroom remaining at its current rating.
Following a KRW500 billion share buyback in 2015 related to its acquisition of SK Broadband Co. Ltd. (unrated), SKT’s adjusted debt/EBITDA rose to around 1.9x at the end of 2015 from 1.7x at the end of 2014. Leverage of 1.9x positions the company at the weaker end of our quantitative guidance for the A3 rating category (up to 2x leverage). We expect SKT’s financial leverage to remain around 1.9x this year without the new spectrum payment and after factoring in an upcoming investment of around KRW700 billion in CJ Hellovision Co. Ltd (unrated), Korea’s largest cable TV and second-largest pay TV operator. With new spectrum obligations, leverage will increase further.
KT is better positioned to absorb the effect of higher leverage on its Baa1 rating. The company reduced its leverage to around 2.2x in 2015 from 2.4x in 2014 following last year’s sale of KT Rental Co., Ltd. (unrated) and KT Capital Co., Ltd. (unrated).
Among the spectrum blocks being auctioned, the 20-megahertz block in the 2.1-gigahertz band is of most interest to the three operators, and bidding could significantly exceed the minimum of KRW382 billion. This bandwidth will allow the winner to operate a long-term evolution (LTE) network at double the speed of the existing ones. SKT currently has 60 megahertz, KT 40 megahertz, and LG Uplus 20 megahertz in the 2.1-gigahertz band, which is used for LTE services and for which additional bandwidth acquisition would not require new investments to existing infrastructure. These existing blocks will expire in December 2016, but can be renewed by the existing license holders. The exception is the 20-megahertz block owned by SKT and which is the same one that will be auctioned in April.
Gloria Tsuen, CFA Vice President - Senior Analyst +852.3758.1583 [email protected]
Chris Wong, CFA Associate Analyst +852.3758.1531 [email protected]

NEWS & ANALYSIS Credit implications of current events
6 MOODY’S CREDIT OUTLOOK 10 MARCH 2016
At the 2013 auctions, SKT acquired a new 15-megahertz block in the 1.8-gigahertz band for KRW461 billion. KT bought a 15-megahertz block in the 1.8-gigahertz band for KRW900 billion, while LG Uplus bought 40 megahertz in the 2.6-gigahertz band for KRW479 billion.

NEWS & ANALYSIS Credit implications of current events
7 MOODY’S CREDIT OUTLOOK 10 MARCH 2016
Infrastructure
Exelon and Pepco File Their Third Request for Merger Approval, a Credit Positive On Monday, Exelon Corporation (Baa2 stable) and Pepco Holdings, Inc. (PHI, Baa3 developing) filed with the District of Columbia Public Service Commission (DC PSC) asking approval of a merger that was originally announced in April 2014. We think this filing marks one of the last and best attempts by Exelon and PHI to salvage their merger deal.
Completing the merger would be credit positive for Exelon because PHI brings $8 billion of additional rate base to Exelon’s existing $20 billion, and the service territories are contiguous. But if the merger is terminated, the credit effect to Exelon would not be material.
For PHI, completion of the merger would be credit positive because the company has been operating in limbo for the past two years as it worked to complete the deal. A merger termination would bring a new set of financial and liquidity stress to PHI, which has roughly $1.7 billion of holding company debt, most of which is short term. Failure to accomplish the merger would likely result in a series of measures, including potentially a material dividend reduction, deferrals of capital investment and other painful cost-cutting efforts.
We think PHI’s financial condition has weakened over the past two years, primarily because the transmission and distribution utility subsidiaries stayed away from regulatory proceedings and PHI continued to finance its common stock dividend with parent holding company debt. In the 8-K filed Monday, PHI said it had suspended its dividend for now, which will result in almost $70 million in savings. But more importantly, the 8-K said that PHI will start requesting rate relief in its various jurisdictions (Maryland, New Jersey and Delaware).
Exelon asked the DC PSC to approve the merger by 7 April by utilizing one of three alternatives: reconsider the commission’s 26 February rejection of the merger agreement; approve the transaction under the terms proposed by the DC PSC on 26 February without support from other settling parties; or adjust the DC PSC’s proposal to ensure customer rate credits and grid modernization investments.
The merger agreement between Exelon and PHI expired on 4 March, so both companies are free to walk away from the deal at any time. We think the DC PSC will agree to the proposed timeline and approve the transaction under one of the three options, and with or without unanimous approval of the prior settling parties. But we have been surprised twice previously, and it is possible that the merger is ultimately terminated. If that happens, we think delays in any decision will push Exelon to terminate the deal given the ongoing financing drag on the company, which included the sale of assets and the issuance of both debt and equity, in anticipation of the transaction.
Jim Hempstead Associate Managing Director +1.212.553.4318 [email protected]

NEWS & ANALYSIS Credit implications of current events
8 MOODY’S CREDIT OUTLOOK 10 MARCH 2016
Vivint’s Termination of Merger with SunEdison Is Credit Positive for TerraForm Power Operating On Tuesday, rooftop solar panel installer Vivint Solar, Inc. (unrated) said that it had terminated an agreement under which it would have been taken over by renewable energy company SunEdison Inc. (unrated), citing SunEdison’s failure to consummate the merger. The termination is credit positive for SunEdison subsidiary TerraForm Power Operating, LLC (TERP, B3 negative) because it will leave the company with lower leverage levels. TERP would have been required to contribute $700 million, all debt-financed, as part of the transaction. More importantly, TERP is no longer obligated to raise capital to buy 400-450 megawatts of rooftop solar systems from Vivint every year for the next five years.
The cash-and-stock deal, worth $2.2 billion when announced in July 2015, faced significant opposition from investors at both SunEdison and its yieldco subsidiaries, TERP and TerraForm Global Operating, LLC (GLBL, B3 negative), because of the risks of the rooftop solar business and the magnitude of the capital requirements at SunEdison, TERP and GLBL. Vivint was to have been one of several multi-billion-dollar acquisitions by SunEdison, TERP and GLBL as the companies have sought to grow rapidly from a North America-focused solar developer into a global developer of wind, solar and rooftop systems.
SunEdison has struggled to maintain access to the capital markets as the fortunes of the entire yieldco sector have dipped amid turmoil in the commodity and high-yield capital markets since third-quarter 2015. Investors today question the sustainability of the business models of many yieldcos. SunEdison’s stock price is down 90% since the Vivint merger announcement, while TERP’s is down 70%. Additionally, we have downgraded TERP and GLBL, largely because of the risks related to SunEdison.
Significant questions about SunEdison’s solvency remain. The company has about $200 million in interest payments and approximately $600 million in general and administrative expenses for 2016. We estimate that dividends from its yieldco subsidiaries and cash flow from its services business will provide $150-$200 million. Absent cuts in general and administrative expenses, the remainder must be covered by profits from the sale of projects developed by SunEdison, something that is proving challenging as the capital markets lose confidence in the company.
On 17 February, Hawaiian Electric Company, Inc. (Baa1 negative) terminated power purchase agreements with three of SunEdison’s solar projects in Hawaii citing SunEdison’s inability to raise financing for the projects. Questions about SunEdison’s solvency intensified earlier this month when the company announced that it was delaying its 10-K filing because of certain ongoing internal investigations “concerning the accuracy of the company’s anticipated financial position.” The company added that an outcome of the investigation could be that “management may be required to reassess the company’s liquidity position.”
We will not change TERP’s or GLBL’s rating or outlook until we have more clarity about SunEdison’s solvency and its ongoing business strategy. Both TERP and GLBL exhibit stronger intrinsic credit quality than SunEdison because their cash flows are stable, underpinned by long-term contracts with creditworthy counterparties. However, our rating incorporates a low, but not negligible, probability that either or both yieldcos may eventually end up in bankruptcy in the event of a SunEdison bankruptcy.
The merger deal had a drop-dead date of 18 March 2016, and Vivint said that SunEdison’s failure to consummate constituted “a willful breach of the merger agreement.” Vivint added that it intended to “seek all legal remedies available to it in respect of such willful breach.”
Swami Venkataraman, CFA Vice President - Senior Credit Officer +1.212.553.7950 [email protected]

NEWS & ANALYSIS Credit implications of current events
9 MOODY’S CREDIT OUTLOOK 10 MARCH 2016
Transport for London’s Loss of UK Government Operating Grants Is Credit Negative On 2 March, Transport for London (TfL, Aa2 stable) received its government funding agreement for the fiscal years ending 31 March 2017-21 from the secretary of state for transport. The agreement terminates operating funding from the UK government (Aa1 stable) to TfL starting in fiscal 2019, three years earlier than TfL had expected. This is credit negative for TfL because it will lose its most predictable and stable operating revenue source and creates a funding gap for its operations. Alternatives available to fill the budget gap, namely additional fare revenues and increased commercial activity, are directly affected by population, economic and market trends, which would increase those risks to TfL’s credit profile.
Government grants are TfL’s most predictable and least economically sensitive revenue and made up 13% of operating revenues for fiscal 2015. These have historically come in multi-year agreements not directly affected by the state of the economy, giving TfL certainty as to the funding. However, the complete loss of the government operating grant has come sooner than the fiscal 2022 cut-off that TfL had originally expected. As the exhibit below shows, lower government operating grants create a significant revenue gap for TfL in each of the next four years, with a cumulative loss of £2.9 billion by the end of fiscal 2021.
Transport for London’s New Funding Agreement with the UK Government Creates a Revenue Gap Starting in 2017
Notes: Business rates are Transport for London’s share of business tax raised by the Greater London Authority. An agreement is in place for Transport for London’s share to increase with the retail price index. Sources: Transport for London 2014 business plan, 2015 accounts and March 2016 funding agreement
We expect that there will be pressure to raise fares to replace some of the lost income, but consider a reliance on higher fare revenue in forward planning to be a risk owing to uncertainty about population growth and London’s economic growth, which influence fare revenue growth. TfL’s 2014 business plan (its most recent multi-year plan covering fiscal years 2015 to 2021) already expects population growth of 4%. Although London’s population has grown 14% over the past five years, continued strong growth is threatened by the possibility of the UK leaving the European Union (EU), a referendum on which is scheduled for 23 June 2016. Current estimates are that there are 1 million European nationals living in London, or approximately 12% of the population, whose legal status and ability to remain would be uncertain if the UK were to vote to leave the EU.
An exit of the UK from the EU would also create uncertainty around the economy. Included in the 2014 business plan are fare increases of the retail prices index plus 1% annually. Commuters are unlikely to be able to afford fare growth that outstrips inflation, particularly given that TfL riders already pay for a high share (61%) of operating costs in their ticket price.
£0
£2
£4
£6
£8
£10
2015 2016 2017 2018 2019 2020 2021
£ Bi
llion
s
Fare Revenues Other RevenueBusiness Rates Revenue GrantGrant Not Included in Funding Letter 2014 Business Plan Projected Revenues
Elizabeth Bergman Vice President - Senior Analyst +44.20.7772.8774 [email protected]

NEWS & ANALYSIS Credit implications of current events
10 MOODY’S CREDIT OUTLOOK 10 MARCH 2016
We expect an increased move toward commercial activities to be a critical part of the plan to make up for lost revenues, introducing market risk into the credit profile. The 2014 business plan projects raising about £3.5 billion in revenues from commercial strategies, including residential property development, over the next 10 years. Although this would diversify revenues, it moves them away from predictable revenues from the UK sovereign toward riskier sources, adding risk to TfL’s credit profile.
NEWS & ANALYSIS Credit implications of current events
11 MOODY’S CREDIT OUTLOOK 10 MARCH 2016
Banks
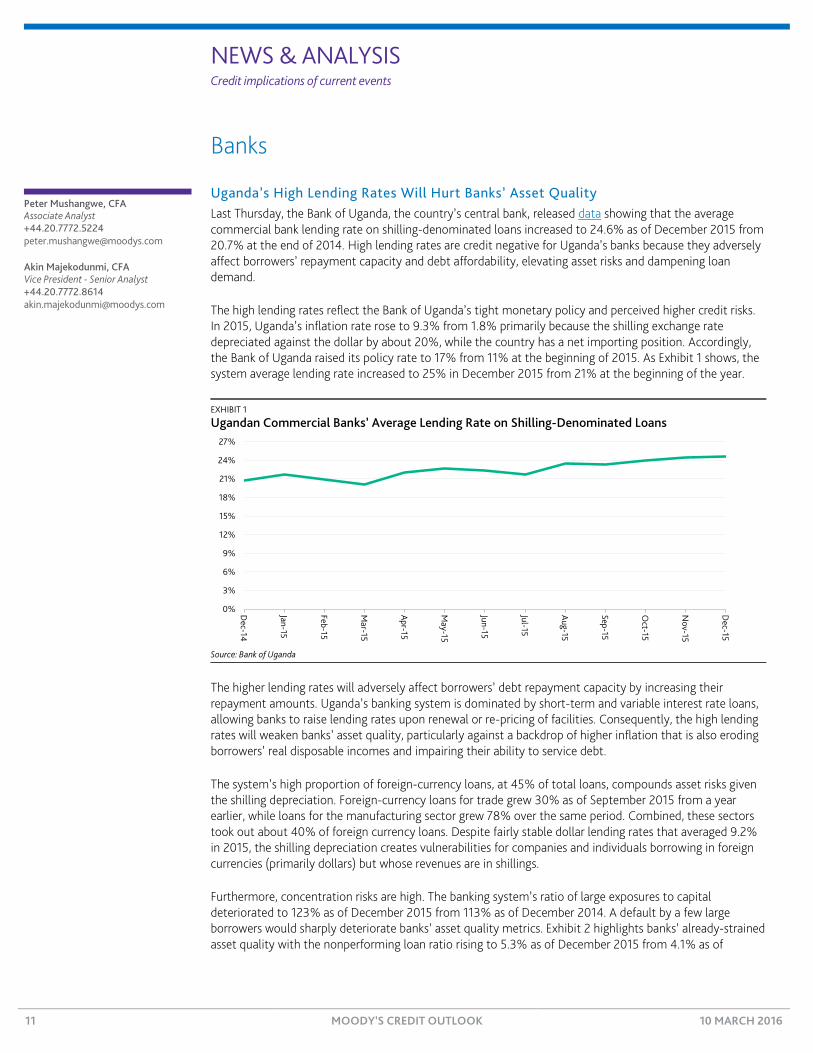
Uganda’s High Lending Rates Will Hurt Banks’ Asset Quality Last Thursday, the Bank of Uganda, the country’s central bank, released data showing that the average commercial bank lending rate on shilling-denominated loans increased to 24.6% as of December 2015 from 20.7% at the end of 2014. High lending rates are credit negative for Uganda’s banks because they adversely affect borrowers’ repayment capacity and debt affordability, elevating asset risks and dampening loan demand.
The high lending rates reflect the Bank of Uganda’s tight monetary policy and perceived higher credit risks. In 2015, Uganda’s inflation rate rose to 9.3% from 1.8% primarily because the shilling exchange rate depreciated against the dollar by about 20%, while the country has a net importing position. Accordingly, the Bank of Uganda raised its policy rate to 17% from 11% at the beginning of 2015. As Exhibit 1 shows, the system average lending rate increased to 25% in December 2015 from 21% at the beginning of the year.
EXHIBIT 1
Ugandan Commercial Banks’ Average Lending Rate on Shilling-Denominated Loans
Source: Bank of Uganda
The higher lending rates will adversely affect borrowers’ debt repayment capacity by increasing their repayment amounts. Uganda’s banking system is dominated by short-term and variable interest rate loans, allowing banks to raise lending rates upon renewal or re-pricing of facilities. Consequently, the high lending rates will weaken banks’ asset quality, particularly against a backdrop of higher inflation that is also eroding borrowers’ real disposable incomes and impairing their ability to service debt.
The system’s high proportion of foreign-currency loans, at 45% of total loans, compounds asset risks given the shilling depreciation. Foreign-currency loans for trade grew 30% as of September 2015 from a year earlier, while loans for the manufacturing sector grew 78% over the same period. Combined, these sectors took out about 40% of foreign currency loans. Despite fairly stable dollar lending rates that averaged 9.2% in 2015, the shilling depreciation creates vulnerabilities for companies and individuals borrowing in foreign currencies (primarily dollars) but whose revenues are in shillings.
Furthermore, concentration risks are high. The banking system’s ratio of large exposures to capital deteriorated to 123% as of December 2015 from 113% as of December 2014. A default by a few large borrowers would sharply deteriorate banks’ asset quality metrics. Exhibit 2 highlights banks’ already-strained asset quality with the nonperforming loan ratio rising to 5.3% as of December 2015 from 4.1% as of
0%
3%
6%
9%
12%
15%
18%
21%
24%
27%
Dec-14
Jan-15
Feb-15
Mar-15
Apr-15
May-15
Jun-15
Jul-15
Aug-15
Sep-15
Oct-15
Nov-15
Dec-15
Peter Mushangwe, CFA Associate Analyst +44.20.7772.5224 [email protected]
Akin Majekodunmi, CFA Vice President - Senior Analyst +44.20.7772.8614 [email protected]

NEWS & ANALYSIS Credit implications of current events
12 MOODY’S CREDIT OUTLOOK 10 MARCH 2016
December 2014, despite banks’ substantial write-offs. Between January and June 2015, banks cumulatively wrote off about 61% of their nonperforming loans.
EXHIBIT 2
Ugandan Banks’ Ratio of Nonperforming Loans to Total Gross Loans
Source: Bank of Uganda
Banks’ higher lending rates, combined with the shilling depreciation, will also harm loan growth because they negatively affect debt affordability, restraining loan demand. Already, loan growth has slowed substantially since September 2015. As Exhibit 3 shows, yearly total loan growth (in shillings) slowed to 13.5% in January 2016 from 25.3% in September 2015. Local currency yearly loan growth fell to 9.2% in January 2016 from 15.2% in September 2015, while foreign currency loans, in constant currency, declined over the same period. At these high lending rates, we expect pressure on shilling-denominated loan demand to persist, ultimately suppressing banks’ income.
EXHIBIT 3
Ugandan Banks’ Yearly Loans and Advances Growth Rates
Source: Bank of Uganda
On the flip side, higher lending rates do support banks’ net interest margins, with government bills’ high yields also boosting banks’ interest income to a meaningful extent. The system net interest margin rose to 11.3% as of the end of 2015 from 11.0% as of December 2014. However, we expect higher problem loans and credit losses to offset this benefit.
4.1% 4.2%4.0% 3.9%
5.3%
0%
1%
2%
3%
4%
5%
6%
4Q2014 1Q2015 2Q2015 3Q2015 4Q2015
-6%
-3%
0%
3%
6%
9%
12%
15%
18%
21%
24%
27%
Jun-15 Jul-15 Aug-15 Sep-15 Oct-15 Nov-15 Dec-15 Jan-16
Foreign Currency Loans (Constant Currency) Local Currency Loans Total Loans in Local Currency

NEWS & ANALYSIS Credit implications of current events
13 MOODY’S CREDIT OUTLOOK 10 MARCH 2016
Australian Regulator Alleges that ANZ Manipulated Market, a Credit Negative Last Friday, the Australian Securities & Investments Commission (ASIC), Australia’s corporate, markets and financial services regulator, began legal proceedings against Australia and New Zealand Banking Group Limited (ANZ, Aa2/Aa2 stable, a11) for unconscionable conduct and market manipulation in connection with ANZ’s involvement in setting the bank bill swap reference rate (BBSW) between March 2010 and May 2012.
The legal proceedings and allegations are credit negative for ANZ because they could lead to reputational damage and punitive settlements. Should the allegations be proven in a court of law, it is unlikely that the punitive damages themselves would create significant financial strain for ANZ. However, the costs associated with any mandated remedial actions and the costs resulting from reputational issues could be meaningful. Additionally, if proven, the charges threaten to leave the bank exposed to potential class-action lawsuits whose damages could be significant.
The BBSW is the primary interest rate benchmark used in Australian financial markets, and is administered by the Australian Financial Markets Association. ASIC alleges that ANZ traded in a manner aimed at creating an artificial price for bank bills on certain days when it had a large number of products priced or valued off the BBSW, with the intention of moving the BBSW rate in order to maximise profit or minimise losses. The ASIC’s investigation into BBSW rate-setting is ongoing and the conduct of other rate-setting banks is likely to come under further scrutiny, potentially broadening the scope of the legal action.
ANZ has rejected the allegations and stated that it will defend itself against the ASIC’s legal action. ANZ also stated that its practices in the BBSW market were consistent with Australian market practices in the wholesale financial markets and that the ASIC has made no allegations with respect to collusion between ANZ and other institutions.
ASIC has investigated multiple financial institutions to assess whether there has been benchmark-related misconduct in Australia’s financial markets. In 2013 and 2014, ASIC accepted legally binding agreements from UBS AG (Aa3/A1 stable, baa1), BNP Paribas (A1/A1 stable, baa1), the Royal Bank of Scotland plc (A3/A3 positive, ba1) and the Royal Bank of Scotland N.V. (A3/A3 positive, ba1) after these institutions reported to ASIC that they had found evidence of conduct that sought to influence the BBSW rate to benefit their derivatives positions.
As part of the legally binding agreements, the institutions were required to take remedial measures to enhance their compliance and internal control frameworks, including publishing new procedural manuals, physically and structurally separating staff and enhancing monitoring and exceptions reporting. In addition, the firms made voluntary monetary contributions of AUD1.0-AUD1.6 million to financial literacy programs.
1 The bank ratings shown in this report are the banks’ deposit rating, senior unsecured rating and baseline credit assessment.
Frank Mirenzi Vice President - Senior Analyst +61.2.9270.8176 [email protected]

NEWS & ANALYSIS Credit implications of current events
14 MOODY’S CREDIT OUTLOOK 10 MARCH 2016
Lower Milk Prices Are Credit Negative for New Zealand Banks On Tuesday, New Zealand-based Fonterra (unrated), the world’s second-largest milk processor, forecast that its milk payout for the current season ending in May 2016 would be NZD3.90 per kilogram of milk solids, down from its previous forecast of NZD4.15 and well below the opening forecast of NZD5.25 at the start of the season. The decline is credit negative for New Zealand banks because a lower payout reduces the income that farmers receive, thereby threatening the asset quality of banks exposed to the dairy sector.
As Exhibit 1 shows, ANZ Bank New Zealand Limited (Aa3/Aa3 stable, a32), ASB Bank Limited (Aa3/Aa3 stable, a3) and Bank of New Zealand (Aa3/Aa3 stable, a3) are the most exposed to New Zealand’s agricultural sector among New Zealand’s five largest banks, and dairy loans comprised an average of around 70% of the five banks’ total agricultural loans as of September 2015. The other two banks are Westpac New Zealand Limited (Aa3/Aa3 stable, a3) and Kiwibank Limited (Aa3 stable, baa2).
EXHIBIT 1
New Zealand Banks’ Exposure to the Agricultural Sector Agriculture as a percent of total credit exposure including all financial assets.
Bank Exposure
Bank of New Zealand 15%
ASB Bank 11%
ANZ Bank New Zealand 11%
Westpac New Zealand 8%
Kiwibank 0%
Sources: The banks
A deterioration in the asset quality of dairy loans would have a material effect on the banks. As Exhibit 2 shows, New Zealand’s agricultural exposures comprised the second-largest sector concentration in bank loan portfolios as of January 2016, after housing loans. When the dairy payout last dropped sharply in 2009, banks’ agriculture nonperforming loan ratios (NPLs), which include impaired loans and loans 90 days past due, spiked to 3.92% of total loans at September 2010 from 0.20% at September 2008 (see Exhibit 3). Moreover, a weakened dairy sector risks having a meaningful second-order negative effect on New Zealand’s economy.
2 The bank ratings shown in this report are the banks’ local currency deposit rating, senior unsecured rating (where available) and
baseline credit assessment.
Daniel Yu Vice President - Senior Analyst +61.2.9270.8198 [email protected]

NEWS & ANALYSIS Credit implications of current events
15 MOODY’S CREDIT OUTLOOK 10 MARCH 2016
EXHIBIT 2
New Zealand Banks’ Total Loan Portfolio as of January 2016
Source: Reserve Bank of New Zealand
EXHIBIT 3
Fonterra’s Milk Price versus New Zealand Agricultural Nonperforming Loan Ratio
Note: The agricultural nonperforming loan ratio is as of 30 September of each year. Sources: Reserve Bank of New Zealand and Fonterra
Despite the sharp drop in the milk price in the 2015 season, agricultural NPLs have remained relatively stable (see Exhibit 3). A key supporting factor has been that farmers knew well in advance that 2015 prices would be lower than 2014 levels, allowing them to manage down expenses and defer any significant capital expenditures.
That said, we expect the asset quality of those banks with dairy exposures to come under pressure as farmers face a second consecutive season of low dairy prices and are likely to have less capacity to reduce expenses further. Indeed there are signs of emerging stress: in its first-quarter 2016 trading update, National Australia Bank Limited (Aa2/Aa2 stable, a1), the Australian parent of Bank of New Zealand, announced its NPL ratio rose to 0.68% at December 2015 from 0.63% at September 2015 owing to the inclusion of a number of dairy exposures as impaired but with no loss currently expected.
Declining milk prices are a result of demand and supply factors. Slower economic growth in China, a major export market for New Zealand’s milk producers, has weakened demand. Meanwhile, European production remains strong, while Russian import restrictions have closed a major market to milk producers in the European Union, adding to the global milk glut.
Agriculture14%
Forestry and Fishing1%
Mining, Electricity, Gas1%
Manufacturing3% Construction
1%
Trade3%
Accommodation and Transport2%Finance and Insurance
5%Property and Business8%
Government, Education, Health2%
Household - Housing52%
Household - Consumer3%
Other5%
0.0%
0.5%
1.0%
1.5%
2.0%
2.5%
3.0%
3.5%
4.0%
4.5%
0
1
2
3
4
5
6
7
8
9
2008 2009 2010 2011 2012 2013 2014 2015 F2016
NZD
per
Kilo
gram
of M
ilk S
olid
s
Fonterra Milk Price - left axis Agriculture NPL Ratio - right axis

NEWS & ANALYSIS Credit implications of current events
16 MOODY’S CREDIT OUTLOOK 10 MARCH 2016
US Public Finance
New Jersey Retains Ability to Cut Pension Contributions, a Credit Positive On 29 February, the US Supreme Court declined to hear an appeal by New Jersey (A2 negative) labor groups that had challenged the state’s authority to cut pension contributions. The high court’s denial is credit positive for New Jersey because the state retains the ability to annually determine its pension contributions. Additionally, the ruling allows the state to avoid a budget gap of approximately 5% of its revenues for the fiscal year ending 30 June 2016 that would have materialized if it had been ordered to contribute at a higher level than previously envisioned.
The Supreme Court’s decision not to hear the appeal provides finality to a series of court decisions over New Jersey’s pension contributions, locking in a decision by the state supreme court. The state’s 2011 reforms, called Chapter 78, included a suspension of cost-of-living adjustments and a schedule of annually increasing state contributions to bolster plan funding. After contributing at the new schedule for two years, the state responded to a budget gap by reducing pension contributions in fiscal 2014 and 2015, prompting a legal challenge from labor groups.
The state’s fiscal 2013 contribution amounted to two sevenths of the annual required contribution (ARC), but its contributions in fiscal 2014 and 2015 did not amount to three sevenths and four sevenths of the ARC, respectively, as the 2011 reform legislation specified. The state’s $1.3 billion fiscal 2016 contribution fell more than $3 billion short of five sevenths of the ARC, creating a gap that would amount to more than 5% of the budget if the state were forced by court order to make up the difference.
By overturning a lower court in June 2015, the New Jersey Supreme Court supported the state legislature’s ability to unilaterally determine its annual pension contributions, regardless of its previously stated intent. The state now intends to contribute in increments that increase annually by one tenth of the ARC rather than one seventh.
Despite the benefit of near-term flexibility, New Jersey’s annual contribution shortfalls under its assumptions are akin to borrowing for operations at the 7.9% rate of pension investment return it expects. The state’s ARC shortfalls amounted to approximately 10% of the fiscal 2015 budget and 9% of the fiscal 2016 budget, creating a large source of structural imbalance.
Contribution shortfalls have also been a driver of growing unfunded liabilities. For example, the state’s contributions to its largest plan, the Teachers’ Pension and Annuity Fund (TPAF), have at most been 57% of the statutory requirement every year since 2005, and in some years the state contributed nothing. Meanwhile, reported unfunded liabilities for TPAF increased by 96% to $26 billion in 2014 from $13 billion in 2005 (see exhibit).
Tom Aaron Assistant Vice President - Analyst +1.312.706.9967 [email protected]

NEWS & ANALYSIS Credit implications of current events
17 MOODY’S CREDIT OUTLOOK 10 MARCH 2016
New Jersey’s Contributions for Teacher Pensions Relative to Statutory Requirements and Reported Unfunded Liabilities, Fiscal 2005-15 Contribution shortfalls are a primary driver of New Jersey’s growing unfunded liabilities.
Source: Teachers’ Pension and Annuity Fund, 30 June 2014 actuarial valuation
According to our last survey of state pension obligations, which covered fiscal 2014 and incorporated all of the state’s pension plans, New Jersey’s $85 billion Moody’s-adjusted net pension liability amounted to 162% of its revenues, the fourth highest among the 50 states.
The US Supreme Court’s ruling comes as another significant pension case looms for New Jersey. A state appellate court decided that New Jersey does not have the legal authority to suspend cost-of-living adjustments for pensions, while a lower court previously found the action permissible. The state supreme court will hear arguments in the case beginning 14 March. We estimate that unfunded pension liabilities could grow by nearly 30% if the state loses that case.
0%
10%
20%
30%
40%
50%
60%
$0
$5
$10
$15
$20
$25
$30
2005 2006 2007 2008 2009 2010 2011 2012 2013 2014 2015
$ Bi
llion
s
Unfunded Liabilities Percent of Statutory Contribution Paid - right axis

RECENTLY IN CREDIT OUTLOOK Select any article below to go to last Monday’s Credit Outlook on moodys.com
18 MOODY’S CREDIT OUTLOOK 10 MARCH 2016
NEWS & ANALYSIS Corporates 2
» McKesson's Rexall Acquisition Will Raise Leverage
» Cott's Equity Offering Is Credit Positive
» AMC's Credit-Positive Acquisition of Carmike Creates World's Largest Theatre Chain
» GameStop’s Store Acquisitions Are Credit Positive Despite Raising Debt
» Ceridian HCM's Joint Venture with WorkAngel Is Credit Negative
» NMLK Will Benefit from US Import Duties on Steel
» Polsat's Acquisition of Midas Will Enhance Its Spectrum and Operating Cost Control, a Credit Positive
» Evergrande's Shengjing Bank Investment Is Credit Negative
Infrastructure 11
» NRG's Dividend Reduction Is Credit Positive
» Republic Airways' Bankruptcy Is Credit Negative for Airports It Serves
» Australian Utilities' Successful Appeal of Regulator's Rate Determination Is Credit Positive
Banks 16
» Russians' Declining Income Is Credit Negative for Banks Concentrated in Consumer Loans
» Kazakhstan Banks' Deposit Dollarization Hits Record High, a Credit Negative
» Mauritius' Proposal to Introduce Deposit Insurance Is Credit Positive for Banks
» Malaysian Banks' Improved Capitalization Is Credit Positive Amid Regional Credit Risks
» Philippines’ New Liquidity Requirement Is Credit Positive for Banks
Exchanges 26
» Pursuit of LSEG Raises Event Risk at US Exchanges
Funds 28
» Icahn Enterprises' Fourth-Quarter Losses Reduce Liquidity and Raise Leverage
Sovereigns 31
» Turkey's Trade Data Reveals Export Weakness, a Credit Negative
» Namibia’s Budget Introduces Spending Cuts Amid Falling Revenues, a Credit Positive
» Japan's Budget Underscores Credit-Positive Fiscal Goals but Realization Will Be Challenging
Securitization 37
» AT&T’s Wireless Internet Video Launch Is Credit Positive for Tower Firms and Their Securitizations
RATINGS & RESEARCH Rating Changes 39
Last week, we downgraded Intelsat, Oi, Woolworths, BankMuscat, Oman Arab Bank, National Bank of Oman, Bank Dhofar, HSBC Bank Oman, Monticello Insurance, Walter Investment Management, North West Redwater and Terra-Gen Finance. We upgraded Armor Holdco and Central Nottinghamshire Hospitals. Additionally, we upgraded two classes and downgraded three classes in J.P. Morgan Chase Commercial Mortgage Securities Corporation, Series 2006-CIBC17.
Research Highlights 45
Last week, we published reports on FAGE International, Asian steel producers, US Foods, US medical products and devices, Canadian broadband, US oil and gas industry liquidity, Macy’s, US steel, US for-profit hospitals, North American unregulated power and project finance, Credit Suisse, UBS, Air Castle, Fly Leasing, BNDES, Caixa, Banco do Brasil, Polish banks, Malaysian banks, India, US RMBS, US CMBS, US marketplace lending ABS, US REITs, Spanish consumer ABS, Australian covered bonds, Australian auto ABS and RMBS, Volkswagen European ABS, Japanese SME CLOs, European RMBS and ABS, and Russian mortgage laws, among other publications.

MOODYS.COM
Report: 188259
© 2016 Moody’s Corporation, Moody’s Investors Service, Inc., Moody’s Analytics, Inc. and/or their licensors and affiliates (collectively, “MOODY’S”). All rights reserved.
CREDIT RATINGS ISSUED BY MOODY'S INVESTORS SERVICE, INC. AND ITS RATINGS AFFILIATES (“MIS”) ARE MOODY’S CURRENT OPINIONS OF THE RELATIVE FUTURE CREDIT RISK OF ENTITIES, CREDIT COMMITMENTS, OR DEBT OR DEBT-LIKE SECURITIES, AND CREDIT RATINGS AND RESEARCH PUBLICATIONS PUBLISHED BY MOODY’S (“MOODY’S PUBLICATIONS”) MAY INCLUDE MOODY’S CURRENT OPINIONS OF THE RELATIVE FUTURE CREDIT RISK OF ENTITIES, CREDIT COMMITMENTS, OR DEBT OR DEBT-LIKE SECURITIES. MOODY’S DEFINES CREDIT RISK AS THE RISK THAT AN ENTITY MAY NOT MEET ITS CONTRACTUAL, FINANCIAL OBLIGATIONS AS THEY COME DUE AND ANY ESTIMATED FINANCIAL LOSS IN THE EVENT OF DEFAULT. CREDIT RATINGS DO NOT ADDRESS ANY OTHER RISK, INCLUDING BUT NOT LIMITED TO: LIQUIDITY RISK, MARKET VALUE RISK, OR PRICE VOLATILITY. CREDIT RATINGS AND MOODY’S OPINIONS INCLUDED IN MOODY’S PUBLICATIONS ARE NOT STATEMENTS OF CURRENT OR HISTORICAL FACT. MOODY’S PUBLICATIONS MAY ALSO INCLUDE QUANTITATIVE MODEL-BASED ESTIMATES OF CREDIT RISK AND RELATED OPINIONS OR COMMENTARY PUBLISHED BY MOODY’S ANALYTICS, INC. CREDIT RATINGS AND MOODY’S PUBLICATIONS DO NOT CONSTITUTE OR PROVIDE INVESTMENT OR FINANCIAL ADVICE, AND CREDIT RATINGS AND MOODY’S PUBLICATIONS ARE NOT AND DO NOT PROVIDE RECOMMENDATIONS TO PURCHASE, SELL, OR HOLD PARTICULAR SECURITIES. NEITHER CREDIT RATINGS NOR MOODY’S PUBLICATIONS COMMENT ON THE SUITABILITY OF AN INVESTMENT FOR ANY PARTICULAR INVESTOR. MOODY’S ISSUES ITS CREDIT RATINGS AND PUBLISHES MOODY’S PUBLICATIONS WITH THE EXPECTATION AND UNDERSTANDING THAT EACH INVESTOR WILL, WITH DUE CARE, MAKE ITS OWN STUDY AND EVALUATION OF EACH SECURITY THAT IS UNDER CONSIDERATION FOR PURCHASE, HOLDING, OR SALE.
MOODY’S CREDIT RATINGS AND MOODY’S PUBLICATIONS ARE NOT INTENDED FOR USE BY RETAIL INVESTORS AND IT WOULD BE RECKLESS AND INAPPROPRIATE FOR RETAIL INVESTORS TO USE MOODY’S CREDIT RATINGS OR MOODY’S PUBLICATIONS WHEN MAKING AN INVESTMENT DECISION. IF IN DOUBT YOU SHOULD CONTACT YOUR FINANCIAL OR OTHER PROFESSIONAL ADVISER.
ALL INFORMATION CONTAINED HEREIN IS PROTECTED BY LAW, INCLUDING BUT NOT LIMITED TO, COPYRIGHT LAW, AND NONE OF SUCH INFORMATION MAY BE COPIED OR OTHERWISE REPRODUCED, REPACKAGED, FURTHER TRANSMITTED, TRANSFERRED, DISSEMINATED, REDISTRIBUTED OR RESOLD, OR STORED FOR SUBSEQUENT USE FOR ANY SUCH PURPOSE, IN WHOLE OR IN PART, IN ANY FORM OR MANNER OR BY ANY MEANS WHATSOEVER, BY ANY PERSON WITHOUT MOODY’S PRIOR WRITTEN CONSENT.
All information contained herein is obtained by MOODY’S from sources believed by it to be accurate and reliable. Because of the possibility of human or mechanical error as well as other factors, however, all information contained herein is provided “AS IS” without warranty of any kind. MOODY'S adopts all necessary measures so that the information it uses in assigning a credit rating is of sufficient quality and from sources MOODY'S considers to be reliable including, when appropriate, independent third-party sources. However, MOODY’S is not an auditor and cannot in every instance independently verify or validate information received in the rating process or in preparing the Moody’s Publications.
To the extent permitted by law, MOODY’S and its directors, officers, employees, agents, representatives, licensors and suppliers disclaim liability to any person or entity for any indirect, special, consequential, or incidental losses or damages whatsoever arising from or in connection with the information contained herein or the use of or inability to use any such information, even if MOODY’S or any of its directors, officers, employees, agents, representatives, licensors or suppliers is advised in advance of the possibility of such losses or damages, including but not limited to: (a) any loss of present or prospective profits or (b) any loss or damage arising where the relevant financial instrument is not the subject of a particular credit rating assigned by MOODY’S.
To the extent permitted by law, MOODY’S and its directors, officers, employees, agents, representatives, licensors and suppliers disclaim liability for any direct or compensatory losses or damages caused to any person or entity, including but not limited to by any negligence (but excluding fraud, willful misconduct or any other type of liability that, for the avoidance of doubt, by law cannot be excluded) on the part of, or any contingency within or beyond the control of, MOODY’S or any of its directors, officers, employees, agents, representatives, licensors or suppliers, arising from or in connection with the information contained herein or the use of or inability to use any such information.
NO WARRANTY, EXPRESS OR IMPLIED, AS TO THE ACCURACY, TIMELINESS, COMPLETENESS, MERCHANTABILITY OR FITNESS FOR ANY PARTICULAR PURPOSE OF ANY SUCH RATING OR OTHER OPINION OR INFORMATION IS GIVEN OR MADE BY MOODY’S IN ANY FORM OR MANNER WHATSOEVER.
Moody’s Investors Service, Inc., a wholly-owned credit rating agency subsidiary of Moody’s Corporation (“MCO”), hereby discloses that most issuers of debt securities (including corporate and municipal bonds, debentures, notes and commercial paper) and preferred stock rated by Moody’s Investors Service, Inc. have, prior to assignment of any rating, agreed to pay to Moody’s Investors Service, Inc. for appraisal and rating services rendered by it fees ranging from $1,500 to approximately $2,500,000. MCO and MIS also maintain policies and procedures to address the independence of MIS’s ratings and rating processes. Information regarding certain affiliations that may exist between directors of MCO and rated entities, and between entities who hold ratings from MIS and have also publicly reported to the SEC an ownership interest in MCO of more than 5%, is posted annually at www.moodys.com under the heading “Investor Relations — Corporate Governance — Director and Shareholder Affiliation Policy.”
Additional terms for Australia only: Any publication into Australia of this document is pursuant to the Australian Financial Services License of MOODY’S affiliate, Moody’s Investors Service Pty Limited ABN 61 003 399 657AFSL 336969 and/or Moody’s Analytics Australia Pty Ltd ABN 94 105 136 972 AFSL 383569 (as applicable). This document is intended to be provided only to “wholesale clients” within the meaning of section 761G of the Corporations Act 2001. By continuing to access this document from within Australia, you represent to MOODY’S that you are, or are accessing the document as a representative of, a “wholesale client” and that neither you nor the entity you represent will directly or indirectly disseminate this document or its contents to “retail clients” within the meaning of section 761G of the Corporations Act 2001. MOODY’S credit rating is an opinion as to the creditworthiness of a debt obligation of the issuer, not on the equity securities of the issuer or any form of security that is available to retail investors. It would be reckless and inappropriate for retail investors to use MOODY’S credit ratings or publications when making an investment decision. If in doubt you should contact your financial or other professional adviser.
Additional terms for Japan only: Moody's Japan K.K. (“MJKK”) is a wholly-owned credit rating agency subsidiary of Moody's Group Japan G.K., which is wholly-owned by Moody’s Overseas Holdings Inc., a wholly-owned subsidiary of MCO. Moody’s SF Japan K.K. (“MSFJ”) is a wholly-owned credit rating agency subsidiary of MJKK. MSFJ is not a Nationally Recognized Statistical Rating Organization (“NRSRO”). Therefore, credit ratings assigned by MSFJ are Non-NRSRO Credit Ratings. Non-NRSRO Credit Ratings are assigned by an entity that is not a NRSRO and, consequently, the rated obligation will not qualify for certain types of treatment under U.S. laws. MJKK and MSFJ are credit rating agencies registered with the Japan Financial Services Agency and their registration numbers are FSA Commissioner (Ratings) No. 2 and 3 respectively.
MJKK or MSFJ (as applicable) hereby disclose that most issuers of debt securities (including corporate and municipal bonds, debentures, notes and commercial paper) and preferred stock rated by MJKK or MSFJ (as applicable) have, prior to assignment of any rating, agreed to pay to MJKK or MSFJ (as applicable) for appraisal and rating services rendered by it fees ranging from JPY200,000 to approximately JPY350,000,000.
MJKK and MSFJ also maintain policies and procedures to address Japanese regulatory requirements.
EDITORS PRODUCTION ASSOCIATE News & Analysis: Jay Sherman and Elisa Herr Alisa Llorens