newtechnology - verdazo
TRANSCRIPT

NewTechnologyDecember 2011
• the first word on oilpatch innovation
When Time Is Of The Essence
Software specific to industry calls out to public safety
A Better BuildSoftware solution eases the pain of construction contractor field data tracking
PU
BLI
CAT
ION
S M
AIL
AG
RE
EM
EN
T N
O. 4
0069
240
Create a better oil and gas exploration or production technology and the industry will beat a path to your door. For the second year, Technology Stars recognizes those
innovations and inventions that have risen to the top and are carrying the industry forward to a bold new future.
20 Technology STarS 2011
Launching a new oil and gas com-pany has always been a challenge, but an innovative calgary-based software company is helping to reduce some of that initial exploration risk.
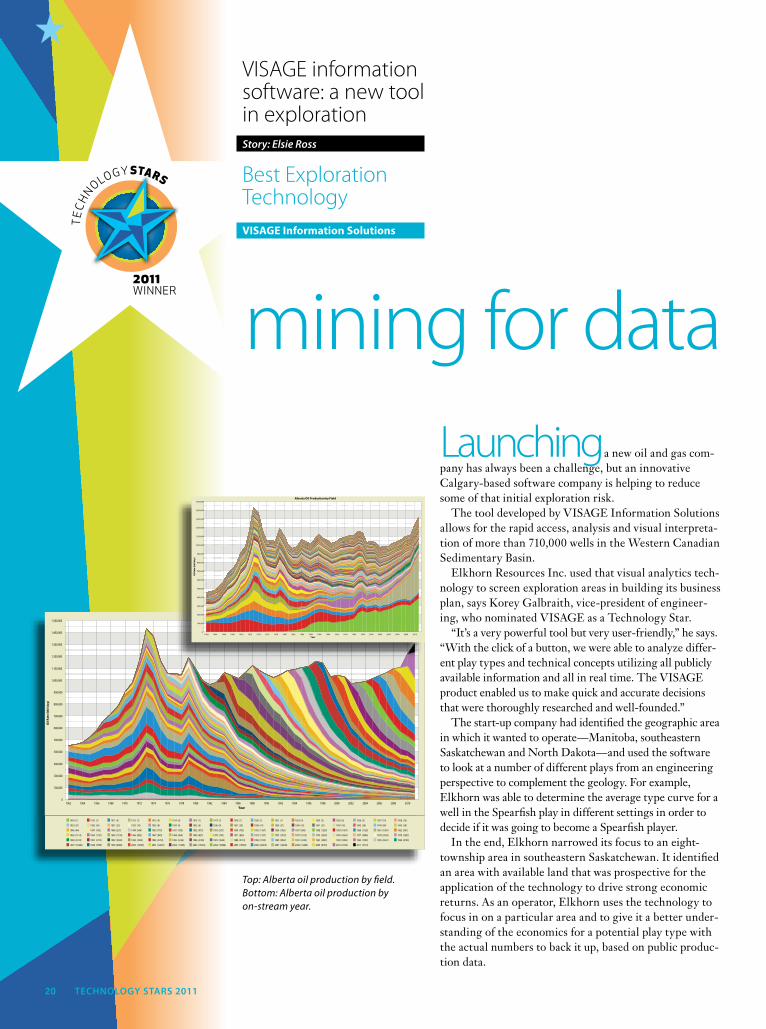
the tool developed by VisAge information solutions allows for the rapid access, analysis and visual interpreta-tion of more than 710,000 wells in the western canadian sedimentary Basin.
elkhorn Resources inc. used that visual analytics tech-nology to screen exploration areas in building its business plan, says korey galbraith, vice-president of engineer-ing, who nominated VisAge as a technology star.
“it’s a very powerful tool but very user-friendly,” he says. “with the click of a button, we were able to analyze differ-ent play types and technical concepts utilizing all publicly available information and all in real time. the VisAge product enabled us to make quick and accurate decisions that were thoroughly researched and well-founded.”
the start-up company had identified the geographic area in which it wanted to operate—Manitoba, southeastern saskatchewan and north dakota—and used the software to look at a number of different plays from an engineering perspective to complement the geology. for example, elkhorn was able to determine the average type curve for a well in the spearfish play in different settings in order to decide if it was going to become a spearfish player.
in the end, elkhorn narrowed its focus to an eight-township area in southeastern saskatchewan. it identified an area with available land that was prospective for the application of the technology to drive strong economic returns. As an operator, elkhorn uses the technology to focus in on a particular area and to give it a better under-standing of the economics for a potential play type with the actual numbers to back it up, based on public produc-tion data.
1904 (1) 1910 (1) 1911 (4) 1912 (1) 1913 (9) 1914 (4) 1915 (1) 1917 (1) 1918 (1) 1920 (1) 1921 (1) 1923 (4) 1924 (5) 1925 (6) 1926 (5) 1927 (10) 1928 (16)
1929 (31) 1930 (45) 1931 (25) 1932 (10) 1933 (8) 1934 (9) 1935 (6) 1936 (9) 1937 (28) 1938 (41) 1939 (37) 1940 (42) 1941 (57) 1942 (45) 1943 (58) 1944 (80) 1945 (58)
1946 (44) 1947 (103) 1948 (231) 1949 (544) 1950 (770) 1951 (785) 1952 (973) 1953 (927) 1954 (703) 1955 (1167) 1956 (1421) 1957 (968) 1958 (1230) 1959 (1067) 1960 (1128) 1961 (1081) 1962 (931)
1963 (1114) 1964 (1131) 1965 (1159) 1966 (882) 1967 (849) 1968 (968) 1969 (827) 1970 (730) 1971 (826) 1972 (1157) 1973 (1318) 1974 (1515) 1975 (2334) 1976 (3663) 1977 (4006) 1978 (3503) 1979 (3327)
1980 (4218) 1981 (4712) 1982 (4693) 1983 (4344) 1984 (4794) 1985 (5256) 1986 (5780) 1987 (3560) 1988 (4110) 1989 (3120) 1990 (3042) 1991 (3246) 1992 (3092) 1993 (5985) 1994 (7293) 1995 (6567) 1996 (8100)
1997 (10446) 1998 (7955) 1999 (8989) 2000 (12720) 2001 (12867) 2002 (11356) 2003 (15452) 2004 (18568) 2005 (19583) 2006 (20419) 2007 (16298) 2008 (13409) 2009 (8159) 2010 (8158) 2011 (5110)
0
100,000
200,000
300,000
400,000
500,000
600,000
700,000
800,000
900,000
1,000,000
1,100,000
1,200,000
1,300,000
1,400,000
1,500,000
Oil
Rate
(bbl
/day
)
1962 1964 1966 1968 1970 1972 1974 1976 1978 1980 1982 1984 1986 1988 1990 1992 1994 1996 1998 2000 2002 2004 2006 2008 2010Year
Alberta Oil Production by On Stream Year
data provided by geoLOGIC DATA CENTER - Nov 01, 2011, 12:51 PM VISAGE™
VISAGE information software: a new tool in explorationStory: Elsie Ross
Best Exploration TechnologyVISAGE Information Solutions
TE
CH
NOLOGYSTARS
2011WINNER
TE
CH
NOLOGYSTARS
2011RUNNER-UP
mining for data
data provided by geoLOGIC DATA CENTER - Nov 01, 2011, 1:00 PM VISAGE™
0
100,000
200,000
300,000
400,000
500,000
600,000
700,000
800,000
900,000
1,000,000
1,100,000
1,200,000
1,300,000
1,400,000
1,500,000
Oil
Rate
(bbl
/day
)
1962 1964 1966 1968 1970 1972 1974 1976 1978 1980 1982 1984 1986 1988 1990 1992 1994 1996 1998 2000 2002 2004 2006 2008 2010Year
Alberta Oil Production by Field
data provided by geoLOGIC DATA CENTER - Nov 01, 2011, 1:00 PM VISAGE™
Top: Alberta oil production by field. Bottom: Alberta oil production by on-stream year.
“it’s a very, very large data set,” says galbraith. the VisAge software gives an operator the ability to look at that data and make sense of it, sorting through it and normalizing it against a number of variables.
“i typically will look at 150–200 wells, and it’s [in] a matter of less than a minute,” he says. “the efficiency of it is real time in my mind with the data sets i am running.
“when you are a small company like ours, every soft-ware product has to have a direct cost benefit, which VisAge definitely does. we run very lean on our staff so we have to make it efficient to be able to do what we need to do, and that’s what this tool does.”
Because all the plays elkhorn is involved with are technology-driven, it has benefited from being able to see what other companies have learned in drilling their wells. “it definitely gets you up that [technology] curve quicker,” says galbraith.
Percentile (cumulative probability) distributions provided a comparison of various completions attempted on the target reservoirs, leading to the conclusion that if single-leg horizontal wells could be fracture stimulated, they could yield the same production potential as multi-leg horizontal wells.
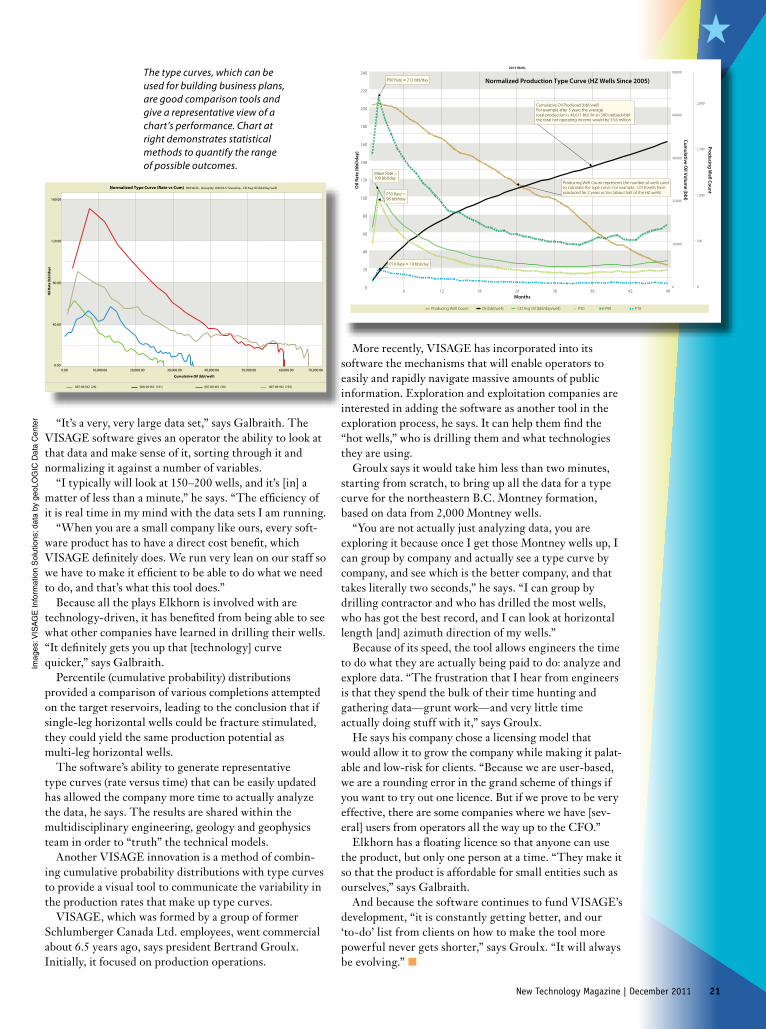
the software’s ability to generate representative type curves (rate versus time) that can be easily updated has allowed the company more time to actually analyze the data, he says. the results are shared within the multidisciplinary engineering, geology and geophysics team in order to “truth” the technical models.
Another VisAge innovation is a method of combin-ing cumulative probability distributions with type curves to provide a visual tool to communicate the variability in the production rates that make up type curves.
VisAge, which was formed by a group of former schlumberger canada ltd. employees, went commercial about 6.5 years ago, says president Bertrand groulx. initially, it focused on production operations.
More recently, VisAge has incorporated into its software the mechanisms that will enable operators to easily and rapidly navigate massive amounts of public information. exploration and exploitation companies are interested in adding the software as another tool in the exploration process, he says. it can help them find the “hot wells,” who is drilling them and what technologies they are using.
groulx says it would take him less than two minutes, starting from scratch, to bring up all the data for a type curve for the northeastern B.c. Montney formation, based on data from 2,000 Montney wells.
“You are not actually just analyzing data, you are exploring it because once i get those Montney wells up, i can group by company and actually see a type curve by company, and see which is the better company, and that takes literally two seconds,” he says. “i can group by drilling contractor and who has drilled the most wells, who has got the best record, and i can look at horizontal length [and] azimuth direction of my wells.”
Because of its speed, the tool allows engineers the time to do what they are actually being paid to do: analyze and explore data. “the frustration that i hear from engineers is that they spend the bulk of their time hunting and gathering data—grunt work—and very little time actually doing stuff with it,” says groulx.
he says his company chose a licensing model that would allow it to grow the company while making it palat-able and low-risk for clients. “Because we are user-based, we are a rounding error in the grand scheme of things if you want to try out one licence. But if we prove to be very effective, there are some companies where we have [sev-eral] users from operators all the way up to the cfo.”
elkhorn has a floating licence so that anyone can use the product, but only one person at a time. “they make it so that the product is affordable for small entities such as ourselves,” says galbraith.
And because the software continues to fund VisAge’s development, “it is constantly getting better, and our ‘to-do’ list from clients on how to make the tool more powerful never gets shorter,” says groulx. “it will always be evolving.” ■
Producing Well Count Oil (bbl/well) CD Avg Oil (bbl/day/well) P50 P90 P10
0
20
40
60
80
100
120
140
160
180
200
220
240
Oil
Rate
(bbl
/day
)
0
16,000
32,000
48,000
64,000
80,000
Cumulative O
il Volume (bbl)
6 12 18 24 30 36 42 48Months
0
500
1,000
1,500
2,000
Producing Well Count
Normalized Production Type Curve (HZ Wells Since 2005)
2013 Wells
data provided by geoLOGIC DATA CENTER - Oct 31, 2011, 7:58 AM VISAGE™
Producing Well Count represents the number of wells usedto calculate the type curve. For example, 1,018 wells haveproduced for 2 years or less (about half of the HZ wells)
Cumulative Oil Produced (bbl/well)For example after 3 years the average total production is 44,611 bbl. At an $80 netback/bbl the total net operating income would be $3.6 million
P90 Rate = 212 bbl/day
P10 Rate = 19 bbl/day
Mean Rate =109 bbl/day
P50 Rate =98 bbl/day
new technology magazine | December 2011 21
007-06-W2 (26) 008-06-W2 (141) 007-08-W2 (38) 007-09-W2 (103)
0.00
40.00
80.00
120.00
160.00
Oil
Rate
(bbl
/day
)
0.00 10,000.00 20,000.00 30,000.00 40,000.00 50,000.00 60,000.00 70,000.00
Cumulative Oil (bbl/well)
Normalized Type Curve (Rate vs Cum) 308 Wells - Group By: UWI DLS Township - CD Avg Oil (bbl/day/well)
data provided by geoLOGIC DATA CENTER - Nov 01, 2011, 1:22 PM VISAGE™
The type curves, which can be used for building business plans, are good comparison tools and give a representative view of a chart’s performance. Chart at right demonstrates statistical methods to quantify the range of possible outcomes.
Imag
es: V
ISA
GE
Info
rmat
ion
Sol
utio
ns; d
ata
by g
eoLO
GIC
Dat
a C
ente
r