nexo - michigan state university
TRANSCRIPT

The Limitations Latinos Face when Starting a Business
page 20
Vol. XXIII • No. 1 Fall 2019
NEXOThe Official Newsletter of The Julian Samora Research Institute
The Midwest’s Premier Latino Research Center
JSRI’s mission is to generate, disseminate, and apply knowledge to serve the needs of Latino communities in the Midwest and across the nation.
University Outreach and EngagementJulian Samora Research Institute
From The DirectorAgainst Dehumanization - 2
Book ReviewsState of Resistance - 4Hispanics in the U.S. Criminal Justice System - 5
ArticlesLatino Education Profile in the United States and Michigan - 6The Limitations Latinos Face when Starting a Business - 20
¿Qué está pasando en el instituto?JSRI Celebrates 30 Years - 14Political Divisions and Higher Ed. - 15Scholarship Recipients - 16New Faces - 16Send Offs - 16Black Brown Dialogues III - 17Symposia on Genocide - 18
MiscellaneousNeoliberalism and Public Ed. - 12H-2A Workers - 13Immigrants, Human Rights, and U.S. Humanitarian Policy - 19Michigan’s Social Studies Standards - 28First Step Act - 29New Government Regulations - 30Latina/os and the 2020 Census - 31
IN THIS ISSUE
Latino Education Profile in the United States and Michigan
page 6

2 | NEXO FALL 2019
From The DirecTor
NEXONEXO is the official newsletter of the Julian Samora Research Institute (JSRI), University Outreach and Engagement at Michigan State University (MSU) in East Lansing, Michigan. All contents remain the property of the original authors or artists, JSRI, and/or MSU. Some of the views expressed by contributors may not represent those of JSRI or MSU. Reproduction of this publication without written permission of JSRI is restricted except for educational purposes. Printable copies of the newsletter are available online.
JSRI at Michigan State University is committed to the generation, transmission, and application of knowledge as it relates to Latinos and Latino communities throughout the Midwest and the nation.
EditorRubén MartinezLayout DesignerMarcos Martinez
Julian Samora Research Institute University Outreach and EngagementMichigan State University219 S. Harrison Road, Room 93East Lansing, MI 48824Ph: (517) 432-1317Fax: (517) 432-2221Email: [email protected]: jsri.msu.edu Facebook: facebook.com/JSRIMSU
Against Dehumanization
Rubén O. Martinez Director
Humans are capable of both humanizing and dehumanizing behaviors. Guided either by morals and compassion or by greed and hatred, they can build humanizing or dehumanizing societies. Most Americans would agree that the trajectory of humanity has been for the better in the quality of material and social life. That trajectory, however, has been uneven and inconsistent; there have been backward steps characterized by harassment, discrimination, hatred and violence against those peoples defined as inferior by those who feel superior and destined to rule or simply feel threatened in the quality of their lives. One of the enduring systems of
dehumanization is racism.America, like all social orders, has been fraught with contradictions from its very
beginnings. Its founders espoused the ideal of the Enlightenment that people can more fully develop their human potential through the types of societies they build. And they embarked upon building a democratic society in which all people were regarded as equal and had the opportunity to improve their lot in life. They called it forming “a better Union.” At the same time, many of the founders were slave owners, and the Constitution, despite its progressive features, institutionalized inequality in voting and political representation. It celebrated “free persons” and diminished the count of “Other persons,” denying inclusion of Indians not taxed, which was the overwhelming majority of them. They opposed taxation without representation, and used taxation as an instrument to deny representation to Others.
As America gained control over more land, namely the West and islands in the Caribbean, it brought more and more people culturally different from White Americans. Taken over by force, these peoples brought into America’s orbit were quickly incorporated into the racial structures and dynamics of the nation. These included the racial division of labor, institutionalized segregation, and political domination; in short, colonialism. Threaded throughout America’s expansion is a belief of racial superiority grounded in the ideology of White Supremacy. That is, that White Americans are morally, intellectually, and emotionally superior to all other peoples whom they view as inferior to them through racial categories.
Robert Park, a sociologist at the University of Chicago in the first part of the 20th Century, hypothesized that there are cycles in human relations that move from contact to competition, accommodation, and assimilation. Park recognized that the different aspects of the cycle could occur simultaneously and that periods of conflict would temporarily halt the general process toward integration and stability. While the process he presented does not unfold as he hypothesized, his model, with its emphasis on social conflict, is useful in that it focuses critical attention on racism. The nation today is characterized by widespread political conflict that recently revealed nativism as a core feature. Nativism, which is grounded in social conservatism, occurs when the dominant group in society, in this case White Americans, feels that its culture, traditions, and dominant status are threatened and its members mobilize to protect them. That protection usually targets immigrants, who are seen as the threat to the social order.
Social conservatism is one of the many threads of American conservatism.

NEXO FALL 2019 | 3
NEXO FALL 2019
Others are Christian conservatism, Constitutional conservatism, fiscal conservatism, libertarianism, traditionalist conservatism, and neoconservatism, to name a few. These threads exist simultaneously with differing degrees of influence among them and in the larger social order. In any historical moment, they overlap and generate different configurations of political influence in society. With the election of President Trump we saw the rise of neoliberal nationalism. This configuration of political power and influence consists of the blending of the neoliberal influences of fiscal conservatism and libertarianism with social conservatism.
Among other things, the configuration of influence mixes anti-government sentiments and deregulation of the economy with anti-immigrant sentiments. More recently, hitherto barely visible racist elements have erupted in the open with President Trump’s attacks on Third World immigrants and leaders of color while speaking publicly in coded terms that affirm the views of White supremacists. The “America, love or leave it” slogan reflected both nativism and the racism inherent in the neoliberal nationalist movement that President Trump has promoted across the country. Further, by seeking to crush public discussions of ways to improve our government to better promote a more Perfect Union, he has reshaped the dynamics of public discourse in the direction of authoritarianism, which demands compliance with authority at the expense of the personal freedom of the individual. If people do not behave as they are expected to by neoliberal nationalists, they become targets of hostility and violence.
This context is shaped by numerous contradictions. Indeed, the concept neoliberal nationalism combines the contradictory elements of globalization, a core feature of neoliberalism, and nationalism, which puts “America” first. There are also the contradictions between the values of equality and racism and nativism, and those between authoritarianism and personal freedom and the values embodied in the Constitution. And, there are certainly more contradictions in the current political order.
The current nativist elements of today’s governing regime are openly denying refugees and immigrants their civil and human rights, and detaining migrants, adults and children in squalid living conditions. There are innumerable violations of laws occurring that are being addressed through the judicial system, which is slowly being turned into a political instrument that supports authoritarianism. With the existence of a historical repository of racial sentiments among Americans, and given the social frustration generated by the downward economic experiences of a major segment of America’s middle class, it has been easy for President Trump to meld the two to promote White Supremacy. Thereby giving rise to another historical moment in which the ideology of White Supremacy is openly promoted. This time, however, by the President of the United States.
Consequently, the nation is experiencing social and political upheaval. Generalizing from Park’s model, this historical moment can be seen as a step back in the pursuit of a more Perfect Union, but the optimism remains that Americans can rise above the “long night” that constitutes today’s political period. In the middle of the 19th Century, Theodore Parker, a Unitarian minister and abolitionist, wrote about the moral universe and its long arc toward justice. This idea was quoted by Martin Luther King, Jr. in 1958 in the Gospel Messenger, published by the Church of the Brethren, where he promoted the idea of nonviolent resistance, which is passive physically but active spiritually. There, he wrote that “the arc of the moral universe is long, but it bends toward justice” (107, 6: 14).
The optimism of the Enlightenment, Theodore Parker, Robert Park, and Martin Luther King, Jr., is based on the view that humanity is on a trajectory that leads toward higher and higher levels of civilization. The pursuit of justice is the spiritual dimension upon which higher levels of social orders are achieved. Through the struggles of the oppressed and those who believe in and pursue social justice the United States has traveled along the arc of the universe toward justice. But that journey has stalled as a result of the powerful elements in society that have imposed free market fundamentalist policies that have had a negative effect on the lives of most Americans.
For example, we have the greatest degree of social inequality in the United States since the years before the Great Depression. But it is not immigrants who have created the material conditions of economic and social suffering found throughout the country. The policies of conservatism have produced those conditions, including the runaway plants that decimated manufacturing, the continuous reduction of corporate taxes, and the gerrymandering of voting districts, to mention just a few.
Will the current setbacks to human progress and the nation continue to be sustained by the propaganda of neoliberals and by the lies of President Trump, or will Americans awaken from the “long night” to the values of the Enlightenment and the Constitution? Perhaps the words of Langston Hughes, the poet, social activist, and writer, can revive the promise of tomorrow:
LIBERTY!
FREEDOM!
DEMOCRACY!
True anyhow no matter how many
Liars use those words

4 | NEXO FALL 2019
Book Reviews
State of Resistance: What California’s Dizzying Descent and Remarkable Resurgence Mean for America’s Future
by Manuel Pastor. 2018. New York City, NY: The New Press.
Reviewed by Juan D. Coronado
Manuel Pastor’s State of Resistance: What California’s Dizzying Descent and Remarkable Resurgence Mean for America’s Future offers a vision for the future of the United States by looking at the California experience. He argues that California’s stable and integrated social order, which has a vital economy, a growing housing market, a successful education system, and a healthy-operative political system, is grounded on a public understanding that welcomes newcomers and seeks to advance forthcoming generations (p. 19). In this concise book, Pastor offers clear examples of the path that California has taken, and suggests that the rest of the country could follow in order to elevate civilization.
Using California’s history and progressive efforts, Pastor seeks to demonstrate how the Golden State can represent a future America, as the state has already experienced most of the disruptions that the country has been dealing with in recent times. In many ways, California leads the nation in progressive reforms that attempt to raise both living and environmental standards. Through historical, political, and social lenses, the author demonstrates how Californios have created a society that is exemplary for the rest of the nation while at the same time preserving the Constitution and American democratic values.
Pastor artfully demonstrates the widespread societal impact that investment in infrastructure and education brought to California and its people. Investments in expanding water resources led to the
expansion of the Imperial and San Fernando Valleys. While the creation of Arroyo Seco Parkway, the Golden Gate Bridge, and the Bay Bridge brought jobs during the Great Depression, they also served as models of innovation that further connected California communities (p. 27). The Hoover Dam, also completed during the depression, brought energy and water to southern California and led to economic growth. These investments in infrastructure cemented the way for the California Water Plan (1957) and the California Freeway System (1958).
Likewise, under Democratic Governor Edmund G. “Pat” Brown, the Master Plan for Higher Education (1960) was created at the same time that there was a push for a state minimum wage that was “funded by the largest tax increase in a quarter century” (p. 33). The Master Plan for Education emphasized three systems: the University of California system (research and postgraduate education), the California State University system (less selective offering four degrees), and the California Community College system (open admissions providing a pipeline to other systems). Not surprisingly, by 1970, California became the second most educated state in the country (p. 33).
Despite the gains and improvements made due to these progressive reforms, White Americans disproportionately benefited from these changes in comparison to communities of color (p. 34). Attempts made to address discrimination and segregation were met with political backlashes. Conservative forces, especially among the state’s right-wing agriculturalists, sought to maintain aspects of Jim Crow that kept communities segregated and championed Proposition 14, which protected discriminatory property sales. This led to the election of Republican Governor Ronald Regan who exploited the bigoted uncertainties and fears of change among Californians. Progressive forces reacted in revolutionary protest to the subjugation their communities faced, and the voices of oppressed populations were echoed by California groups such as the Black Panther Party, the Community Service Organization, the Chicano Moratorium, widespread student activism throughout California
universities, and the United Farm Workers.Pastor draws parallels between Ronald
Regan and Donald Trump in their ability to use dog whistle politics to comfort, coddle, and embolden a White American base that feels threatened by a perception that their privilege is slipping away (p. 39). He also uses the unconstitutional Proposition 187 which was passed in 1994 as an anti-immigration ballot initiative to foreshadow the current xenophobic and anti-Latino atmosphere the nation is experiencing. Pastor views the economic decline California experienced in the final third of the last century as having engendered anti-immigrant sentiments and nativist or nationalist periods, which often are tied to economic anxieties. Pastor also compares the crack/cocaine epidemic experienced in California during the 1980s and early 1990s to the opioid epidemic of today and ties these to economic stresses experienced by the population. Other parallels Pastor provides include relating California’s protests of yesteryear, such as the Watts Riots and the protests and riots provoked by the Rodney King beating, to today’s Black Lives Matter protests provoked by police killings of unarmed Black men.
Resistance to the election of President Donald Trump posed by California State Senator Kevin de Leon and California State Assemblyman Anthony Rendon, who vowed to stand against the backwardness of Trump’s agenda, is the motivation for Pastor’s clever title. Emphasizing what has worked and what has not worked for California, Pastor provides a useful blueprint from the lessons learned for the rest of the nation to consider implementing. This book provides a deeper understanding of the growth and the further incorporation of California as a state of the Union, while providing political and social lessons on how conservative and liberal reforms have affected the nation’s most populous state. Manuel Pastor makes an important contribution and is able to make California’s history relevant to the political and social discourses of today, when America’s democratic values, its Constitution, and humanity itself are every day threatened by a political regime and social order valuing profits above life.

NEXO FALL 2019 | 5
Book ReviewNeXo FALL 2019
Hispanics in the U.S. Criminal Justice System, 2nd Ed.
by Martin Guevara Urbina and Sofía Espinoza Álvarez. 2018. Springfield, IL: Charles C Thomas.
Reviewed by Rubén Martinez
Durán presents a historical overview of Latinos and policing, as well as a review of the literature. Mary Romero and Gabriella Sánchez follow with an examination of the critical challenges Hispanic defendants face once within the grasp of the “long arm of the law.” The chapter’s foci include racial and ethnic profiling, police abuse and brutality, police discretion, and the violation of rights. The section concludes with a chapter by Carlos E. Posadas and Christina Ann Medina on legislation at local, state, and federal levels designed to clamp down on Mexican immigration. Legislation has been influenced by several factors, including “race/ethnicity, economics, war, and labor shortage” (p. 87).
The chapters in Section Two focus on Hispanics and the judicial system. Claudio G. Vera Sánchez leads off the section with a chapter on the policies, practices, and structural hierarchies that influence the experiences of Latino police officers. Namely, they participate in a supposed race-neutral organization that yields the disproportionate incarceration of Latinos. This is followed by David V. Baker’s chapter on the forces that have and continue to shape Hispanic criminal (in)justice. The legacy of internal colonial domination is what governs the contemporary forms of (in)justice experienced by today’s Hispanics in American society.
In Chapter 8, Adalberto Aguirre, Jr. discusses the social construction of Mexicans as criminals through the dynamics of power and privilege. The process involves both ideology and institutional domination. In the next chapter Alfredo Mirandé examines the process by which Latinos are subjected to unreasonable searches and seizures. In short, their rights and protections under the Fourth Amendment to the U.S. Constitution have been diminished in everyday life. In the chapter that follows, Mirandé examines the exclusion of Latinos from participation in juries. This exclusion occurs through the “common sense racism in the American judicial system” (p. 159). In Chapter 11, Guevara Urbina examines the barriers that indigent defendants face in the American court system. The justice system consists of a confluence of different factors (economics, race, etc.) that oppress some segments of
society while serving others.The chapters in Section Three focus
on Hispanics and the penal system. Sofía Espinoza Álvarez leads off with a chapter on “the road to prison” that highlights the institutional processes by which Latinos are subjected to discrimination that facilitates their imprisonment. In Chapter 13, Rick Ruddell and Natalie R. Ortiz focus on the experiences of Hispanic prisoners, including healthcare, rehabilitation opportunities, and community reentry. In the next chapter, Kathryn D. Morgan focuses on probation and parole and how they prolong captivity beyond incarceration. The disparate impact of imprisonment, probation, and parole result from the emphasis on punishment and the scapegoating of Latinos as responsible for societal troubles.
In Chapter 15, Ilse Aglaé Peña and Martin Guevara Urbina examine the legacy of capital punishment and the execution of Mexicans and Latinos. They note that the disproportionate use of the death penalty against Latinos has been increasing in recent decades. In the next chapter the editors of the volume focus on life after prison and provide recommendations for overcoming barriers to successful reentry back into the larger society. They emphasize policies and practices that promote successful reintegration into conventional society.
Section Four consists of two chapters by the editors of the volume. One focuses on the globalization of criminal justice, and the other on the future of Latinos in the American criminal justice system. Key aspects of the globalization of criminal justice include the war on drugs, the rise of the illegal alien ideology, and the use of national security propaganda. In the final chapter the emphasis is on paradoxes and dilemmas within the American criminal justice system in the context of shifting demographics.
The volume will prove highly useful to scholars, students, and lay readers alike. It examines the issues that characterize the relationship between Latinos and the American criminal justice system from historical perspectives, within specific contexts, and across the full spectrum of the dimensions of criminal justice.
This volume focuses on Hispanics and the criminal justice system, and emphasizes ethnic and racial dimensions as core elements of the relationship. It is the second edition of a volume published in 2012. Like the previous volume, this one contains 18 chapters with 17 organized into four sections or parts. The introductory chapter stands alone at the beginning of the volume.
The volume is not much different from the first edition, with 14 of the chapters in that volume appearing in updated form. Six of the chapters in this volume and the previous edition also appeared in another edited volume by these editors, namely Ethnicity and Criminal Justice in the Era of Mass Incarceration (2017). A chapter in this edition on arrests and future research by Michael Tapia and Patricia Harris was replaced by one on Latino police officers written by Claudio G. Vera Sánchez, who provided a similar chapter in another of Guevara Urbina’s edited volumes, Latino Police Officers in the United States (2015). The editors each provide a chapter of their own as well as three co-authored ones.
In the introduction the editors set the stage for readers by framing the broad contours of the Latino experience in American society. They review the pertinent literature on Latinos and the criminal justice system and provide the rationale for and an overview of the volume.
The chapters in Section One address key dimensions of the relationship between Hispanics and the police. Charles Crawford leads the section with a historical overview of ethnicity in law enforcement. It includes an emphasis on the role of ethnicity in policing. This is followed by Robert J. Durán’s chapter on “policing the barrio.”

6 | NEXO FALL 2019
Latino Education ProfiLE in thE u.S. and Michigan
Latino Education Profile in the United States and Michigan
Jean Kayitsinga and Rubén Martinez
IntroductionThe Latino population in the United States has been growing
at a rate of approximately two percent each year in the last three decades. Latinos are now the largest ethno-racial minority group in the United States. As of July 1, 2018, Latinos were estimated at 18.3% of the U.S. total population (U.S. Census Bureau, 2018a) and are projected to reach 27.5% by 2060 (U.S. Census Bureau, 2018b).
A key dimension of minority status is education. The U.S. education system is highly stratified and educational achievement varies by race/ethnicity and socioeconomic status. Although racial and ethnic gaps in educational achievement and attainment have narrowed over the past three decades, educational achievement gaps remain a major challenge for the nation. Latino, African American, and Native American students score significantly lower on achievement tests, especially in mathematics, than White and Asian students.
Several factors at the community, school, family, and student levels influence Latinos’ and other minority students’ academic achievement. These include, to name a few, parents’ socioeconomic status, lack of knowledge about the functioning
of the U.S. school system, inadequate resources and weak student-teacher relationships (Schneider, Martinez, and Owens, 2006), and school socioeconomic composition (Coleman et al., 1966).
The objective of this article is to describe the current state of education for Latinos, compared to other racial groups in the United States and Michigan. Data are drawn from several existing sources, including the American Community Survey (ACS), the National Assessment of Educational Progress (NAEP), the Michigan Student Test of Educational Progress (M-STEP), and the Current Population Survey (CPS). The following question is addressed: 1) How do Latinos compare with other racial groups when it comes to educational attainment and achievement? The following dimensions are examined: educational attainment of adults (25 years and older), educational performance in reading and mathematics, high school graduation and dropout rates, and enrollment to colleges.
Educational attainmentFigure 1 presents the educational attainment of adults 25 years and older by race and ethnicity in the United States for the year

NEXO FALL 2019 | 7
NEXO FALL 2019
2017. Latinos are among the least educated group with 15% of adult Latinos (25 years and older) having earned a Bachelor’s or higher degree, compared with 35% of Whites, 21% of African Americans, 14% of American Indians/Alaska Natives, 53% of Asians, and 17% of Native Hawaiian/Other Pacific Islanders. About 27% of adult Latinos had a high school diploma (or equivalent).
Latinos are not a monolithic ethnic group. They are diverse and include Latinos who are U.S. citizens and immigrants. Estimates from the ACS show that Mexican Americans constitute the largest segment of Latinos in the United States. As of 2017, the composition of Latinos in the United States was as follows: 63% Mexican Americans, 10% Puerto Ricans, 4% Cubans, 13% Central Americans, 6% South Americans, and 5% other Latinos, which includes Spaniards (U.S. Census Bureau, 2018a). Figure 1. Percent Educational Attainment of Adults 25 Years and Older by Race/ethnicity in the United States, 2017
Source: U.S. Census Bureau, 5-Year American Community Survey, 2013-2017.
27.4 27.7 31.2 31.5
15.0
35.7
15.2
34.5
20.614.3
52.7
16.9
LATINO NON-HISPANIC WHITE
BLACK OR AFRICAN
AMERICAN
AMERICAN INDIAN OR
ALASKA NATIVE
ASIAN NATIVE HAWAIIAN OR
PACIFIC ISLANDER
Perc
enta
ge
High school graduate diploma (or equivalent) Bachelor's degree or higher
As shown in Figure 2, Mexican Americans, followed by Latinos from Central America, have the lowest rates of Bachelor’s degree attainment, compared to other groups. Latinos from South America, followed by Cubans and other Latinos, have the highest levels of Bachelor’s degree attainment.Figure 2. Percent Educational Attainment of Latino Adults 25 Years and Older by Hispanic origin in the United States, 2017
Source: U.S. Census Bureau, 5-Year American Community Survey, 2013-2017.
27.4 29.1 28.825.2 24.4 26.6
11.3
19.3
27.7
13.9
34.2
24.4
MEXICAN PUERTO RICAN
CUBAN CENTRAL AMERICAN:
SOUTH AMERICAN:
OTHER HISPANIC OR
LATINO:
Perc
enta
ge
High school (or equivalent) Bachelor's degree or higher
In 2017, 17% of Latino adults in Michigan had a Bachelor’s degree or higher, compared to 29% of White adults. Native
American adults in Michigan had the lowest levels of Bachelor’s degree attainment, whereas Asian adults had the highest levels of Bachelor’s degree attainment (63%) (Figure 3).Figure 3. Percent Educational Attainment of Adults 25 Years and Older by Race/ethnicity in Michigan, 2017
Source: U.S. Census Bureau, 5-Year American Community Survey, 2013-2017.
27.3 29.8 30.9 33.5
11.3 14.517.129.2
17.0 14.2
63.4
28.6
LATINO NON-HISPANIC WHITE
BLACK OR AFRICAN
AMERICAN
AMERICAN INDIAN OR
ALASKA NATIVE
ASIAN NATIVE HAWAIIAN OR
PACIFIC ISLANDER
Perc
enta
ge
High school graduate diploma (or equivalent) Bachelor's degree or higher
Student performanceReading achievement
In 2017, Latino 4th graders scored 23 points lower than their White counterparts in reading on average (Table 1). In comparison, African American (26 points), American Indian/Alaska Native (30 points), and Native Hawaiian/Other Pacific Islander (20 points) 4th graders scored lower than their White classmates in reading. In contrast, Asian 4th graders scored 9 points higher than their White classmates in reading on average (Table 1).
Another way to look at racial/ethnic inequalities in reading achievement is to consider the percentage of students at different achievement levels. Achievement levels are performance standards reflecting what students should know and be able to master at each level: Basic level denotes partial mastery of knowledge and skills that are fundamental for proficient performance at a given grade. Below basic level denotes less than the basic level of performance. Proficient level

8 | NEXO FALL 2019
Latino Education ProfiLE in thE u.S. and Michigan
denotes solid academic performance. Students reaching this level have demonstrated competency over challenging subject matter. Advanced level signifies superior performance (Aud, Fox, and KewalRamani, 2010).
In 2017, 23% of Latino 4th graders scored at proficient or advanced reading, compared to 47% of White 4th graders (Table 1). Considering other racial groups, 20% of African American, 20% of American Indian/Alaska Native, 27% of Native Hawaiian/Other Pacific Islander, and 59% of Asian 4th graders scored at proficient or advanced reading levels.Table 1. Percentages at each Achievement Level and Average NAEP Composite Score for Fourth Grade Reading by Race/ethnicity in the United States, 2017
Race/Ethnicity Achievement Levels
Average Standard Deviation Below Basic Basic Proficient Advanced
United States 32.0 31.0 27.0 9.0 222 38 White 22.0 32.0 34.0 13.0 232 34 Black/African American 49.0* 31.0 17.0* 3.0* 206* 36
Latino/Hispanic 46.0* 32.0 19.0* 4.0* 209* 38 Asian 16.0* 25.0* 37.0* 22.0* 241* 36 American Indian/ Alaska Native 52.0* 28.0 17.0* 3.0* 202* 41
Native Hawaiian/ other Pacific Islander 42.0* 31.0 23.0* 4.0* 212* 38
Two or more races 27.0* 31.0 30.0* 11.0 227* 36 Note: * p < 0.05 (average scale score significantly different from that of White (reference group). Source: U.S. Department of Education, Institute of Education Sciences, National Center for Education Statistics, National Assessment of Educational Progress (NAEP), 2017 Reading Assessment.
In 2017, Latino 4th graders in Michigan scored 18 points lower than their White counterparts in reading on average (Table 2). In comparison, African American 4th graders scored 27% lower, whereas Asian 4th graders scored 13 points higher than their White classmates.Table 2. Percentages at each Achievement Level and Average NAEP Composite Score for Fourth Grade Reading by Race/ethnicity in Michigan, 2017
Race/Ethnicity
Achievement Levels Average
Standard Deviation Below Basic Basic Proficient Advanced
Michigan 36.0 33.0 25.0 6.0 218 38 White 28.0 35.0 29.0 7.0 224 35 Black/African American 62.0* 25.0* 11.0* 1.0* 197* 35 Latino/Hispanic 48.0* 32.0 17.0* 3.0* 206* 38 Asian 17 27 39 17 237* 35 Two or more races 34 31 25 10 219 41
NOTE: * p < 0.05 (average scale score significantly different from that of White (reference group). Statistics for American Indian/Alaska Native and Native Hawaiian/Other Pacific Islander students were not reported because they did not meet reporting standards. Source: U.S. Department of Education, Institute of Education Sciences, National Center for Education Statistics, National Assessment of Educational Progress (NAEP), 2017 Reading Assessment.
In 2017, 20% of Latino 4th graders in Michigan scored at proficient or advanced levels in reading, compared to 36% of White 4th graders (Table 2). Comparatively, 12% of African American and 56% of Asian 4th graders scored at proficient or advanced levels in reading.
The reading achievement gap between Latinos and Whites and that between other racial minority groups and Whites in 8th grade is similar to that for 4th graders’ reading scores (see Table 1). In 2017, Latino 8th graders scored 20 points lower than
their White counterparts in reading (Table 3). Comparatively, African American 8th graders scored 26 points, American Indian/Alaska Natives 22 points, and Native Hawaiian/Other Pacific Islanders 20 points lower than their White classmates in reading. In contrast, Asian 8th graders scored 9 points higher than their White classmates in reading. In 2017, 23% of Latino 8th graders scored at proficient or advanced reading, compared to 45% of White 4th graders (Table 3); 18% of African American, 21% of American Indian/Alaska Native, 22% of Native Hawaiian/Other Pacific Islander, and 57% of Asian 8th graders scored at proficient or advanced reading.Table 3. Percentages at each Achievement Level and Average NAEP Composite Score for Eighth Grade Reading by Race/ethnicity in the United States, 2017
Race/Ethnicity
Achievement Levels
Mean
Standard Deviation
Below Basic
Basic
Proficient
Advanced
United States 24.0 40.0 32.0 4.0 267 36 White 16.0 39.0 39.0 6.0 275 33 Black/African American 40.0** 42.0 17.0* 1.0* 249* 34 Latino/Hispanic 33.0* 44.0* 22.0* 1.0* 255* 34 Asian 13.0* 30.0* 45.0* 12.0* 284* 36 American Indian/Alaska Native 37.0* 41.0 20.0* 1.0* 253* 35 Native Hawaiian/Other Pacific Islander 35.0* 42.0 22.0* 2.0* 255* 36 Two or more races 18.0* 40.0 36.0* 6.0 272* 34
Note: * p < 0.05 (average scale score significantly different from that of White (reference group). Source: U.S. Department of Education, Institute of Education Sciences, National Center for Education Statistics, National Assessment of Educational Progress (NAEP), 2017 Reading Assessment.
In Michigan, Latino 8th graders scored, on average, 11 points lower than their White counterparts in reading (Table 4). Comparatively, African American 8th graders scored 20 points lower than their White classmates. In contrast, Asian 8th graders scored 10 points higher than their White classmates. In terms of proficiency levels, 25% of Latino 8th graders in Michigan scored at proficient or advanced reading, compared to 38% of White 4th graders. Comparatively, 13% of African American and 52% of Asian 8th graders scored at proficient or advanced reading.

NEXO FALL 2019 | 9
NEXO FALL 2019
Table 4. Percentages at each Achievement Level and Average NAEP Composite Score for Eighth Grade Reading by Race/ethnicity in Michigan, 2017
Achievement Levels Average
Standard Deviation
Race/Ethnicity Below Basic Basic Proficient Advanced
Michigan 24.0 42.0 31.0 3.0 265 34 White 19.0 42.0 35.0 3.0 270 33 Black/African American 44.0* 42.0 13.0* 0.0 245* 33 Latino/Hispanic 27.0 48.0 24.0 1.0 259* 30 Asian 15.0 33.0 43.0 9.0 280 35 Two or more races 34.0 31.0 25.0 10.0 266 35
Note: * p < 0.05 (average scale score significantly different from that of White (reference group). Statistics for American Indian/Alaska Native and Native Hawaiian/Other Pacific Islander students were not reported because they did not meet reporting standards. Source: U.S. Department of Education, Institute of Education Sciences, National Center for Education Statistics, National Assessment of Educational Progress (NAEP), 2017 Reading Assessment.
In 2015, Latino 12th graders scored 19 points lower than their White counterparts in reading (Table 5). Comparatively, African American 12th graders scored 29 points and American Indian/Alaska Natives 18 points lower than their White classmates in reading. In 2015, 25% of Latino 12th graders scored at proficient or advanced reading, compared to 47% of White 12th graders. In comparison, African Americans scored 16% and American Indian/Alaska Natives 21% at proficient or advanced reading.Table 5. Percentages at each Achievement Level and Average NAEP Composite score for Twelfth Grade Reading by Race/ethnicity in the United States, 2015a
Race/Ethnicityϯ
Achievement Levels
Mean
Standard Deviation
Below Basic At Basic
At Proficient
At Advanced
United States 28.0 35.0 31.0 6.0 287 41 White 21.0 33.0 38.0 9.0 295 39 Black/African American 48.0* 36.0 15.0* 1.0* 266* 38 Latino 37.0* 38.0* 23.0* 2.0* 276* 38 Asian 20.0 32.0 39.0 10.0 297 40 American Indian/Alaska Native 35.0 36.0 25.0 3.0* 279* 38 Two or more races 21.0 33.0 36.0 9.0 295 40
Note: a. No recent reading assessment data was available for 12th grader students. * p < 0.05 (average scale score significantly different from that of White (reference group). Ϯ Native Hawaiian/Other Pacific Islander were not reported because they did not meet the statistical reporting standards. Source: U.S. Department of Education, Institute of Education Sciences, National Center for Education Statistics, National Assessment of Educational Progress (NAEP), 2015 Reading Assessment.
In 2018, Latino 11th graders scored on the Michigan Student Test of Educational Progress (M-STEP) on average 47 points lower than their White counterparts in English language arts (ELA) (Table 6). Comparatively, African American 11th graders scored on average 78 points, American Indian/Alaska Natives
41 points, and Native Hawaiian/Other Pacific Islanders 13 points lower than their White classmates in ELA. In contrast, Asian 11th graders scored on average 50 points higher than their White classmates. In terms of proficiency levels in 2018, 44% of Latino 11th graders scored at proficient or advanced in ELA, compared to 65% of White 11th graders. In comparison, 29% of African American 11th graders, 47% of American Indian/Alaska Native, 60% of Native Hawaiian/Other Pacific Islander and, on the top of the list, 75% of Asian 11th graders scored at proficient or ad-vanced in ELA.Table 6. Percentages of Eleventh Grade Michigan Students at Advanced/Proficient Levels and M-STEP Mean Scale Score of Reading and Writing by Race/Ethnicity, 2018a
Jurisdiction by Race
Percent Proficient /Advanced
Mean Scale
Score
Standard Deviation
Michigan 57.8 505.3 98.8 White 64.6 519.1 96.4 Black/African American 28.7 441.4 75.2 Latino/Hispanic 43.6 472.6 85.7 Asian 74.9 568.7 117.8 American Indian/Alaska Native 47.2 477.7 87.5 Native Hawaiian/Other Pacific Islander 60.4 506.5 95.5 Two or more races 55.5 500.8 98.6
Note: aThe most recent NAEP reading assessment for 12th graders in Michigan available was in 2013. Source: Michigan Department of Education. https://www.michigan.gov/mde
Mathematics achievementIn 2017, Latino 4th graders, on average, scored 19 points
lower than their White counterparts in mathematics (Table 7). In comparison, African American 4th graders scored 25 points, American Indian/Alaska Natives 21 points, and Native Hawaiian/Other Pacific Islanders 19 points lower than their White classmates in mathematics. In contrast, Asian 4th graders, on average, scored 12 points higher than their White classmates in mathematics. In 2017, 26% of Latino 4th graders scored at proficient or advanced levels in mathematics, compared to 51% of White 4th graders. Comparatively, 19% of African American, 24% of American Indian/Alaska Native, 29% of Native Hawaiian/Other Pacific Islander, and 64% of Asian 4th graders scored at proficient or advanced levels in mathematics. Table 7. Percentages at each Achievement Level and Average NAEP Composite Score for Fourth Grade Mathematics by Race/ethnicity in the United States, 2017
Race/Ethnicity Achievement Levels
Mean Standard Deviation Below Basic Basic Proficient Advanced
United States 20.0 39.0 32.0 8.0 240 31 White 12.0 37.0 40.0 11.0 248 29 Black/African American 37.0* 44.0* 17.0* 2.0* 223* 29 Latino/Hispanic 29.0* 44.0* 23.0* 3.0* 229* 30 Asian 8.0* 25.0* 41.0* 23.0* 260* 32 American Indian/Alaska Native 31.0* 44.0* 21.0* 3.0* 227* 30 Native Hawaiian/Other Pacific Islander 29.0* 42.0 25.0* 4.0* 229* 32 Two or more races 15.0* 39.0 35.0* 11 245* 30
Source: U.S. Department of Education, Institute of Education Sciences, National Center for Education Statistics, National Assessment of Educational Progress (NAEP), 2017 Mathematics Assessment.

10 | NEXO FALL 2019
Latino Education ProfiLE in thE u.S. and Michigan
In 2017, Latino 4th graders in Michigan, on average, scored 19 points lower than their White counterparts in mathematics (Table 8). In comparison, African American 4th graders in Michigan scored 31 points lower than their White classmates in mathematics. In contrast, Asian 4th graders in Michigan, on average, scored 19 points higher than their White classmates in mathematics.Table 8. Percentages at each Achievement Level and Average NAEP Composite Score for Fourth Grade Mathematics by Race/ethnicity in Michigan, 2017
Race/Ethnicityϯ
Achievement Levels
Mean
Standard Deviation
Below Basic
Basic
Proficient
Advanced
Michigan 25.0 39.0 28.0 7.0 236 33 White 17.0 41.0 34.0 8.0 242 29 Black/African American
55.0* 36.0 9.0* 1.0 211* 29
Latino/Hispanic 39.0* 43.0 15.0* 4.0 223* 30 Asian 9.0 21.0* 41.0 29.0* 261* 34 Two or more races 24.0 37 26 12 239 34
Note: * p < 0.05 (average scale score significantly different from that of White (reference group). Ϯ Data for Indian/Alaska Natives and Native Hawaiian/Other Pacific Islanders were not reported because they did not meet statistical reporting standards. Source: U.S. Department of Education, Institute of Education Sciences, National Center for Education Statistics, National Assessment of Educational Progress (NAEP), 2017 Mathematics Assessment.
In 2017, 19% of Latino 4th graders in Michigan scored at proficient or advanced levels in mathematics, compared to 42% of White 4th graders (Table 8). Comparatively, 10% of African American 4th graders and 70% of Asian 4th graders in Michigan scored at proficient or advanced levels.
In 2017, Latino 8th graders scored 24 points lower than their White counterparts in mathematics on average (Table 9). In comparison, African American 8th graders scored 33 points, American Indian/Alaska Natives 26 points, and Native Hawaiian/Other Pacific Islanders 19 points lower than White classmates. In contrast, Asian 8th graders scored 19 points higher than their White classmates in mathematics on average.Table 9. Percentages at each Achievement Level and Average NAEP Composite Score for Eighth Grade Mathematics by Race/ethnicity in the United States, 2017
Race/Ethnicity
Achievement Levels
Mean
Standard Deviation Below
Basic
Basic
Proficient
Advanced United States 30.0 36.0 24.0 10.0 283 39 White 20.0 37.0 31.0 13.0 293 36 Black/African American 53.0* 34.0* 11.0* 2.0* 260* 34 Latino/Hispanic 43.0* 37.0 16.0* 4.0* 269* 35 Asian 12.0* 24.0* 32.0 32.0* 312* 40 American Indian/Alaska Native 44.0* 38.0 14.0* 4.0* 267* 35 Native Hawaiian/Other Pacific Islander 36.0* 39.0 18.0* 6.0* 274* 37 Two or more races 27.0* 36.0 25.0* 13.0 287* 38
Note: * p < 0.05 (average scale score significantly different from that of White (reference group). Source: U.S. Department of Education, Institute of Education Sciences, National Center for Education Statistics, National Assessment of Educational Progress (NAEP), 2017 Mathematics Assessment.
In 2017, 20% of Latino 8th graders scored at proficient or advanced levels in mathematics, compared to 44% of White 8th graders (Table 9). Comparatively, 13% of African American, 18% of American Indian/Alaska Native, 24% of Native Hawaiian/Other Pacific Islander, and 64% of Asian 8th graders scored at proficient
or advanced levels in mathematics.In 2017, Latino 8th graders in Michigan, on average, scored
22 points lower than their White counterparts in mathematics (Table 10). In comparison, African American 8th graders in Michigan scored 36 points lower than their White classmates in mathematics. In contrast, Asian 8th graders in Michigan scored 27 points higher than their White classmates.Table 10. Percentages at each Achievement Level and Average NAEP Composite Score for Eighth Grade Mathematics by Race/ethnicity in Michigan, 2017
Race/Ethnicity
Achievement Levels
Mean
Standard Deviation
Below Basic
Basic
Proficient
Advanced
Michigan 33.0 35.0 22.0 9.0 280 39 White 26.0 38.0 27.0 10.0 286 36 Black/African American 67.0* 24.0* 8.0* 1.0 250* 32 Latino/Hispanic 48.0* 36.0 12.0* 3.0 264* 35 Asian 12.0 22.0 27.0 38.0* 313* 45 Two or more races 40.0* 38.0 16.0 6.0 270* 39
Note: * p < 0.05 (average scale score significantly different from that of White (reference group). Ϯ Data for Indian/Alaska Natives and Native Hawaiian/Other Pacific Islanders were not reported because they did not meet statistical reporting standards. SOURCE: U.S. Department of Education, Institute of Education Sciences, National Center for Education Statistics, National Assessment of Educational Progress (NAEP), 2017 Mathematics Assessment.
In 2017, 15% of Latino 8th graders in Michigan scored at proficient or advanced levels in mathematics, compared to 37% of White 8th graders (Table 10). Considering other racial groups, 9% of African American and 65% of Asian 8th graders in Michigan scored at proficient or advanced levels in mathematics.
In 2015, Latino 12th graders scored 21 points lower than their White counterparts in reading (Table 11). Comparatively, African American 12th graders scored 30 points and American Indian/Alaska Natives 22 points lower than their White classmates. In 2015, 25% of Latino 12th graders scored at proficient or advanced mathematics, compared to 31% of White 12th graders. In comparison, 7% of African American 12th graders scored 7%, American Indian/Alaska Native 10%, and Asian 12th graders 48% at proficient or advanced mathematics.Table 11. Percentages at each Achievement Level and Average NAEP Composite Score for Twelfth Grade Mathematics by Race/ethnicity in the United States, 2015
Race/Ethnicityϯ
Achievement Levels
Mean
Standard Deviation
Below Basic
Basic
Proficient
Advanced
United States 38.0 37.0 22.0 3.0 152 34 White 27.0 41.0 28.0 3.0 160 32 Black/African American 64.0* 29.0* 7.0* ϯ 130* 31 Latino/Hispanic 53.0* 35.0* 11.0* 1.0* 139* 32 Asian 21.0* 32.0* 38.0* 10.0* 171* 35 American Indian/Alaska Native 54.0* 36.0 10.0* ϯ 138* 29 Two or more races 33.0 36.0 27.0 4.0 157 34
Note: * p < 0.05 (average scale score significantly different from that of White (reference group). Ϯ Reporting standards not met. Native Hawaiian/Other Pacific Islander were not reported because they did not meet the statistical reporting standards. Source: U.S. Department of Education, Institute of Education Sciences, National Center for Education Statistics, National Assessment of Educational Progress (NAEP), 2015 Reading Assessment.
In 2018, Latino 11th graders scored, on average 53, points lower than their White counterparts in mathematics (Table 12). Comparatively, African American 11th graders scored, on

NEXO FALL 2019 | 11
NEXO FALL 2019
average, 89 points, American Indian/Alaska Natives 46 points, and Native Hawaiian/Other Pacific Islanders 15 points lower than their White classmates. In contrast, Asian 11th graders scored, on average, 91 points higher than their White classmates. In terms of proficiency levels, 21% of Latino 11th graders scored at proficient or advanced levels in ELA, compared to 43% of White 11th graders. In comparison, 10% of African American 11th graders, 25% of American Indian/Alaska Native, 37% of Native Hawaiian /Other Pacific Islander, and 69% of Asian 11th graders scored at proficient or advanced in mathematics.Table 12. Percentages of Eleventh Grade Michigan Students at Advanced/Proficient Levels and Mean Scale Score of Mathematics by Race/Ethnicity, 2018
Jurisdiction by Race
Percent Proficient/ Advanced
Mean Scale
Score
Standard Deviation
Michigan 36.9 494.8 108.0 White 42.7 509.5 103.1 Black or African American 10.1 420.3 79.8 Latino or Hispanic 21.4 456.5 91.5 Asian 69.1 600.5 137.0 American Indian/Alaska Native 25.2 463.5 90.9 Native Hawaiian/Other Pacific Islander 37.4 494.3 106.5 Two or more races 32.8 485.1 108.8
Source: Michigan Department of Education. https://www.michigan.gov/mde
High School completion and dropoutIn 2018, 81% of high school students in Michigan (4-year
2018 graduation cohort) graduated on time with a regular diploma (Table 13). Asian students had the highest graduation rate (91%), followed by Native Hawaiian/Other Pacific Islanders (87%), Whites (84%), Latinos (74%), and American Indian/Alas-ka Natives and African Americans (70%).Table 13. Graduation Cohort Graduation Rate by Race/eth-nicity in Michigan, 2018
Race/Ethnicity
Total Cohort Number of Graduates
Graduation Rate
Total 122,244 98,583 80.6 White 83,718 70,222 83.9 Black/African American 21,875 15,308 70.0 Latino/Hispanic 8,293 6,168 74.4 Asian 3,973 3,623 91.2
Native Hawaiian/Other Pacific Islander 152
132
86.8
American Indian/Alaska Native 840 589 70.1 Two or More Races 3,393 2,541 74.9 Source: https://www.mischooldata.org/DistrictSchoolProfiles2/StudentInformation/GraduationDropoutRate3.aspx
The 4-year dropout rate is defined as the percentage of public high school students in Michigan who, after beginning the 9th grade four years previously, dropped out of school without completing the requirements of a high school diploma. In Michigan, 9% of all high school students (4-year 2018 graduation cohort) in the 2017-2018 school year dropped out before completing the requirements to graduate. American Indian/Alaska Native and African American students in Michigan had the highest dropout rate (14%), followed by Latino (13%), Native Hawaiian/Other Pacific Islander (8%), White (7%), and Asian (4%) students (Table 14).Table 14. Graduation Cohort Dropout Rate by Race/Ethnicity, Michigan, 2018
Race/Ethnicity Total Cohort Number of Dropouts Dropout Rate Total 122,244 10,668 8.7 White 83,718 5,812 6.9 Asian 3,973 154 3.9 Black/African American 21,875 3,116 14.2 Latino/Hispanic 8,293 1,045 12.6 Native Hawaiian/Other Pacific Islander 152 12 7.9 American Indian/Alaska Native 840 119 14.2 Two or More Races 3,393 410 12.1 Source: https://www.mischooldata.org/DistrictSchoolProfiles2/StudentInformation/GraduationDropoutRate3.aspx
The status dropout rate is defined as the percentage of 16- to 24-year old civilians living in housing units who are not enrolled in school and have not earned a high school diploma or equivalent. In 2017, the percentage of 16-24 year old civilians who were dropouts was estimated at 6% (Table 15). The status dropout rate was highest among American Indian/Alaska Natives (11.2%), followed by Latinos (9.7%), African Americans (6.6%), Whites (4.7%), and Asians and Native Hawaiian/Other Pacific Islanders (2.7%).Table 15. Status dropout rates by Race/Ethnicity in the United States, 2017 (Numbers in thousands. Civilian noninstitutionalized population age 16 – 24 years)
Race/Ethnicity
Population Number of Dropouts
Dropout Rate
Total 32,043 1,936 6.0
White 17,446 819 4.7
Black/African American 4,267 281 6.6 Latino/Hispanic 7,306 711 9.7 Asian and Native Hawaiian/Other Pacific slander 1,731 47 2.7
American Indian or Alaska Native 233 26 11.2
Some Other or Two or more Races 1,061 52 4.9 Source: U.S. Census Bureau, 5–Year American Community Survey, 2013-2017.
Enrollment statusIn 2017, 40% of 18-24 year olds were enrolled in 2- to 4-year
colleges. Among those 18-24 year olds who were enrolled in colleges, Asians had the highest enrollment rate (62.8%), followed by Whites (41.0%), Latinos (36.2%), and African

12 | NEXO FALL 2019
Latino Education ProfiLE in thE u.S. and Michigan
Americans (35.8%) (Table 16).Table 16. Enrollment Status in Two- to Four-Year Colleges in the United States by Race/Ethnicity, 2017 (In 1000s. Civilian noninstitutionalized population age 18-24 years)
Race/Ethnicity Population Number Percent
Total 29,538 11,937 40.4 Non-Hispanic White 15,945 6,544 41.0 Black/African American 4,458 1,595 35.8 Latino/Hispanic 6,653 2,410 36.2 Asian 1754 1101 62.8
Source: U.S. Census Bureau, Current Population Survey, School Enrollment Supplement, October 2017.
ConclusionThis article highlights Latino educational attainment and
achievement as compared to other racial groups in the United States and Michigan. Latinos remain among the least educated racial/ethnic groups in both the United States and Michigan, along with African Americans and American Indian/Alaska Natives. In sharp contrast, Asians, followed by Whites are the most educated racial/ethnic groups. What is striking is that these racial/ethnic educational inequalities exist at all levels of the schooling system: elementary school (4th grade), middle school (8th grade), high school (11th or 12th grades), and college. This suggests that most of the underlying causes of racial/ethnic achievement gaps lie within the stratified school system itself. Educational system reform to reduce racial/ethnic achievement gaps is undoubtedly warranted. It will require investments in school resources and teachers, interventions at various school levels, and most importantly concerted efforts and policy chang-es at local, state, and federal governments to transform educa-tion systems into effective systems.
ReferencesAud, S., Fox, M., & KewalRamani, A. (2010). Status and trends in the
education of racial and ethnic groups (NCES 2010-015). US Department of Education. National Center for Education Statistics. Washington, DC: U.S. Government Printing Office, 101, 695-725.
Coleman, J.S., Campbell E., Hobson C., McPartland J., Mood A., Weinfeld F., & York R. 1966. Equality of Educational Opportunity. Washington, DC: U.S. Department of Health, Education, and Welfare.
Schneider, B., Martinez, S., & Owens, A. (2006). Barriers to educational oppor-tunities for Hispanics in the United States. Hispanics and the future of America, 179-227.
United States Census Bureau. (2018a). 2013-2017 American Community Sur-vey 5-Year estimates. Washington, D.C.: U.S. Bureau of the Census..
United States Census Bureau. (2018b). Projected race and Hispanic origin: main projections series for the United States, 2017-2060. U.S. Census Bureau, Population Division: Washington, D.C.
On September 13, Susan Santone, Adjunct Instructor at the University of Michigan and CEO of Creative Change, presented at the Friday Forum, a symposia series focusing on neoliberalism and public higher education. Ms. Santone’s presentation was titled “Getting Down to Business: How Neoliberalism is Eroding the Democratic Mission of K-12 Education.” She highlighted the importance of educating children and youth to design the futures they want. In contrast, public education has been reshaped to integrate students into an economic system that demands privatization of government functions and economic competitiveness. She noted the achievement gaps across ethno-racial and socioeconomic groups, and highlighted the importance of socioeconomic status (SES) as a significant factor related to the achievement gap; namely, poverty. Schools in poverty areas are less likely than their higher SES counterparts to have experienced teachers, access to advanced courses, and adequate resources. Further, they are more likely to have cultures of low expectations, narrow curricula, disproportionate discipline, and exposure to toxins.
How did we get to this level of inequality in public education? Santone noted the shift in emphasis from student learning to global competitiveness, beginning with the report A Nation at Risk (1983), and continued with No Child Left Behind (2001). In short, the reports emphasized economic competitiveness and preparing students for jobs in modern industry. The approaches employed to do this included standards and accountability (e.g., testing), private-public partnerships, school choice, and charter schools. In short, market-based reforms. Yearly school progress reports were embedded in a punishment framework that included severe sanctions for underperforming schools. Rather than investing in schools in poverty neighborhoods, they were punished for outcomes that were shaped by socioeconomic factors beyond their control. Today we have charter schools that, in most cases, do not perform as well as public schools.
Neoliberalism and Public Education

NEXO FALL 2019 | 13
NEXO FALL 2019
Agricultural work is backbreaking. Despite it being classified as unskilled labor, it takes the right skill sets to pick fruits and other crops correctly, while it takes tremendous endurance to sustain oneself in the rigorous elements such as the intense heat, humidity, or muck and not to mention the long, painful, and monotonous hours. Yet, the desired skills listed on jobsites for farmworkers simply include “listening to others, not interrupting, and asking good questions.” Dependability and willingness to perform a job at low pay are also standard requirements for farmworkers. Given the low wages and the labor intensive work, Americans are hardly interested in performing farm work for a living. Thus, American farm companies rely on domestic migrant workers, H-2A workers (contracted temporary foreign guest workers), and on unauthorized foreign workers to produce and harvest crops that feed the nation.
Many people do not realize that the H-2A guest worker program is currently used in the agricultural sector. This is not the first time the U.S. has imported guest workers to work the nation’s fields. In reaction to the shortage of farmhands left in the country during World War II, the U.S. launched the Bracero Program, partnering with the government of Mexico, which agreed to help by sending its citizens to help keep the U.S. fed. By 1964, the voices of critics who saw the dangers and exploitation of the program became loud enough and the government ended the program. The Immigration Reform and Control Act of 1986 created the H-2A visa, designating it strictly for agricultural employment. A foreign workforce was needed to supplement domestic and migrant farm labor as traditional farmworkers were aging, settling out of the migrant farmworker stream, and seeking other employment opportunities. The expansion of the H-2A program in the last two decades is representative of the labor shortage in the agriculture sector and the heightened hysteria created by the rise of ICE and anti-immigration rhetoric that has become prevalent. Small
farmers are impacted by the increase of H-2A workers and the decline of domestic farmworkers as they are not able to afford the higher costs of processing legally contracted guest workers (Contratados). Corporations and agribusiness, on the other hand, can afford H-2A workers.
Over ninety-four percent of the nearly 250,000 H-2A workers come from Mexico and before entering the country face exploitation and abuse. By law, H-2A workers are excluded from paying any recruitment fees; however, due to the many discrepancies that exist in the program (being transnational), many often enter the U.S. heavily indebted to unscrupulous and ruthless intermediate recruitment organizations. Once they arrive in the U.S. they are tied to one employer and have no other recourse than to accept less than ideal working conditions and/or other abuses to pay for the debt they have incurred. Due to their desperate economic conditions, where almost half of H-2A workers have taken out loans to cover expenses, they are willing to enter the U.S. and perform whatever work is asked of them.
Due to the recent, rapid growth of the H-2A program, government agencies such as the Department of Labor, the Department of State, the Department of Justice, the Department of Homeland Security’s U.S. Citizenship and Immigration Services (USCIS), along with ICE, are currently overwhelmed and are not able to provide proper oversight of the program. Not surprisingly, this leads to abuses and exploitation of H-2A workers. This has forced states such as Washington in 2019 to pass House Bill SB 5438 which establishes an office to monitor farms using H-2A labor. Critics of the program and former H-2A workers have gone as far as calling it “Modern Day Slavery.” Further investigations are needed to ensure that the rights of laborers are protected, that all benefit from American agribusiness, and that healthful foods continue to be on the dinner table without the exploitation of workers.
H-2A Workers Help Feed the Nation

14 | NEXO FALL 2019
NEXO FALL 2019 ¿Qué Está pAsANdO EN EL INstItutO?
JSRI Celebrates 30 Years of Research and Service
in 1985. Dr. Samora, along with Ernesto Galarza and Herman Gallegos, founded the Southwest Council of La Raza, the precursor to the National Council of La Raza, a leading national Latino advocacy organization, recently renamed UnidosUS. Thirty years on, JSRI remains committed to Dr. Samora’s ideal of conducting research that contributes to the well-being of Latina/os, their families, and communities.
JSRI has prospered under the leadership of Richard Navarro (Founding Director, 1989-1993), the late Joseph Spielberg Benitez (1993-1995), Refugio I. Rochin (1995-1998), the late Jorge Chapa (1998-1999), Rene Hinojosa (1999-2002), the late Isráel Cuéllar (2002-2004), Dionicio Valdes (2004-2005), Francisco Villarruel (2006-2007), and currently Rubén O. Martinez (2007-present). Over the years, JSRI has worked closely with community, state, and non-profit organizations on issues critical to Latina/o communities. It has also developed research ties with academic institutions in the Midwest and beyond to promote interstate research initiatives.
Between 2009 and 2011, JSRI pioneered a series of state-wide summits on Latino issues that identified and prioritized the challenges facing Latinos in Michigan. Following those initial summits, JSRI held topic-specific summits on Latina/o education (2011), health (2014), business and entrepreneurship (2015), and media (2016), and a regional summit in Grand Rapids (2016). The topic of civic engagement morphed into a series of three statewide summits (2017, 2018, and 2019) under the banner, “Promoting Latino and African American Collaboration through Dialogue and Engagement.” The series was designed to culminate in the formation of an advocacy organization that promotes intergroup collaboration and harnesses the collective power of communities of color in Michigan to create a more just, equitable, and inclusive society.
In these times of political turmoil, domestic terrorism, and what appears to be societal decay, JSRI continues to conduct research on critical issues to inform policy solutions that will lead to the betterment of all communities.
From October 31st to November 2nd of this year, the Julian Samora Research Institute (JSRI) will mark its 30th anniversary with a national conference on the theme “Latina/os and the Renewal of U.S. Democracy.” The conference will feature panels and workshops on numerous topics related to the conference theme by scholars from across the U.S. studying Latina/o issues, as well as by representatives of Latino-serving organizations. There will also be plenary addresses, film screenings, and two musical events.
JSRI was established in 1989 by the Michigan State University Board of Trustees to address the absence of systematic information and knowledge on Latina/o communities in the Midwest. At the time of its founding, JSRI had five focus areas: employment development, education, political empowerment, health and family welfare, and cultural awareness and enrichment. Today, JSRI remains committed to the original mandate of its founders through research, community outreach initiatives, and student mentorship. In service to its mission of generating, disseminating, and applying knowledge for the improvement of Latino communities in the Midwest and across the nation, JSRI’s current focus areas are health disparities, business ownership and entrepreneurship, and gaps between service delivery systems and Latino communities.
JSRI is named for Dr. Julian Samora, a pioneering Mexican American sociologist whose research focused on Latino issues in the Midwest. Dr. Samora taught at Michigan State University from 1957 to 1959, after which he joined the faculty at the University of Notre Dame, where he remained until his retirement
“Latina/os and the Renewal of U.S. Democracy”October 31 - November 2, 2019

NEXO FALL 2019 | 15
NEXO FALL 2019¿Qué Está pasaNdO EN El INstItutO?
Today’s extreme political polarization has penetrated most institutions, from the family to higher education. Indeed, higher education is perhaps the last societal institution to feel the intensity of today’s political struggles. Recent polls show that Americans are sharply divided along political party lines with regard to higher education. Those divisions occur in terms of the value of a higher education, its political influences, and who should bear the costs, to name just a few dimensions.
Higher education has positive effects on the individual, the family, organizations, and society at large. Individuals with degrees have grown in terms of personal development, knowledge, and technical skills. They have, in general, developed their human faculties beyond those of individuals with a high school education or less. To be sure, educated persons enhance the operations and development of organizations, whether public or private. Educated employees enable private organizations to compete more effectively in the economy, and the economy and society benefit from an educated population.
Differences in perspectives regarding higher education tend to align along political party lines, with Republicans more likely to hold negative views of higher education than Democrats. While Republicans tend to believe that colleges and universities have a negative influence on what is going on in society, Democrats believe that these institutions have a positive effect on society. Both, tend to view colleges as doing well in preparing students for the workforce, and that success in life is easier with a college degree. However, they tend to differ on the purpose of a college education, with Republicans more likely to emphasize specific skills, and Democrats more likely to emphasize personal growth.
The divisions regarding the political influences of a higher education center on the differences between liberal and conservative perspectives. Conservatives hold the view that universities are filled with liberal professors who impose their views on students. They also claim that conservative perspectives are undertaught in colleges and universities because conservative faculty members are a numeric minority in the academy. Democrats, on the other hand, are more likely to have confidence that faculty members act in the public interest.
The costs of a college education have increased considerably in recent decades at the same time that states have decreased funding for college and universities. Concomitantly, student debt has seen dramatic growth, reaching more than a trillion dollars a few years ago. Moreover, public colleges and universities today receive the majority of their revenue from
tuition rather than from government funds. The reason states have cut funding to colleges and universities is related to the question as to who should pay for a college education.
Some might argue that increasing Medicare and incarceration costs have necessitated funding cuts to higher education, but the matter is more complicated than that. It involves funding priorities, and cuts to government revenues through repeated tax cuts. These cuts are part of a free market fundamentalist movement that demands small government, and which forces reduction in government size through tax cuts. This movement has redefined higher education from a public good to a private good. As such, it is the individual who benefits from a college education, and it is the individual who should pay for it.
Confidence in higher education has decreased sharply in recent years. Both Republicans and Democrats believe that higher education is moving in the wrong direction. Both believe that tuition costs are too high, but differ on whether students are getting the skills needed for occupational success, overprotection of students from perspectives they might find offensive, and faculty taking their political views into the classroom. Republicans are more likely to view these issues as reasons why higher education is moving in the wrong direction.
Americans recognize that access to higher education is decreasing, especially due to costs. There are other reasons, however, why access is decreasing, and these include rising admissions standards and the shift in the uses of financial aid. Admissions processes are used to improve the quality of the student body to meet demands for improved institutional status, rank, and prestige, even as the processes are increasing inequalities in society. The same is occurring with financial aid, which has shifted from meeting financial need to rewarding merit, which is a function of socio-economic differences.
Polarized perspectives on higher education are embedded in the broader political ideologies that divide Americans. As the demographic shift continues to unfold, overall enrollments in higher education will continue to decline, but enrollments of students of color will continue to increase. The question that remains is whether the problem of access will be addressed. Recently, cities have begun to establish “promise” programs that cover some or all of the costs of a college education; some universities have developed programs to provide access to students who meet achievement standards but lack the resources to pay the costs; and at least one state, New Mexico, is attempting to offer free tuition to all its students.
Political Divisions and Higher Education

16 | NEXO FALL 2019
NEXO FALL 2019 ¿Qué Está pAsANdO EN EL INstItutO?
JSRI Scholarship Recipients 2019-2020
Angelica Ruvalcaba is a second year dual Ph.D. student in the Department of Sociology and the Chicano/Latino Studies Program. She obtained her Bachelor of Arts in Sociology in May 2017 from Texas A&M University. Her research interests are Latina/o sociology, sociology of education, racial and ethnic minorities and migration. Her research focuses on the
experiences of Latinx undergraduate students at predominantly White institutions in the Midwest. She serves as a student leader of the sociology collective within the Department of Sociology and as a representative for the Chicano/Latino Studies Program on the Graduate Dean’s Student Advisory Council for the College of Social Science.
Carla Castillo is studying anthropology with double minors, one in Chicano/Latino Studies and the other in International Development. Her cultural background is Mexican, so her first language is Spanish, and she taught herself English. She plans to focus on indigenous populations in Latin America to help preserve their traditions, rituals and language. She
believes in continuing the traditions of communities.
Alexa Delon is a freshman at Michigan State University majoring in Global Studies in the Arts and Humanities Program, with a minor in Korean Studies. She is from Kalamazoo, Michigan, residing in East Lansing during the school year. She participates in the Citizen Scholars Program in the College of Arts and Letters, and participates in various
community service projects throughout the year. She plans to go to South Korea through the study abroad program. Her goal after graduation is to travel to many regions of the world to gain a better understanding of the different cultures.
New Faces
Send OffsJuan D. Coronado was a post-doctoral scholar at JSRI since 2015. He is a historian with specializations in U.S. History, Chicana/o history, and public history. While at JSRI he published his book “I’m Not Gonna Die in This Damn Place”: Manliness, Identity, and Survival of the Mexican American Vietnam Prisoners of War through the MSU Press. Dr. Coronado recently
assumed a tenure-track position in the Department of History, Central Connecticut State University. There, he is teaching Latino Studies courses and American History, including military history. While at JSRI, which is housed in UOE, he entered and won several chili contests. We shall miss his cordial smile, outgoing personality, thoughtfulness, intellectual contributions, and his chili-making skills. Adelante, Coronado!
Nabih Haddad was a research associate at JSRI while working on his doctorate in the HALE Program, MSU College of Education. He recently received the doctorate and assumed a post-doctoral position at the University of Michigan. There he will continue his research on the influence of philanthropic organizations on higher education by focusing on their grant-
making activities, especially funding intermediary organizations to carry out projects that reflect their priorities. His work on the Black Brown Dialogues will be missed, as will his intellectual curiosity, and his sharing of Lebanese cuisine and culture. We wish him a great scholarly career!
Jocelyn Janicek departed JSRI after two stints. Her first began when she joined MSU through JSRI as an external hire, served a few years, left to work at another unit, then returned for a second stint. She recently assumed the position of Executive Secretary at the newly created Office of Civil Rights. Her friendly smile, organizational skills, and detailed reports will be sorely
missed. We wish her a great career at MSU. Go Green!

NEXO FALL 2019 | 17
NEXO FALL 2019¿Qué Está pasaNdO EN El INstItutO?
On September 6, 2019, the Julian Samora Research Institute hosted the third and final summit in its Black/Brown Dialogues summit series. The series fostered dialogue and collaboration among Michigan’s Latina/o and African American communities, as well as other communities of color, and envisioned a more just, equitable, and inclusive society.
Each summit had its own distinct themes. The first event set in motion a communicative platform for dialogues among communities of color in Michigan. It provided an overview of common barriers these communities face relative to social integration and the necessary steps for achieving a common ground. The second summit focused on generating a unifying vision to guide the collaborative efforts moving forward, bringing together members of Michigan’s Latina/o, African American, Arab American, Native American, and Asian American communities. The final summit focused on establishing a systematic platform to promote sustainable intergroup collaboration across organizations and societal sectors.
Dr. Rubén Martinez, Director of JSRI, opened the event with the basic premise that Michigan is our state, too. Whereas historically institutions and government have not worked for all populations, increased collaboration between Black and Brown communities, inclusive not only of Latina/os and African Americans but of all people of color, will give communities of color a stronger voice in reshaping our cities, state, and nation.
The summit also featured addresses from Dr. Roberto Dansie, CEO of Cultural Wisdom, Dr. Abdul El-Sayed, Chair of Southpaw Michigan, and Sylvia Puente, Executive Director of the Latino Policy Forum. Dansie spoke of the value of incorporating Native wisdom into efforts to build Black/Brown solidarity. El-Sayed highlighted the importance of intersectional empathy in moving toward a more perfect understanding of “We, the people.” Puente offered practical advice for Black/Brown advocacy organizations based on the experiences of the Latino Policy Forum’s Multicultural Leadership Academy.
Members of a panel discussed trust building across intercultural, intergenerational, and class lines. Members of the Detroit Black and Brown Theatre performed a one-act play and then dialogued with the audience.
Participants at the summit took part in a table activity to discuss indicators of how life is getting better and/or worse for Black and Brown communities in Michigan. Several themes emerged, including a crisis of acceptance of diversity, of which the current federal administration is representative; at the same time, the election of Donald Trump served as a wake-up call for communities of color and their allies to organize collectively. Participants also noted voting rights and gerrymandering, gentrification, and declining educational opportunities and attainment as negative indicators, whereas increased representation of people of color in elected office and more intentional collaboration across communities of color were offered as positive indicators. Participants were also asked to draft a narrative of how to make Michigan more inclusive, and themes included an embrace of our common histories, increased cultural awareness, recognition that collaboration is not a zero sum game, and statewide policies and laws that intentionally address diversity, equity, and inclusion.
At the end of the day, Dr. Martinez introduced the members of the Black/Brown Dialogues founding committee, who are charged with building a sustainable organization that will carry on the vision generated through the summit series of a more just, equitable, and inclusive Michigan. Members of the founding committee include Mark Fancher of the ACLU of Michigan, MSU doctoral student Joy Hannibal, Tedda Hughes of REACH Art Studio, Marvin McKinney of University Outreach and Engagement at MSU, Angela Reyes of the Detroit Hispanic Development Corporation, Gabriela Santiago-Romero of the Michigan Center for Civic Education, Don Weatherspoon (retired), and Asa Zuccaro of the Latinx Technology & Community Center. JSRI is committed to assisting in an advisory capacity in the formation of the advocacy organization.
Black Brown Dialogues Summit III: Harnessing our Potential

18 | NEXO FALL 2019
NEXO FALL 2019 ¿Qué Está pAsANdO EN EL INstItutO?
Symposia on Genocide held at MSU On April 19-20, 2019, the Rwandan community at
Michigan State University (MSU) held two events: (1) The International Symposium on Genocide, and (2) the 25th Commemoration of Genocide against Tutsi in Rwanda. The theme of the International Symposium on Genocide was “Confronting the Past and Understanding the Present.” Twenty-three interdisciplinary and international scholars on genocide discussed and shared their knowledge and practical experiences on the causes and consequences of genocide, as well as on societal transformations after the genocide. Speakers focused on three main genocides: The Holocaust, the Armenian Genocide, and the Genocide against the Tutsi in Rwanda, and highlighted the larger social, historical, political, and legal contexts of and social processes of genocide. These included survivors’ perspectives; genocide education; consequences of genocide, including sexual assault/rape, trauma and mental health; and issues of remembrance, denial and revisionism, transitional justice, reconciliation and forgiveness, and post-genocide social cohesion.
April 2019 marked 25 years since the 1994 Genocide against Tutsi in Rwanda. At MSU, like elsewhere around the world, we organized the 25th Commemoration of Genocide against the Tutsi in Rwanda to remember, honor, and recognize our loved ones who perished in that tragedy, support survivors, look toward a future of healing and hope, and to reaffirm the United Nations’ commitment of “Never Again” genocide. In 1994, an estimate of over one million people, mostly Tutsi, were slaughtered in 100 days by Hutu extremists, the then government, army, militias called INTERAHAMWE, and ordinary people.
Dr. Laurie Van Egeren, Acting Associate Provost for University Outreach and Engagement kicked off the symposium and welcomed all participants at MSU. She said, “We are here today and tomorrow at the 25th Commemoration of Genocide
against the Tutsi in Rwanda to share this history, honor those who died, support survivors, and explore ways we can prevent future tragedy.”
Zachary D. Kaufman, in his keynote address, highlighted ten lessons from the Genocide against the Tutsi in Rwanda: (1) the dangers of hate speech; (2) the possibility of atrocity prevention; (3) the importance of justice and accountability; (4) promotion and representation of women’s rights; (5) the necessity of genocide education; (6) combatting the denial of genocide; (7) the importance of self-reliance; (8) ongoing support for survivors; 9) the necessity of upstanderism; and (10) fulfillment of “Never Again”.
Dr. Satish Udpa reminded us of the bitter legacies of colonialism that often underlie such tragedies. These include “long-term consequences of exploiting social divisions to conquer or control, a practice that continues to pass a shadow on the post-colonial world to this day. Examples of such exploitation occurred not only in Rwanda, but also in far reaching places such as Sri Lanka, where brother is pitted against brother and brother is pitted against sister, all in the name of tribalism or religion.” Even today, he indicated: “We hear language of divisions and dehumanization come from those in power even in this part of the world.” He further noted, “Human kind has made a lot of progress in our times in terms of standards of living and other measures. But, we as a society, we still need to look very hard at our actions and motivations. We need to understand the long-term effects of short-term tribal thinking.” He concluded his remarks by saying: “I realize some in the audience have lost loved ones, others have suffered a great deal, and some are survivors of that genocide. We grieve with you, unite with you, work with you, and together we look to the future as we commemorate the past.”
The guest of honor for the 25th Commemoration of Genocide against the Tutsi was Professor Mathilde Mukantabana, Ambassador Extraordinary and Plenipotentiary of the Republic

NEXO FALL 2019 | 19
NEXO FALL 2019¿Qué Está pasaNdO EN El INstItutO?of Rwanda to the United States of America, and non-resident Ambassador to Mexico, Brazil, and Argentina. Ambassador Mathilde noted that:
Rwanda’s political leaders pursued a policy of vilification and dehumanization aimed at Tutsi population that laid the groundwork for genocide. The media, both public and private, eagerly propagated the idea that Rwandans of Tutsi descent were somehow enemies within—even less than human—and that to kill them was an act of patriotism. In other words, the 1994 genocide against the Tutsis may have shocked the world in its scale and ferocity, but it was not a sudden or unpredictable eruption of savage violence.
Quoting Zach Kauffman, she said, “Never Again” is an unfulfilled platitude uttered again and again. Conflict continues to rage on in this world. She asked: “What have we learned from the genocide to better equip us to save innocent lives?” Quoting the President of Rwanda, Paul Kagame, during the 20th commemoration in 2014, she said: “Historical clarity is a duty of memory that we cannot escape. Behind the words ‘Never Again,’ there is a story whose truth must be told in full, no matter how uncomfortable.” She added: “Memory serves as a barometer of how far we have come and where we need to go. This is why we remember. Not to dwell on the past, but for it to inform a better future.”
Honoring memory has been imperative for peace, unity, and development. Ambassador Mathilde ended her remarks by addressing young people, saying that they are Rwanda’s future. She invited them and others to embrace memory, hold fast to tradition, build strong bonds of human solidarity, learn and teach, and above all strive to leave this world a better place than they found it.
The International Symposium on Genocide and the 25th Commemoration of Genocide against the Tutsi were organized by Dr. Jean Kayitsinga, Dr. Jean Pierre Nshyimyimana, and MSU students. The events received sponsorship and support by the Office for Inclusion and Intercultural Initiatives, University Outreach and Engagement, International Studies & Programs, Year of Global Africa, African Studies Center, Honors College, College of Education, Jewish Studies Center, the Julian Samora Research Institute at MSU, and the Rwandan Embassy in the United States. The events were organized in collaboration with the Rwandan American Community in the Midwest (RACM) and the National Commission for the Fight against Genocide in Rwanda (CNLG).
The Trump administration rose to power using anti-immigrant rhetoric targeting Latino immigrants and refugees. Once in office, he set in motion a series of changes in policies and practices that have normalized repression through border controls and created a humanitarian crisis at the nation’s southern border. In the first 100 days of his presidency Trump signed 30 executive orders. The first weakened the Affordable Care Act, the second expedited environmental reviews and approvals for infrastructure projects deemed to be high priority. The third sought to abolish sanctuary cities and denied privacy to non-citizens. The fourth directed federal agencies to secure the southern border and begin planning the construction of a border wall. The fifth barred people from seven Muslim countries from entering the United States for 90 days. So it has been a stream of executive orders that have diminished regulatory practices, restructured government, and targeted immigrants in the name of public safety, and which continue to this day.
Since its initial days in office, Trump’s administration has kept up his negative rhetoric against Latino immigrants and, worse yet, has taken actions to detain those attempting to enter the United States, including those seeking asylum. He has promoted fear among voters by saying that Latino immigrants bring drugs, diseases, crime, the threat of terrorism, and other problems to this country. He never provides evidence, however. Moreover, he ignores the fact that more Americans, including children, die at the hands of domestic terrorists than at the hands of Latino immigrants.
Trump’s regime has separated families, detained children in cage-like facilities, and maintained their incarceration conditions as spartan as possible as a means of deterring others from seeking entry to this country. In many cases, not even providing tooth brushes. Not only are children traumatized by the separation from their families, their basic and education needs go unmet, and their long-term mental health and economic well-being are harmed. These practices, along with the denial of due process for the detained and for asylum seekers, violate basic human rights, and show the world that this nation’s humanitarian policies have been transformed into inhumane policies.
Despite President Trump’s inflammatory rhetoric, polls show that as many as 75% of Americans believe immigration is good. A majority of them believe that immigrants take jobs that Americans do NOT want. They also believe that immigrants make the economy better, oppose building a wall at the southern border, and favor giving undocumented immigrants a path to citizenship.
Immigrants, Human Rights, and U.S. Humanitarian Policy

20 | NEXO FALL 2019
The LimiTaTions LaTinos Face when sTarTing a Business
The Limitations Latinos Face when Starting a BusinessMarcelo Siles
IntroductionIt has generally been difficult for Latinos to start their own
businesses; they need to go through a long process fraught with barriers. These barriers include low educational attainment, lack of previous business or management experience and, among immigrants, lack of English language fluency. Perhaps the most important constraints are insufficient funds to cover the initial and operating expenses and the lack of an extended network of business relationships for viable operations.
This essay addresses the following four questions: 1) What are the main reasons U.S. Latinos and recent immigrants decide to become business owners?; 2) Why are Latino business own-ers reluctant to seek loans from formal financial markets to start their operations?; 3) What are the internal and external factors that prevent Latino business owners from participating in the financial markets?; and 4) What are the internal and external fac-tors that bank and other financial institutions face when working with Latino businesspeople?
Since 1980, the Latino population in the United States has experienced significant growth, outpacing the growth rates for
Whites, Blacks, and Asians. In July 2018, the number of Latinos living in the United States reached 59.2 million, which represents 18.1% of the total U.S. population. Population forecasts show that by 2060 the Latino population will represent 28% of the national population. Similarly, the Latino population has experi-enced steady growth in Michigan, reaching 509.8 thousand in July 2018, representing 5.1% of the state population.
In the last 20 years, the number of Latino-owned businesses (LOBs) has increased considerably. The United States Hispanic Chamber of Commerce estimates that there were over 4.37 million Latino-owned businesses operating in the nation in 2018, while in 2002 the number of LOBs was only 1.57 million. During the period from 2002 to 2018, the number of Latino-owned busi-nesses increased by 2.8 million businesses, reflecting a growth rate of 178.3%.
The rapid growth in the number of LOBs makes them an important component of the nation’s economy. For example, their sales and receipts also experienced an impressive growth of 35.1% only in the last 10 years. With a larger market share, they also created large numbers of new jobs. In Michigan, LOBs,

NEXO FALL 2019 | 21
NEXO FALL 2019
with a solid growth and in the extent of their operations, show the same trend as that at the national level. Clearly, there is a high correlation between Latino population growth and the increase in the number of Latino-owned businesses.
Notwithstanding the solid growth in the number of LOBs and in the scope of their operations both at the national and Michigan levels, their failure rates are very high, reaching more than 50% within the first five years of their business operations. That being the case, it is important to understand the factors that hinder and those that facilitate business success.
There are two well-known reasons that Latinos establish new businesses. The first is the “push effect.” That is, Latinos often have to create their own businesses due to the discrimi-nation they face in the labor market. Immigrants especially lack supportive networks that facilitate information regarding job openings and referrals to potential employers. Mexican and Cen-tral American immigrants are particularly subject to discrimination and have to create their own businesses to support their families.
On the other hand, this is not the case for Cuban and South American immigrants who arrive in this country with relatively high levels of education, previous business experience, extend-ed business networks in the United States and abroad, and with enough financial funds to start up a new business. This approach is known as the “pull effect.” They seek opportunities in the market to make investments for the creation of new businesses. These Latino immigrants create a larger number of new busi-nesses than their local counterparts.
According to a report from the Latino Entrepreneurship Initia-tive at the Stanford Graduate School of Business (2017), “Be-tween 2007 and 2012, the growth rate of both non-employer and employer Latino firms nearly outpaced the growth rate of White-, Asian-, and Black-owned firms combined. Without the increased numbers of Latino firms created during that period, the total num-ber of firms in the United States would have decreased” (p. 6). Also the report holds that “Latino businesses are growing at an even faster rate than the U.S. Latino adult population” (p. 7), and that “Latino entrepreneurs exhibit strong enterprising qualities through their engaged networking behaviors, above-average levels of higher education, and strong family histories of entre-preneurship” (p. 9). Further, “Entrepreneurship also allows a vul-nerable segment of this population, undocumented immigrants, to overcome the structural barriers to pursuing employment in the United States . . . federal and state laws do not require proof of immigration status to start a business” (p. 10).
Martinez and Avila (2019) studied the motivations for en-trepreneurship among Latinos and White Americans. Their study found that “Latino business owners ranked one financial
motivation item (gaining financial security for my family) and one self-realization motivation item (utilizing my skills and abilities) as their top motivations for starting a business. By comparison, White business owners ranked two self-realization motivation items as their top motivations for starting a business (gaining the satisfaction of owning a business and utilizing my skills and abilities)” (p. 14). This study also found that “Latino business owners face structural inequalities that often ‘push’ them into business ownership as an approach of circumventing racism and low wages or other barriers to earning a living in the mainstream labor market” (p. 16).
Coronado and Martinez (2018) report, based on a quali-tative study of 32 LOBs in three Michigan cities, some of the challenges they face when starting a business. Among these challenges, the authors cite the lack of access to loans provided by banks and other financial institutions. Other challenges are their language constraints, envy, racial and sexist incidents and how they respond to them, and intragroup competition by fellow Latino entrepreneurs. They also found that “Minority business owners, including Latinos, face significantly higher loan-appli-cation rejection rates and tend to pay higher interest rates than their White counterparts” (p. 53). They also found that “Latinos have depended on unconventional funding sources when start-ing a business. Support from family and friends along with social capital have often been the sources of funding for Latino start-up businesses” (p. 54).
The authors state that “Another concern for Latino business owners is the perceived lack of trust or support within the Latino community itself. Participants spoke of a degree of intra-ethnic competition occurring among Latino business owners” (p. 59). A minority of them “claimed that members of their own group are not always welcoming of other Latino businesses, and believed that envidia [envy] has been directed toward their businesses in different ways” (p. 60).

22 | NEXO FALL 2019
The LimiTaTions LaTinos Face when sTarTing a Business
The distribution of LOBs is not even across the country; these businesses tend to locate in areas with high concentra-tions of Latino population. LOB projections from GEOSCAPE for 2017 show the South Atlantic region with the highest number of Latino firms, 668,000, followed by the Pacific region with 533,000, and the East North Central with 410,000 firms. Cubans and South Americans are concentrated in the South Atlantic region, while Mexicans and Mexican Americans are in the Pacific and East North Central regions.
A report from the Federal Deposit Insurance Corporation (FDIC, 2017) indicates that, “In 2017, 6.5 percent of U.S. house-holds were ‘unbanked,’ meaning that no one in the household had a checking or savings account” (p. 1). Additionally,
18.7 percent of U.S. households were ‘under-banked,’ meaning that the household had an ac-count at an insured institution, but also obtained financial products or services outside of the banking system. Specifically, a household is cat-egorized as underbanked if it had a checking or savings account and used one of the following products or services from an alternative financial service (AFS) provider in the past 12 months. Some of these products or services are money orders, check cashing, international remittances, payday loans, tax refund anticipation loans, rent to own services, pawn shop loans, or auto title loans. (p. 1)
The report also shows that, “unbanked and underbanked rates were higher among . . . Black and Hispanic households” (p. 2).
The FDIC report also states the top reasons that unbanked households indicate for not having a bank account. It states that they “Do not have enough money to keep in an account; don’t trust banks; avoiding banks gives more privacy; account fees are too high and unpredictable; credit or former bank account problems; banks do not offer needed products or services; incon-venient locations and service hours” (p. 4).
Latinos mainly use their household savings as the primary source for starting and developing a business. The FDIC pub-lication reports that, “The savings rate increased substantially among Hispanic households from 42.5 percent in 2015 to 48.2 percent in 2017. Moreover, savings rates among younger households increased more than savings rates among older households” (p. 8). The FDIC report also states that, “Unbanked households generally saved using informal methods, while underbanked and fully banked households generally saved using formal methods. Unbanked households that saved primarily kept
savings at home, or with family and friends, while underbanked and fully banked households saved primarily using savings accounts” (p. 9).
According to the FDIC report, “80.2 percent of unbanked households had no mainstream credit, compared with 21.9 percent of underbanked households and 14.1 percent of fully banked households. Differences by race and ethnicity were sub-stantial: 36.0 percent of Black households and 31.5 percent of Hispanic households had no mainstream credit, compared with 14.4 percent of White households” (p. 10).
Participation of Latino-Owned Firms in the Financial MarketsAn ongoing research project at the Julian Samora Research
Institute analyzed data published by the U.S. Bureau of the Census Economic Census from 1992 to 2012 that included the number of Latino firms and their annual sales and receipts. The analysis also included the major national cities with a large con-centration of LOBs. Data from the U.S. Survey of Entrepreneurs for 2014, 2015, and 2016, for firms with employees, includes the financial sources start-up firms use to fund their initial operations, the sources and amounts required for their operations, and the reasons Latino firms are reluctant to participate in the formal financial markets. While these data sets contain data for many racial and ethnic groups, the JSRI research project extracted data only for Hispanic, Equally Hispanic-Non Hispanic, and White-owned businesses to make comparisons among these three groups.
In recent years, Latino households in general and LOBs in particular have experienced increasing access to the formal financial markets. This is evident through a percentage growth of the financial services they are utilizing in their daily activities and business operations. As shown in Table 1, the percentage growth for all financial services is remarkable. There is a signif-icant difference in the growth between Latinos and non-Latinos in the use of these services. Table 1 shows the impressive gains Latinos have made in the use of all standard products, especially in opening Checking and Savings accounts (61%), 529 accounts
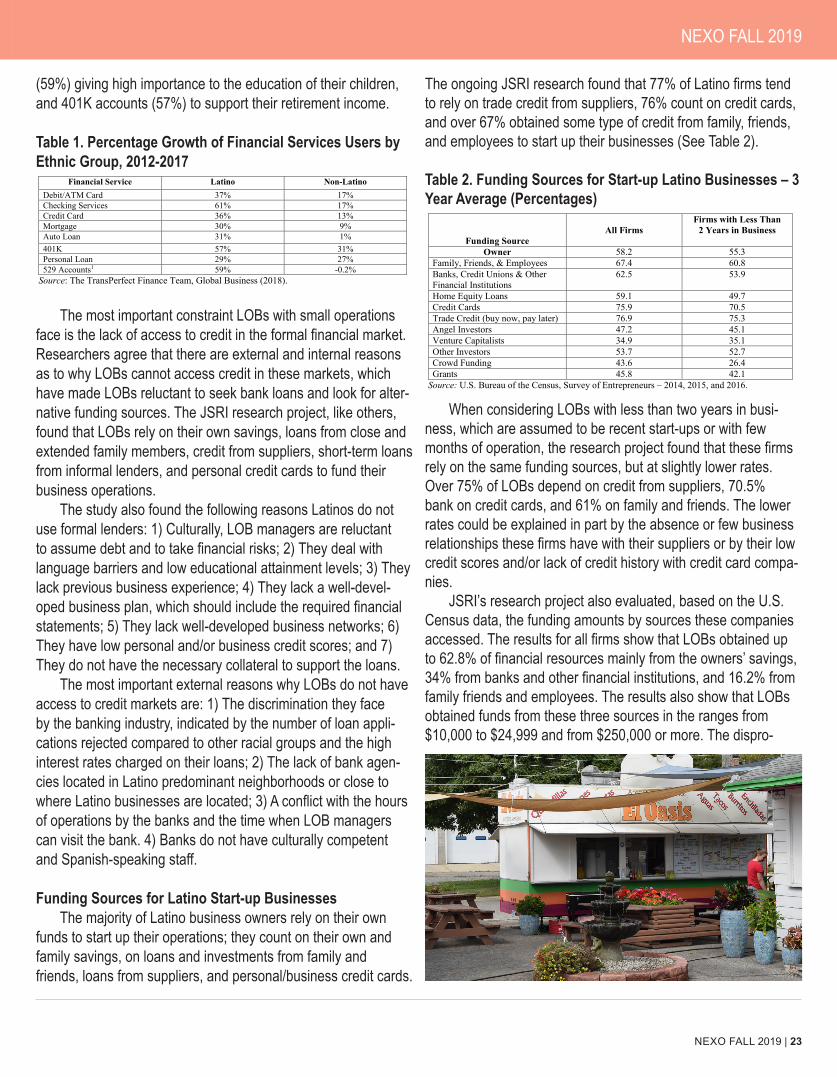
NEXO FALL 2019 | 23
NEXO FALL 2019
(59%) giving high importance to the education of their children, and 401K accounts (57%) to support their retirement income.
Table 1. Percentage Growth of Financial Services Users by Ethnic Group, 2012-2017
Financial Service Latino Non-Latino Debit/ATM Card 37% 17% Checking Services 61% 17% Credit Card 36% 13% Mortgage 30% 9% Auto Loan 31% 1% 401K 57% 31% Personal Loan 29% 27% 529 Accounts1 59% -0.2%
Source: The TransPerfect Finance Team, Global Business (2018).
The most important constraint LOBs with small operations face is the lack of access to credit in the formal financial market. Researchers agree that there are external and internal reasons as to why LOBs cannot access credit in these markets, which have made LOBs reluctant to seek bank loans and look for alter-native funding sources. The JSRI research project, like others, found that LOBs rely on their own savings, loans from close and extended family members, credit from suppliers, short-term loans from informal lenders, and personal credit cards to fund their business operations.
The study also found the following reasons Latinos do not use formal lenders: 1) Culturally, LOB managers are reluctant to assume debt and to take financial risks; 2) They deal with language barriers and low educational attainment levels; 3) They lack previous business experience; 4) They lack a well-devel-oped business plan, which should include the required financial statements; 5) They lack well-developed business networks; 6) They have low personal and/or business credit scores; and 7) They do not have the necessary collateral to support the loans.
The most important external reasons why LOBs do not have access to credit markets are: 1) The discrimination they face by the banking industry, indicated by the number of loan appli-cations rejected compared to other racial groups and the high interest rates charged on their loans; 2) The lack of bank agen-cies located in Latino predominant neighborhoods or close to where Latino businesses are located; 3) A conflict with the hours of operations by the banks and the time when LOB managers can visit the bank. 4) Banks do not have culturally competent and Spanish-speaking staff.
Funding Sources for Latino Start-up BusinessesThe majority of Latino business owners rely on their own
funds to start up their operations; they count on their own and family savings, on loans and investments from family and friends, loans from suppliers, and personal/business credit cards.
The ongoing JSRI research found that 77% of Latino firms tend to rely on trade credit from suppliers, 76% count on credit cards, and over 67% obtained some type of credit from family, friends, and employees to start up their businesses (See Table 2).
Table 2. Funding Sources for Start-up Latino Businesses – 3 Year Average (Percentages)
Funding Source
All Firms
Firms with Less Than 2 Years in Business
Owner 58.2 55.3 Family, Friends, & Employees 67.4 60.8 Banks, Credit Unions & Other Financial Institutions
62.5 53.9
Home Equity Loans 59.1 49.7 Credit Cards 75.9 70.5 Trade Credit (buy now, pay later) 76.9 75.3 Angel Investors 47.2 45.1 Venture Capitalists 34.9 35.1 Other Investors 53.7 52.7 Crowd Funding 43.6 26.4 Grants 45.8 42.1
Source: U.S. Bureau of the Census, Survey of Entrepreneurs – 2014, 2015, and 2016.
When considering LOBs with less than two years in busi-ness, which are assumed to be recent start-ups or with few months of operation, the research project found that these firms rely on the same funding sources, but at slightly lower rates. Over 75% of LOBs depend on credit from suppliers, 70.5% bank on credit cards, and 61% on family and friends. The lower rates could be explained in part by the absence or few business relationships these firms have with their suppliers or by their low credit scores and/or lack of credit history with credit card compa-nies.
JSRI’s research project also evaluated, based on the U.S. Census data, the funding amounts by sources these companies accessed. The results for all firms show that LOBs obtained up to 62.8% of financial resources mainly from the owners’ savings, 34% from banks and other financial institutions, and 16.2% from family friends and employees. The results also show that LOBs obtained funds from these three sources in the ranges from $10,000 to $24,999 and from $250,000 or more. The dispro-

24 | NEXO FALL 2019
The LimiTaTions LaTinos Face when sTarTing a Business
On the other hand, the lower percentages of funding obtained from banks and other financial institutions are due to the lack of credit history, low credit reports, and business experience. As is the case for all firms, the most common funding bracket for LOBs with less than two years in business is $10,000 to $24,999.
An analysis regarding the avoidance by Latino businesses of external funding is included in the U.S. Bureau of the Census, Survey of Entrepreneurs. It shows the top reasons reported by LOBs. For all firms, “Business did not need Additional Funding,” (87.8%), “Did not want to accrue debt,” (6.7%), “Did not think Additional Funding would be approved by lender,” (6.1%), and “Decided finance cost would be too high,” (3.6%) were the most important reasons for why LOBs avoid requesting external fund-ing (See Table 4).
Reasons Why Latino Businesses Avoid External FundingTable 4. Reasons for Why Latino Businesses Avoid External Funding – 3 Year Average (%).
Description
All Firms
Firms with Less Than 2 Years in Business
Business need Additional Funding and Apply
12.2%
14.2%
Business did not need Additional Funding
87.8%
85.8%
Did not Think Additional Funding would be Approved by Lender
6.1%
7.4%
Did not want to Accrue Debt 6.7% 7.9% Decided Finance Cost Would Be Too High
3.6%
4.4%
Preferred to Reinvest Business Profits
1.9%
2.7%
Felt Loan Application Process would be Too Time Consuming
1.7%
1.8%
Decided the Additional Funding was no Longer Needed
0.6%
0.8%
Decided to Wait Until Funding could Improve
1.9%
2.3%
Decided to Wait Until Company hit Milestone to be in a Stronger Position to raise Funds
1.5%
2.4%
Other Reasons for not Applying 0.6% 0.6% Source: U.S. Bureau of the Census, Survey of Entrepreneurs – 2014, 2015, and 2016 Average.
For firms with less than 2 years in business the main rea-sons for avoiding external funding were “Business did not need Additional Funding,” (85.8%), 2.0% lower than for all firms; “Did not want to accrue debt,” (7.9%), 1.2% higher than for all firms;
portion between these two funding ranges shows the presence in the financial markets of small and large LOBs with different funding requirements and access to funds.
Table 3. Funding Amounts by Sources for Latino Firms – 3 Year Averages (Percentages).
SOURCES
AMOUNTS GRANTED
$0
Total Funding
$1 – $4.9k
$5k - $9.9k
$10k – $24.9k
$25k – $49.9k
$50k – $99.9k
$100k- $249.9k
$250k Or more
From Owner All Firms 37.2 62.8 7.1 7.3 11.1 7.5 7.8 6.4 11.0 Firms < 2yr.* 21.9 78.1 8.3 9.9 19.5 10.1 9.2 7.6 13.4 Family, Friends Employees**
All Firms 83.8 16.2 3.3 2.3 3.9 1.5 1.7 1.3 2.2 Firms < 2 yr. 75.9 24.1 4.4 3.7 5.9 2.4 2.4 2.2 3.3 Banks & Other Financial Institutions***
All Firms 65.9 34.1 2.8 3.1 7.6 4.5 5.1 4.4 6.5 Firms < 2 yr. 67.6 32.4 3.5 3.5 8.4 4.3 3.5 3.3 5.8 Other Investors
All Firms 97.2 2.8 0.9 0.3 0.4 0.2 0.3 0.2 0.4 Firms < 2 yr. 95.8 4.2 1.0 0.5 0.7 0.5 0.3 0.2 1.0 Government Grants
All Firms 98.8 1.2 0.6 0.1 0.1 0.0 0.0 0.1 0.1 Firms < 2 yr. 98.4 1.6 0.8 0.2 0.2 0.2 0.0 0.1 0.1
Source: U.S. Bureau of the Census, Survey of Entrepreneurs, Average of 2014, 2015, and 2016. *Firms with less than 2 years in business; **Family, Friends, and Employees; ***Banks and Other Financial Institutions
In addition to these funding sources, LOBs reported obtain-ing funding from two other sources, although at lesser amounts. These funding sources are Angel investors and venture capital-ists (2.8%) and government grants (1.2%). Funds obtained from these sources were at lower rates than the other three sources cited above and at lower amounts. We assume that the main reasons for the lower rates are the difficulty that LOBs have to access these funding sources and the lack of knowledge they have about them.
The analysis for firms with less than two years in business shows the same trend as the one for all firms, at higher percent-ages for all sources, but not for funds obtained from banks and other financial institutions. A higher demand for credit at the initial stages of the business development explains in part the higher percentages of funding obtained from these sources by LOBs.

NEXO FALL 2019 | 25
NEXO FALL 2019
ing financial products especially designed for Latinos, and, most importantly, providing them access to formal financial markets.
Approaches Banks Use to Evaluate Credit Applications and Recommendations
Since access to credit is the main constraint LOBs face to start up and operate their businesses, banks have been search-ing for new ways to evaluate and facilitate their credit applica-tions. The FDIC identifies two approaches banks are currently using for this purpose. The first is the structured approach, which is used mainly by large banks and is based on a well-structured process loan officers need to follow to evaluate and approve a loan application. It includes a detailed review of the applicant’s business plan and financial statements, followed by an evalu-ation of standard financial ratios, personal and business credit scores, business experience and managerial capabilities of the business operators, and the guarantees offered as collateral. Loan officers assign scores to each of these steps, and the final score results from adding the scores of each step. Banks have set minimum scores needed to approve a loan application.
In contrast, small regional banks use the relationship ap-proach to evaluate loan applications. This approach is based on the long-term social and business relationships developed between these banks and their customers, which is centered on mutual trust. Most of these banks have a proactive approach to develop relationships through an active participation of the banks’ officials and loan officers in community organizations and events where they have the opportunity to interact with their cus-tomers. Bank customers also seek to develop and nurture these relationships through continuous investments in their social capi-tal with bank administrators and loan officers by periodic visits to the bank’s agency to make financial transactions.
The social and business relationships with the loan applicant could be considered by loan officers at the time of evaluating the loan application. A high percentage of these bank customers run small businesses and do not have a well-developed busi-ness plan including the most current financial statements. Their personal and business credit scores are low, and cannot offer collateral as a guarantee. In most of these loan applications, loan officers need to be flexible when evaluating them based on the time the applicant has been the bank’s customer, the trust level with the applicant, his/her past credit history, and the business’ potential growth and profitability.
In many cases, the loan officer’s approval is enough; in others, the loan officer submits a report to his/her supervisor, the bank’s credit committee, and top administrators for the loan’s final approval. In some cases, bank administrators and auditors,
“Did not think Additional Funding would be approved by lender (7.4%), 1.3% higher than for all firms; and “Decided finance cost would be too high” (4.4%), 0.8% higher than for all firms. Some of the reasons for these higher percentages include: most of these firms are newcomers and do not have enough business experience to support their operations; they do not have a long-term business relationship with their banks; there is a cultural practice for assuming debt and avoiding risk; and these firms did not have enough guarantees to support new loans as collateral.
The Supply Side of Financial MarketsAs stated above, the Federal Deposit Insurance Corporation
(FDIC) reports in 2017 high percentages of Latino households as unbanked (14%) and underbanked (28.9%). Although these figures have been decreasing, they are still high and create po-tential opportunities for banks in their efforts to attract new Latino customers.
According to the Latino Entrepreneurship Initiative (LEI) from the Stanford Graduate School of Business (2018), there are “Two key facts [that] underscore the economic importance of Latinos and Latino-owned businesses: 1) Latinos own an in-creasing number and a share of businesses and 2) Latinos start approximately one in four new businesses in the U.S.—a critical source of new jobs in the economy” (p. 6). And, “Latinos owned 12 percent of all businesses in 2012, up eight percent from 2007. Between 2007 and 2012, the number of total Latino-owned busi-nesses grew by 46 percent compared to a 0.2 percent decline in the number of non-Latino-owned businesses” (p. 6).
This large number of Latino-owned businesses has a direct impact on the U.S. economy, with their total sales and receipts reaching $474 billion in 2012, increasing by 35.1% from 2007. Over 36% of LOBs reported an increase in the number of jobs they created in the last 12 months. LOB revenues are over $700 million per year. Lending to Latino-owned businesses reached $1.4 billion, creating a huge business opportunity for banks and other financial institutions.
At the national level, we can observe that Latino immigrants create more businesses and their rate of business ownership is currently higher than for U.S. born Latinos and similar to non-Latino owners. Immigrant Latino male businesses are highly concentrated in construction, while immigrant female businesses are concentrated in other services, which includes beauty and cleaning services (Fairlie, 2018).
These figures demonstrate the important role LOBs play within the U.S. economy and the huge opportunity banks and other financial institutions have in working closely with them by establishing long-term relationships based on mutual trust, offer-

26 | NEXO FALL 2019
The LimiTaTions LaTinos Face when sTarTing a Business
The following are specific financial programs banks are currently implementing to better serve the Latino community and to attract new customers from this community.
Cash Paychecks: Given the high percentage of unbanked Latinos who currently cash their paychecks at local stores and other facilities, banks are offering these services with lower or no fees. In addition, banks are offering debit cards, to reduce the risk of losing cash, that the customer can use at any ATM. The customer can reload his/her card with the next paycheck.
Savings Accounts: Banks, after developing a trusting rela-tionship with their new customers through cashing paychecks for at least six months, are encouraging them to open savings accounts in order to develop a long-term financial relationship.
Small Loans: In order to facilitate the development of a credit history, banks offer small loans to those customers who opened savings accounts. In this way, bank customers learn how to manage a loan through periodic payments to the principal and interest rate.
Remittances: Many Latin American countries rely on the remittances their nationals send back to their families as a source of hard currency. In 2018, immigrants from these coun-tries sent an estimated $85 billion to their original countries. The total amount of money is likely significantly larger than what is reported because these estimates do not include the transfer of
Banks need to offer financial education programs especially designed for the Latino community given the high percentage of unbanked and underbanked Latino households. These programs should include basic themes such as how to open and manage checking and savings accounts, how to establish a credit history, how to obtain information about credit scores, the requirements for applying for a credit card and a bank loan, how to manage a bank loan, and how to utilize mobile banking. The training programs for LOBs should also include such topics as how to develop a business plan and work with financial statements such as the balance sheet and the income statement.
in order to comply with FDIC regulations, reject the loan applica-tion approved by the loan officer.
Regardless of their ethnicity, small business owners reported greater success at small banks when getting a loan approved or obtaining a line of credit or cash advance. LOBs reported a 60% credit success at small banks, compared with 31% at large banks (Acevedo, 2018). Latinos who obtain a business loan are much more likely than non-Latino White business owners to use personal guarantees such as cash, real estate, and other assets to secure the loan.
Trust is a key ingredient for the development of any type of relationship. It requires mutuality and can increase through time through regular interaction by the parties involved in the relationship. Developing trust with their customers is a necessary condition for bankers and loan officers to attract new customers and to maintain the current ones. “Banks and non-depository lenders must rebuild confidence among LOBs who have lost trust in them. . . . First generation Latino immigrants over-index relative to non-Latinos in distrust of financial institutions. . . . This trend must be reversed by building a sustainable lending model that aligns long-term economic incentives between borrowers and lenders” (Salas, 2016, p. 8).
Banking Internal Factors Aimed to Attract and Grant Loans to Latinos
Banks and other financial institutions have begun to rec-ognize the important role Latino households and businesses currently play within the U.S. economy based on the constant growth of the Latino population, their purchasing power, and the number of businesses owned. These factors provide them a huge opportunity for attracting and working closely with both Latino households and Latino-owned businesses. Banks have been making changes in their procedures, offering new products specially suited for Latino communities, modifying their offic-es, and hiring Spanish-speaking personnel with broad cultural awareness.
Bank and other financial institutional representatives have also realized the need to implement specially designed programs to improve trust levels with their Latino customers. However, as a first step, they need to make changes within their internal culture and offer services in Spanish by bilingual, bicultural staff. In addition, they are opening agencies in Latino predominant neigh-borhoods to facilitate access to Latino households and LOBs to their services. The physical configuration of the new facilities aim to welcome new customers. They are also offering new products tailored for Latino households and LOBs which should be easy to understand, flexible, and in Spanish.
Bank and other financial institutional representatives have also realized the need to implement specially designed programs to improve trust levels with their Latino customers. However, as a first step, they need to make changes within their internal culture and offer ser-vices in Spanish by bilingual, bicultural staff.

NEXO FALL 2019 | 27
NEXO FALL 2019
the bank’s upper management and Board of Directors and need to comply with the internal policies and regulations developed by them. Further, the bank’s upper management and Board of Directors are interested in increasing the bank’s revenue and reducing its operating costs. These conflicting approaches could harm or block any new initiative bank administrators are trying to implement in order to attract a large number of Latino customers and LOBs.
Conclusion and Recommendations for Future ResearchLatino-owned businesses currently play an important role
within the nation’s economy. Their numbers have been increas-ing over the last 30 years, the amount of their sales and receipts is over $1 billion per year, and they have become a source of job creation. Despite the important achievements of the Latino pop-ulation and Latino-owned businesses, they face several internal and external constraints when they decide to start a business, of which external funding is probably the most important.
Banks and other financial institutions have realized a huge business opportunity working with Latino-owned businesses and Latino households. They have started offering financial products tailored to the Latino community and begun adopting policies and regulations in order to attract new customers and better serve this community. Banks have started making internal ad-justments to facilitate their business relationships with the Latino community.
Endnotes1A 529 plan is a tax-advantaged savings plan designed to encourage saving for future education costs. 529 plans, legally known as “qualified tuition plans,” are sponsored by states, state agencies, or educational institutions and are authorized by Section 529 of the Internal Revenue Code.2https://www.federalreserve.gov/econres/bsrstaff.htm3https://www.fdic.gov/about/strategic/strategic/supervision.html
ReferencesBudiman, A. & Connor, P. (2018), Migrants from Latin America and the Ca-
ribbean sent a record amount of money to their home countries in 2016. FactTank. https://www.pewresearch.org/fact-tank/2018/01/23/migrants-from-latin-america-and-the-caribbean-sent-a-record-amount-of-money-to-their-home-countries-in-2016/.
Coronado, J. & Martinez, R. (2018). “Hicimos el Camino en Michigan: Latino Business Pioneers, Diálogo. 21(1): 51-65.
Federal Deposit Insurance Corporation. (2017). FDIC National Survey of Unbanked and Underbanked Households, 2017. Available online: https://www.fdic.gov/householdsurvey/2017/2017report.pdf.
Geoscape. (2017). Hispanic Business Report. http://geoscape.com/wp-con-tent/uploads/2017/09/HBR-Final-Report_2017.pdf.
Martinez, R. & Avila, B. (2019). “Motivations for Entrepreneurship among Mexican Americans and White Americans,” International Journal of Social Science and Business, 4(1): 1-12.
Salas, S. (2016). “Lending to Latino-Owned Businesses: A $1.4 Billion Market Opportunity, FORBES. 1-9.
other assets, such as gifts, or informal monetary transfers (Bu-diman and Connor), which are usually done outside the banking system. Banks want to grab this very profitable business by charging lower fees and offering these services through extend-ed hours and on weekends.
External Factors that Prevent Banks from Attracting More Latino Customers
Federal and State agencies are in charge of supervising banking operations through policies and regulations with which banks need to comply. The Federal Reserve and the Federal Deposit Insurance Corporation are in charge of supervising individual banks at the federal level. The Division of Supervision and Regulation of the Federal Reserve exercises and oversees the Board’s supervisory and regulatory authority over a variety of financial institutions and activities with the goal of promoting a safe, sound, and stable financial system that supports the growth and stability of the U.S. economy. The Federal Reserve carries out its supervisory and regulatory responsibilities and support-ing functions primarily by promoting the safety and soundness of individual financial institutions supervised by the Federal Reserve. It takes a prudent and macro approach to provide the supervision of the largest, most systemically important financial institutions.2
The FDIC promotes safe and sound financial institution-al practices through regular risk management examinations, publication of guidance and policy, ongoing communication with industry officials, and the review of applications submitted by FDIC-supervised institutions to expand their activities or locations. When appropriate, the FDIC has a range of informal and formal enforcement options available to resolve safe-ty-and-soundness problems identified at these institutions. The FDIC also has staff dedicated to administering off-site monitoring programs and to enhancing the agency’s ability to timely identifi-cation of emerging safety-and-soundness issues.
The FDIC promotes compliance by FDIC-supervised insti-tutions with consumer protection, fair lending, and community reinvestment laws through a variety of activities, including ongoing communication with industry officials, regular compli-ance and Community Reinvestment Act (CRA) examinations, dissemination of information to consumers about their rights and required disclosures, and investigation and resolution of consum-er complaints regarding FDIC-supervised institutions. The FDIC also has a range of informal and formal enforcement options available to resolve compliance problems identified at these institutions and their institution-affiliated parties.3
In addition, loan officers and bank administrators report to

28 | NEXO FALL 2019
Miscellaneous
As a historian who has taught U.S. history at the collegiate level, I recall the words of my first mentor, the late Dr. Rodolfo Rocha who would tell the class, “I have fifteen weeks to undo what twelve years of public education has denied you.” The social studies standards in Texas had castigated Mexicans and Mexican Americans as the enemy and portrayed them in the textbooks as bandits, lazy, and as foreigners in their own lands. Students in predominantly Mexican American South Texas grew up with limited appreciation of their culture and history. Recently, proposed textbooks in Texas stated that Chicanos wanted to destroy American society, while other texts described African American slaves as immigrants. These teachings speak to the intolerance and hatred that plagues the nation as every day we see the brutalization of black and brown people by law enforcement and citizens alike. Most recently, a white nationalist terrorist who felt emboldened to respond with violence against the browning of the population in Texas committed the massacre in El Paso.
Proponents of racial and cultural tolerance often use the simplistic cliché, “The United States is a nation of immigrants,” to condemn racial bigotry as they strive for a more inclusive environment. Whether or not people consider their ancestors immigrants is beside the point, as diverse communities of working peoples have contributed to both the development and preservation of the U.S. across time. Yet, this rich history typically is underrepresented, if not completely ignored, in the Kinder-12th grade social studies curriculum. The roles, sacrifices, and contributions of these diverse communities have not always been included in the popular histories of the U.S. On the contrary, there have been attempts to erase or intentionally omit their vast contributions. Most recently, conservative members of state legislatures in numerous states have made attempts to curb social studies curricula, making them less reflective of the historic struggles for inclusion and equality in society.
In Michigan in 2018, former Republican State Senator Patrick Colbeck proposed changes to the social studies
standards that would reduce or erase topics such as the NAACP (National Association for the Advancement of Colored People), the Ku Klux Klan, numerous immigrant groups, the LGBTQ community, Roe v. Wade, and climate change. Democrats countered with social studies standards that were more reflective and inclusive of all Michiganders and these standards passed in a 6-2 vote in June. Conservatives argued that the social studies standards passed by Democrats had a liberal slant, were biased against Christians, and that Michigan families did not agree with them. The conflict over the social studies standards goes beyond the cultural war currently occurring in the U.S. and is reflective of the highly polarized political atmosphere the country is enduring.
The education system is impacted by this extreme polarization as conservatives already have a plan to combat the
newly passed standards that are to be adopted in the 2020-2021 academic year. “It’s clear these (standards) are biased to the left,” said Republican member of the Michigan Board of Education, Tom McMillin. “The result is not what everyone at this table wants—it’s going to (result in) less support for public education, more people pulling their kids out (of schools).” McMillin threatens with an attack on the funding of public education which already has been under assault under the neoliberal model that has supported charter
schools to the detriment of public schools. This financial assault n has led to the decline of public
education throughout Michigan and has deeply hurt our communities. While many schools are in shambles, where teachers often work in unsuitable environments and students feel like they are merely being warehoused, conservative politics and budget cuts have had a damaging impact on Michigan’s education system, which cannot afford further debilitation. As Michiganders prepare for a new decade, they should be mindful of the challenges they are confronting in public education. Neighborhoods may be changing but the aspirations of new neighbors remain the same. Everyone wants the best education for their children and that means having a strong and effective public education system that is inclusive of all.
Michigan’s Social Studies Standards: A Curriculum for all Michiganders

NEXO FALL 2019 | 29
NEXO FALL 2019
The Formerly Incarcerated Reenter Society Transformed Safely Transitioning Every Person Act, otherwise known as the FIRST STEP Act, was signed into U.S. law in December 2018. The Act was presented to the public as federal prison reform that would address overcrowded prisons by shortening minimum sentences for non-violent criminals. The act also eases sentences of inmates incarcerated under the “three-strikes” law, and allows inmates to earn reduced sentences, while containing provisions for programs to reduce recidivism. In addition, the act obligates the Federal Bureau of Prisons to provide feminine hygiene products free of charge to prisoners while also prohibiting the use of restraints on pregnant federal prisoners. Receiving less attention is the clause that expands prison labor through the Federal Prison Industries, Inc., known as UNICOR, which leads to the exploitation of prisoners by for-profit or private prisons.
While the Act received bipartisan support, it should not be shocking that it was passed under Donald Trump’s presidency, which represents extreme neoliberalism and has allowed the reopening of federal for-profit private prisons and contracting with private prisons. The privatization of federal prisons results in the expansion of federal inmates as these institutions are motivated to maximize profits by having their prison population at maximum capacity. Private federal prison contracts are awarded to Trump supporters and donors who benefit from owning and operating facilities that house federal prisoners, including children and families.
President Trump touts passage of the FIRST STEP Act as a gift to Black and Brown peoples who are incarcerated at disproportionate rates and contribute to the ranking of the U.S. as the nation with the highest incarcerated population in the
First Step Act
world. However, almost daily, through divisive coded and explicit language that embraces White nationalism, Trump has further pitted law enforcement against communities of color. With his disparaging rhetoric, Trump has criminalized and dehumanized communities by openly encouraging police brutality and championing White Supremacy.
The FIRST STEP Act only applies to federal inmates, who account for under ten percent of the entire prisoner population in the U.S. It also does not address first time sentencing nor does it address the disproportionate rates of incarceration of African Americans and Latinos. The Act also does not provide additional funding to the Bureau of Prisons to carry out the programming that it specifies. This further opens the door to private prisons that do not function under the same guidelines as government run prisons and often leave the public in the dark regarding their effectiveness in reducing recidivism. GEO Group and CoreCivic, rival companies that own and operate private prisons, supported the FIRST STEP Act as they recognized the profit-making opportunities created by the new legislation.
The public needs to understand that the FIRST STEP Act, like most of this regime’s policies, are motivated by market-driven endeavors that dehumanize populations while profiting and rewarding the extremely wealthy supporters of Trump and the GOP. While there are positive elements in the Act, the privatization of government functions transfer public funds into the pockets of wealthy businesspersons and stockholders. In this case, it occurs through for-profit prisons. Humanity is ours to cherish and preserve.
Changes under the First Step Act• Benefits Private Prisons• Expands Prison Labor• Reduces Mandatory Minimum Sentences • Eases “Three-Strikes” Law• Allows Inmates to Reduce Sentences• Programming to Reduce Recidivism• Applies only to Federal Inmates• Provides Hygiene Products to Women

30 | NEXO FALL 2019
Miscellaneous
Applying for permanent residency (Green Card) in the United States has become a very cumbersome process due to the continuous flow of new regulations by the U.S. government. The main purpose for the new regulations is to limit the number of le-gal immigrants to this country. For this purpose, the government is continually changing the required qualifications for those who are applying for permanent residency.
Currently, there are many ways for applying for permanent residency. The most common, up to 65 percent according to the White House, is family-based immigration, which requires a petition by a family member, a parent or a sibling that is already here. Others are through a sponsorship by a U.S. employer, a marriage-based Green Card, and the diversity immigration lottery that grants up to 50,000 permanent residencies per year to appli-cants from a selected number of countries.
In the last year, there was an increase in the following: 1) the number of bureaucratic barriers; 2) the cost to process an appli-cation; and 3) the number of unnecessary documents required to obtain a permanent residency visa. All these regulations intend to make it more difficult to obtain permanent residency and citizenship. The President has expressed concerns about family reunification as a way to obtain a permanent visa. In order to reduce the number of immigrants sponsored by a family member the government plans to give priority to those highly skilled appli-cants who currently represent only 12 percent of visa grantees. In addition, other factors such as age, English language ability, and employment offers are also considered.
The public charge rule is the one of the most restrictive regulations by the federal government aimed at reducing the number of legal immigrants sponsored by a family member. For purposes of determining inadmissibility, “public charge” means an individual who is likely to become primarily dependent on the government for subsistence, as demonstrated by either the
New Government Regulations for Permanent Residency Applicationsreceipt of public cash assistance for income maintenance or in-stitutionalization for long-term care at government expense (See the USCIS webpage). The government is also planning to cancel the visa lottery.
Congress first established the Public Charge rule in 1882 in order to allow the U.S. government to deny a U.S. visa to anyone who “is likely at any time to become a public charge.” Since 1999, immigration officers have adopted a guiding princi-ple that defines public charge as someone “primarily dependent on the government for subsistence,” as demonstrated by either (a) using public cash assistance for income maintenance or (b) institutionalization for long-term care at government expense. Specifically, this has included: 1) Supplemental Security Income (SSI); 2) Temporary Assistance for Needy Families (TANF), commonly known as welfare; 3) State and local cash assistance, sometimes called “General Assistance”; and 4) Medicaid or other programs supporting long-term institutionalized care, such as in a nursing home or mental health institution.
The Department of Homeland Security plans to expand dramatically the definition of “public charge” so that Green Card or other visa applicants can be denied not only on the basis of being “primarily dependent on the government for assistance,” but also for using “one or more public benefit” in the past or being likely at any time “to receive such benefits in the future.” The following are the factors that immigration officers must take into account when determining whether or not a visa applicant is likely to become a “public charge” at any point in the future: 1) Age, younger than 18 and older than 61; 2) Health, scrutinize any medical condition and assess whether this condition could affect the applicant’s ability to work; 3) Family size, having more children or other dependents could increase the likelihood of a visa denial; 4) Skills, to determine whether an applicant has “ad-equate education and skills to either obtain or maintain employ-ment,” a proficiency in English is required; 5) Financial status, beyond looking at an applicant’s income and assets, DHS plans to assess credit history, credit score, and financial liabilities.
Other causes for inadmissibility are: 1) carrying endemic dis-eases such as tuberculosis, STD and HIV, which could become a risk to local residents. Having or having had some cancers and not having all the required vaccinations are other causes for not obtaining the Green Card; 2) Use and abuse of alcohol and drugs; 3) Problems with the law in the past; 4) Gang member-ship; 5) Submitting a fraudulent application in the past; 6) Having been deported; 7) Having brought a relative or friend illegally into

NEXO FALL 2019 | 31
NEXO FALL 2019
the country; 8) Having pretended to be a U.S. citizen; 9) Having voted in a past election.
The increased cost of application became another important barrier to obtaining permanent residency. Each of the routes cited above has unique costs that depend on attorney’s fees and individual circumstances. Family-based petitions could cost up to $4,000 including attorney’s fees. To sponsor a family member, the petitioner first files a Form I-130, petition for Alien Relative, which costs $535 to file. After approval, the applicant needs to file the Form I-485, “Application to Register Permanent Residence or Adjust Status,” for a $1,225 fee. This includes the $85 Biometrics fee and applies to those who are between the ages of 14 and 78. The cost to sponsor a fiancé is $535. Most employment petitions require a job offer in the United States; the government gives priority to applicants with advanced degrees, with the cost of these visas at about $10,000.
The new regulations are not only affecting immigrants seeking permanent residency in the U.S., these regulations could also have a negative impact on sectors such as manufac-turing, agriculture, higher education, and others. A report from the National Association of Manufacturers states that “The most important way immigrants benefit the U.S. economy . . . is their possession of different skills and job preferences from those displayed by native-born Americans, thereby making the latter more productive” (Furchtgott-Roth, quoted in National Associa-tion of Manufacturers, 2017, p. 3). The report concludes citing “Opportunities are available for all skill types, and employees are seeking a diverse pool of workers in order to meet current de-mand and needs. Employers need to know there will be people available—with all skill types—for employment today and in the future” (National Association of Manufacturers, 2017, p. 3).
ReferencesDepartment of Homeland Security, https://www.uscis.gov/legal-resources/final-rule-public-charge-ground-inadmissibility.
National Association of Manufacturers, 2017, “Challenges and Solutions for the Next President and Congress, Competing to Win: Immigration in Focus.”
On June 27 of this year, the Supreme Court blocked the Trump administration from adding a question on citizenship to the 2020 Census. While Commerce Secretary Wilbur Ross claimed that citizenship data are necessary for purposes of enforcing the Voting Rights Act, critics of the attempt to add a citizenship question have argued that its true purpose is to discourage participation in Census 2020 by immigrant populations. Depressed levels of participation among immigrant communities, the argument goes, would lead to an undercount in areas with higher concentrations of immigrants, in turn skewing electoral district maps in favor of Republicans. This argument is supported by the discovery of an unpublished 2015 report by deceased redistricting expert Thomas Hofeller, who explicitly stated that a citizenship question would be “advantageous to Republicans and Non-Hispanic Whites.”
Why does it matter? The final numbers lead to funding for as many as 55 programs and to levels of political representation in Congress. It matters plenty for all communities.
Though the citizenship question will not appear on the Census, news of the administration’s attempt to add the question may have already negatively influenced the willingness to participate in the Census among vulnerable immigrant populations. Depressed participation among Latina/o immigrant communities risks further undercounting a group already historically undercounted. According to a fact sheet from the Leadership Conference Education Fund, “Latinos have been undercounted for decades, disadvantaging their families, communities, and neighborhoods.” The fact sheet notes several factors that make Latina/os hard to count, including language barriers, poverty, education, and immigration status. Latina/o children are at particular risk of being undercounted due to complex living arrangements and language barriers.
An inaccurate count could not only result in voting districts that unfairly advantage some communities and populations over others, but would also impact the allocation of resources to communities, as well as decision-making processes that affect community well-being. Federal funding levels for programs upon which many Latina/os rely are derived in whole or part from census data, including numerous programs in the areas of children and education, food and nutrition, and healthcare and housing. It is crucial then that agencies, organizations, and individuals who work with Latina/o and immigrant populations stress to their clients the importance of participating in the Census in order to achieve an accurate population count.
Latina/os and the 2020 Census

NameNEXO SPRING 2018NEXO SPRING 2017NEXO FALL 2016
GIFTS TO JSRIPLEASE CONSIDER MAKING A GIFT TO THE
JULIAN SAMORA RESEARCH INSTITUTEThrough your support you can enhance JSRI’s research, symposia, and cultural and scholarship activities.Each gift enhances JSRI’s capacity to promote research on Latino communities in Michigan, the Midwest and across the nation and to disseminate and contribute to the application of the findings.
YOUR GIFT CAN BE DESIGNATED FOR: • The JSRI Enrichment Fund, which supports research
projects, student research assistantships,and public forums on critical Latino issues;
• The Julian Samora Endowed Scholarship Fund, which supports two awards annually to undergraduate and graduate students with research and teaching interests on Latino issues;
• The P. Lea Martinez Endowed Scholarship Fund, which supports students studying health issues among Latinos;
• The JSRI Scholarship Fund, which supports students with short-term financial needs;
• Or any combination thereof.
INDIVIDUAL COMMITMENT LEVELS• Platino Circle ~ $5,000 or more
(payable over two years)
• Padrinos/Madrinas Circle ~ $2,500 to $4,999 (payable over two years)
• Amigo/Amiga Circle ~ $1,000 to $2,499• Aficionado/Aficionada ~ $100 to $999
CORPORATE COMMITMENT LEVELS• Platino Circle ~ $10,000• Padrinos/Madrinas Circle ~ $7,500• Amigos/Amigas Circle ~ $5,000• Aficionados/Aficionadas Circle ~ $2,500
If you need additional information on giving to JSRI, including planned giving, please contact: Rubén Martinez, Ph.D.Julian Samora Research InstitutePh. (517) 432-1317 • Fax (517) 432-2221Email: [email protected]: www.jsri.msu.edu
o I/We support the JSRI Enrichment Fund (AB 9921)
o I/We Support the Julian Samora Endowed Scholarship Fund (AB 9920)
o I/We support the P. Lea Martinez Endowed Scholarship Fund (AB 9923)
o I/We support the JSRI Scholarship Fund (AB 9922)
Amount of Gift/Pledge: $
YES, I/WE WANT TO SUPPORT JSRIPLEASE SUBMIT FORM WITH YOUR GIFT.
SEND ME/US PLEDGE REMINDERS:(check one)
o Annually o Quarterly o Semi-annually
Beginning: Month Year
o This is a joint gift with my spouse Spouse’s Name:
o Matching Company Gift:
MSU FACULTY/STAFF ONLY
o Deduct my pledge in equal monthly installments
o 12 Months o 24 Months o 36 Months
o Deduct my gift in one lump sum from my paycheck in the month of:
ZPID (Required for Payroll Deduction)
Pay Group: o Salary o Labor o Grad
MY/OUR TOTAL GIFT WILL BE PAID AS INDICATED:
o A check payable to Michigan State UniversityEnclosed in my first payment of: $
o A credit card charge to: (check one)
o Mastercard o Visa o Discover o American Express
Card Number:
Expiration Date:
Name on Card:
o A pledge of the following duration: (maximum of five years)
PERSONAL INFORMATIONName:
Address:
City/State/Zip:
Telephone: Office ( ) -
Home ( ) -
Email: PLEASE MAKE CHECKS PAYABLE TO:
MICHIGAN STATE UNIVERSITY
PLEASE NOTE FUND NAME OR ALLOCATION CODE IN THE MEMO LINE AND RETURN TO:
Julian Samora Research InstituteMichigan State University
219 S. Harrison Rd, Room 93East Lansing, MI 48824
Or make your gift on-line at: www.givingto.msu.edu
NEXO
University Outreach and EngagementJulian Samora Research Institute