nexrad/mpe precipitation estimation bias within the ohio ... · • nws river forecast system...
TRANSCRIPT

Wednesday, October 20, 2004Wednesday, October 20, 2004 OHRFC TAC Meeting PresentationOHRFC TAC Meeting Presentation
NEXRAD/MPE Precipitation Estimation NEXRAD/MPE Precipitation Estimation Bias within the Ohio River Forecast Bias within the Ohio River Forecast Center Area of Operations Center Area of Operations —— TAC TAC
Meeting Oct. 2004 Meeting Oct. 2004
Thomas AdamsThomas Adamsthomasthomas..adamsadams@@noaanoaa..govgov
National Weather ServiceNational Weather ServiceOhio River Forecast Center, Wilmington, OHOhio River Forecast Center, Wilmington, OH

Wednesday, October 20, 2004Wednesday, October 20, 2004 OHRFC TAC Meeting PresentationOHRFC TAC Meeting Presentation
NOAA
OHRFC FactsOHRFC Facts
Staff of 16 hydrologists & Staff of 16 hydrologists & meteorologists, 1 meteorologists, 1 Administrative Support Administrative Support AssistantAssistantOhio River drainage area = Ohio River drainage area = 453250 km453250 km22
29 major29 major subbasinssubbasins, , subdivided into ~700 smaller subdivided into ~700 smaller subbasinssubbasinsOhio RiverOhio River Mainstem Mainstem highly highly regulated for navigationregulated for navigationAlso responsible for Lake Erie Also responsible for Lake Erie drainagedrainage

Wednesday, October 20, 2004Wednesday, October 20, 2004 OHRFC TAC Meeting PresentationOHRFC TAC Meeting Presentation
NOAA
TopicsTopics
•• Current OHRFC operationsCurrent OHRFC operations•• Sacramento Soil Moisture Sacramento Soil Moisture
Accounting (SACAccounting (SAC--SMA) modelSMA) model•• MPE Precipitation Estimation BiasMPE Precipitation Estimation Bias•• Hydrologic Implications of Biased Hydrologic Implications of Biased
Precipitation EstimationPrecipitation Estimation•• OHD Proposed Range Correction OHD Proposed Range Correction
Algorithm (RCA) & ConvectiveAlgorithm (RCA) & Convective--Stratiform Stratiform Separation Algorithm Separation Algorithm (CSSA)(CSSA)
•• ConclusionsConclusions

Wednesday, October 20, 2004Wednesday, October 20, 2004 OHRFC TAC Meeting PresentationOHRFC TAC Meeting Presentation
NOAA
Current OHRFC operationsCurrent OHRFC operations
•• Deterministic operationsDeterministic operations•• River flow & flood forecastingRiver flow & flood forecasting•• 1 daily interactive forecast, partial evening update, & updates 1 daily interactive forecast, partial evening update, & updates during floodingduring flooding•• 16 hours/day operations, 365 days/year 16 hours/day operations, 365 days/year —— 24 hours/day during flooding24 hours/day during flooding•• NWS River Forecast System (NWSRFS)NWS River Forecast System (NWSRFS)
•• Operational Forecast System (OFS)Operational Forecast System (OFS)•• Calibration SystemCalibration System•• EnsembleEnsemble Streamflow Streamflow Prediction (ESP) SystemPrediction (ESP) System•• Flash Flood Guidance SystemFlash Flood Guidance System
•• 55--day forecastsday forecasts•• NEXRAD radar based precipitation estimation (MPE) with NEXRAD radar based precipitation estimation (MPE) with raingage raingage correctioncorrection•• Forecasted precipitation & temperatureForecasted precipitation & temperature•• FFG (1FFG (1--, 3, 3--, 6, 6--, 12, 12--, 24, 24--hr)hr)•• RRM/ESS product generationRRM/ESS product generation
•• AHPS/Probabilistic forecastsAHPS/Probabilistic forecasts•• Provides estimates of forecast uncertaintyProvides estimates of forecast uncertainty
•• Model errorModel error•• Uncertainty in initial model statesUncertainty in initial model states•• Hydrometeorological Hydrometeorological uncertaintyuncertainty
•• LongLong--term probabilistic forecasts using ESPterm probabilistic forecasts using ESP

Wednesday, October 20, 2004Wednesday, October 20, 2004 OHRFC TAC Meeting PresentationOHRFC TAC Meeting Presentation
NOAA
Hydrometeorological Hydrometeorological DataData
Wednesday, October 20, 2004Wednesday, October 20, 2004 OHRFC TAC Meeting PresentationOHRFC TAC Meeting Presentation
NOAA
The SACThe SAC--SMA modelSMA model
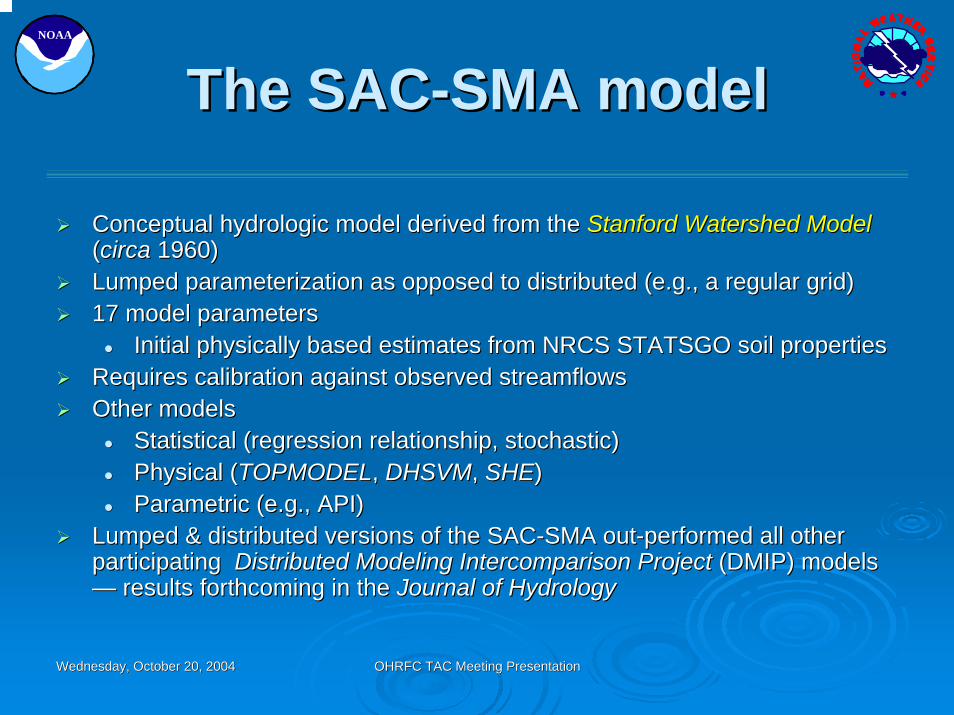
Conceptual hydrologic model derived from the Conceptual hydrologic model derived from the Stanford Watershed ModelStanford Watershed Model((circacirca 1960)1960)Lumped parameterization as opposed to distributed (e.g., a regulLumped parameterization as opposed to distributed (e.g., a regular grid)ar grid)17 model parameters17 model parameters
Initial physically based estimates from NRCS STATSGO soil properInitial physically based estimates from NRCS STATSGO soil propertiestiesRequires calibration against observed Requires calibration against observed streamflowsstreamflowsOther modelsOther models
Statistical (regression relationship, stochastic)Statistical (regression relationship, stochastic)Physical (Physical (TOPMODELTOPMODEL, , DHSVMDHSVM, , SHESHE))Parametric (e.g., API)Parametric (e.g., API)
Lumped & distributed versions of the SACLumped & distributed versions of the SAC--SMA outSMA out--performed all other performed all other participating participating Distributed Modeling Distributed Modeling Intercomparison Intercomparison ProjectProject (DMIP) models (DMIP) models —— results forthcoming in the results forthcoming in the Journal of HydrologyJournal of Hydrology

Wednesday, October 20, 2004Wednesday, October 20, 2004 OHRFC TAC Meeting PresentationOHRFC TAC Meeting Presentation
NOAA SACSAC--SMA model SMA model ConceptualizationConceptualization

Wednesday, October 20, 2004Wednesday, October 20, 2004 OHRFC TAC Meeting PresentationOHRFC TAC Meeting Presentation
NOAA
Model CalibrationsModel Calibrations
Process by which model parameter values are adjusted to get Process by which model parameter values are adjusted to get optimaloptimalagreement between observations & simulationagreement between observations & simulationMany sources of errorMany sources of error
Model is an inexact representation of reality, e.g., lumped Model is an inexact representation of reality, e.g., lumped vs vs spatially spatially distributed models distributed models Data biases, data inconsistency (e.g., station location changes,Data biases, data inconsistency (e.g., station location changes, MAP MAP vs vs MAPX), poor observational coverage, etc.MAPX), poor observational coverage, etc.
Calibration periods normally exceed 20 years and span wet & dry Calibration periods normally exceed 20 years and span wet & dry climatic climatic periodsperiodsSignificant effort is made to keep model parameter values regionSignificant effort is made to keep model parameter values regionally ally consistentconsistentEvery effort made to not adjust physically estimated parameter vEvery effort made to not adjust physically estimated parameter valuesaluesNot possible to calibrate Not possible to calibrate downstreamdownstream subbasinssubbasinsSome automatic model optimizations have been attempted, but geneSome automatic model optimizations have been attempted, but generally a rally a tedious manual processtedious manual process
Wednesday, October 20, 2004Wednesday, October 20, 2004 OHRFC TAC Meeting PresentationOHRFC TAC Meeting Presentation
NOAA
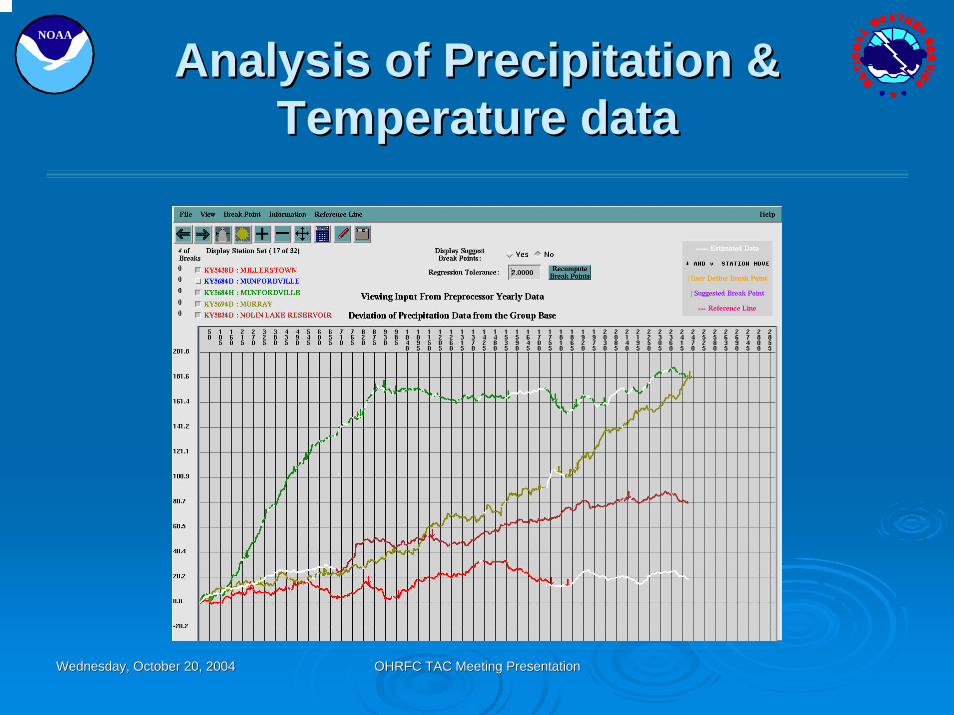
Analysis of Precipitation & Analysis of Precipitation & Temperature dataTemperature data

Wednesday, October 20, 2004Wednesday, October 20, 2004 OHRFC TAC Meeting PresentationOHRFC TAC Meeting Presentation
NOAA
SACSAC--SMA Model CalibrationSMA Model Calibration

Wednesday, October 20, 2004Wednesday, October 20, 2004 OHRFC TAC Meeting PresentationOHRFC TAC Meeting Presentation
NOAA
Lower Zone Tension Water Lower Zone Tension Water Maximum (LZTWMMaximum (LZTWM))

Wednesday, October 20, 2004Wednesday, October 20, 2004 OHRFC TAC Meeting PresentationOHRFC TAC Meeting Presentation
NOAA
MPE Precipitation Estimation BiasMPE Precipitation Estimation Biasin the OHRFC Regionin the OHRFC Region
Multisensor Multisensor Precipitation EstimatorPrecipitation Estimator (MPE) (and Stage(MPE) (and Stage--3) 3) precipitation processing essential to OHRFC operationsprecipitation processing essential to OHRFC operationsOne of onlyOne of only 4 or4 or 5 5 RFCs RFCs using either MPE or Stageusing either MPE or Stage--3 operationally3 operationallyNEXRAD radar derived precipitation used operationally for NEXRAD radar derived precipitation used operationally for hydrologic model input since ~1997hydrologic model input since ~1997Significant biases apparent since early in ~1998Significant biases apparent since early in ~1998Questions concerning sources of the biasesQuestions concerning sources of the biases
RandomRandom or systematic errors?or systematic errors?What adjustments are possible?What adjustments are possible?How much do these biases influence hydrologic forecast uncertainHow much do these biases influence hydrologic forecast uncertainty?ty?

Wednesday, October 20, 2004Wednesday, October 20, 2004 OHRFC TAC Meeting PresentationOHRFC TAC Meeting Presentation
NOAA
Motivation for RadarMotivation for RadarPrecipitation StudyPrecipitation Study
OHRFC operational commitment to StageOHRFC operational commitment to Stage--3/MPE precipitation estimation3/MPE precipitation estimationOperational use since 1997 using MAPX as sole precipitation inpuOperational use since 1997 using MAPX as sole precipitation input to NWSRFS hydrologic modelst to NWSRFS hydrologic modelsInadequate raingauge supportInadequate raingauge support
•• Uneven spatial coverageUneven spatial coverage•• Reporting times too late to meet operational startReporting times too late to meet operational start•• Complex terrainComplex terrain
Operational biases apparent (known problem)Operational biases apparent (known problem)OHRFC operational experienceOHRFC operational experienceOther RFCsOther RFCsNEXRAD radar precipitation estimation studies by Smith et al (PrNEXRAD radar precipitation estimation studies by Smith et al (Princeton Univ.) & othersinceton Univ.) & others
•• Beam blockageBeam blockage•• Beam over shootingBeam over shooting•• Range effect (spreading of the radar beam)Range effect (spreading of the radar beam)•• Non unique ZNon unique Z--R relationshipR relationship•• Hail contaminationHail contamination•• Poor snow estimationPoor snow estimation•• Orographic enhancementOrographic enhancement•• Radar calibrationRadar calibration•• Truncation error (most apparent with stratiform precipitation)Truncation error (most apparent with stratiform precipitation)•• BrightbandingBrightbanding
Identify & understand all sources of biases and attempt to make Identify & understand all sources of biases and attempt to make correctionscorrectionsUse of nationally supported operational technology/softwareUse of nationally supported operational technology/software

Wednesday, October 20, 2004Wednesday, October 20, 2004 OHRFC TAC Meeting PresentationOHRFC TAC Meeting Presentation
NOAA
Study MethodologyStudy Methodology
Estimate MPE bias relative to raingaugeEstimate MPE bias relative to raingauge--only estimate over the OHRFC areaonly estimate over the OHRFC areabiasbias = XMRG/raingauge= XMRG/raingaugeUniform gridded field: ~ 5 x 5 kmUniform gridded field: ~ 5 x 5 km22
ReRe--gridding of cellgridding of cell--centered (in latcentered (in lat--long coordinates) HRAP XMRG daily valueslong coordinates) HRAP XMRG daily valuesIDW (inverse distance weighting) spatial interpolation to a new IDW (inverse distance weighting) spatial interpolation to a new grid bounding the grid bounding the OHRFC areaOHRFC areaSpatial interpolation using Spatial interpolation using Ordinary KrigingOrdinary Kriging (spherical model) of daily Co(spherical model) of daily Co--op station op station reports (independent of hourly reports (independent of hourly raingauge raingauge network used in MPE corrections)network used in MPE corrections)Summation of the new gridded fieldsSummation of the new gridded fields
Annual total for 2002 & 2003Annual total for 2002 & 2003Seasonal DJF & JJA for 2002 & 2003Seasonal DJF & JJA for 2002 & 2003
Statistical analyses using RStatistical analyses using RTools Tools —— GRASSGRASS GISGIS 5.3, 5.3, RR 1.7, & 1.7, & GSTATGSTAT

Wednesday, October 20, 2004Wednesday, October 20, 2004 OHRFC TAC Meeting PresentationOHRFC TAC Meeting Presentation
NOAA
Methodological AssumptionsMethodological Assumptions& Issues& Issues
Not true independence of MPE XMRG precipitation estimates and raNot true independence of MPE XMRG precipitation estimates and raingauge ingauge precipitation estimates precipitation estimates —— the Cothe Co--op station reports also used in MPE estimationop station reports also used in MPE estimationInconsistent set of raingauges used in raingauge fields Inconsistent set of raingauges used in raingauge fields —— only 147 consistent for all only 147 consistent for all 12 months out of ~60012 months out of ~600Terrain effects (orographic enhancement) not included in raingauTerrain effects (orographic enhancement) not included in raingauge field precipitation ge field precipitation estimation estimation —— somesome underestimation?underestimation?Raingauge density inadequate to capture convective precipitationRaingauge density inadequate to capture convective precipitation variabilityvariabilityGrid comparisons based on geographic rather than HRAP grid basisGrid comparisons based on geographic rather than HRAP grid basisHRAP grid missing a HRAP grid missing a smallsmall portion of Lower Wabash River basinportion of Lower Wabash River basinThe criteria for using raingauges may be to restrictive with resThe criteria for using raingauges may be to restrictive with respect to intolerance for pect to intolerance for missing datamissing data

Wednesday, October 20, 2004Wednesday, October 20, 2004 OHRFC TAC Meeting PresentationOHRFC TAC Meeting Presentation
NOAA
OHRFC TerrainOHRFC Terrain

Wednesday, October 20, 2004Wednesday, October 20, 2004 OHRFC TAC Meeting PresentationOHRFC TAC Meeting Presentation
NOAA
OHRFC PRISM Mean Annual OHRFC PRISM Mean Annual Precipitation, 1961Precipitation, 1961--9090

Wednesday, October 20, 2004Wednesday, October 20, 2004 OHRFC TAC Meeting PresentationOHRFC TAC Meeting Presentation
NOAA
Raingauge Raingauge StationsStations

Wednesday, October 20, 2004Wednesday, October 20, 2004 OHRFC TAC Meeting PresentationOHRFC TAC Meeting Presentation
NOAA
2002 MPE2002 MPE xmrg xmrg Precipitation Precipitation EstimateEstimate

Wednesday, October 20, 2004Wednesday, October 20, 2004 OHRFC TAC Meeting PresentationOHRFC TAC Meeting Presentation
NOAA
CoCo--op op Raingauge Raingauge NetworkNetwork2002 Precipitation Estimate2002 Precipitation Estimate

Wednesday, October 20, 2004Wednesday, October 20, 2004 OHRFC TAC Meeting PresentationOHRFC TAC Meeting Presentation
NOAA
Bias CalculationBias Calculation
MPE xmrgprecipitation
Co-op gauge networkprecipitation
bias = Coop raingauge network precipitationMPE xmrg precipitation

Wednesday, October 20, 2004Wednesday, October 20, 2004 OHRFC TAC Meeting PresentationOHRFC TAC Meeting Presentation
NOAA
2002 Estimated MPE/2002 Estimated MPE/xmrg xmrg BiasBias

Wednesday, October 20, 2004Wednesday, October 20, 2004 OHRFC TAC Meeting PresentationOHRFC TAC Meeting Presentation
NOAA
MPE/MPE/xmrg xmrg Bias CommentsBias Comments
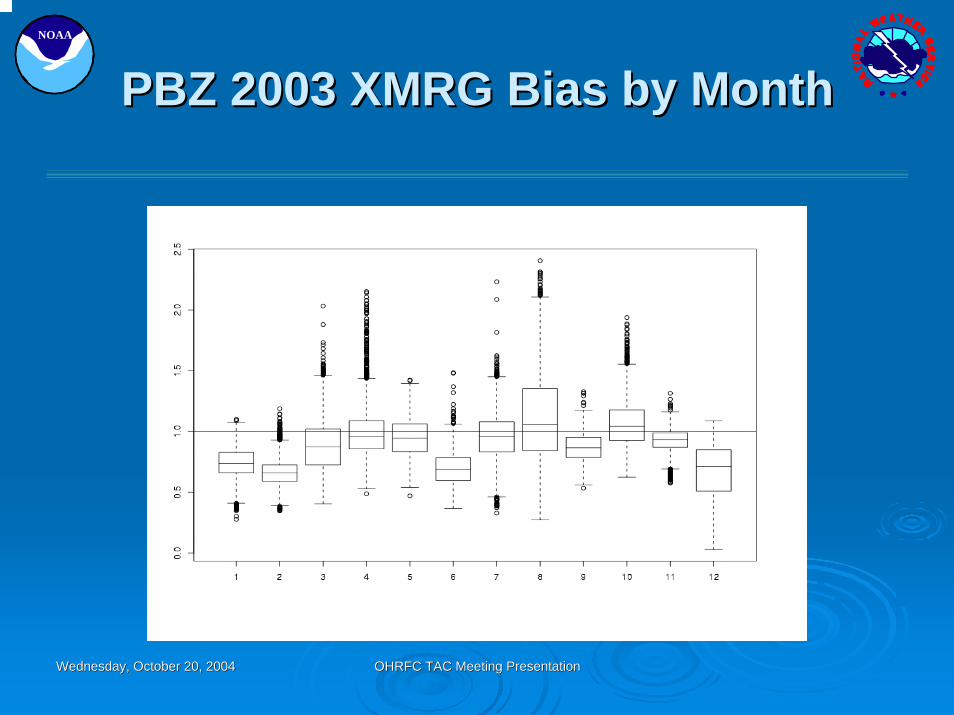
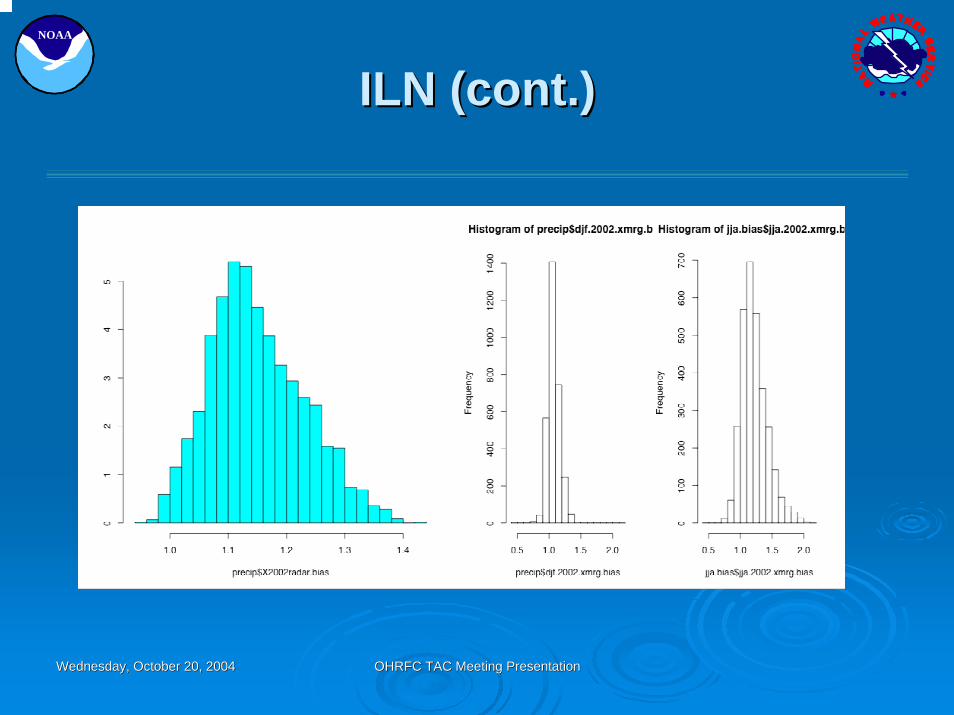
Bias = 1.0, implies perfect agreementBias = 1.0, implies perfect agreementBias < 1.0, underBias < 1.0, under--estimationestimationBias > 1.0, overBias > 1.0, over--estimationestimation
Distinct regions of overDistinct regions of over-- & under& under--estimationestimationUnderUnder--estimation:estimation:
•• PBZ & BUF (Allegheny & Monongahela R. basins) and somewhat for CPBZ & BUF (Allegheny & Monongahela R. basins) and somewhat for CLE & IWX (Great LE & IWX (Great Lakes drainage)Lakes drainage)
OverOver--estimation:estimation:•• ILX, OHX, & ILNILX, OHX, & ILN—— Indiana & Ohio, Lower Cumberland R., Little Wabash, & Lower Indiana & Ohio, Lower Cumberland R., Little Wabash, & Lower
Wahash R. basinsWahash R. basins
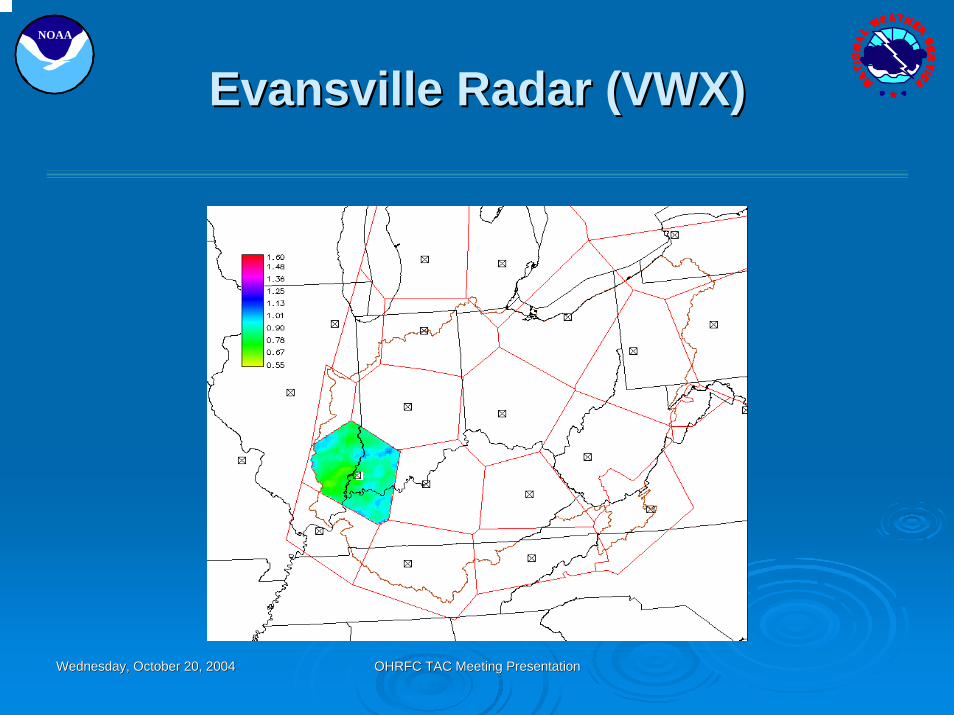
Features due to radar index field (Features due to radar index field (Thiessen polygonsThiessen polygons) boundaries) boundariesInfluence of local beam blockage apparent Influence of local beam blockage apparent —— IND, LVX, & PBZIND, LVX, & PBZ

Wednesday, October 20, 2004Wednesday, October 20, 2004 OHRFC TAC Meeting PresentationOHRFC TAC Meeting Presentation
NOAA
MPE Radar BoundariesMPE Radar Boundaries

Wednesday, October 20, 2004Wednesday, October 20, 2004 OHRFC TAC Meeting PresentationOHRFC TAC Meeting Presentation
NOAA
MPE Radar Boundaries (cont.)MPE Radar Boundaries (cont.)

Wednesday, October 20, 2004Wednesday, October 20, 2004 OHRFC TAC Meeting PresentationOHRFC TAC Meeting Presentation
NOAA
MPE Radar Boundaries (cont.)MPE Radar Boundaries (cont.)

Wednesday, October 20, 2004Wednesday, October 20, 2004 OHRFC TAC Meeting PresentationOHRFC TAC Meeting Presentation
NOAA
OHRFC Radar Heights FieldOHRFC Radar Heights Field
Wednesday, October 20, 2004Wednesday, October 20, 2004 OHRFC TAC Meeting PresentationOHRFC TAC Meeting Presentation
NOAA
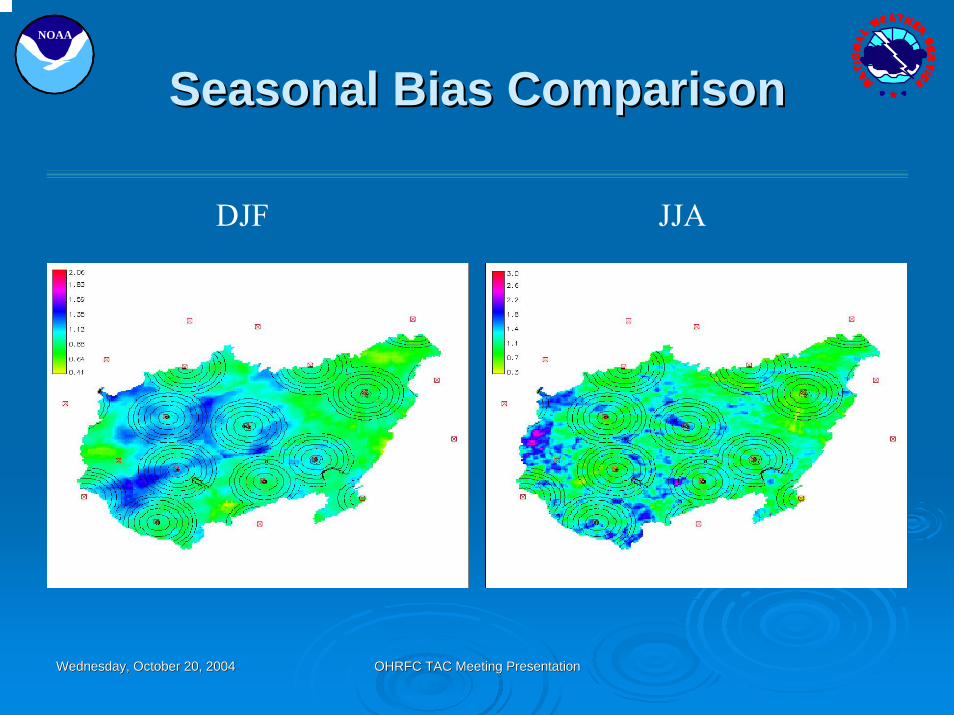
Seasonal Bias ComparisonSeasonal Bias Comparison
DJF JJA

Wednesday, October 20, 2004Wednesday, October 20, 2004 OHRFC TAC Meeting PresentationOHRFC TAC Meeting Presentation
NOAA
Local EffectsLocal Effects

Wednesday, October 20, 2004Wednesday, October 20, 2004 OHRFC TAC Meeting PresentationOHRFC TAC Meeting Presentation
NOAA
2002 Bias Comparison2002 Bias Comparison(cont.)(cont.)
0.95 ≤ Acceptable Bias ≤ 1.05 0.90 ≤ Acceptable Bias ≤ 1.10

Wednesday, October 20, 2004Wednesday, October 20, 2004 OHRFC TAC Meeting PresentationOHRFC TAC Meeting Presentation
NOAA
Seasonal Bias ComparisonSeasonal Bias Comparison(cont.)(cont.)
DJF JJA
0.95 ≤ Acceptable Bias ≤ 1.05
0.90 ≤ Acceptable Bias ≤ 1.10

Wednesday, October 20, 2004Wednesday, October 20, 2004 OHRFC TAC Meeting PresentationOHRFC TAC Meeting Presentation
NOAA
Seasonal Bias ComparisonSeasonal Bias Comparison(cont.)(cont.)
DJF JJA

Wednesday, October 20, 2004Wednesday, October 20, 2004 OHRFC TAC Meeting PresentationOHRFC TAC Meeting Presentation
NOAA
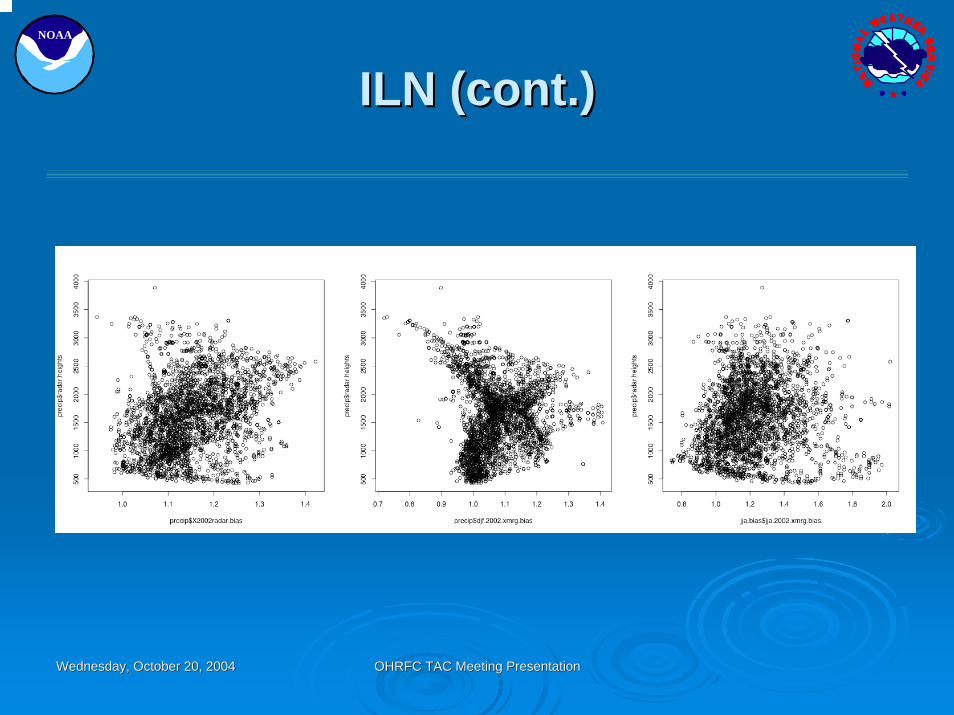
Bias as a Function ofBias as a Function ofRadar Beam HeightRadar Beam Height

Wednesday, October 20, 2004Wednesday, October 20, 2004 OHRFC TAC Meeting PresentationOHRFC TAC Meeting Presentation
NOAA
2002 & 2003 Comparison2002 & 2003 Comparison

Wednesday, October 20, 2004Wednesday, October 20, 2004 OHRFC TAC Meeting PresentationOHRFC TAC Meeting Presentation
NOAA
2002 & 2003 Comparison2002 & 2003 Comparison(cont.)(cont.)

Wednesday, October 20, 2004Wednesday, October 20, 2004 OHRFC TAC Meeting PresentationOHRFC TAC Meeting Presentation
NOAA
2002 Seasonal Comparison2002 Seasonal Comparison

Wednesday, October 20, 2004Wednesday, October 20, 2004 OHRFC TAC Meeting PresentationOHRFC TAC Meeting Presentation
NOAA
2003 Seasonal Comparison2003 Seasonal Comparison

Wednesday, October 20, 2004Wednesday, October 20, 2004 OHRFC TAC Meeting PresentationOHRFC TAC Meeting Presentation
NOAA
Hydrologic Impact of RadarHydrologic Impact of Radar--Precipitation BiasPrecipitation Bias
Hydrologic response is highly Hydrologic response is highly nonlinearnonlinearImpacts to daily forecastsImpacts to daily forecasts
Peak flowsPeak flowsFlow volumesFlow volumes
Model states affected for long lead Model states affected for long lead time ESP/AHPS forecaststime ESP/AHPS forecastsImpacts on weekly, monthly, Impacts on weekly, monthly, annual water balanceannual water balanceImpacts FFG Impacts FFG —— Flash Flood Flash Flood watches & warningswatches & warningsTimeliness of RFC forecasts Timeliness of RFC forecasts delayed due to increaseddelayed due to increased staff staff workload to make precipitation workload to make precipitation correctionscorrections

Wednesday, October 20, 2004Wednesday, October 20, 2004 OHRFC TAC Meeting PresentationOHRFC TAC Meeting Presentation
NOAA
Bias Summary 2002 Bias Summary 2002 by Basinby Basin
BasinBasin Min.Min. 1st1st--Qu.Qu. MedianMedian MeanMean 3rd3rd--Qu.Qu. Max.Max.AGUAGU 0.66450.6645 0.85270.8527 0.90100.9010 0.90040.9004 0.94280.9428 1.22001.2200
AGLAGL 0.76400.7640 0.89800.8980 0.94760.9476 0.95460.9546 1.00501.0050 1.23601.2360
MNUMNU 0.53420.5342 0.83070.8307 0.89790.8979 0.89290.8929 0.96410.9641 1.15301.1530
MNLMNL 0.61570.6157 0.90120.9012 0.94810.9481 0.94120.9412 0.98430.9843 1.14101.1410
OHWOHW 0.56460.5646 0.83120.8312 0.87170.8717 0.87790.8779 0.92500.9250 1.79901.7990
KANKAN 0.65860.6586 0.97710.9771 1.04001.0400 1.02601.0260 1.08101.0810 1.36901.3690
SAYSAY 0.83470.8347 1.00001.0000 1.06201.0620 1.05601.0560 1.11601.1160 1.23301.2330
SCISCI 0.97950.9795 1.08701.0870 1.13901.1390 1.14101.1410 1.19301.1930 1.33601.3360
MIMMIM 0.98200.9820 1.11601.1160 1.16001.1600 1.17301.1730 1.23101.2310 1.37401.3740
MAUMAU 0.83780.8378 0.98010.9801 1.03601.0360 1.04301.0430 1.09701.0970 1.38101.3810
CMUCMU 0.53720.5372 0.90710.9071 0.99460.9946 0.99510.9951 1.10601.1060 1.25401.2540
WBUWBU 0.82230.8223 0.95920.9592 1.05201.0520 1.05801.0580 1.13001.1300 1.43501.4350
WBLWBL 0.88540.8854 1.14301.1430 1.21301.2130 1.22201.2220 1.29201.2920 1.71301.7130
LWALWA 0.88540.8854 1.07701.0770 1.16801.1680 1.17101.1710 1.26101.2610 1.52701.5270

Wednesday, October 20, 2004Wednesday, October 20, 2004 OHRFC TAC Meeting PresentationOHRFC TAC Meeting Presentation
NOAA
Bias Summary DJF 2002 Bias Summary DJF 2002 by Basinby Basin
BasinBasin Min.Min. 1st1st--Qu.Qu. MedianMedian MeanMean 3rd3rd--Qu.Qu. Max.Max.AGUAGU 0.46420.4642 0.66220.6622 0.72410.7241 0.73100.7310 0.78900.7890 1.09701.0970
AGLAGL 0.57500.5750 0.79250.7925 0.84630.8463 0.84900.8490 0.89930.8993 1.14001.1400
MNUMNU 0.48970.4897 0.75580.7558 0.82850.8285 0.81130.8113 0.88380.8838 0.99680.9968
MNLMNL 0.62940.6294 0.83090.8309 0.87190.8719 0.86230.8623 0.90590.9059 1.10601.1060
OHWOHW 0.64910.6491 0.84280.8428 0.87010.8701 0.86560.8656 0.89110.8911 1.08201.0820
KANKAN 0.52150.5215 0.88640.8864 0.92910.9291 0.93810.9381 0.99070.9907 1.22001.2200
SAYSAY 0.80830.8083 0.94160.9416 0.97160.9716 0.98160.9816 1.02301.0230 1.21701.2170
SCISCI 0.91710.9171 1.02001.0200 1.06201.0620 1.07301.0730 1.11501.1150 1.40801.4080
MIMMIM 0.82750.8275 1.00701.0070 1.06301.0630 1.09401.0940 1.16501.1650 1.36001.3600
MAUMAU 0.69270.6927 0.89070.8907 0.95390.9539 0.95410.9541 1.00901.0090 1.20501.2050
CMUCMU 0.46850.4685 0.79490.7949 0.89360.8936 0.86050.8605 0.94460.9446 1.20901.2090
WBUWBU 0.78520.7852 0.92130.9213 1.01601.0160 1.02301.0230 1.09701.0970 1.42201.4220
WBLWBL 0.52080.5208 0.96630.9663 1.07101.0710 1.05401.0540 1.15301.1530 2.06402.0640
LWALWA 0.55110.5511 0.70540.7054 0.82670.8267 0.80150.8015 0.89290.8929 1.00801.0080

Wednesday, October 20, 2004Wednesday, October 20, 2004 OHRFC TAC Meeting PresentationOHRFC TAC Meeting Presentation
NOAA
Bias Summary JJA 2002 Bias Summary JJA 2002 by Basinby Basin
BasinBasin Min.Min. 1st1st--Qu.Qu. MedianMedian MeanMean 3rd3rd--Qu.Qu. Max.Max.AGUAGU 0.57790.5779 0.85180.8518 0.92980.9298 0.94190.9419 1.01501.0150 1.40701.4070
AGLAGL 0.69790.6979 0.95630.9563 1.06401.0640 1.09101.0910 1.19301.1930 1.82201.8220
MNUMNU 0.40510.4051 0.84640.8464 0.98740.9874 0.99190.9919 1.16001.1600 1.51601.5160
MNLMNL 0.48190.4819 0.88710.8871 1.01301.0130 0.99220.9922 1.09301.0930 1.51001.5100
OHWOHW 0.42620.4262 0.73050.7305 0.82460.8246 0.84440.8444 0.94100.9410 2.68602.6860
KANKAN 0.28760.2876 1.00401.0040 1.12301.1230 1.12401.1240 1.24501.2450 2.29802.2980
SAYSAY 0.68420.6842 1.01401.0140 1.17001.1700 1.15001.1500 1.28101.2810 1.75401.7540
SCISCI 0.82570.8257 1.06001.0600 1.14401.1440 1.17101.1710 1.25501.2550 1.75601.7560
MIMMIM 0.74510.7451 1.09801.0980 1.23201.2320 1.27501.2750 1.40201.4020 2.01502.0150
MAUMAU 0.68970.6897 1.03701.0370 1.18401.1840 1.18601.1860 1.33901.3390 1.98001.9800
CMUCMU 0.51520.5152 1.10501.1050 1.33201.3320 1.33101.3310 1.53601.5360 2.34102.3410
WBUWBU 0.75370.7537 0.95690.9569 1.05801.0580 1.08701.0870 1.19601.1960 1.77501.7750
WBLWBL 0.30040.3004 1.17301.1730 1.41801.4180 1.41501.4150 1.62501.6250 2.60102.6010
LWALWA 0.99770.9977 1.49601.4960 1.70401.7040 1.73201.7320 1.95001.9500 2.99102.9910
Wednesday, October 20, 2004Wednesday, October 20, 2004 OHRFC TAC Meeting PresentationOHRFC TAC Meeting Presentation
NOAA
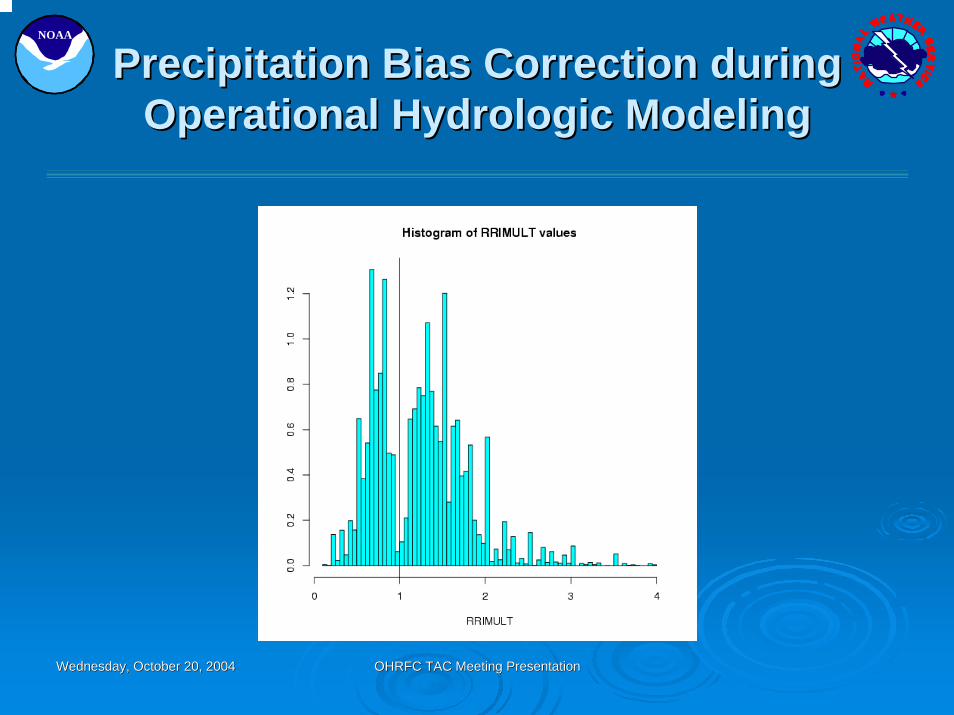
Precipitation Bias Correction during Precipitation Bias Correction during Operational Hydrologic ModelingOperational Hydrologic Modeling

Wednesday, October 20, 2004Wednesday, October 20, 2004 OHRFC TAC Meeting PresentationOHRFC TAC Meeting Presentation
NOAA
Hydrograph without biasHydrograph without biascorrectioncorrection

Wednesday, October 20, 2004Wednesday, October 20, 2004 OHRFC TAC Meeting PresentationOHRFC TAC Meeting Presentation
NOAA
Hydrograph with precipitationHydrograph with precipitationbias bias correction (~1.75)correction (~1.75)

Wednesday, October 20, 2004Wednesday, October 20, 2004 OHRFC TAC Meeting PresentationOHRFC TAC Meeting Presentation
NOAA
NWSRFS OFS Runtime NWSRFS OFS Runtime ModificationsModifications
Mod TypeMod Type ~Relative Frequency (%)~Relative Frequency (%)TSCHNGTSCHNG 2828
RRIMULTRRIMULT 1616
UHGCHNGUHGCHNG 1212
CHGBLENDCHGBLEND 1111
RRICHNGRRICHNG 1111
BASEFBASEF 99
SACBASEFSACBASEF 88
Approximately 1-year (227000 Mods)

Wednesday, October 20, 2004Wednesday, October 20, 2004 OHRFC TAC Meeting PresentationOHRFC TAC Meeting Presentation
NOAA
BUCW2NBUCW2N
Precipitation Bias by Basin
% Bias
% MONTHLY VOL RMS ERROR
DISCHARGE RATIO (SIM/OBS)
MEAN % ERROR (AVGOBSQ-AVGSIMQ)/AVGOBSQ
0.80 -36.65 54.22 0.62 -40.50
0.90 -19.69 38.43 0.87 -20.60
0.95 -11.06 33.16 1.00 -10.60
1.00 -2.26 30.90 1.13 -0.70
1.05 6.65 32.23 1.26 8.70
1.10 15.70 36.86 1.37 17.40
1.20 33.90 51.90 1.58 34.00

Wednesday, October 20, 2004Wednesday, October 20, 2004 OHRFC TAC Meeting PresentationOHRFC TAC Meeting Presentation
NOAA
CARI3CARI3
Precipitation Bias by Basin
% Bias
% MONTHLY VOL RMS ERROR
DISCHARGE RATIO (SIM/OBS)
MEAN % ERROR (AVGOBSQ-AVGSIMQ)/AVGOBSQ
0.80 -41.73 64.61 0.32 -64.80
0.90 -21.44 42.83 0.57 -37.50
0.95 -10.96 34.19 0.72 -22.90
1.00 -0.11 29.83 0.86 -8.30
1.05 11.01 32.17 1.02 6.50
1.10 22.35 40.30 1.17 21.30
1.20 45.44 64.65 1.50 51.10

Wednesday, October 20, 2004Wednesday, October 20, 2004 OHRFC TAC Meeting PresentationOHRFC TAC Meeting Presentation
NOAA
FLFK2NFLFK2N
Precipitation Bias by Basin
% Bias
% MONTHLY VOL RMS ERROR
DISCHARGE RATIO (SIM/OBS)
MEAN % ERROR (AVGOBSQ-AVGSIMQ)/AVGOBSQ
0.80 -44.39 73.12 0.44 -47.80
0.90 -22.78 48.40 0.69 -24.80
0.95 -11.68 39.56 0.81 -13.60
1.00 -0.28 35.55 0.93 -3.30
1.05 11.32 38.01 1.03 6.50
1.10 23.17 46.03 1.13 15.90
1.20 47.16 70.08 1.33 34.30

Wednesday, October 20, 2004Wednesday, October 20, 2004 OHRFC TAC Meeting PresentationOHRFC TAC Meeting Presentation
NOAA
FTNI3FTNI3
Precipitation Bias by Basin
% Bias
% MONTHLY VOL RMS ERROR
DISCHARGE RATIO (SIM/OBS)
MEAN % ERROR (AVGOBSQ-AVGSIMQ)/AVGOBSQ
0.80 -47.19 78.17 0.43 -53.50
0.90 -24.17 54.84 0.65 -26.60
0.95 -12.29 46.81 0.80 -10.20
1.00 -0.05 43.53 0.95 6.60
1.05 12.52 46.41 1.11 24.10
1.10 25.46 54.73 1.29 41.80
1.20 51.63 80.04 1.62 75.90

Wednesday, October 20, 2004Wednesday, October 20, 2004 OHRFC TAC Meeting PresentationOHRFC TAC Meeting Presentation
NOAA
Runoff Bias versusRunoff Bias versusPrecipitation BiasPrecipitation Bias

Wednesday, October 20, 2004Wednesday, October 20, 2004 OHRFC TAC Meeting PresentationOHRFC TAC Meeting Presentation
NOAA
October 2002 PrecipitationOctober 2002 Precipitation

Wednesday, October 20, 2004Wednesday, October 20, 2004 OHRFC TAC Meeting PresentationOHRFC TAC Meeting Presentation
NOAA
Current SACCurrent SAC--SMA Model StatesSMA Model StatesIndicated by Flow Probability ofIndicated by Flow Probability of ExceedanceExceedance

Wednesday, October 20, 2004Wednesday, October 20, 2004 OHRFC TAC Meeting PresentationOHRFC TAC Meeting Presentation
NOAA
Flash Flood GuidanceFlash Flood Guidance
Runoff
PrecipitationFFGT=2
R
FFG T=1
T = 1
T = 2
Drying

Wednesday, October 20, 2004Wednesday, October 20, 2004 OHRFC TAC Meeting PresentationOHRFC TAC Meeting Presentation
NOAA
Case Example: Welsh, WV May 2 Case Example: Welsh, WV May 2 -- 3, 20023, 2002OHRFCOHRFC--wide FFGwide FFG
County FFG 05/01/2002County FFG 05/01/2002
Gridded Gridded FFG 05/01/2002FFG 05/01/2002
County FFG 05/03/2002County FFG 05/03/2002
Gridded Gridded FFG 05/03/2002FFG 05/03/2002

Wednesday, October 20, 2004Wednesday, October 20, 2004 OHRFC TAC Meeting PresentationOHRFC TAC Meeting Presentation
NOAA
Case Example: Welsh, WV May 2 Case Example: Welsh, WV May 2 -- 3, 20023, 20022424--hr & 6hr & 6--hr Precipitation Accumulationhr Precipitation Accumulation

Wednesday, October 20, 2004Wednesday, October 20, 2004 OHRFC TAC Meeting PresentationOHRFC TAC Meeting Presentation
NOAA
Case Example: Welsh, WV May 2 Case Example: Welsh, WV May 2 -- 3, 20023, 200233--day Time Evolution of FFGday Time Evolution of FFG
05/01/200205/01/2002 05/02/200205/02/2002 05/03/200205/03/2002
Wednesday, October 20, 2004Wednesday, October 20, 2004 OHRFC TAC Meeting PresentationOHRFC TAC Meeting Presentation
NOAA
Evansville Radar (VWX)Evansville Radar (VWX)

Wednesday, October 20, 2004Wednesday, October 20, 2004 OHRFC TAC Meeting PresentationOHRFC TAC Meeting Presentation
NOAA
Evansville XMRG BiasesEvansville XMRG Biases

Wednesday, October 20, 2004Wednesday, October 20, 2004 OHRFC TAC Meeting PresentationOHRFC TAC Meeting Presentation
NOAA
JKLJKL

Wednesday, October 20, 2004Wednesday, October 20, 2004 OHRFC TAC Meeting PresentationOHRFC TAC Meeting Presentation
NOAA
JKL 2002 & 2003 BiasesJKL 2002 & 2003 Biases

Wednesday, October 20, 2004Wednesday, October 20, 2004 OHRFC TAC Meeting PresentationOHRFC TAC Meeting Presentation
NOAA
JKL 2002 & 2003 Biases (cont.)JKL 2002 & 2003 Biases (cont.)

Wednesday, October 20, 2004Wednesday, October 20, 2004 OHRFC TAC Meeting PresentationOHRFC TAC Meeting Presentation
NOAA
JKL 2002 & 2003 Seasonal JKL 2002 & 2003 Seasonal ComparisonComparison

Wednesday, October 20, 2004Wednesday, October 20, 2004 OHRFC TAC Meeting PresentationOHRFC TAC Meeting Presentation
NOAA
JKL 2003 Biases by MonthJKL 2003 Biases by Month

Wednesday, October 20, 2004Wednesday, October 20, 2004 OHRFC TAC Meeting PresentationOHRFC TAC Meeting Presentation
NOAA
PBZPBZ

Wednesday, October 20, 2004Wednesday, October 20, 2004 OHRFC TAC Meeting PresentationOHRFC TAC Meeting Presentation
NOAA
PBZ (cont.)PBZ (cont.)

Wednesday, October 20, 2004Wednesday, October 20, 2004 OHRFC TAC Meeting PresentationOHRFC TAC Meeting Presentation
NOAA
PBZ (cont.)PBZ (cont.)
Wednesday, October 20, 2004Wednesday, October 20, 2004 OHRFC TAC Meeting PresentationOHRFC TAC Meeting Presentation
NOAA
PBZ 2003 XMRG Bias by MonthPBZ 2003 XMRG Bias by Month

Wednesday, October 20, 2004Wednesday, October 20, 2004 OHRFC TAC Meeting PresentationOHRFC TAC Meeting Presentation
NOAA
RLXRLX

Wednesday, October 20, 2004Wednesday, October 20, 2004 OHRFC TAC Meeting PresentationOHRFC TAC Meeting Presentation
NOAA
RLX (cont.)RLX (cont.)

Wednesday, October 20, 2004Wednesday, October 20, 2004 OHRFC TAC Meeting PresentationOHRFC TAC Meeting Presentation
NOAA
RLX (cont.)RLX (cont.)

Wednesday, October 20, 2004Wednesday, October 20, 2004 OHRFC TAC Meeting PresentationOHRFC TAC Meeting Presentation
NOAA
ILNILN
Wednesday, October 20, 2004Wednesday, October 20, 2004 OHRFC TAC Meeting PresentationOHRFC TAC Meeting Presentation
NOAA
ILN (cont.)ILN (cont.)
Wednesday, October 20, 2004Wednesday, October 20, 2004 OHRFC TAC Meeting PresentationOHRFC TAC Meeting Presentation
NOAA
ILN (cont.)ILN (cont.)

Wednesday, October 20, 2004Wednesday, October 20, 2004 OHRFC TAC Meeting PresentationOHRFC TAC Meeting Presentation
NOAA
Purposes of RCA/CSSAPurposes of RCA/CSSA
David Kitzmiller, Dongjun Seo, Feng Ding, David Riley(Hydrologic Science and Modeling Branch) and Christine Dietz, Cham Pham, Dennis Miller (Hydrologic Software Engineering Branch) — TAC Briefing, July 2004Range Correction Algorithm (RCA)Range Correction Algorithm (RCA)
Mitigate rainfall overestimation associated with bright bandMitigate rainfall overestimation associated with bright bandMitigate rainfall underestimation at longer rangesMitigate rainfall underestimation at longer ranges
ConvectiveConvective--Stratiform Stratiform Separation Algorithm (CSSA)Separation Algorithm (CSSA)Identify areas of shallow and deep convective precipitationIdentify areas of shallow and deep convective precipitationData from convective zones is excluded from RCA adjustmentData from convective zones is excluded from RCA adjustment

Wednesday, October 20, 2004Wednesday, October 20, 2004 OHRFC TAC Meeting PresentationOHRFC TAC Meeting Presentation
NOAA
Operational NeedsOperational Needs
Errors in precipitation estimates are often magnified in Errors in precipitation estimates are often magnified in runoff errorsrunoff errorsCoolCool--season radar rainfall estimates often feature brightseason radar rainfall estimates often feature bright--band and rangeband and range--degradation features that negatively degradation features that negatively affect:affect:
Operational precipitation analyses and verificationOperational precipitation analyses and verificationHydrologic forecastsHydrologic forecastsRiver Forecast Center workloadRiver Forecast Center workload
Mosaic algorithms and local gauge corrections are often Mosaic algorithms and local gauge corrections are often inadequate to mitigate these effectsinadequate to mitigate these effects

Wednesday, October 20, 2004Wednesday, October 20, 2004 OHRFC TAC Meeting PresentationOHRFC TAC Meeting Presentation
NOAA
Operational NeedsOperational Needs
Statement of Need from OS&T and OCCWS in June 2003Statement of Need from OS&T and OCCWS in June 2003NEXRAD Active Technical Needs, TAC TNNEXRAD Active Technical Needs, TAC TN--10 states:10 states:
“Problems have been noted with VCP constraints, range“Problems have been noted with VCP constraints, range--dependent dependent effects, the radar bright band, ground clutter and beam occultateffects, the radar bright band, ground clutter and beam occultation, ion, iceice--phase precipitation, and other factors.phase precipitation, and other factors.””Demands on radar data are increasing:Demands on radar data are increasing:
Implementing advances in hydrologic modeling requires Implementing advances in hydrologic modeling requires utilization of radar inpututilization of radar inputNational Digital Forecast Database verification also requires National Digital Forecast Database verification also requires accurate radar inputaccurate radar inputRadarRadar--based estimates are disseminated publiclybased estimates are disseminated publicly

Wednesday, October 20, 2004Wednesday, October 20, 2004 OHRFC TAC Meeting PresentationOHRFC TAC Meeting Presentation
NOAA
RCA ProcessRCA Process
Construct Construct arealareal--mean Vertical Profile of mean Vertical Profile of Reflectivity (VPR) from latest volumetric scanReflectivity (VPR) from latest volumetric scanObservations close to radar provide information Observations close to radar provide information on reflectivity near surfaceon reflectivity near surfaceUse VPR to estimate nearUse VPR to estimate near--surface reflectivity at surface reflectivity at ranges where lowest radar beam intersects ranges where lowest radar beam intersects melting layer, snow, or differing hydrometeor melting layer, snow, or differing hydrometeor distribution aloftdistribution aloft
Wednesday, October 20, 2004Wednesday, October 20, 2004 OHRFC TAC Meeting PresentationOHRFC TAC Meeting Presentation
NOAA
Post Analysis of Field ResultsPost Analysis of Field Results
By applying range adjustment and meanBy applying range adjustment and mean--field bias field bias correction, obtained consistent and significant correction, obtained consistent and significant improvement in radar estimates, in terms of:improvement in radar estimates, in terms of:
Bias with respect to gauge amountsBias with respect to gauge amountsMean absolute error (MAE)Mean absolute error (MAE)RootRoot--mean squared (RMS) errormean squared (RMS) errorRelative frequency of large errorsRelative frequency of large errors

Wednesday, October 20, 2004Wednesday, October 20, 2004 OHRFC TAC Meeting PresentationOHRFC TAC Meeting Presentation
NOAA Improvement Due To CorrectionsImprovement Due To Corrections::Radar/Gauge Mean Absolute Error (3Radar/Gauge Mean Absolute Error (3--hour)hour)
00.050.1
0.150.2
0.250.3
0.35
KRTX KTLX KEAX KRLX KPBZ KLWX ALL
Original Range+MFB correction
Inch

Wednesday, October 20, 2004Wednesday, October 20, 2004 OHRFC TAC Meeting PresentationOHRFC TAC Meeting Presentation
NOAA Improvement Due To Corrections:Improvement Due To Corrections:Radar/Gauge RMS Error (3Radar/Gauge RMS Error (3--Hour)Hour)
0
0.1
0.2
0.3
0.4
0.5
KRTX KTLX KEAX KRLX KPBZ KLWX ALL
Original Range+MFB correction
Inch

Wednesday, October 20, 2004Wednesday, October 20, 2004 OHRFC TAC Meeting PresentationOHRFC TAC Meeting Presentation
NOAA Improvement Due To Corrections:Improvement Due To Corrections:Improvements in 1Improvements in 1--h Verificationh Verification
0
0.2
0.4
0.6
0.8
1
Gauge/Radar Bias RMSE, inch MAE, inch
Original Range+MFB correction

Wednesday, October 20, 2004Wednesday, October 20, 2004 OHRFC TAC Meeting PresentationOHRFC TAC Meeting Presentation
NOAA Improvement Due To Corrections:Improvement Due To Corrections:Reduction In Number of Large ErrorsReduction In Number of Large Errors
0
5
10
15
20
1-h error > .25" 3-h error > 0.5" 24-h error > 0.6"
Original Range+MFB correction
% Cases

Wednesday, October 20, 2004Wednesday, October 20, 2004 OHRFC TAC Meeting PresentationOHRFC TAC Meeting Presentation
NOAA Improvements Apparent At All Improvements Apparent At All Ranges:Ranges:
33--hh Radar/Gauge Mean Absolute Error as Radar/Gauge Mean Absolute Error as Function of RangeFunction of Range
00.050.1
0.150.2
0.250.3
0.35
< 50 km 50-150 km > 150 km
Original Range+MFB correction
Inch

Wednesday, October 20, 2004Wednesday, October 20, 2004 OHRFC TAC Meeting PresentationOHRFC TAC Meeting Presentation
NOAA Improvements Apparent At All Improvements Apparent At All Ranges:Ranges:
33--hh Radar/Gauge RMS Error as Function of Radar/Gauge RMS Error as Function of RangeRange
00.050.1
0.150.2
0.250.3
0.350.4
0.45
< 50 km 50-150 km > 150 km
Original Range+MFB correction
Inch

Wednesday, October 20, 2004Wednesday, October 20, 2004 OHRFC TAC Meeting PresentationOHRFC TAC Meeting Presentation
NOAA Improvements Apparent At All Improvements Apparent At All Ranges:Ranges:
33--hh Radar/Gauge BiasRadar/Gauge Bias
00.10.20.30.40.50.60.7
< 50 km 50-150 km > 150 km
Gauge Original Radar Range+MFB correction
Inch

Wednesday, October 20, 2004Wednesday, October 20, 2004 OHRFC TAC Meeting PresentationOHRFC TAC Meeting Presentation
NOAA
ConclusionsConclusions
OHRFC NEXRAD/MPE biases are significantOHRFC NEXRAD/MPE biases are significant —— both overboth over-- & under& under--estimationestimationThe hydrologic impact of precipitation biases are very significaThe hydrologic impact of precipitation biases are very significantnt::
Hydrologic response is highly nonlinearHydrologic response is highly nonlinearImpacts to daily forecastsImpacts to daily forecasts
•• Peak flowsPeak flows•• Flow volumesFlow volumes
Model states affected for long lead time ESP/AHPS forecastsModel states affected for long lead time ESP/AHPS forecastsImpacts on weekly, monthly, annual water balanceImpacts on weekly, monthly, annual water balanceImpacts FFG Impacts FFG —— Flash Flood watches & warningsFlash Flood watches & warningsTimeliness of RFC forecasts delayed due to increasedTimeliness of RFC forecasts delayed due to increased staff workload to make precipitation correctionsstaff workload to make precipitation corrections
Sources of biases are well documented in scientific literatureSources of biases are well documented in scientific literatureProposals made by the Office of Hydrologic Development (Proposals made by the Office of Hydrologic Development (Hydrologic Science Hydrologic Science and Modeling Branch & Hydrologic Software Engineering Branchand Modeling Branch & Hydrologic Software Engineering Branch) for ) for Range Range Correction Algorithm (RCA) and Correction Algorithm (RCA) and ConvectiveConvective--Stratiform Stratiform Separation Algorithm Separation Algorithm (CSSA)(CSSA)RCA & CSSA will substantially reduce precipitation biases experiRCA & CSSA will substantially reduce precipitation biases experienced at all enced at all RFCsRFCs, leading to, leading to substantial improvements in the accuracy of hydrologic substantial improvements in the accuracy of hydrologic forecasts and forecasts and theirtheir timelinesstimeliness