next-generation metabolic screening: the application of ... → 3-hydroxyisovalerylcarnitine mcad...
TRANSCRIPT

Next-generation metabolic screening: the
application of untargeted mass spectrometry-
based metabolomics in the diagnostics of Inborn
Errors of Metabolism (IEM) in the individual
patient
Dr. Leo AJ Kluijtmans, Laboratory specialist Clinical Genetics
Dept of Laboratory Medicine, Laboratory Genetic, Endocrine and Metabolic
Diseases, (LGEM) Radboudumc Nijmegen

Radboudumc • One of eight UMCs in the Netherlands • Core activities:
• Patient care • Research • Education
• 11.000 colleagues • 50 departments • 3.000 students • 1.000 beds (ambition to close 500 by improving
healthcare)
• Mission: “To have a significant impact on healthcare” • Strategic focus on Personalized Healthcare

Personalized Healthcare @ Radboudumc
People are different Stratification by multilevel diagnosis
+ Patient’s preference of treatment
Exchange experiences in care communities
Select personalized therapy

Expansion of our IEM knowledge >1000 IEMs
Scriver: The Metabolic & Molecular Bases of
Inherited Disease

Where’s Wally?

Current targeted analysis in diagnostics of IEM
Selected tests
Amino acids
Amino acid analyser
Carnitine-ester profile
LC-MS/MS
Purines & pyrimidines
- HPLC & LC-MS/MS
Monosaccharides
GC-MS

2012
Patient Targeted
Metabolic
screen
Targeted
gene
analysis
Diagnosis
+ follow-up
2013 / 2014
Patient
Whole
exome
sequencing Targeted
confirmatory
metabolite +
enzyme
testing
Diagnosis
+ follow-up
Targeted assays vs holistic approach
Next
generation
metabolic
screening
Times are changing… whole exome analysis

Aims Metabolomics
• Development of validated LC-MS based metabolic profiling assay in body
fluids
• Identify normal profiles and normal “concentration” ranges of metabolites
• Application of LC-MS based metabolomics in the diagnostics of IEM in an
individual patient


A plasma profile by UPLC-QTOF
A typical plasma sample
shows ~10.000 “features”
Maybe

Human plasma
Control vs. IEM
Agilent QTOF MS-data
- Reverse phase liquid chromatography - Positive and negative mode - Features
•Accurate mass (165.07898) • Retention time •Intensity
(New) biomarkers for diseases
XCMS
Alignment
Peak comparison
> 10000 Features
Metabolomics – analysis of “all” metabolites

Proof of Principle: PKU

Proof of principle: UHPLC-TOF analysis of plasma

Which one is the biomarker?
10480
10480 Features Mass, Retention time, Intensity
Experiment
Alignment
Peak Comparison
Raw data
t-test with B.C.
Intensity Ranking
Da
ta a
na
lys
es
Identification T20
Verification
Da
ta P
rep
roc
es
sin
g
& P
retr
ea
tme
nt
Da
ta
inte
rpre
tati
on

sG sT Feature
Patiënt 7 Feature
Intensity P-value Mass Ret 1 74 1909 24490807 2E-17 166.08634 3.67 2 51 1695 8386343 8E-21 120.08065 3.67 3 47 1683 2915430 6E-21 167.08956 3.67 4 62 1780 751272 2E-19 121.08385 3.67 5 56 1765 556095 3E-20 103.05433 3.67 6 38 1611 480141 1E-22 120.12527 3.67 7 57 1956 460491 3E-20 166.19191 3.67 8 55 1761 403223 3E-20 131.04910 3.67 9 35 1559 355404 2E-23 188.06796 3.67
10 3 1137 303853 8E-40 295.12893 5.88 11 65 4994 291156 5E-19 188.12476 3.66 12 49 1762 269007 7E-21 107.04902 3.67 13 43 1659 252382 6E-22 168.09171 3.67 14 52 1727 250238 8E-21 149.05937 3.67 15 32 1492 140562 6E-25 120.15785 3.67 16 76 2854 135373 2E-17 189.07304 1.04 17 16 1018 126136 7E-29 328.13918 4.01 18 23 1516 96662 1E-26 120.17050 3.67 19 135 265 93406 1E-10 104.10735 12.85 20 96 670 77111 4E-14 397.23525 14.31 21 128 294 76090 3E-11 104.10733 12.67 22 120 79 64437 3E-12 467.25918 7.45 23 66 1719 61501 6E-19 204.04192 3.67 24 125 89 60054 2E-11 467.00845 7.45 25 121 91 57801 3E-12 622.67550 7.45 26 108 87 57092 9E-13 622.34113 7.45 27 4 1139 51484 2E-37 296.13220 5.88 28 97 65 51462 5E-14 405.22508 12.55
▼
Feature 1909
Control
P7 P7
PKU
Feature 1137
Control
P7 P7
PKU
Patiënt 7

sG sT Feature
Patiënt 7 Feature
Intensity P-value Mass Ret 1 74 1909 24490807 2E-17 166.08634 3.67 2 51 1695 8386343 8E-21 120.08065 3.67 3 47 1683 2915430 6E-21 167.08956 3.67 4 62 1780 751272 2E-19 121.08385 3.67 5 56 1765 556095 3E-20 103.05433 3.67 6 38 1611 480141 1E-22 120.12527 3.67 7 57 1956 460491 3E-20 166.19191 3.67 8 55 1761 403223 3E-20 131.04910 3.67 9 35 1559 355404 2E-23 188.06796 3.67
10 3 1137 303853 8E-40 295.12893 5.88 11 65 4994 291156 5E-19 188.12476 3.66 12 49 1762 269007 7E-21 107.04902 3.67 13 43 1659 252382 6E-22 168.09171 3.67 14 52 1727 250238 8E-21 149.05937 3.67 15 32 1492 140562 6E-25 120.15785 3.67 16 76 2854 135373 2E-17 189.07304 1.04 17 16 1018 126136 7E-29 328.13918 4.01 18 23 1516 96662 1E-26 120.17050 3.67 19 135 265 93406 1E-10 104.10735 12.85 20 96 670 77111 4E-14 397.23525 14.31 21 128 294 76090 3E-11 104.10733 12.67 22 120 79 64437 3E-12 467.25918 7.45 23 66 1719 61501 6E-19 204.04192 3.67 24 125 89 60054 2E-11 467.00845 7.45 25 121 91 57801 3E-12 622.67550 7.45 26 108 87 57092 9E-13 622.34113 7.45 27 4 1139 51484 2E-37 296.13220 5.88 28 97 65 51462 5E-14 405.22508 12.55
▼
Patiënt 7
Feature 2854
Control
P7 P7
PKU
Feature 670
Control
P7 P7
PKU

rI rP Feature
Patiënt 7 Feature
Intensity P-value Mass Ret 1 74 1909 24490807 2E-17 166.08634 3.67 2 51 1695 8386343 8E-21 120.08065 3.67 3 47 1683 2915430 6E-21 167.08956 3.67 4 62 1780 751272 2E-19 121.08385 3.67 5 56 1765 556095 3E-20 103.05433 3.67 6 38 1611 480141 1E-22 120.12527 3.67 7 57 1956 460491 3E-20 166.19191 3.67 8 55 1761 403223 3E-20 131.04910 3.67 9 35 1559 355404 2E-23 188.06796 3.67
10 3 1137 303853 8E-40 295.12893 5.88 11 65 4994 291156 5E-19 188.12476 3.66 12 49 1762 269007 7E-21 107.04902 3.67 13 43 1659 252382 6E-22 168.09171 3.67 14 52 1727 250238 8E-21 149.05937 3.67 15 32 1492 140562 6E-25 120.15785 3.67 16 76 2854 135373 2E-17 189.07304 1.04 17 16 1018 126136 7E-29 328.13918 4.01 18 23 1516 96662 1E-26 120.17050 3.67 19 135 265 93406 1E-10 104.10735 12.85 20 96 670 77111 4E-14 397.23525 14.31 21 128 294 76090 3E-11 104.10733 12.67 22 120 79 64437 3E-12 467.25918 7.45 23 66 1719 61501 6E-19 204.04192 3.67 24 125 89 60054 2E-11 467.00845 7.45 25 121 91 57801 3E-12 622.67550 7.45 26 108 87 57092 9E-13 622.34113 7.45 27 4 1139 51484 2E-37 296.13220 5.88 28 97 65 51462 5E-14 405.22508 12.55
▼
Compound Adduct In-source L-Phenylalanine M+H
L-Phenylalanine + L-Phenylalanine 13C
L-Phenylalanine + L-Phenylalanine + L-Phenylalanine + L-Phenylalanine + L-Phenylalanine + L-Phenylalanine M+Na
Glutamylphenylalanine M+Na
L-Phenylalanine + L-Phenylalanine + L-Phenylalanine + L-Phenylalanine + L-Phenylalanine + Not in all PKU
? L-Phenylalanine +
? ? ? ?
L-Phenylalanine M+K
? ? ?
Glutamylphenylalanine 13C
?
Patiënt 7: Phe=359 (ref 17-140)

Use of My Coumpound ID to annotate

Proof of Principle
• All diagnostic metabolites were identified for the 3 diseases:
PKU → phenylalanine
3MCC → 3-methylcrotonylglycine / 3-hydroxyisovaleric acid
MCAD → octanoylcarnitine, 9-decenoylcarnitine and hexanoylcarnitine
• Additional biomarkers:
PKU → glutamylphenylalanine
3MCC → 3-hydroxyisovalerylcarnitine
MCAD → capryloylglycine, nonanoylcarnitine, suberylglycine, hexanoylglycine
and heptanoylcarnitine
• Unidentified metabolites:
PKU → F1018 (m328.13918; r4.01), possibly addition of hexose to phenylalanine
3MCC → F2197 (m262.164945; rt3.62)
MCAD → Several

A blind study
Plasma sample choice : Dr. C.D.G Huigen
Analytical chemistry : Ing. E. van der Heeft
Chemometrics : Dr. U.F.H. Engelke
Diagnosis : Prof. dr. R.A. Wevers;
Dr. L.A.J. Kluijtmans
10 samples from 10 patients
with 5 different IEM’s
21 controls

The blind study
MSUD (2) → leucine, isoleucine, valine, 3-methyl-2-oxovaleric acid
Aminoacylase I deficiency (2) → N-acetylglutamine, N-acetylglutamic acid,
N-acetylalanine, N-acetylserine, N-acetylasparagine, N-acetylglycine
Prolinemia type II (2) → proline, 1-pyrroline-5-carboxylic acid
Hyperlysinemia (2) → pipecolic acid, lysine, homoarginine, homocitrulline
3-Hydroxy-3-methylglutaryl-CoA lyase deficiency (2) → 3-methylglutaryl-
carnitine, 3-methylglutaconic acid, 3-hydroxy-2-methylbutanoic acid, 3-hydroxy-3-
methylglutaric acid
Diagnostic metabolites found in blood plasma
CONCLUSION:
Five different IEM’s
Correct diagnosis in all 10 patients
Validated method SOP

Targeted metabolomics approach
• Young child, date of birth: 30-06-2013
• Presenting clinical feature @ 08-09-2013: kidney stones
• Usual tests in metabolic screening: organic acids, purines/pyrimidines and
amino acids.
• Xanthine: 413 µmol/mmol (N<50)
• Uric acid: 15 µmol/mmol (N: 200-3000)
• Highly suspected of xanthinuria
• Type I: isolated xanthine oxidase deficiency • Type II: combined XO and aldehyde oxidase deficiency (discrimination by allopurinol loading test; only patients with type I
can metabolize allopurinol via aldehyde oxidase)
• Analysis in plasma sample without allopurinol loading

PRPP
2 Glutamine
Glycine
Aspartate
N5,N10-methenyl-THF
N10-formyl-THF
4 ATP
HCO3-
IMP
Ino
Hypoxanthine
Succinyl-AMP
AMP
Ado
ADP
ATP
dADP
dATP
dAMP
dAdo
RR
XMP
GMP
Guo
Guanine
Xanthosine
Xanthine
Uric acid
GDP
GTP dGTP
dGDP
dGMP
dGuo
RR
Adenine
IMPDH
DNADNA RNARNA
1 2 2
3333
4
5677
89 9 9 9 9 9 10
18
10
15
18
1111
11
11
12
13
14
14
15
16
17
Figure 3: Purine metabolism
Enzymes
IMPDH: IMP dehydrogenase
RR: Ribonucleotide reductase
1: GMP synthetase
2: (d)GMP kinase
3: Nucleoside diphosphate kinase
4: GMP reductase
5: Adenylosuccinate synthetase
6: AMP lyase
7: AMP kinase (myokinase)
8: AMP deaminase
9: 5’-Nucleotidase
10: dGuo kinase
11: Purine nucleoside phosphorylase
12: Hypoxanthine-guanine phosphorybosyl transferase (HGPRT)
13: Guanine deaminase
14: Xanthine oxidase
15: Ado kinase
16: Ado deaminase
17: Adenine phosphoribosyl transferase (APRT)
18: dCyd kinase
12
Purine metabolisme

Targeted: Marker compounds common to type I and type II xanthinuria
Hypoxanthine
Xanthine Uric acid
Xanthosine
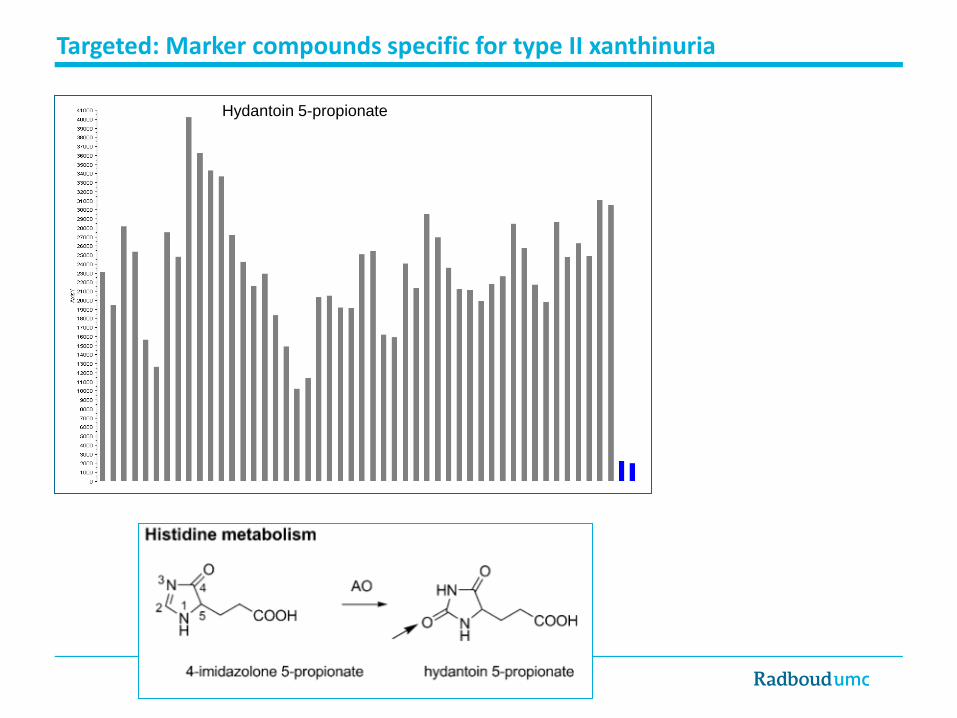
Targeted: Marker compounds specific for type II xanthinuria
Hydantoin 5-propionate

N-(3-acetamidopropyl) pyrrolidin-2-one
Targeted: Marker compounds specific for type II xanthinuria

Targeted: Marker compounds specific for type II xanthinuria
pyridoxal

Conclusions • We have developed a reversed-phase LC-QTOF assay that is applicable in a
diagnostic setting, both in an untargeted (several IEMs) and in a targeted approach
(xanthinuria type II). C
• CV in RTs: <0,5%; CV in signal intensity: <15%.
• Assay applicable to plasma, urine (neg mode: 1 mM kreat; pos mode 5 mM kreat)
and CSF samples.
• Diagnosis has been established in patients with the following diseases: PKU, MCAD,
VLCAD, MCC, amino acylase I, MSUD, MAT I/III, HMG-CoA lyase, Prolinemia type II,
Xanthinuria type II and Hyperlysinemia
• Challenges:
• extension of assay to more polar compounds (HILIC) and apolar compounds
(lipidomics)
• Application of QTOF assay in 50 WES patients with ‘metabolic filter (543 genes)
and comparison metabolomics and exome data: functional exome analysis!

Where’s Wally?

Acknowledgments
• Laboratory Genetic Endocrine and Metabolic Diseases, Dept of Laboratory Medicine, Radboudumc
Udo Engelke
Ed van der Heeft
Siebolt de Boer
Marleen Huigen
Ron Wevers
• Dept. of Analytical Chemistry/Chemometrics; Institute of Molecules and Materials, Radboud University
Jasper Engel


Interaction of genome and environment shape the metabolome

Targeted: Marker compounds specific for type II xanthinuria
N-Methylnicotinamide Pyridone carboxamide

Mass 153.0407
QTOF plasma metabolomics ESI+
5 x10
0
0.5
1
1.5
2
2.5
3
3.5
5 x10
0
0.5
1
1.5
2
2.5
3
3.5
5 x10
0
0.5
1
1.5
2
2.5
3
3.5
Counts vs. Acquisition Time (min)
1.7 1.72 1.74 1.76 1.78 1.8 1.82 1.84 1.86 1.88 1.9 1.92 1.94 1.96 1.98 2 2.02 2.04 2.06 2.08 2.1 2.12 2.14 2.16 2.18 2.2 2.22 2.24 2.26 2.28 2.3 2.32 2.34 2.36 2.38 2.4 2.42 2.44 2.46 2.48 2.5
Control
Patient with xanthineria, type II
“Control” using allopurinol
Xanthine
Xanthine (11 µmol/l)
Xanthine (10 µmol/l)
Oxypurinol (47 µmol/l)
Oxypurinol
M=152.03343
Xanthine
M=152.03343

Ion-exchange chromatography
concentration (µM)
UH
PL
C-Q
TO
F-M
S
XC
MS
in
ten
sitie
s (
arb
itra
ry s
ca
le)
Phenylalanine (n=10) Octanoylcarnitine (n=10)
LC-MS/MS
concentration (µM)
Correlation of phenylalanine and octanoylcarnitine determination in plasma between
UHPLC-QTOF-MS and “dedicated” methods
UH
PL
C-Q
TO
F-M
S
XC
MS
in
ten
sitie
s (
arb
itra
ry s
ca
le)
Exact mass: 165.0789786 Exact mass: 287,2096584

PKU1 66
PKU5 197
PKU6 64
PKU3 73
PKU4 90
PKU7 80
PKU2 195
7 metabolites - Phenylalanine - Glutamylphenylalanine - Phenylalanine + C6H10O5
- Mass 278.17518 Unknown
- Prolyl-L-phenylalanine + H2
- N-Acetyl-L-phenylalanine - Mass 424.17163 Unknown
Plasma biomarkers for PKU patients

Accuracy of Q-tof mass analysis
Deviation from actual mass for 19 metabolites
(Mass range 90.0552 – 428.3737 Dalton)
mass number of
metabolites
0.0000 2
0.0001 10
0.0002 4
0.0003 2
0.0004 1
19

Data Interpretation
From mass 176.1030 to metabolite identification
HMBD database
176.1 ± 0.1 9 metabolite options
176.1030 ± 0.0005 C6H13N3O3: 2 metabolites
Citrulline
176.1030
Argininic acid
176.1030
Citrulline and argininic acid have
different retention times on the
column and different mass spectra

Q-TOF sensitivity
Pipecolic acid spiked in urine (diluted 50x)
Sensitivity
Q-TOF
low nanomolar range
NMR
low micromolar range
Factor 1000!
Pipecolic acid
S/N=20
500 nmol/L
50 nmol/L
5 nmol/L
no addition