next-generation sequencing facilitates quantitative ... · next-generation sequencing facilitates...
TRANSCRIPT

Next-generation sequencing facilitates quantitative analysis ofwild-type and Nrl−/− retinal transcriptomes
Matthew J. Brooks, Harsha K. Rajasimha, Jerome E. Roger, Anand Swaroop
(The first two authors contributed equally to this work)
Neurobiology-Neurodegeneration and Repair Laboratory, National Eye Institute, National Institutes of Health, Bethesda, MD
Purpose: Next-generation sequencing (NGS) has revolutionized systems-based analysis of cellular pathways. The goalsof this study are to compare NGS-derived retinal transcriptome profiling (RNA-seq) to microarray and quantitative reversetranscription polymerase chain reaction (qRT–PCR) methods and to evaluate protocols for optimal high-throughput dataanalysis.Methods: Retinal mRNA profiles of 21-day-old wild-type (WT) and neural retina leucine zipper knockout (Nrl−/−) micewere generated by deep sequencing, in triplicate, using Illumina GAIIx. The sequence reads that passed quality filterswere analyzed at the transcript isoform level with two methods: Burrows–Wheeler Aligner (BWA) followed by ANOVA(ANOVA) and TopHat followed by Cufflinks. qRT–PCR validation was performed using TaqMan and SYBR Greenassays.Results: Using an optimized data analysis workflow, we mapped about 30 million sequence reads per sample to the mousegenome (build mm9) and identified 16,014 transcripts in the retinas of WT and Nrl−/− mice with BWA workflow and34,115 transcripts with TopHat workflow. RNA-seq data confirmed stable expression of 25 known housekeeping genes,and 12 of these were validated with qRT–PCR. RNA-seq data had a linear relationship with qRT–PCR for more than fourorders of magnitude and a goodness of fit (R2) of 0.8798. Approximately 10% of the transcripts showed differentialexpression between the WT and Nrl−/− retina, with a fold change ≥1.5 and p value <0.05. Altered expression of 25 geneswas confirmed with qRT–PCR, demonstrating the high degree of sensitivity of the RNA-seq method. Hierarchicalclustering of differentially expressed genes uncovered several as yet uncharacterized genes that may contribute to retinalfunction. Data analysis with BWA and TopHat workflows revealed a significant overlap yet provided complementaryinsights in transcriptome profiling.Conclusions: Our study represents the first detailed analysis of retinal transcriptomes, with biologic replicates, generatedby RNA-seq technology. The optimized data analysis workflows reported here should provide a framework forcomparative investigations of expression profiles. Our results show that NGS offers a comprehensive and more accuratequantitative and qualitative evaluation of mRNA content within a cell or tissue. We conclude that RNA-seq basedtranscriptome characterization would expedite genetic network analyses and permit the dissection of complex biologicfunctions.
Next-generation sequencing (NGS) technology haslaunched a new era of enormous potential and applications ingenomic and transcriptomic analyses [1-3]. With continuedcost reductions and improved analytical methods, NGS hasbegun to have a direct impact on biomedical discovery andclinical outcome [4-6]. NGS has enabled “meta-genomic”studies to survey the genomes of organisms in a particularecosystem [7], and decode the entire genomes of speciesranging from bacteria [8,9] and viruses [10] to humans [11].Whole-genome sequencing has made it possible to investigategenetic variations [12], global DNA methylation [13], and invivo analysis of targets of DNA-binding proteins [14,15].
Correspondence to: Anand Swaroop, Neurobiology-Neurodegeneration and Repair Laboratory, National Eye Institute,National Institutes of Health, MSC0610, 6 Center Drive, Bethesda,MD, 20892; Phone: (301) 435-5754; FAX: (301) 480-9917; email:[email protected]
Deep sequencing of RNA with NGS (called “RNA-seq”)allows a comprehensive evaluation and quantification of allsubtypes of RNA molecules expressed in a cell or tissue[16]. RNA-seq technology can detect transcripts expressed atlow levels [17] and permit the identification of unannotatedtranscripts and new spliced isoforms [16,18]. The issuesrelated to cross-hybridization and detection levels that limitthe accuracy of gene expression estimates by microarraytechnology are not relevant to the data obtained with RNA-seq [19]. Visualization of mapped sequence reads spanningthe splice junctions can also reveal novel splice forms ofannotated genes in the mouse retina, which was not possiblewith earlier hybridization-based technologies. With a steadyreduction in the costs of NGS, RNA-seq is now emerging asa method of choice for comprehensive transcriptomeprofiling.
Molecular Vision 2011; 17:3034-3054 <http://www.molvis.org/molvis/v17/a327>Received 27 July 2011 | Accepted 18 November 2011 | Published 23 November 2011
© 2011 Molecular Vision
3034
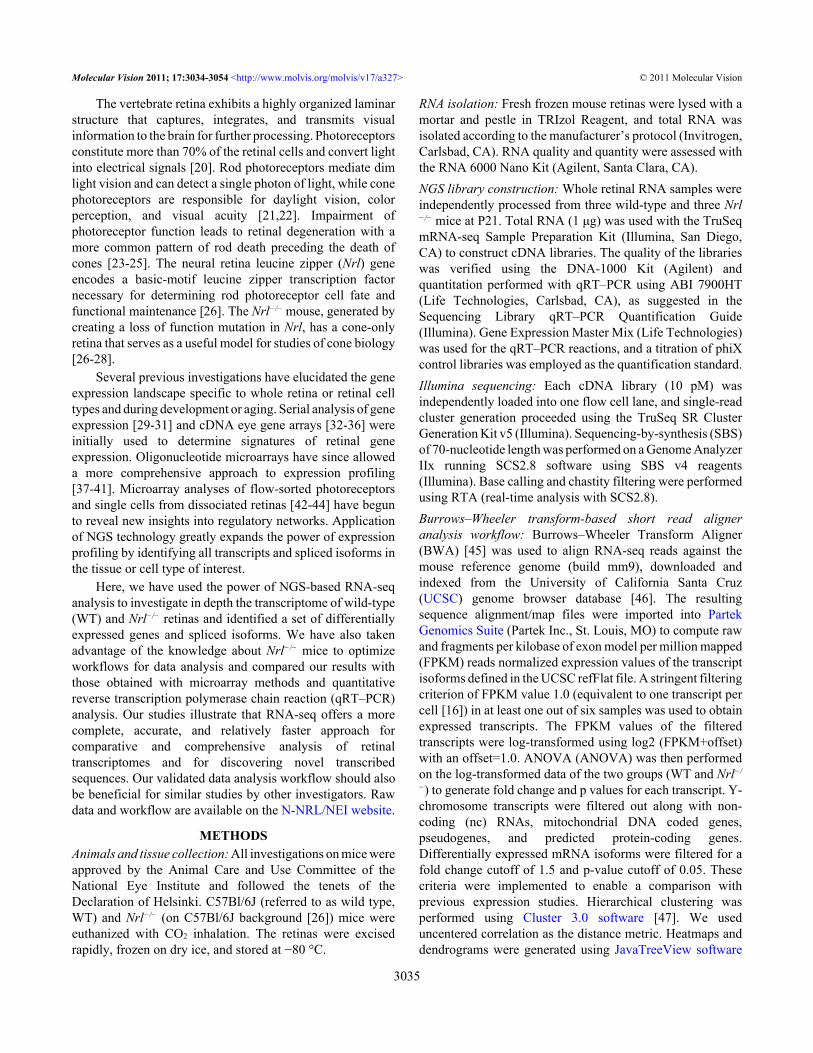
The vertebrate retina exhibits a highly organized laminarstructure that captures, integrates, and transmits visualinformation to the brain for further processing. Photoreceptorsconstitute more than 70% of the retinal cells and convert lightinto electrical signals [20]. Rod photoreceptors mediate dimlight vision and can detect a single photon of light, while conephotoreceptors are responsible for daylight vision, colorperception, and visual acuity [21,22]. Impairment ofphotoreceptor function leads to retinal degeneration with amore common pattern of rod death preceding the death ofcones [23-25]. The neural retina leucine zipper (Nrl) geneencodes a basic-motif leucine zipper transcription factornecessary for determining rod photoreceptor cell fate andfunctional maintenance [26]. The Nrl−/− mouse, generated bycreating a loss of function mutation in Nrl, has a cone-onlyretina that serves as a useful model for studies of cone biology[26-28].
Several previous investigations have elucidated the geneexpression landscape specific to whole retina or retinal celltypes and during development or aging. Serial analysis of geneexpression [29-31] and cDNA eye gene arrays [32-36] wereinitially used to determine signatures of retinal geneexpression. Oligonucleotide microarrays have since alloweda more comprehensive approach to expression profiling[37-41]. Microarray analyses of flow-sorted photoreceptorsand single cells from dissociated retinas [42-44] have begunto reveal new insights into regulatory networks. Applicationof NGS technology greatly expands the power of expressionprofiling by identifying all transcripts and spliced isoforms inthe tissue or cell type of interest.
Here, we have used the power of NGS-based RNA-seqanalysis to investigate in depth the transcriptome of wild-type(WT) and Nrl−/− retinas and identified a set of differentiallyexpressed genes and spliced isoforms. We have also takenadvantage of the knowledge about Nrl−/− mice to optimizeworkflows for data analysis and compared our results withthose obtained with microarray methods and quantitativereverse transcription polymerase chain reaction (qRT–PCR)analysis. Our studies illustrate that RNA-seq offers a morecomplete, accurate, and relatively faster approach forcomparative and comprehensive analysis of retinaltranscriptomes and for discovering novel transcribedsequences. Our validated data analysis workflow should alsobe beneficial for similar studies by other investigators. Rawdata and workflow are available on the N-NRL/NEI website.
METHODSAnimals and tissue collection: All investigations on mice wereapproved by the Animal Care and Use Committee of theNational Eye Institute and followed the tenets of theDeclaration of Helsinki. C57Bl/6J (referred to as wild type,WT) and Nrl−/− (on C57Bl/6J background [26]) mice wereeuthanized with CO2 inhalation. The retinas were excisedrapidly, frozen on dry ice, and stored at −80 °C.
RNA isolation: Fresh frozen mouse retinas were lysed with amortar and pestle in TRIzol Reagent, and total RNA wasisolated according to the manufacturer’s protocol (Invitrogen,Carlsbad, CA). RNA quality and quantity were assessed withthe RNA 6000 Nano Kit (Agilent, Santa Clara, CA).NGS library construction: Whole retinal RNA samples wereindependently processed from three wild-type and three Nrl−/− mice at P21. Total RNA (1 μg) was used with the TruSeqmRNA-seq Sample Preparation Kit (Illumina, San Diego,CA) to construct cDNA libraries. The quality of the librarieswas verified using the DNA-1000 Kit (Agilent) andquantitation performed with qRT–PCR using ABI 7900HT(Life Technologies, Carlsbad, CA), as suggested in theSequencing Library qRT–PCR Quantification Guide(Illumina). Gene Expression Master Mix (Life Technologies)was used for the qRT–PCR reactions, and a titration of phiXcontrol libraries was employed as the quantification standard.Illumina sequencing: Each cDNA library (10 pM) wasindependently loaded into one flow cell lane, and single-readcluster generation proceeded using the TruSeq SR ClusterGeneration Kit v5 (Illumina). Sequencing-by-synthesis (SBS)of 70-nucleotide length was performed on a Genome AnalyzerIIx running SCS2.8 software using SBS v4 reagents(Illumina). Base calling and chastity filtering were performedusing RTA (real-time analysis with SCS2.8).Burrows–Wheeler transform-based short read aligneranalysis workflow: Burrows–Wheeler Transform Aligner(BWA) [45] was used to align RNA-seq reads against themouse reference genome (build mm9), downloaded andindexed from the University of California Santa Cruz(UCSC) genome browser database [46]. The resultingsequence alignment/map files were imported into PartekGenomics Suite (Partek Inc., St. Louis, MO) to compute rawand fragments per kilobase of exon model per million mapped(FPKM) reads normalized expression values of the transcriptisoforms defined in the UCSC refFlat file. A stringent filteringcriterion of FPKM value 1.0 (equivalent to one transcript percell [16]) in at least one out of six samples was used to obtainexpressed transcripts. The FPKM values of the filteredtranscripts were log-transformed using log2 (FPKM+offset)with an offset=1.0. ANOVA (ANOVA) was then performedon the log-transformed data of the two groups (WT and Nrl−/
−) to generate fold change and p values for each transcript. Y-chromosome transcripts were filtered out along with non-coding (nc) RNAs, mitochondrial DNA coded genes,pseudogenes, and predicted protein-coding genes.Differentially expressed mRNA isoforms were filtered for afold change cutoff of 1.5 and p-value cutoff of 0.05. Thesecriteria were implemented to enable a comparison withprevious expression studies. Hierarchical clustering wasperformed using Cluster 3.0 software [47]. We useduncentered correlation as the distance metric. Heatmaps anddendrograms were generated using JavaTreeView software
Molecular Vision 2011; 17:3034-3054 <http://www.molvis.org/molvis/v17/a327> © 2011 Molecular Vision
3035

[48]. Aligned reads were visualized using the IntegratedGenomics Viewer (IGV) [49].TopHat/Cufflinks-based analysis workflow: Raw reads thatpassed the chastity filter threshold were mapped usingTopHat [50] to identify known and novel splice junctions andto generate read alignments for each sample. Genomicannotations were obtained from Ensembl in gene transferformat (GTF). Splice junctions from the six samples werecombined into a master junctions file that was used as an inputfile for the second iteration of TopHat mapping. The transcriptisoform level and gene level counts were calculated andFPKM normalized using Cufflinks. An FPKM filtering cutoffof 1.0 in at least one of the six samples was used to determineexpressed transcripts. Differential transcript expression wasthen computed using Cuffdiff. The resulting lists ofdifferentially expressed isoforms were filtered and sorted intothe following categories: protein coding mRNA transcriptsand ncRNA transcripts.qRT–PCR analysis: Reverse transcription (RT) reactionswere performed using oligo(dT)20 with SuperScript II
reagents (Life Technologies) according to the manufacturer’sprotocol. cDNA synthesized from 2 μg of total RNA (1 μg forminus RT controls) was diluted to 100 μl (fivefold dilution),and from this 1 μl was used for each qRT–PCR reaction. TheqRT–PCR reactions were performed in triplicate for TaqManassays or in duplicate for the SYBR assays, using threebiologic replicates per genotype, on a 7900HT GeneticAnalyzer (Life Technologies). TaqMan assays wereperformed using TaqMan Gene Expression Master Mix andTaqMan Gene Expression Assays (Life Technologies) forgenes listed in Table 1. The SYBR Green assays (Table 2)were performed using Power SYBR Green Master Mix (LifeTechnologies) and oligonucleotides at a final concentration of200 nM. Oligonucleotides were designed using the Primer3PCR Primer Design Tool [51] and synthesized by IntegratedDNA Technologies (Coralville, IA). To eliminatecomplications due to contaminating genomic DNA in theRNA samples, qRT–PCR reactions were also performed withminus-RT control, using hypoxanthine guaninephosphoribosyl transferase (Hprt) primer pairs that can
TABLE 1. TAQMAN ASSAYS EMPLOYED FOR QRT–PCR VALIDATION
TaqMan assay ID Gene symbol Gene nameMm00607939_s1 Actb actin, bMm00504628_m1 Arr3 arrestin 3, retinalMm00437764_m1 B2m b-2 microglobulinMm00474799_m1 Cadm3 cell adhesion molecule 3Mm00432322_m1 Casp7 caspase 7Mm00833234_m1 Cnga1 cyclic nucleotide gated channel a 1Mm00489232_m1 Cngb3 cyclic nucleotide gated channel b 3Mm00656724_m1 Egr1 early growth response 1Mm00442411_m1 Esrrb estrogen related receptor, bMm00438796_m1 Eya1 eyes absent 1 homolog (Drosophila)Mm00445225_m1 Fabp7 fatty acid binding protein 7, brainMm99999915_g1 Gapdh glyceraldehyde-3-phosphate dehydrogenaseMm00492388_g1 Gnat1 guanine nucleotide binding protein, a transducing 1Mm00492394_m1 Gnat2 guanine nucleotide binding protein, a transducing 2Mm01197698_m1 Gusb glucuronidase, bMm01318747_g1 Hprt1 hypoxanthine guanine phosphoribosyl transferase 1Mm00833431_g1 Hsp90ab1 heat shock protein 90 kDa a, class B member 1Mm01340839_m1 Mef2c myocyte enhancer factor 2CMm00443299_m1 Nr2e3 nuclear receptor subfamily 2, group E, member 3Mm00476550_m1 Nrl neural retina leucine zipper geneMm00524018_m1 Nxnl1 nucleoredoxin-like 1Mm00433560_m1 Opn1mw opsin 1 (cone pigments), medium-wave-sensitiveMm00432058_m1 Opn1sw opsin 1 (cone pigments), short-wave-sensitiveMm00476679_m1 Pde6b phosphodiesterase 6B, cGMP, rod receptor, bMm00473920_m1 Pde6c phosphodiesterase 6C, cGMP specific, cone, a primeMm01225301_m1 Pgk1 phosphoglycerate kinase 1Mm00519814_m1 Reep6 receptor accessory protein 6Mm00520345_m1 Rho RhodopsinMm00524993_m1 Rorb RAR-related orphan receptor bMm01612986_gH Rpl13a ribosomal protein L13AMm02601831_g1 Rps26 ribosomal protein S26Mm00774693_g1 Sall3 sal-like 3 (Drosophila)Mm01249143_g1 Socs3 suppressor of cytokine signaling 3Mm01277045_m1 Tbp TATA box binding proteinMm00726185_s1 Tubb4 tubulin, b 4Mm01198158_m1 Ubc ubiquitin CMm00457574_m1 Wisp1 WNT1 inducible signaling pathway protein 1
Molecular Vision 2011; 17:3034-3054 <http://www.molvis.org/molvis/v17/a327> © 2011 Molecular Vision
3036

differentiate between mRNA and genomic DNA (data notshown). Differential expression analysis was performed usingthe ddCt method [52], with the geometric average of actin,beta (ActB) and Hprt as the endogenous controls [53].
RESULTSSequencing run summary: Six libraries of P21 retinal cDNA(three each from WT and Nrl−/−) were sequenced to obtain 35to 49 million raw sequence reads per sample (Table 3). Ofthese, 75.8% to 82.7% reads passed the RTA chastity filterand were used for subsequent Burrows–Wheeler Aligner(BWA) and TopHat analysis workflows (Figure 1). Due toTopHat workflow’s power to map across splice junctions, the
workflow consistently yielded 6 to 7 million more alignmentsper sample when compared to BWA.
BWA workflow: Based on the BWA analysis workflow,16,014 transcripts were detected with a normalized FPKMvalue greater than 1.0 in any of the six samples. Transcriptswere filtered based on whether they were mRNAs or ncRNAs.Of the 15,142 mRNA transcripts, only 1,422 met our criteriaof differential expression of having a fold change greater than1.5 and a p-value less than 0.05 (Table 4). Of the 1,422differentially expressed mRNA transcripts (DETs)representing 1,218 unique genes, 551 were downregulated inNrl−/− (including rod-specific genes) retinas, and 871 were
TABLE 2. SYBR GREEN ASSAYS EMPLOYED FOR QRT–PCR VALIDATION
Gene symbol Gene name Forward ReverseAbca13 (Exon53/55)
ATP-binding cassette, sub-family A (ABC1), member 13 GACCTTCTGAGATGGCCAAG TTAACTCCAAGGAGCCCAAA
Abca13 (Exon58/60)
ATP-binding cassette, sub-family A (ABC1), member 13 CGGTACCTCTGGCAAACAAT GGAAATGGAGCTTCAAGCAG
Acoxl acyl-CoA oxidase-like TGCTGTATGGAACGAAGCTG TGTGGAATGTTGAAGGCAGAAkt3 thymoma viral proto-oncogene 3 CATCTGAAACAGACACCCGATA GTCCGCTTGCAGAGTAGGAGCadm3 cell adhesion molecule 3 AGGGATTGTGGCTTTCATTG CTAGGGGCTCAGGAGTTGTGCcdc24 coiled-coil domain containing 24 TGTCACATGTTGCAGAACGA TCTAAGGCTGGGAATGGATGCd8a CD8 antigen, alpha chain GACATCTCAGCCCCAGAGAC GCTTGCCTTCCTGTCTGACTCox5b cytochrome c oxidase, subunit Vb CGTCCATCAGCAACAAGAGA ATAACACAGGGGCTCAGTGGCtss cathepsin S TAAAGGGCCTGTCTCTGTGG GCCATCCGAATGTATCCTTGDrd4 dopamine receptor D4 AGACTGCCCACCTCCCTTAC AAGAAAGGCGTCCAACACACDynlt3 dynein light chain Tctex-type 3 TTGATGGAGTTTTGGGTGGT GGTACGGTTCTCCCATCTGAHr hairless GCCCTCTCTGCTCAGCTCTA CGGACCACACCGTCTAAGTTKlf9 Kruppel-like factor 9 ACAGTGGCTGTGGGAAAGTC CATGCTTGGTGAGATGGTCAKlhl3 kelch-like 3 GAGCACTGGGAGGAGCTATG AGGAGGTTGGTCTGCTGAGAKlhl33 kelch-like 33 AGCTTCTTCCCTTTGGTGGT CTACAGCCACCGCTGACATANeurod1 neurogenic differentiation 1 GCGTTGCCTTAGCACTTCTT AGGAGTGTGTGTTGGCATTTNipal1 NIPA-like domain containing 1 CCCACAAGAGGGAGAAGTCA GTAAACAGGCTTCCGTTCCAPip5k1a phosphatidylinositol-4-phosphate 5-kinase, type 1 alpha GGGGAACACAGAGCACAAGT GGTCTTCTGAGGCTCACTGCPlekhf2 pleckstrin homology domain containing, family F (with
FYVE domain) member 2GTTGTCGGGTTCGACTGGA TGCGTCTAGTATTCGCCTCAC
Rab18 RAB18, member RAS oncogene family TGCACGCAAGCATTCTATGT GGCTCTCTTCCCTGTGTGACRgs22 regulator of G-protein signaling 22 GCCCAGAAGATCCTTGAACA CGCCTTGTCCTCTTCTGTGTRpgrip1 retinitis pigmentosa GTPase regulator interacting protein 1 GCCATGCTACATGCTCAAGA TTTGGATGGCCTGGTTTCTASema7a sema domain, immunoglobulin domain (Ig), and GPI
membrane anchor, (semaphorin) 7ATCTACAGCTCCCAACGATCA GCTCACAGCTCTGTTCCACA
Txnip thioredoxin interacting protein TATGTACGCCCCTGAGTTCC GTTCCCCGCTGTAGAGACTGWisp1 WNT1 inducible signaling pathway protein 1 GCTCTACCACCTGTGGCCTA ACAGCCTGCGAGAGTGAAGTWscd2 WSC domain containing 2 TCTGCATCAAGACCCATGAA ACGGTCTTGCCAAACTTGAG
TABLE 3. SUMMARY OF ILLUMINA BASE CALLING AND ALIGNMENTS
Genotype WT WT WT Nrl−/− Nrl−/− Nrl−/−
Sample 1 Sample 2 Sample 3 Sample 1 Sample 2 Sample 3Total reads 35,872,080 41,785,800 49,076,400 46,689,240 48,480,240 48,656,040PF Reads 29,603,280 33,251,160 37,642,800 36,472,800 37,119,960 36,823,320 82.7% 79.7% 76.9% 78.2% 76.7% 75.8%BWA alignments 24,992,271 27,922,997 32,085,799 30,960,565 31,374,578 31,257,335TopHat alignments 30,769,939 34,177,120 39,222,596 38,289,469 38,744,790 38,593,533
Each of the 3 week old WT and Nrl−/− retina sample was sequenced on a separate lane of the Illumina GAIIx flow cell to obtain 35 to 49 million raw reads. Over 75% of the raw reads passed Illumina’s read chastity threshold to yield 29 to 37 million usable PF reads. TopHat mapping always gave significantly more alignments than BWA because of its ability to map across the splice junctions. A relatively smaller numbers of reads and alignments for WT samples 1 and 2 are not a matter of concern as FPKM normalization was used to assess the transcript isoform expression. WT=wild type. PF=pass filter
Molecular Vision 2011; 17:3034-3054 <http://www.molvis.org/molvis/v17/a327> © 2011 Molecular Vision
3037
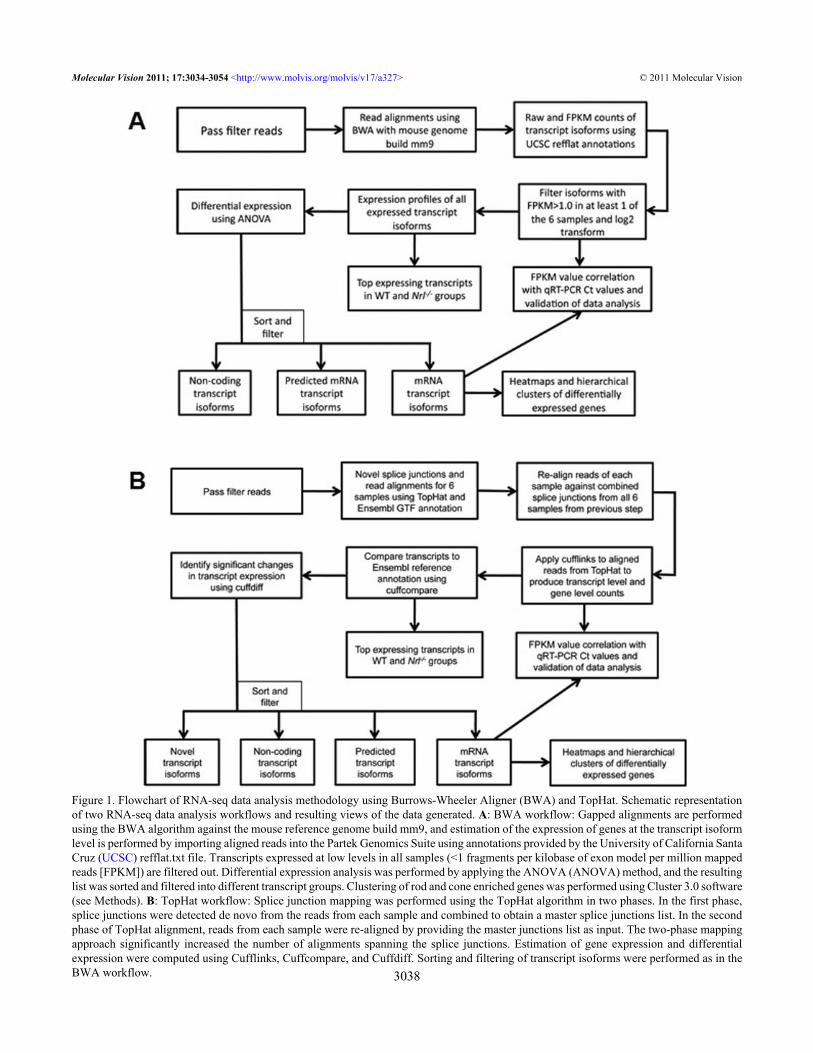
Figure 1. Flowchart of RNA-seq data analysis methodology using Burrows-Wheeler Aligner (BWA) and TopHat. Schematic representationof two RNA-seq data analysis workflows and resulting views of the data generated. A: BWA workflow: Gapped alignments are performedusing the BWA algorithm against the mouse reference genome build mm9, and estimation of the expression of genes at the transcript isoformlevel is performed by importing aligned reads into the Partek Genomics Suite using annotations provided by the University of California SantaCruz (UCSC) refflat.txt file. Transcripts expressed at low levels in all samples (<1 fragments per kilobase of exon model per million mappedreads [FPKM]) are filtered out. Differential expression analysis was performed by applying the ANOVA (ANOVA) method, and the resultinglist was sorted and filtered into different transcript groups. Clustering of rod and cone enriched genes was performed using Cluster 3.0 software(see Methods). B: TopHat workflow: Splice junction mapping was performed using the TopHat algorithm in two phases. In the first phase,splice junctions were detected de novo from the reads from each sample and combined to obtain a master splice junctions list. In the secondphase of TopHat alignment, reads from each sample were re-aligned by providing the master junctions list as input. The two-phase mappingapproach significantly increased the number of alignments spanning the splice junctions. Estimation of gene expression and differentialexpression were computed using Cufflinks, Cuffcompare, and Cuffdiff. Sorting and filtering of transcript isoforms were performed as in theBWA workflow.
Molecular Vision 2011; 17:3034-3054 <http://www.molvis.org/molvis/v17/a327> © 2011 Molecular Vision
3038
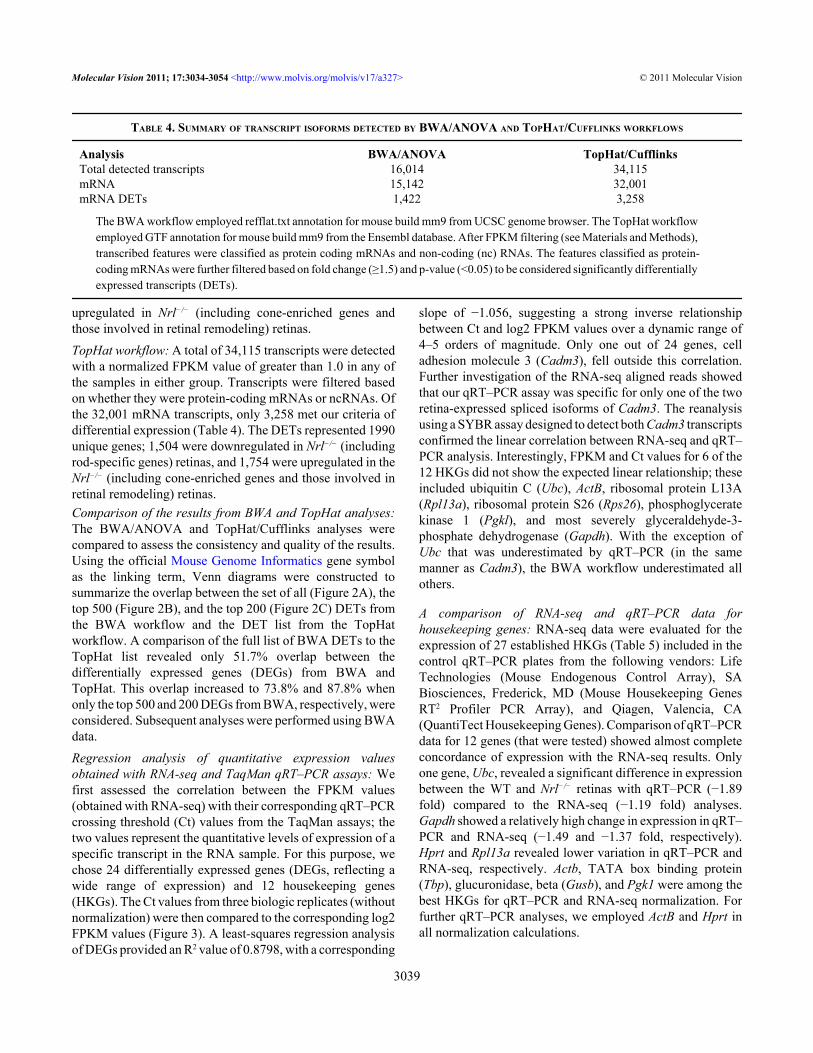
upregulated in Nrl−/− (including cone-enriched genes andthose involved in retinal remodeling) retinas.TopHat workflow: A total of 34,115 transcripts were detectedwith a normalized FPKM value of greater than 1.0 in any ofthe samples in either group. Transcripts were filtered basedon whether they were protein-coding mRNAs or ncRNAs. Ofthe 32,001 mRNA transcripts, only 3,258 met our criteria ofdifferential expression (Table 4). The DETs represented 1990unique genes; 1,504 were downregulated in Nrl−/− (includingrod-specific genes) retinas, and 1,754 were upregulated in theNrl−/− (including cone-enriched genes and those involved inretinal remodeling) retinas.Comparison of the results from BWA and TopHat analyses:The BWA/ANOVA and TopHat/Cufflinks analyses werecompared to assess the consistency and quality of the results.Using the official Mouse Genome Informatics gene symbolas the linking term, Venn diagrams were constructed tosummarize the overlap between the set of all (Figure 2A), thetop 500 (Figure 2B), and the top 200 (Figure 2C) DETs fromthe BWA workflow and the DET list from the TopHatworkflow. A comparison of the full list of BWA DETs to theTopHat list revealed only 51.7% overlap between thedifferentially expressed genes (DEGs) from BWA andTopHat. This overlap increased to 73.8% and 87.8% whenonly the top 500 and 200 DEGs from BWA, respectively, wereconsidered. Subsequent analyses were performed using BWAdata.Regression analysis of quantitative expression valuesobtained with RNA-seq and TaqMan qRT–PCR assays: Wefirst assessed the correlation between the FPKM values(obtained with RNA-seq) with their corresponding qRT–PCRcrossing threshold (Ct) values from the TaqMan assays; thetwo values represent the quantitative levels of expression of aspecific transcript in the RNA sample. For this purpose, wechose 24 differentially expressed genes (DEGs, reflecting awide range of expression) and 12 housekeeping genes(HKGs). The Ct values from three biologic replicates (withoutnormalization) were then compared to the corresponding log2FPKM values (Figure 3). A least-squares regression analysisof DEGs provided an R2 value of 0.8798, with a corresponding
slope of −1.056, suggesting a strong inverse relationshipbetween Ct and log2 FPKM values over a dynamic range of4–5 orders of magnitude. Only one out of 24 genes, celladhesion molecule 3 (Cadm3), fell outside this correlation.Further investigation of the RNA-seq aligned reads showedthat our qRT–PCR assay was specific for only one of the tworetina-expressed spliced isoforms of Cadm3. The reanalysisusing a SYBR assay designed to detect both Cadm3 transcriptsconfirmed the linear correlation between RNA-seq and qRT–PCR analysis. Interestingly, FPKM and Ct values for 6 of the12 HKGs did not show the expected linear relationship; theseincluded ubiquitin C (Ubc), ActB, ribosomal protein L13A(Rpl13a), ribosomal protein S26 (Rps26), phosphoglyceratekinase 1 (Pgkl), and most severely glyceraldehyde-3-phosphate dehydrogenase (Gapdh). With the exception ofUbc that was underestimated by qRT–PCR (in the samemanner as Cadm3), the BWA workflow underestimated allothers.
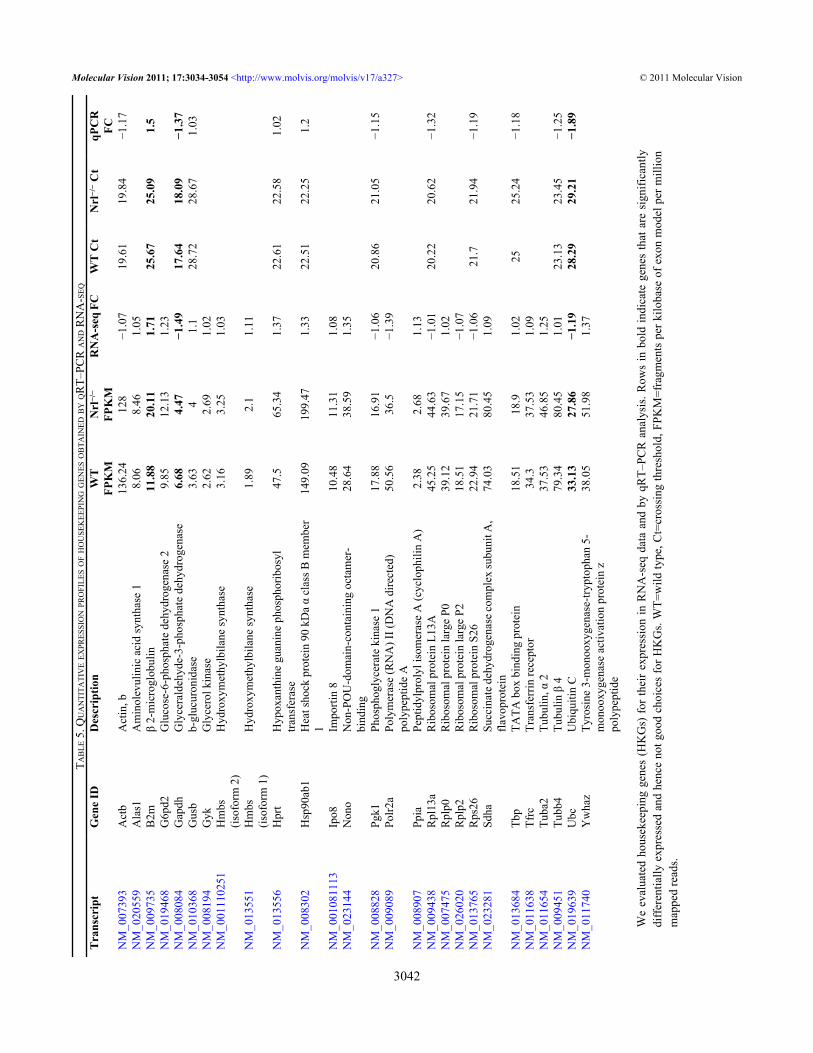
A comparison of RNA-seq and qRT–PCR data forhousekeeping genes: RNA-seq data were evaluated for theexpression of 27 established HKGs (Table 5) included in thecontrol qRT–PCR plates from the following vendors: LifeTechnologies (Mouse Endogenous Control Array), SABiosciences, Frederick, MD (Mouse Housekeeping GenesRT2 Profiler PCR Array), and Qiagen, Valencia, CA(QuantiTect Housekeeping Genes). Comparison of qRT–PCRdata for 12 genes (that were tested) showed almost completeconcordance of expression with the RNA-seq results. Onlyone gene, Ubc, revealed a significant difference in expressionbetween the WT and Nrl−/− retinas with qRT–PCR (−1.89fold) compared to the RNA-seq (−1.19 fold) analyses.Gapdh showed a relatively high change in expression in qRT–PCR and RNA-seq (−1.49 and −1.37 fold, respectively).Hprt and Rpl13a revealed lower variation in qRT–PCR andRNA-seq, respectively. Actb, TATA box binding protein(Tbp), glucuronidase, beta (Gusb), and Pgk1 were among thebest HKGs for qRT–PCR and RNA-seq normalization. Forfurther qRT–PCR analyses, we employed ActB and Hprt inall normalization calculations.
TABLE 4. SUMMARY OF TRANSCRIPT ISOFORMS DETECTED BY BWA/ANOVA AND TOPHAT/CUFFLINKS WORKFLOWS
Analysis BWA/ANOVA TopHat/CufflinksTotal detected transcripts 16,014 34,115mRNA 15,142 32,001mRNA DETs 1,422 3,258
The BWA workflow employed refflat.txt annotation for mouse build mm9 from UCSC genome browser. The TopHat workflow employed GTF annotation for mouse build mm9 from the Ensembl database. After FPKM filtering (see Materials and Methods), transcribed features were classified as protein coding mRNAs and non-coding (nc) RNAs. The features classified as protein- coding mRNAs were further filtered based on fold change (≥1.5) and p-value (<0.05) to be considered significantly differentially expressed transcripts (DETs).
Molecular Vision 2011; 17:3034-3054 <http://www.molvis.org/molvis/v17/a327> © 2011 Molecular Vision
3039

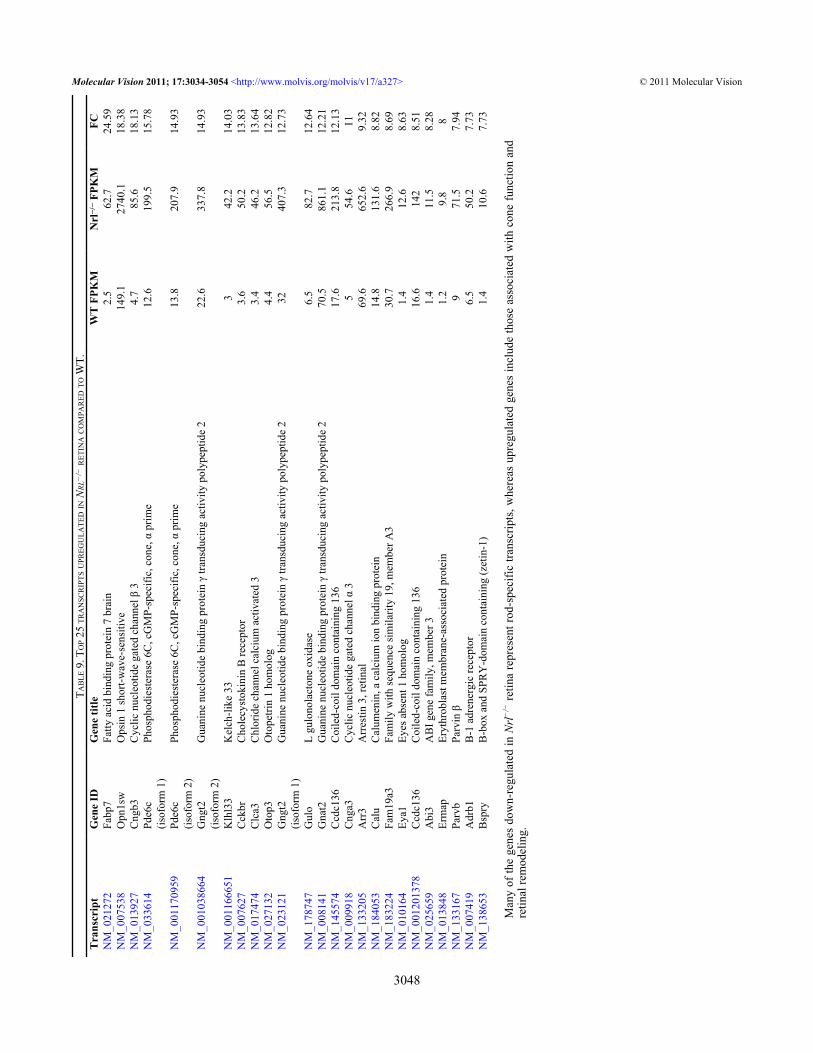
A comparison of RNA-seq and qRT–PCR analysis for DEGs:Based on the RNA-seq data from the WT and Nrl−/− retinas,we selected 25 DEGs (12 downregulated and 13 upregulated)showing a wide range of differential expression for validationwith qRT–PCR analysis. qRT–PCR data for all genesvalidated the RNA-seq results (Figure 4). The WNT1inducible signaling pathway protein 1 (Wisp1) TaqMan assaydid not produce an amplicon in any of the experimentsperformed; subsequent examination of the RNA-seq datarevealed that this assay did not correspond to the splice variantexpressed in the retina. Additional analysis using a SYBRassay with oligonucleotides specific to the retinal splicevariant confirmed the differential expression of Wisp1 (−43.9fold change) in the Nrl−/− retina compared to the WT.Expression levels of transcripts in the WT and Nrl−/− retina:The preceding analysis clearly demonstrates the highreliability and accuracy of the data obtained with RNA-seqmethodology. We therefore used RNA-seq data to deriveabsolute expression levels of individual transcripts. The top25 genes highly expressed in the WT or Nrl−/− retina are listedin Table 6 and Table 7. As predicted, most of these genesencode proteins involved in photoreceptor function/metabolism.Rod and cone photoreceptor enriched genes: We then focusedon DEGs between the Nrl−/− and WT retinas. A total of 1,422transcripts, corresponding to 1,218 unique genes, showed a
minimum fold change of 1.5 at p≤0.05. Hierarchical clusteringof all differentially expressed transcripts resulted in twodistinct clusters: one cluster of 477 genes downregulated inthe Nrl−/− retina includes all known rod-specific genes such asrhodopsin (Rho; FC=-4,804), guanine nucleotide bindingprotein, alpha transducing 1 (Gnat1; FC=-2,034), and nuclearreceptor subfamily 2, group E, member 3 (Nr2e3; FC=-227.5;Figure 5A and Table 8); and the other cluster of 741upregulated genes had all cone-specific genes such as opsin1, short-wave-sensitive (Opn1sw; FC=18.4), cyclicnucleotide gated channel beta 3 (Cngb3; FC=18.1), andGnat2 (FC=12.2; Figure 5B and Table 9).
We then compared our DEG list with two publishedstudies that examined WT and Nrl−/− retinas: a recenttranscript-level RNA-seq analysis that included 6,123 DETs[54] and a gene-level microarray analysis showing 438 DEGs[38] (Figure 6). To obtain the list of DEGs from the Mustafiet al. [55] data set, we performed ANOVA on their FPKMdata from GEO database. Interestingly, the DEGs lists fromthe three studies had only 203 common genes including manypreviously identified genes specifically expressed in cone(fatty acid binding protein 7, brain [Fabp7], Opn1sw,Cngb3, and Gnat2) or rod (Rho, Gnat1, cyclic nucleotidegated channel alpha 1 [Cnga1], and Nr2e3) photoreceptors.To assess the power of RNA-seq to more comprehensivelyidentify DETs than microarray, we examined the list of 634
Figure 2. Venn diagrams comparingdifferentially expressed transcripts(DETs) between the Nrl−/− and WTgroups from BWA and TopHatanalyses. Despite major differences inthe UCSC refFlat annotations used byBurrows-Wheeler Aligner (BWA) andEnsembl annotations used by TopHat,most of the genes identified by BWAwere also identified as significant byTopHat. A: Comparison of the totalnumber of DETs identified assignificant (fold change ≥1.5 and p-value <0.05) by the two methods. B:Inclusion of the top 500 DETs (424unique genes) identified as significantby BWA and in the full TopHat DETlist. C: Inclusion of the top 200 DETs(179 unique genes) identified assignificant by BWA and in the fullTopHat DET list. We assess the twomethods based on a comparison of qRT–PCR data for the genes detected byeither or both methods. The discrepancybetween the results can be attributed todifferences in the input annotation filesused (UCSC refFlat versus EnsemblGTF) by the two methods and theiralignment algorithms.
Molecular Vision 2011; 17:3034-3054 <http://www.molvis.org/molvis/v17/a327> © 2011 Molecular Vision
3040

genes identified in common by the RNA-seq studies but notby the microarray study. This list included 18 retinal diseasegenes (ATP-binding cassette, sub-family A (ABC1), member4 [Abca4], cadherin 23 (otocadherin) [Cdh23], ADP-ribosylation factor-like 6 [Arl6], Bardet-Biedl syndrome 9(human) [Bbs9], calcium binding protein 4 [Cabp4], cyclicnucleotide gated channel alpha 3 [Cnga3], G protein-coupledreceptor 98 [Gpr98], guanylate cyclase activator 1a (retina)[Guca1a], opsin 1 (cone pigments), medium-wave-sensitive(color blindness, deutan) [Opn1mw], orthodenticle homolog2 (Drosophila) [Otx2], phosphodiesterase 6G, cGMP-specific, rod, gamma [Pde6g], peripherin 2 [Prph2], retinolbinding protein 4, plasma [Rbp4], retinol dehydrogenase 1 (alltrans) [Rdh1], regulator of G-protein signaling 9 bindingprotein [Rgs9bp], unc-119 homolog (C. elegans) [Unc119],Usher syndrome 2A (autosomal recessive, mild) homolog(human) [Ush2a], and whirlin [Whrn]) and several knowngenes involved in visual perception (guanylate cyclase 2e[Gucy2e], guanylate cyclase 2f [Gucy2f], recoverin [Rcvrn],RAR-related orphan receptor beta [Rorb], and sal-like 3(Drosophila) [Sall3]). Several genes showing largedifferential expression values might participate in rodhomeostasis (galactosidase, beta 1-like 2 [Glb1l2] FC=-14.02,GRAM domain containing 2 [Gramd2] FC=-14.0,carbohydrate (chondroitin 6/keratan) sulfotransferase 3[Chst3] FC=-4.8, desert hedgehog [Dhh] FC=-4.1, and ADP-ribosylation factor-like 4D [Arl4d] FC=-3.6) and conefunction (dual specificity phosphatase 23 [Dusp23] FC=6.3,cyclin-dependent kinase 11B [Cdkl1] FC=6.1, tryptophanhydroxylase 1 [Tph1] FC=4.7, muscle glycogenphosphorylase [Pygm] FC=4.6, cyclin-dependent kinase 6
[Cdk6] FC=4.0, Sall3 FC=3.9, and early growth response 1[Egr1] FC=3.7).
Our RNA-seq data allowed us to identify 359 genes notidentified in previous investigations. To further assess thequality of our analysis, we performed qRT–PCR validation of15 genes identified by other studies (but not in our study) asdifferentially expressed and of 7 genes uniquely identified byour study (but not by other studies; Table 10). Of the 15 genesidentified by other studies, only three (ATP-binding cassette,sub-family A (ABC1), member 13 [Abca13], CD8 antigen,alpha chain [Cd8a], and acyl-CoA oxidase-like [Acoxl]) wereconfirmed with qRT–PCR as being differentially expressed.We also detected these three as differentially expressed buthad filtered them out because of FPKM values that were lessthan 1.0 in all samples. Interestingly, the Abca13 transcriptdetected in the retina had only sequence reads for exons 56through 62. This finding was supported by qRT–PCR usingtwo SYBR assays designed to exons 53/55 and exons 56/58.All seven genes uniquely identified by our study werevalidated as significantly differentially expressed.
The significantly lower number of DETs detected by ourstudy compared to the Mustafi et al. study (2011; 1,422 versus6,123, respectively) can be attributed to the following:
1. We used a stringent 1.0 FPKM cutoff that generated alist of genes with significant base level expression and fewerfalse positives than a lower expression level threshold. If wehad decreased our threshold to 0.1 FPKM, we would havedetected 975 more DETs; however, these genes are expressedat an extremely low level and their impact must be weighedagainst the increase in false positives. We chose a
Figure 3. Correlation of RNA-seq andqRT–PCR. The correlations betweenthe RNA-seq fragments per kilobase ofexon model per million mapped reads(FPKM) values and the correspondingqRT–PCR crossing threshold (Ct)values are shown. FPKM valuesrepresented in log2 scale, and non-normalized Ct values are an average ofthree biologic replicates. Data generatedfrom differentially expressed genes(black) is contrasted with data generatedfrom the housekeeping genes (red). Thedashed line, associated equation, andgoodness of fit value were generated byleast-squares regression analysis of thedifferentially expressed data set. Since alower Ct value indicates an increasedinitial amount of target mRNA, aninverse relationship between FPKM andCt values is expected if a correlationexists.
Molecular Vision 2011; 17:3034-3054 <http://www.molvis.org/molvis/v17/a327> © 2011 Molecular Vision
3041
TAB
LE 5
. QU
AN
TITA
TIV
E EX
PRES
SIO
N PR
OFI
LES O
F HO
USE
KEE
PIN
G G
ENES
OB
TAIN
ED B
Y Q
RT–
PCR
AN
D R
NA
-SEQ
Tra
nscr
ipt
Gen
e ID
Des
crip
tion
WT
FPK
MN
rl−/
−
FPK
MR
NA
-seq
FC
WT
Ct
Nrl
−/− C
tqP
CR
FCN
M_0
0739
3A
ctb
Act
in, b
136.
2412
8−1
.07
19.6
119
.84
−1.1
7N
M_0
2055
9A
las1
Am
inol
evul
inic
aci
d sy
ntha
se 1
8.06
8.46
1.05
N
M_0
0973
5B
2mβ
2-m
icro
glob
ulin
11.8
820
.11
1.71
25.6
725
.09
1.5
NM
_019
468
G6p
d2G
luco
se-6
-pho
spha
te d
ehyd
roge
nase
29.
8512
.13
1.23
N
M_0
0808
4G
apdh
Gly
cera
ldeh
yde-
3-ph
osph
ate
dehy
drog
enas
e6.
684.
47−1
.49
17.6
418
.09
−1.3
7N
M_0
1036
8G
usb
b-gl
ucur
onid
ase
3.63
41.
128
.72
28.6
71.
03N
M_0
0819
4G
ykG
lyce
rol k
inas
e2.
622.
691.
02
NM
_001
1102
51H
mbs
(isof
orm
2)
Hyd
roxy
met
hylb
ilane
synt
hase
3.16
3.25
1.03
NM
_013
551
Hm
bs(is
ofor
m 1
)H
ydro
xym
ethy
lbila
ne sy
ntha
se1.
892.
11.
11
NM
_013
556
Hpr
tH
ypox
anth
ine
guan
ine
phos
phor
ibos
yltra
nsfe
rase
47.5
65.3
41.
3722
.61
22.5
81.
02
NM
_008
302
Hsp
90ab
1H
eat s
hock
pro
tein
90
kDa
α cl
ass B
mem
ber
114
9.09
199.
471.
3322
.51
22.2
51.
2
NM
_001
0811
13Ip
o8Im
porti
n 8
10.4
811
.31
1.08
N
M_0
2314
4N
ono
Non
-PO
U-d
omai
n-co
ntai
ning
oct
amer
-bi
ndin
g28
.64
38.5
91.
35
NM
_008
828
Pgk1
Phos
phog
lyce
rate
kin
ase
117
.88
16.9
1−1
.06
20.8
621
.05
−1.1
5N
M_0
0908
9Po
lr2a
Poly
mer
ase
(RN
A) I
I (D
NA
dire
cted
)po
lype
ptid
e A
50.5
636
.5−1
.39
NM
_008
907
Ppia
Pept
idyl
prol
yl is
omer
ase
A (c
yclo
phili
n A
)2.
382.
681.
13
NM
_009
438
Rpl
13a
Rib
osom
al p
rote
in L
13A
45.2
544
.63
−1.0
120
.22
20.6
2−1
.32
NM
_007
475
Rpl
p0R
ibos
omal
pro
tein
larg
e P0
39.1
239
.67
1.02
N
M_0
2602
0R
plp2
Rib
osom
al p
rote
in la
rge
P218
.51
17.1
5−1
.07
N
M_0
1376
5R
ps26
Rib
osom
al p
rote
in S
2622
.94
21.7
1−1
.06
21.7
21.9
4−1
.19
NM
_023
281
Sdha
Succ
inat
e deh
ydro
gena
se co
mpl
ex su
buni
t A,
flavo
prot
ein
74.0
380
.45
1.09
NM
_013
684
Tbp
TATA
box
bin
ding
pro
tein
18.5
118
.91.
0225
25.2
4−1
.18
NM
_011
638
Tfrc
Tran
sfer
rin re
cept
or34
.337
.53
1.09
N
M_0
1165
4Tu
ba2
Tubu
lin, α
237
.53
46.8
51.
25
NM
_009
451
Tubb
4Tu
bulin
β 4
79.3
480
.45
1.01
23.1
323
.45
−1.2
5N
M_0
1963
9U
bcU
biqu
itin
C33
.13
27.8
6−1
.19
28.2
929
.21
−1.8
9N
M_0
1174
0Y
wha
zTy
rosi
ne 3
-mon
ooxy
gena
se-tr
ypto
phan
5-
mon
ooxy
gena
se a
ctiv
atio
n pr
otei
n z
poly
pept
ide
38.0
551
.98
1.37
W
e ev
alua
ted
hous
ekee
ping
gen
es (
HK
Gs)
for
thei
r ex
pres
sion
in R
NA
-seq
dat
a an
d by
qR
T–PC
R a
naly
sis.
Row
s in
bol
d in
dica
te g
enes
that
are
sig
nific
antly
d
iffer
entia
lly e
xpre
ssed
and
hen
ce n
ot g
ood
choi
ces
for H
KG
s. W
T=w
ild ty
pe, C
t=cr
ossi
ng th
resh
old,
FPK
M=f
ragm
ents
per
kilo
base
of e
xon
mod
el p
er m
illio
n
map
ped
read
s.
Molecular Vision 2011; 17:3034-3054 <http://www.molvis.org/molvis/v17/a327> © 2011 Molecular Vision
3042

conservative criterion to identify significant and bona fidedifferentially expressed genes.
2. Mustafi et al. [54] pooled multiple RNA samplesbefore generating the library and used the identical library onmultiple lanes of the sequencer. Our experimental designconsisted of libraries generated from individual biologicreplicates that allowed us to eliminate the transcripts based onp-value.
Several DETs we identified might contribute tophotoreceptor function but are not yet characterized; theseinclude pleckstrin homology domain containing, family F(with FYVE domain) member 2 (Plekhf2; FC=-5.35), kelch-like 13 (Drosophila) [Klhl3] (FC=-3.3), NIPA-like domaincontaining 1 (Nipal1; FC=-2.8), and coiled-coil domaincontaining 24 (Ccdc24; FC=-2.6) in the WT retina, and kelch-like 33 (Drosophila) [Klhl33] (FC=14), WSC domaincontaining 2 (Wscd2; FC=4), hairless (Hr; FC=3.9) andregulator of G-protein signaling 22 (Rgs22; FC=3.8) in theNrl−/− retina. We also identified Crx opposite strand transcript1 (Crxos1; FC=4.1), which is exclusively expressed in the eyefrom the opposite strand of a key retinal transcription factor,cone-rod homeobox containing gene (Crx) [55]. Aninteresting new finding is the retinal expression of multiplegenes from the Kelch-like family (Klhl3, 4, 5, 18, 33, 36),solute carrier family (>30 members), and zinc-finger proteinfamily (>10 members). Mutations in at least one gene fromeach family have previously been associated with retinaldisease: Klhl7 with autosomal dominant RP [56], Slc24A1with autosomal-recessive congenital stationary nightblindness [57], and Znf513 with autosomal-recessive retinitispigmentosa (RP) [58].
DISCUSSIONSpecific patterns of gene expression define the morphologyand function of distinct cell types and tissues. Changes in geneexpression are associated with complex biologic processes,including development, aging, and disease pathogenesis.Until recently, such investigations focused on one or a fewgenes at a time. Advances in genomic technology havepermitted simultaneous evaluation of most, if not all, genesthat respond to an extrinsic microenvironment or intrinsicbiologic program(s). Such studies are critical for delineatinggene networks that can be targeted for treating specificdiseases. RNA-seq allows comprehensive evaluation oftranscriptomes, alternative transcripts, and codingpolymorphisms. However, analyzing RNA-seq data has beenchallenging due to the complexity associated with qualitycontrol, sequence alignments, and handling of large data sets[59]. Several algorithms [45,60] have been proposed formapping sequence reads to the reference genome, andmultiple workflows [16,50] suggested for RNA-seq dataanalysis. Here, we report a detailed RNA-seq methodologyusing WT and Nrl−/− retinas as a study paradigm and establishthe high performance of NGS technology compared tomicroarray and qRT–PCR platforms for transcriptidentification and quantification studies. Consistent withrecent studies [61], our RNA-seq data demonstrate highsensitivity, a wider dynamic range of coverage, and lowertechnical variability.
Quantitative RT–PCR has long been considered the “goldstandard” for mRNA quantification [62,63], and henceroutinely used to validate results from transcriptome analysisstudies. We show that FPKM values from RNA-seq analysishave a strong linear correlation across at least four orders ofmagnitude with Ct values from qRT–PCR. Expression of
Figure 4. qRT–PCR validation of RNA-seq results. Comparison of differentialexpression values determined by RNA-seq (dark gray) and qRT–PCR (lightgray) for 25 differentially expressedgenes identified by Burrows-WheelerAligner (BWA) workflow. Error barsrepresent the standard error of the mean.Neural retina leucine zipper gene (Nrl)was not detectable by qRT–PCR andtherefore are left blank in the graph.Note that Rhodopsin (Rho), guaninenucleotide binding protein, alphatransducing 1 (Gnat1), cyclic nucleotidegated channel alpha 1 (Cnga1), andnuclear receptor subfamily 2, group E,member 3 (Nr2e3) having averagecrossing threshold (Ct) values greaterthan 30 in the Nrl−/− samples areconsidered extremely low to non-expressing.
Molecular Vision 2011; 17:3034-3054 <http://www.molvis.org/molvis/v17/a327> © 2011 Molecular Vision
3043

TAB
LE 6
. TO
P 25
HIG
HLY
EX
PRES
SED
TR
AN
SCR
IPTS
IN W
ILD
-TY
PE R
ETIN
A B
ASE
D O
N R
NA
-SEQ
DA
TA.
Tra
nscr
ipt I
DG
ene
IDG
ene
nam
eW
T F
PKM
Nrl−/
− FPK
MN
M_1
4538
3Rh
oR
hodo
psin
8135
.41.
7N
M_0
0814
0G
nat1
Gua
nine
nuc
leot
ide
bind
ing
prot
ein
γ tra
nsdu
cing
act
ivity
pol
ypep
tide
140
11.7
2
NM
_008
938
Prph
2Pe
riphe
rin 2
1448
.236
7.1
NM
_012
065
Pde6
gPh
osph
odie
ster
ase
6G c
GM
P-sp
ecifi
c ro
d γ
1269
.555
2.6
NM
_009
073
Rom
1R
etin
al o
uter
segm
ent m
embr
ane
prot
ein
194
8.8
229.
1N
M_0
1574
5Rb
p3R
etin
ol b
indi
ng p
rote
in 3
885.
310
24N
M_0
0911
8Sa
gS-
antig
en re
tina
and
pine
al g
land
765.
454
8.7
NM
_011
676
Unc
119
Unc
-119
hom
olog
719.
140
7.3
NM
_024
458
Pdc
Phos
duci
n68
9.8
302.
3N
M_0
0903
8Rc
vrn
Rec
over
in64
3.6
288
NM
_011
099
Pkm
2Py
ruva
te k
inas
e m
uscl
e60
4.7
467.
9N
M_0
0115
9730
Pdc
Phos
duci
n58
025
0.7
NM
_146
079
Guc
a1b
Gua
nyla
te c
ycla
se a
ctiv
ator
1B
552.
668
.1N
M_0
0813
1G
lul
Glu
tam
ate-
amm
onia
liga
se54
553
0.1
NM
_001
1360
74N
rlN
eura
l ret
ina
leuc
ine
zipp
er54
51.
9N
M_0
0116
0017
Gnb
1G
uani
ne n
ucle
otid
e bi
ndin
g pr
otei
n β
poly
pept
ide
148
7.8
24.4
NM
_011
428
Snap
25Sy
napt
osom
al-a
ssoc
iate
d pr
otei
n 25
kD
a47
1.1
576
NM
_146
086
Pde6
aR
od p
hoto
rece
ptor
cG
MP
phos
phod
iest
eras
e a
subu
nit
433.
535
.8N
M_0
2635
849
3058
3H14
Rik
Unk
now
n40
7.3
362
NM
_013
415
Atp1
b2A
TPas
e N
a+ K+
trans
porti
ng β
2 p
olyp
eptid
e36
9.6
608.
9N
M_1
4492
1At
p1a3
Α 3
subu
nit o
f Na+ K
+ A
TPas
e36
7.1
286
NM
_008
806
Pde6
bPh
osph
odie
ster
ase
6B c
GM
P-sp
ecifi
c ro
d β
364.
616
.2N
M_0
0116
0016
Gnb
1G
uani
ne n
ucle
otid
e bi
ndin
g pr
otei
n β
poly
pept
ide
135
2.1
18.1
(is
ofor
m 2
)
NM
_008
142
Gnb
1G
uani
ne n
ucle
otid
e bi
ndin
g pr
otei
n β
poly
pept
ide
134
9.7
17.9
(is
ofor
m 1
)
NM
_010
314
Gng
t1G
uani
ne n
ucle
otid
e bi
ndin
g pr
otei
n g
trans
duci
ng a
ctiv
ity p
olyp
eptid
e 1
340.
120
3.7
A
s ph
otor
ecep
tors
con
stitu
te a
lmos
t 70%
of c
ells
in P
21 W
T an
d N
rl−
/− re
tina,
the
high
exp
ress
ed g
enes
(in
bold
) lik
ely
enco
de p
rote
ins
asso
ciat
ed w
ith g
ener
al
pho
tore
cept
or fu
nctio
n/m
etab
olis
m. W
T=w
ild ty
pe
Molecular Vision 2011; 17:3034-3054 <http://www.molvis.org/molvis/v17/a327> © 2011 Molecular Vision
3044

TAB
LE 7
. TO
P 25
HIG
HLY
EX
PRES
SED
TR
AN
SCR
IPTS
IN N
RL−
/− R
ETIN
A B
ASE
D O
N R
NA
-SEQ
DA
TA.
Tra
nscr
ipt I
DG
ene
IDG
ene
nam
eW
T F
PKM
Nrl
−/− F
PKM
NM
_007
538
Opn
1sw
Ops
in 1
shor
t-wav
e-se
nsiti
ve14
9.1
2740
.1N
M_0
1574
5Rb
p3R
etin
ol b
indi
ng p
rote
in 3
885.
310
24N
M_0
0814
1G
nat2
Gua
nine
nuc
leot
ide
bind
ing
prot
ein
a tra
nsdu
cing
270
.586
1.1
NM
_013
530
Gnb
3G
uani
ne n
ucle
otid
e bi
ndin
g pr
otei
n β
poly
pept
ide
310
3.3
786.
9N
M_1
3320
5Ar
r3A
rres
tin 3
, ret
inal
69.6
652.
6N
M_0
2389
8Pd
e6h
Phos
phod
iest
eras
e 6H
cG
MP-
spec
ific
cone
g91
.163
4.7
NM
_013
415
Atp1
b2A
TPas
e N
a+K
+ tra
nspo
rting
β 2
pol
ypep
tide
369.
660
8.9
NM
_011
428
Snap
25Sy
napt
osom
al-a
ssoc
iate
d pr
otei
n 25
kD
a47
1.1
576
NM
_012
065
Pde6
gPh
osph
odie
ster
ase
6G c
GM
P-sp
ecifi
c ro
d g
1269
.555
2.6
NM
_009
118
Sag
S-an
tigen
retin
a an
d pi
neal
gla
nd76
5.4
548.
7N
M_0
0813
1G
lul
Glu
tam
ate-
amm
onia
liga
se54
553
0.1
NM
_053
245
Aipl
1A
ryl h
ydro
carb
on re
cept
or in
tera
ctin
g pr
otei
n-lik
e 1
313
515.
6N
M_0
0930
5Sy
pSy
napt
ophy
sin
326.
350
5N
M_0
0818
9G
uca1
aG
uany
late
cyc
lase
act
ivat
or 1
A (r
etin
a)30
6.6
487.
8N
M_0
1109
9Pk
m2
Pyru
vate
kin
ase
mus
cle
604.
746
7.9
NM
_013
494
Cpe
Car
boxy
pept
idas
e E
337.
843
9.6
NM
_023
121
Gng
t2G
uani
ne n
ucle
otid
e bi
ndin
g pr
otei
n g
trans
duci
ng a
ctiv
ity p
olyp
eptid
e 2
3240
7.3
NM
_011
676
Unc
119
Unc
-119
hom
olog
719.
140
7.3
NM
_021
273
Ckb
Cre
atin
e ki
nase
bra
in29
039
8.9
NM
_007
450
Slc2
5a4
Solu
te c
arrie
r fam
ily 2
5 m
embe
r 431
338
5.3
NM
_008
938
Prph
2Pe
riphe
rin 2
1448
.236
7.1
NM
_026
358
4930
583H
14Ri
kU
nkno
wn
407.
336
2N
M_0
1677
4At
p5b
ATP
synt
hase
H+ t
rans
porti
ng m
itoch
ondr
ial F
1 co
mpl
ex β
pol
ypep
tide
315.
235
2.1
NM
_001
0386
64G
ngt2
Gua
nine
nuc
leot
ide
bind
ing
prot
ein
γ tra
nsdu
cing
act
ivity
pol
ypep
tide
222
.633
7.8
NM
_010
106
Eef1
a1Eu
kary
otic
tran
slat
ion
elon
gatio
n fa
ctor
1 α
126
532
8.6
A
s ph
otor
ecep
tors
con
stitu
te a
lmos
t 70%
of c
ells
in P
21 W
T an
d N
rl−
/− re
tina,
the
high
exp
ress
ed g
enes
(in
bold
) lik
ely
enco
de p
rote
ins
asso
ciat
ed w
ith g
ener
al
phot
orec
epto
r fun
ctio
n/m
etab
olis
m. W
T=w
ild ty
pe
Molecular Vision 2011; 17:3034-3054 <http://www.molvis.org/molvis/v17/a327> © 2011 Molecular Vision
3045

Figure 5. Heatmaps and hierarchical clusters of differentially expressed rod-specific genes and cone-specific genes or those involved in retinalremodeling. Heatmaps with dendrograms of clusters of differentially expressed rod genes (A) and cone / retinal remodeling genes (B) byapplying hierarchical clustering. A filtered list of mRNA transcript isoforms was further revised for fold change ≥1.5 and p-value <0.05, andduplicate gene symbol rows were deleted to retain the most expressed isoform as reflective of the gene. This list was used to generate theheatmap and the master cluster. Specific clusters of rod specific genes and cone-specific or retinal remodeling genes were identified as clusterscontaining known rod genes (e.g., Rhodopsin [Rho], guanine nucleotide binding protein, alpha transducing 1 [Gnat1], cyclic nucleotide gatedchannel alpha 1 [Cnga1], and nuclear receptor subfamily 2, group E, member 3 [Nr2e3]) and cone genes (e.g., fatty acid binding protein 7,brain [Fabp7], cyclic nucleotide gated channel alpha 3 [Cnga3], cyclic nucleotide gated channel beta 3 [Cngb3]). Columns 1, 2, and 3 arewild-type samples, and columns 4, 5, and 6 are Nrl−/− samples.
Molecular Vision 2011; 17:3034-3054 <http://www.molvis.org/molvis/v17/a327> © 2011 Molecular Vision
3046

TAB
LE 8
. TO
P 25
TRA
NSC
RIP
TS D
OW
N-R
EGU
LATE
D IN
NRL
−/−
RET
INA
CO
MPA
RED
TO
WT.
Tra
nscr
ipt
Gen
e ID
Gen
e na
me
WT
FPK
MN
rl−/
−
FPK
MFC
NM
_145
383
Rho
Rho
dops
in81
35.4
1.7
−480
3.93
NM
_008
140
Gna
t1G
uani
ne n
ucle
otid
e bi
ndin
g pr
otei
n γ
trans
duci
ng a
ctiv
ity p
olyp
eptid
e 1
4011
.72
−203
3.85
NM
_001
1360
74N
rlN
eura
l ret
ina
leuc
ine
zipp
er54
51.
9−2
84.0
5N
M_0
0772
3C
nga1
Intra
cellu
lar c
GM
P ac
tivat
ed c
atio
n ch
anne
l23
2.3
1−2
29.1
3N
M_0
1370
8N
r2e3
Nuc
lear
rece
ptor
subf
amily
2 g
roup
E m
embe
r 323
7.2
1−2
27.5
4N
M_1
4481
3Sl
c24a
1So
lute
car
rier f
amily
24
mem
ber 1
(sod
ium
-pot
assi
um-c
alci
um e
xcha
nger
1)26
3.2
3.2
−81.
57
NM
_145
963
Kcn
j14
Pota
ssiu
m in
war
dly-
rect
ifyin
g ch
anne
l sub
fam
ily J
mem
ber 1
463
.61.
4−4
4.02
NM
_139
292
Ree
p6R
ecep
tor a
cces
sory
pro
tein
631
7.4
8.6
−36.
76N
M_0
2549
1Su
sd3
Sush
i dom
ain
cont
aini
ng 3
58.1
1.7
−34.
06N
M_0
1193
4Es
rrb
(isof
orm
1)
Estro
gen-
rela
ted
rece
ptor
β67
.22.
6−2
6.17
NM
_001
0075
76G
ucy2
fG
uany
late
cyc
lase
2f
36.5
1.6
−22.
78N
M_0
0880
6Pd
e6b
Phos
phod
iest
eras
e 6B
cG
MP-
spec
ific
rod
β36
4.6
16.2
−22.
32N
M_0
0119
5413
Cng
b1C
yclic
nuc
leot
ide
gate
d ch
anne
l β 1
52.3
2.5
−21.
11N
M_0
0116
0017
Gnb
1(is
ofor
m 3
)G
uani
ne n
ucle
otid
e bi
ndin
g pr
otei
n β
poly
pept
ide
148
7.8
24.4
−19.
97
NM
_008
736
Nrl
Neu
ral r
etin
a le
ucin
e zi
pper
201
−19.
97N
M_0
0814
2G
nb1
(isof
orm
1)
Gua
nine
nuc
leot
ide
bind
ing
prot
ein
β po
lype
ptid
e 1
349.
717
.9−1
9.7
NM
_007
472
Aqp
1A
quap
orin
142
.52.
2−1
9.56
NM
_001
1600
16G
nb1
(isof
orm
2)
Gua
nine
nuc
leot
ide
bind
ing
prot
ein
β po
lype
ptid
e 1
352.
118
.1−1
9.29
NM
_153
803
Glb
1l2
Gal
acto
sida
se, β
1-li
ke 2
55.7
3.5
−16.
11N
M_0
0115
9500
Esrr
b(is
ofor
m 2
)Es
troge
n-re
late
d re
cept
or β
22.5
1.5
−15.
03
NM
_172
802
Fscn
2Fa
scin
hom
olog
2, a
ctin
-bun
dlin
g pr
otei
n, re
tinal
41.6
3−1
4.03
NM
_001
0334
98G
ram
d2M
embe
r of t
he G
RA
M d
omai
n co
ntai
ning
fam
ily20
.31.
4−1
4.03
NM
_027
001
2610
034M
16R
ikU
nkno
wn
69.6
5.1
−13.
64N
M_0
1886
5W
isp1
WN
T1 in
duci
ble
sign
alin
g pa
thw
ay p
rote
in17
.81.
4−1
2.21
NM
_146
086
Pde6
aR
od p
hoto
rece
ptor
cG
MP
phos
phod
iest
eras
e α
subu
nit
433.
535
.8−1
2.13
M
any
of th
e ge
nes
dow
n-re
gula
ted
in N
rl−
/− re
tina
repr
esen
t rod
-spe
cific
tran
scrip
ts, w
here
as u
preg
ulat
ed g
enes
incl
ude
thos
e as
soci
ated
with
con
e fu
nctio
n an
d
ret
inal
rem
odel
ing.
Molecular Vision 2011; 17:3034-3054 <http://www.molvis.org/molvis/v17/a327> © 2011 Molecular Vision
3047
TAB
LE 9
. TO
P 25
TRA
NSC
RIP
TS U
PREG
ULA
TED
IN N
RL−
/− R
ETIN
A C
OM
PAR
ED T
O W
T.T
rans
crip
tG
ene
IDG
ene
title
WT
FPK
MN
rl−/
− FPK
MFC
NM
_021
272
Fabp
7Fa
tty a
cid
bind
ing
prot
ein
7 br
ain
2.5
62.7
24.5
9N
M_0
0753
8O
pn1s
wO
psin
1 sh
ort-w
ave-
sens
itive
149.
127
40.1
18.3
8N
M_0
1392
7C
ngb3
Cyc
lic n
ucle
otid
e ga
ted
chan
nel β
34.
785
.618
.13
NM
_033
614
Pde6
c(is
ofor
m 1
)Ph
osph
odie
ster
ase
6C, c
GM
P-sp
ecifi
c, c
one,
α p
rime
12.6
199.
515
.78
NM
_001
1709
59Pd
e6c
(isof
orm
2)
Phos
phod
iest
eras
e 6C
, cG
MP-
spec
ific,
con
e, α
prim
e13
.820
7.9
14.9
3
NM
_001
0386
64G
ngt2
(isof
orm
2)
Gua
nine
nuc
leot
ide
bind
ing
prot
ein
γ tra
nsdu
cing
act
ivity
pol
ypep
tide
222
.633
7.8
14.9
3
NM
_001
1666
51K
lhl3
3K
elch
-like
33
342
.214
.03
NM
_007
627
Cck
brC
hole
cyst
okin
in B
rece
ptor
3.6
50.2
13.8
3N
M_0
1747
4C
lca3
Chl
orid
e ch
anne
l cal
cium
act
ivat
ed 3
3.4
46.2
13.6
4N
M_0
2713
2O
top3
Oto
petri
n 1
hom
olog
4.4
56.5
12.8
2N
M_0
2312
1G
ngt2
(isof
orm
1)
Gua
nine
nuc
leot
ide
bind
ing
prot
ein
γ tra
nsdu
cing
act
ivity
pol
ypep
tide
232
407.
312
.73
NM
_178
747
Gul
oL
gulo
nola
cton
e ox
idas
e6.
582
.712
.64
NM
_008
141
Gna
t2G
uani
ne n
ucle
otid
e bi
ndin
g pr
otei
n γ
trans
duci
ng a
ctiv
ity p
olyp
eptid
e 2
70.5
861.
112
.21
NM
_145
574
Ccd
c136
Coi
led-
coil
dom
ain
cont
aini
ng 1
3617
.621
3.8
12.1
3N
M_0
0991
8C
nga3
Cyc
lic n
ucle
otid
e ga
ted
chan
nel α
35
54.6
11N
M_1
3320
5A
rr3
Arr
estin
3, r
etin
al69
.665
2.6
9.32
NM
_184
053
Cal
uC
alum
enin
, a c
alci
um io
n bi
ndin
g pr
otei
n14
.813
1.6
8.82
NM
_183
224
Fam
19a3
Fam
ily w
ith se
quen
ce si
mila
rity
19, m
embe
r A3
30.7
266.
98.
69N
M_0
1016
4Ey
a1Ey
es a
bsen
t 1 h
omol
og1.
412
.68.
63N
M_0
0120
1378
Ccd
c136
Coi
led-
coil
dom
ain
cont
aini
ng 1
3616
.614
28.
51N
M_0
2565
9A
bi3
AB
I gen
e fa
mily
, mem
ber 3
1.4
11.5
8.28
NM
_013
848
Erm
apEr
ythr
obla
st m
embr
ane-
asso
ciat
ed p
rote
in1.
29.
88
NM
_133
167
Parv
bPa
rvin
β9
71.5
7.94
NM
_007
419
Adr
b1Β
-1 a
dren
ergi
c re
cept
or6.
550
.27.
73N
M_1
3865
3B
spry
B-b
ox a
nd S
PRY
-dom
ain
cont
aini
ng (z
etin
-1)
1.4
10.6
7.73
Man
y of
the
gene
s do
wn-
regu
late
d in
Nrl
−/−
retin
a re
pres
ent r
od-s
peci
fic tr
ansc
ripts
, whe
reas
upr
egul
ated
gen
es in
clud
e th
ose
asso
ciat
ed w
ith c
one
func
tion
and
retin
al re
mod
elin
g.
Molecular Vision 2011; 17:3034-3054 <http://www.molvis.org/molvis/v17/a327> © 2011 Molecular Vision
3048

several HKGs is underestimated by RNA-seq because of thealgorithmic limitation associated with alignment of reads thatmap to multiple genomic locations (paralogous sequences orpseudogenes). All of the outlying HKGs inspected had alower-than-projected FPKM value due to varying numbers ofassociated pseudogenes [64-67]. For example, Gapdh has 331pseudogenes in the mouse genome [64]. Our qRT–PCR dataprojected an FPKM value of approximately 4000 for Gapdh,yet the BWA workflow estimated an FPKM of only 6.6 in theWT retina (see Figure 3). This was also the case, but lesssevere, for Pgk1, Rps26, Rpl13a, and ActB. Currentalgorithms proportionally divide the number of reads aligningto multiple genes during FPKM calculation among thosegenes. In our study, unsuitable qRT–PCR assay designexplains the remaining exceptions to the linear correlationbetween qRT–PCR and RNA-seq. After careful visualinspection of the aligned reads in IGV, we found that the assaydesigned for Wisp1 was not specific to the splice variantexpressed in the retina. Similarly, the assays designed forCadm3 and Ubc were specific to one of the two transcriptsexpressed in the retina. Hence, RNA-seq provides a better
assessment of alternate isoforms, and transcript quantificationis not limited by the design of qRT–PCR assays.
We took advantage of the RNA-seq data to inspect theexpression of commonly used HKGs (see Table 5) fornormalization in qRT–PCR assays. The choice generallydepends on specific tissue and/or developmental time pointsbeing investigated. Our RNA-seq studies suggest that most ofthe HKGs can be used for normalization calculation in qRT–PCR assays; however, Gapdh, β-2 microglobulin (B2m), andUbc do not appear to be good choices. Additional RNA-seqdata would help in delineating relevant HKGs appropriate forqPCR validation in developing retina or cell types.
We compared two different strategies for analyzing WTand Nrl−/− RNA-seq data. The BWA workflow relies on fastand accurate gapped alignment of reads to the exonic regionsof the genome. Since the gap between most adjacent exons islarger than a few bases, the cumulative gap extension penaltyunderestimates the quality of the alignment of reads spanningthe splice junctions. Hence, the BWA workflow producedaccurate quantitative estimation of gene and transcriptisoform expression while losing valuable information about
Figure 6. Comparison of the current andprevious data sets of differentiallyexpressed transcripts of Nrl−/− versuswild type (WT) mouse retina. Overlapbetween the differentially expressedtranscripts (DETs) identified in thecurrent study and previous studies usingmouse retinas from the same age andgenotype was determined using theMouse Genome Informatics (MGI)gene symbol as the identifier. Thecurrent study includes all mRNAtranscripts identified with the Burrows-Wheeler Aligner (BWA) workflow(fold change ≥1.5 and p value <0.05).The 438 DETs of an Affymetrixmicroarray study [38] and 6,123 DETsfrom another RNA-seq study [54] withsimilar criteria were used forcomparison with our study. Of the 438DETs from the Corbo et al. [38] study,157 transcripts are not significantlydifferentially expressed in our data, 11are expressed below the fragments perkilobase of exon model per millionmapped reads (FPKM) detectionthreshold of 1.0, and 38 do not map tothe current annotations. Of the 6,123DETs from the Mustafi et al. [54] study,4,858 transcripts are not significantlydifferentially expressed in our study,348 are expressed below our FPKMdetection threshold of 1.0, and 62 do notmap to the current annotations.
Molecular Vision 2011; 17:3034-3054 <http://www.molvis.org/molvis/v17/a327> © 2011 Molecular Vision
3049

TAB
LE 1
0. V
ALI
DA
TIO
N O
F SEL
ECTE
D G
ENES
FRO
M ST
UD
Y C
OM
PAR
ISO
NS B
Y Q
RT–
PCR
Nam
eT
rans
crip
t ID
qRT
–PC
R F
CC
orbo
FC
Mus
tafi
FCT
his r
epor
t FC
p-va
lue
WT
FPK
MN
rl−/
− FP
KM
Cor
boA
bca1
3 ex
on 5
3/55
NM
_178
259
NA
−11.
58N
A−4
.18
0.00
0278
0.75
0.18
Abc
a13
exon
56/
58N
M_1
7825
9−2
1.36
−11.
58N
A−4
.18
0.00
0278
0.75
0.18
Am
z2N
M_0
2527
51.
09−6
.77
1.13
1.06
0.11
2215
.06
16.1
3K
lf9N
M_0
1063
81.
09−2
.6−1
.15
1.11
0.24
8129
.733
.12
Pip5
k1a
NM
_008
847
1.43
501.
031.
350.
0015
11.8
116
.25
Sem
a7a
NM
_011
352
1.03
20−1
.39
1.13
0.06
3413
.33
15.1
9Tx
nip
NM
_023
719
−1.0
712
.51
1.04
0.73
472.
172.
01M
usta
fiC
ox5b
NM
_009
942
1.26
NA
−12.
151.
010.
9342
18.3
118
.24
Drd
4N
M_0
0787
8−1
.23
NA
−8.7
2−1
.92
0.07
6439
.620
.92
Cd8
aN
M_0
0985
711
.5N
A21
.17
9.03
3.47
E-06
0.08
0.73
Cts
sN
M_0
2128
11.
25N
A6.
921.
290.
0228
3.82
5.23
Cor
bo-M
usta
fiA
coxl
NM
_028
765
−28.
6−1
3.93
−34
−4.6
10.
0291
0.28
0.06
Rpg
rip1
NM
_001
1685
15−1
.3−2
.32
−1.8
31.
060.
1157
29.9
431
.85
Dyn
lt3N
M_0
2597
51.
285
3.45
1.46
0.00
3617
.79
26.3
9R
ab18
NM
_181
070
1.37
3.23
3.31
1.29
0.00
2833
.71
43.7
7N
euro
d1N
M_0
1089
41.
382.
632.
21.
140.
0888
168.
5119
2.86
Thi
s rep
ort
Plek
hf2
NM
_175
175
−5.8
8N
A−1
.35
−5.3
50.
0004
2837
.77
7.21
Klh
l3N
M_0
0119
5075
−6.9
NA
NA
−3.2
90.
0001
018.
622.
6C
cdc2
4N
M_0
0103
4876
−2.9
3N
AN
A−2
.64
0.00
3166
.86
24.8
5R
gs22
NM
_001
1957
4811
.24
NA
NA
3.84
5.93
E-07
1.95
7.47
Hr
NM
_021
877
3.82
NA
1.25
3.89
0.00
0307
16.3
863
.51
Wsc
d2N
M_1
7729
24.
1N
A1.
134
0.00
0123
5.73
22.9
1K
lhl3
3N
M_0
0116
6651
27.1
2N
AN
A14
.03
2.34
E-06
3.02
42.2
5
D
iffer
entia
l exp
ress
ion
of g
enes
iden
tifie
d in
thre
e gl
obal
pro
filin
g st
udie
s (C
orbo
, Mus
tafi
and
this
repo
rt) w
as v
alid
ated
by
qRT–
PCR
. Gen
es s
how
n un
der t
he
Cor
bo an
d M
usta
fi su
bhea
ding
s wer
e ide
ntifi
ed in
resp
ectiv
e stu
dies
, but
not
in th
e cur
rent
stud
y. C
orbo
-Mus
tafi
subh
eadi
ng in
dica
tes g
enes
iden
tifie
d in
bot
h C
orbo
a
nd M
usta
fi st
udie
s but
not
in th
e cu
rren
t rep
ort.
The
two
gene
s, C
d8a
and
Acox
l, id
entif
ied
prev
ious
ly w
ere
diff
eren
tially
exp
ress
ed b
y qR
T–PC
R b
ut w
ere
filte
red
o
ut o
f our
sequ
enci
ng d
ata b
ecau
se o
f the
low
FPK
M v
alue
s obs
erve
d. T
he g
ene A
bca1
3 w
as d
etec
ted
as o
nly
expr
essi
ng th
e las
t 7 ex
ons o
f the
anno
tate
d se
quen
ce.
qR
T–PC
R a
ssay
s th
at d
istin
guis
hed
betw
een
the
two
isof
orm
s w
ere
able
to c
onfir
m th
e di
ffer
entia
l exp
ress
ion
of th
e la
st 7
Abc
a13
exon
s. Th
is g
ene
was
filte
red
ou
t of o
ur se
quen
cing
resu
lts b
ecau
se o
f the
low
FPK
M v
alue
obs
erve
d. A
ll ge
nes i
nclu
ded
in th
is re
port
subh
eadi
ng w
ere
uniq
uely
iden
tifie
d by
the
curr
ent s
tudy
(a
nd n
ot in
Cor
bo a
nd M
usta
fi re
ports
). FC
, p-v
al, a
nd F
PKM
val
ues
in th
is re
port
are
deriv
ed fr
om th
e se
quen
cing
resu
lts re
porte
d he
re. G
enes
wer
e se
lect
ed a
s
havi
ng th
e la
rges
t fol
d ch
ange
s in
eac
h ca
tego
ry a
nd fr
om c
urre
nt a
nnot
atio
n in
the
late
st m
m9
Ref
seq
build
. All
diff
eren
tially
exp
ress
ed g
enes
iden
tifie
d in
this
re
port
coul
d be
val
idat
ed b
y qR
T–PC
R. F
C=f
old
chan
ge, N
A=n
ot a
pplic
able
, FPK
M=f
ragm
ents
per
kilo
base
exo
n m
odel
per
mill
ion
read
s.
Molecular Vision 2011; 17:3034-3054 <http://www.molvis.org/molvis/v17/a327> © 2011 Molecular Vision
3050

alternate splicing. The higher accuracy of quantitative geneexpression estimates by the BWA workflow compared tothose by TopHat is evident from the stronger correlationdetermined by linear regression analysis of the DETs. Theregression line from BWA had a slope of −1.056 (comparedto −0.905 for TopHat) and R2 of 0.8798 (compared to 0.7727for TopHat).
The TopHat workflow maps the reads to exonic regionsof the reference genome as well as across all known andputative splice junctions defined in the Ensembl GTF file.TopHat attempts to map reads across splice junctions definedin the Ensembl GTF file and across novel splice junctionsdetected during the first phase of alignment. Hence, theTopHat workflow maps significantly more reads starting withthe same number of pass filter (PF) reads and detectsadditional transcript isoforms missed by the BWA workflow.The source of genomic annotations used by these methods isanother important difference. UCSC refFlat annotation (usedby the BWA workflow) for the mouse reference genome(build mm9) contained approximately 28,000 uniquetranscript isoforms, whereas the Ensembl GTF file (used bythe TopHat workflow) for the same genome build listed threetimes more unique transcript isoforms. The problem isamplified because of the lack of one-to-one mapping forseveral transcripts defined in the UCSC refFlat file in EnsemblGTF. Hence, a non-trivial number of DETs detected by theBWA workflow could not be mapped to any DET from theTopHat workflow (see Figure 2, regions shaded in green).
The BWA workflow detects about 16,000 transcripts inthe retina, with a minimum expression equivalent to onetranscript per cell (i.e., 1 FPKM) [16]. When the criteria wererelaxed to cover transcripts expressed at low levels (0.1FPKM), 20,707 transcripts were detected in the retina. This isnot surprising as the whole retina includes more than 50distinct neuronal cell types, and each cell would achieveprotein diversity largely by alternative promoter usage and/oralternative splicing [68]. The TopHat workflow yieldsthousands of known and putative transcript isoforms notpreviously described in the retina. However, validating thesenovel isoforms predicted from RNA-seq data remains achallenge.
Integrated analysis of RNA-seq data with miRNA-seq,transcription factor binding sites data (chromatinimmunoprecipitation sequencing-Chip-Seq), geneticvariations (expression Quantitative Trait Loci) [69], andmethylation patterns would allow decoding of the complexregulatory networks associated with retinal development andfunction. Several technical improvements would however benecessary to overcome the bias introduced into the RNA-seqdata due to GC content, mappability of reads, length of thegene, and regional differences due to local sequence structure[70]. RNA-seq methods are more likely to identify longerdifferentially expressed transcripts than shorter transcripts
with the same effect size [71]. New statistical methods arebeing developed to correct for systematic biases inherent inNGS data [70-72]. In the coming years, we will witness anexplosion in high throughput genomic methods that areexpected to revolutionize biology and biomedical discovery.
ACKNOWLEDGMENTSThis research was supported by Intramural Research Programof the National Eye Institute, National Institutes of Health,Bethesda, MD.
REFERENCES1. Margulies M, Egholm M, Altman WE, Attiya S, Bader JS,
Bemben LA, Berka J, Braverman MS, Chen YJ, Chen Z,Dewell SB, Du L, Fierro JM, Gomes XV, Godwin BC, He W,Helgesen S, Ho CH, Irzyk GP, Jando SC, Alenquer ML, JarvieTP, Jirage KB, Kim JB, Knight JR, Lanza JR, Leamon JH,Lefkowitz SM, Lei M, Li J, Lohman KL, Lu H, MakhijaniVB, McDade KE, McKenna MP, Myers EW, Nickerson E,Nobile JR, Plant R, Puc BP, Ronan MT, Roth GT, Sarkis GJ,Simons JF, Simpson JW, Srinivasan M, Tartaro KR, TomaszA, Vogt KA, Volkmer GA, Wang SH, Wang Y, Weiner MP,Yu P, Begley RF, Rothberg JM. Genome sequencing inmicrofabricated high-density picolitre reactors. Nature 2005;437:376-80. [PMID: 16056220]
2. Shendure J, Porreca GJ, Reppas NB, Lin X, McCutcheon JP,Rosenbaum AM, Wang MD, Zhang K, Mitra RD, ChurchGM. Accurate multiplex polony sequencing of an evolvedbacterial genome. Science 2005; 309:1728-32. [PMID:16081699]
3. Schuster SC. Next-generation sequencing transforms today'sbiology. Nat Methods 2008; 5:16-8. [PMID: 18165802]
4. Tsuji S. Genetics of neurodegenerative diseases: insights fromhigh-throughput resequencing. Hum Mol Genet 2010;19:R65-70. [PMID: 20413655]
5. Roukos DH. Next-generation sequencing and epigenometechnologies: potential medical applications. Expert Rev MedDevices 2010; 7:723-6. [PMID: 21050081]
6. Ding L, Wendl MC, Koboldt DC, Mardis ER. Analysis of next-generation genomic data in cancer: accomplishments andchallenges. Hum Mol Genet 2010; 19:R188-96. [PMID:20843826]
7. Tringe SG, Rubin EM. Metagenomics: DNA sequencing ofenvironmental samples. Nat Rev Genet 2005; 6:805-14.[PMID: 16304596]
8. Hofreuter D, Tsai J, Watson RO, Novik V, Altman B, BenitezM, Clark C, Perbost C, Jarvie T, Du L, Galan JE. Uniquefeatures of a highly pathogenic Campylobacter jejuni strain.Infect Immun 2006; 74:4694-707. [PMID: 16861657]
9. Oh JD, Kling-Backhed H, Giannakis M, Xu J, Fulton RS, FultonLA, Cordum HS, Wang C, Elliott G, Edwards J, Mardis ER,Engstrand LG, Gordon JI. The complete genome sequence ofa chronic atrophic gastritis Helicobacter pylori strain:evolution during disease progression. Proc Natl Acad SciUSA 2006; 103:9999-10004. [PMID: 16788065]
10. Wang C, Mitsuya Y, Gharizadeh B, Ronaghi M, Shafer RW.Characterization of mutation spectra with ultra-deeppyrosequencing: application to HIV-1 drug resistance.Genome Res 2007; 17:1195-201. [PMID: 17600086]
Molecular Vision 2011; 17:3034-3054 <http://www.molvis.org/molvis/v17/a327> © 2011 Molecular Vision
3051

11. Wheeler DA, Srinivasan M, Egholm M, Shen Y, Chen L,McGuire A, He W, Chen YJ, Makhijani V, Roth GT, GomesX, Tartaro K, Niazi F, Turcotte CL, Irzyk GP, Lupski JR,Chinault C, Song XZ, Liu Y, Yuan Y, Nazareth L, Qin X,Muzny DM, Margulies M, Weinstock GM, Gibbs RA,Rothberg JM. The complete genome of an individual bymassively parallel DNA sequencing. Nature 2008;452:872-6. [PMID: 18421352]
12. Korbel JO, Urban AE, Affourtit JP, Godwin B, Grubert F,Simons JF, Kim PM, Palejev D, Carriero NJ, Du L, TaillonBE, Chen Z, Tanzer A, Saunders AC, Chi J, Yang F, CarterNP, Hurles ME, Weissman SM, Harkins TT, Gerstein MB,Egholm M, Snyder M. Paired-end mapping reveals extensivestructural variation in the human genome. Science 2007;318:420-6. [PMID: 17901297]
13. Cokus SJ, Feng S, Zhang X, Chen Z, Merriman B, HaudenschildCD, Pradhan S, Nelson SF, Pellegrini M, Jacobsen SE.Shotgun bisulphite sequencing of the Arabidopsis genomereveals DNA methylation patterning. Nature 2008;452:215-9. [PMID: 18278030]
14. Johnson DS, Mortazavi A, Myers RM, Wold B. Genome-widemapping of in vivo protein-DNA interactions. Science 2007;316:1497-502. [PMID: 17540862]
15. Mikkelsen TS, Ku M, Jaffe DB, Issac B, Lieberman E,Giannoukos G, Alvarez P, Brockman W, Kim TK, Koche RP,Lee W, Mendenhall E, O'Donovan A, Presser A, Russ C, XieX, Meissner A, Wernig M, Jaenisch R, Nusbaum C, LanderES, Bernstein BE. Genome-wide maps of chromatin state inpluripotent and lineage-committed cells. Nature 2007;448:553-60. [PMID: 17603471]
16. Mortazavi A, Williams BA, McCue K, Schaeffer L, Wold B.Mapping and quantifying mammalian transcriptomes byRNA-Seq. Nat Methods 2008; 5:621-8. [PMID: 18516045]
17. Wilhelm BT, Marguerat S, Watt S, Schubert F, Wood V,Goodhead I, Penkett CJ, Rogers J, Bahler J. Dynamicrepertoire of a eukaryotic transcriptome surveyed at single-nucleotide resolution. Nature 2008; 453:1239-43. [PMID:18488015]
18. Trapnell C, Williams BA, Pertea G, Mortazavi A, Kwan G, vanBaren MJ, Salzberg SL, Wold BJ, Pachter L. Transcriptassembly and quantification by RNA-Seq revealsunannotated transcripts and isoform switching during celldifferentiation. Nat Biotechnol 2010; 28:511-5. [PMID:20436464]
19. Bradford JR, Hey Y, Yates T, Li Y, Pepper SD, Miller CJ. Acomparison of massively parallel nucleotide sequencing witholigonucleotide microarrays for global transcriptionprofiling. BMC Genomics 2010; 11:282. [PMID: 20444259]
20. Dowling JE. The retina: an approachable part of the brain.Cambridge, Mass.: Belknap Press of Harvard UniversityPress; 1987.
21. Mustafi D, Engel AH, Palczewski K. Structure of conephotoreceptors. Prog Retin Eye Res 2009; 28:289-302.[PMID: 19501669]
22. Yau KW, Hardie RC. Phototransduction motifs and variations.Cell 2009; 139:246-64. [PMID: 19837030]
23. Punzo C, Kornacker K, Cepko CL. Stimulation of the insulin/mTOR pathway delays cone death in a mouse model ofretinitis pigmentosa. Nat Neurosci 2009; 12:44-52. [PMID:19060896]
24. Wright AF, Chakarova CF, Abd El-Aziz MM, Bhattacharya SS.Photoreceptor degeneration: genetic and mechanisticdissection of a complex trait. Nat Rev Genet 2010;11:273-84. [PMID: 20212494]
25. Bramall AN, Wright AF, Jacobson SG, McInnes RR. Thegenomic, biochemical, and cellular responses of the retina ininherited photoreceptor degenerations and prospects for thetreatment of these disorders. Annu Rev Neurosci 2010;33:441-72. [PMID: 20572772]
26. Mears AJ, Kondo M, Swain PK, Takada Y, Bush RA, SaundersTL, Sieving PA, Swaroop A. Nrl is required for rodphotoreceptor development. Nat Genet 2001; 29:447-52.[PMID: 11694879]
27. Daniele LL, Lillo C, Lyubarsky AL, Nikonov SS, Philp N,Mears AJ, Swaroop A, Williams DS, Pugh EN Jr. Cone-likemorphological, molecular, and electrophysiological featuresof the photoreceptors of the Nrl knockout mouse. InvestOphthalmol Vis Sci 2005; 46:2156-67. [PMID: 15914637]
28. Nikonov SS, Daniele LL, Zhu X, Craft CM, Swaroop A, PughEN Jr. Photoreceptors of Nrl −/− mice coexpress functionalS- and M-cone opsins having distinct inactivationmechanisms. J Gen Physiol 2005; 125:287-304. [PMID:15738050]
29. Blackshaw S, Fraioli RE, Furukawa T, Cepko CL.Comprehensive analysis of photoreceptor gene expressionand the identification of candidate retinal disease genes. Cell2001; 107:579-89. [PMID: 11733058]
30. Blackshaw S, Harpavat S, Trimarchi J, Cai L, Huang H, KuoWP, Weber G, Lee K, Fraioli RE, Cho SH, Yung R, Asch E,Ohno-Machado L, Wong WH, Cepko CL. Genomic analysisof mouse retinal development. PLoS Biol 2004; 2:E247.[PMID: 15226823]
31. Sharon D, Blackshaw S, Cepko CL, Dryja TP. Profile of thegenes expressed in the human peripheral retina, macula, andretinal pigment epithelium determined through serial analysisof gene expression (SAGE). Proc Natl Acad Sci USA 2002;99:315-20. [PMID: 11756676]
32. Yu J, He S, Friedman JS, Akimoto M, Ghosh D, Mears AJ,Hicks D, Swaroop A. Altered expression of genes of the Bmp/Smad and Wnt/calcium signaling pathways in the cone-onlyNrl−/− mouse retina, revealed by gene profiling using customcDNA microarrays. J Biol Chem 2004; 279:42211-20.[PMID: 15292180]
33. Chowers I, Gunatilaka TL, Farkas RH, Qian J, Hackam AS, DuhE, Kageyama M, Wang C, Vora A, Campochiaro PA, ZackDJ. Identification of novel genes preferentially expressed inthe retina using a custom human retina cDNA microarray.Invest Ophthalmol Vis Sci 2003; 44:3732-41. [PMID:12939286]
34. Chowers I, Liu D, Farkas RH, Gunatilaka TL, Hackam AS,Bernstein SL, Campochiaro PA, Parmigiani G, Zack DJ. Geneexpression variation in the adult human retina. Hum MolGenet 2003; 12:2881-93. [PMID: 14519682]
35. Hackam AS, Qian J, Liu D, Gunatilaka T, Farkas RH, ChowersI, Kageyama M, Parmigiani G, Zack DJ. Comparative geneexpression analysis of murine retina and brain. Mol Vis 2004;10:637-49. [PMID: 15359217]
36. Ida H, Boylan SA, Weigel AL, Smit-McBride Z, Chao A, GaoJ, Buchoff P, Wistow G, Hjelmeland LM. EST analysis of
Molecular Vision 2011; 17:3034-3054 <http://www.molvis.org/molvis/v17/a327> © 2011 Molecular Vision
3052

mouse retina and RPE/choroid cDNA libraries. Mol Vis 2004;10:439-44. [PMID: 15257269]
37. Yoshida S, Mears AJ, Friedman JS, Carter T, He S, Oh E, JingY, Farjo R, Fleury G, Barlow C, Hero AO, Swaroop A.Expression profiling of the developing and mature Nrl−/−mouse retina: identification of retinal disease candidates andtranscriptional regulatory targets of Nrl. Hum Mol Genet2004; 13:1487-503. [PMID: 15163632]
38. Corbo JC, Myers CA, Lawrence KA, Jadhav AP, Cepko CL. Atypology of photoreceptor gene expression patterns in themouse. Proc Natl Acad Sci USA 2007; 104:12069-74.[PMID: 17620597]
39. Yetemian RM, Brown BM, Craft CM. Neovascularization,enhanced inflammatory response, and age-related conedystrophy in the Nrl−/−Grk1−/− mouse retina. InvestOphthalmol Vis Sci 2010; 51:6196-206. [PMID: 20688726]
40. Ben-Shlomo G, Ofri R, Bandah D, Rosner M, Sharon D.Microarray-based gene expression analysis during retinalmaturation of albino rats. Graefes Arch Clin Exp Ophthalmol2008; 246:693-702. [PMID: 18286297]
41. Dorrell MI, Aguilar E, Weber C, Friedlander M. Global geneexpression analysis of the developing postnatal mouse retina.Invest Ophthalmol Vis Sci 2004; 45:1009-19. [PMID:14985324]
42. Akimoto M, Cheng H, Zhu D, Brzezinski JA, Khanna R,Filippova E, Oh EC, Jing Y, Linares JL, Brooks M, ZareparsiS, Mears AJ, Hero A, Glaser T, Swaroop A. Targeting of GFPto newborn rods by Nrl promoter and temporal expressionprofiling of flow-sorted photoreceptors. Proc Natl Acad SciUSA 2006; 103:3890-5. [PMID: 16505381]
43. Trimarchi JM, Stadler MB, Cepko CL. Individual retinalprogenitor cells display extensive heterogeneity of geneexpression. PLoS One 2008; 3:e1588. [PMID: 18270576]
44. Parapuram SK, Cojocaru RI, Chang JR, Khanna R, Brooks M,Othman M, Zareparsi S, Khan NW, Gotoh N, Cogliati T,Swaroop A. Distinct signature of altered homeostasis in agingrod photoreceptors: implications for retinal diseases. PLoSONE 2010; 5:e13885. [PMID: 21079736]
45. Li H, Durbin R. Fast and accurate short read alignment withBurrows-Wheeler transform. Bioinformatics 2009;25:1754-60. [PMID: 19451168]
46. Fujita PA, Rhead B, Zweig AS, Hinrichs AS, Karolchik D,Cline MS, Goldman M, Barber GP, Clawson H, Coelho A,Diekhans M, Dreszer TR, Giardine BM, Harte RA, Hillman-Jackson J, Hsu F, Kirkup V, Kuhn RM, Learned K, Li CH,Meyer LR, Pohl A, Raney BJ, Rosenbloom KR, Smith KE,Haussler D, Kent WJ. The UCSC Genome Browser database:update 2011. Nucleic Acids Res 2011; 39:D876-82. [PMID:20959295]
47. Eisen MB, Spellman PT, Brown PO, Botstein D. Clusteranalysis and display of genome-wide expression patterns.Proc Natl Acad Sci USA 1998; 95:14863-8. [PMID:9843981]
48. Saldanha AJ. Java Treeview–extensible visualization ofmicroarray data. Bioinformatics 2004; 20:3246-8. [PMID:15180930]
49. Robinson JT, Thorvaldsdottir H, Winckler W, Guttman M,Lander ES, Getz G, Mesirov JP. Integrative genomics viewer.Nat Biotechnol 2011; 29:24-6. [PMID: 21221095]
50. Trapnell C, Pachter L, Salzberg SL. TopHat: discovering splicejunctions with RNA-Seq. Bioinformatics 2009; 25:1105-11.[PMID: 19289445]
51. Rozen S, Skaletsky H. Primer3 on the WWW for general usersand for biologist programmers. Methods Mol Biol 2000;132:365-86. [PMID: 10547847]
52. Livak KJ, Schmittgen TD. Analysis of relative gene expressiondata using real-time quantitative PCR and the 2(-Delta DeltaC(T)). Methods 2001; 25:402-8. [PMID: 11846609]
53. Vandesompele J, De Preter K, Pattyn F, Poppe B, Van Roy N,De Paepe A, Speleman F. Accurate normalization of real-timequantitative RT-PCR data by geometric averaging of multipleinternal control genes. Genome Biol 2002; 3:HOO34. [PMID:12184808]
54. Mustafi D, Kevany BM, Genoud C, Okano K, Cideciyan AV,Sumaroka A, Roman AJ, Jacobson SG, Engel A, Adams MD,Palczewski K. Defective photoreceptor phagocytosis in amouse model of enhanced S-cone syndrome causesprogressive retinal degeneration. FASEB J 2011;25:3157-76. [PMID: 21659555]
55. Furukawa T, Morrow EM, Cepko CL. Crx, a novel otx-likehomeobox gene, shows photoreceptor-specific expressionand regulates photoreceptor differentiation. Cell 1997;91:531-41. [PMID: 9390562]
56. Friedman JS, Ray JW, Waseem N, Johnson K, Brooks MJ,Hugosson T, Breuer D, Branham KE, Krauth DS, Bowne SJ,Sullivan LS, Ponjavic V, Granse L, Khanna R, Trager EH,Gieser LM, Hughbanks-Wheaton D, Cojocaru RI, GhiasvandNM, Chakarova CF, Abrahamson M, Goring HH, WebsterAR, Birch DG, Abecasis GR, Fann Y, Bhattacharya SS,Daiger SP, Heckenlively JR, Andreasson S, Swaroop A.Mutations in a BTB-Kelch protein, KLHL7, cause autosomal-dominant retinitis pigmentosa. Am J Hum Genet 2009;84:792-800. [PMID: 19520207]
57. Riazuddin SA, Shahzadi A, Zeitz C, Ahmed ZM, Ayyagari R,Chavali VR, Ponferrada VG, Audo I, Michiels C, LancelotME, Nasir IA, Zafar AU, Khan SN, Husnain T, Jiao X,MacDonald IM, Riazuddin S, Sieving PA, Katsanis N,Hejtmancik JF. A mutation in SLC24A1 implicated inautosomal-recessive congenital stationary night blindness.Am J Hum Genet 2010; 87:523-31. [PMID: 20850105]
58. Li L, Nakaya N, Chavali VR, Ma Z, Jiao X, Sieving PA,Riazuddin S, Tomarev SI, Ayyagari R, Riazuddin SA,Hejtmancik JF. A mutation in ZNF513, a putative regulatorof photoreceptor development, causes autosomal-recessiveretinitis pigmentosa. Am J Hum Genet 2010; 87:400-9.[PMID: 20797688]
59. Pepke S, Wold B, Mortazavi A. Computation for ChIP-seq andRNA-seq studies. Nat Methods 2009; 6:S22-32. [PMID:19844228]
60. Langmead B, Trapnell C, Pop M, Salzberg SL. Ultrafast andmemory-efficient alignment of short DNA sequences to thehuman genome. Genome Biol 2009; 10:R25. [PMID:19261174]
61. tHoen PA, Ariyurek Y, Thygesen HH, Vreugdenhil E, VossenRH, de Menezes RX, Boer JM, van Ommen GJ, den DunnenJT. Deep sequencing-based expression analysis shows majoradvances in robustness, resolution and inter-lab portabilityover five microarray platforms. Nucleic Acids Res 2008;36:e141. [PMID: 18927111]
Molecular Vision 2011; 17:3034-3054 <http://www.molvis.org/molvis/v17/a327> © 2011 Molecular Vision
3053

62. Gibson UE, Heid CA, Williams PM. A novel method for realtime quantitative RT-PCR. Genome Res 1996; 6:995-1001.[PMID: 8908519]
63. Foley KP, Leonard MW, Engel JD. Quantitation of RNA usingthe polymerase chain reaction. Trends Genet 1993; 9:380-5.[PMID: 7508648]
64. Liu YJ, Zheng D, Balasubramanian S, Carriero N, Khurana E,Robilotto R, Gerstein MB. Comprehensive analysis of thepseudogenes of glycolytic enzymes in vertebrates: theanomalously high number of GAPDH pseudogeneshighlights a recent burst of retrotrans-positional activity.BMC Genomics 2009; 10:480. [PMID: 19835609]
65. Ng SY, Gunning P, Eddy R, Ponte P, Leavitt J, Shows T, KedesL. Evolution of the functional human beta-actin gene and itsmulti-pseudogene family: conservation of noncoding regionsand chromosomal dispersion of pseudogenes. Mol Cell Biol1985; 5:2720-32. [PMID: 3837182]
66. Balasubramanian S, Zheng D, Liu YJ, Fang G, Frankish A,Carriero N, Robilotto R, Cayting P, Gerstein M. Comparativeanalysis of processed ribosomal protein pseudogenes in fourmammalian genomes. Genome Biol 2009; 10:R2. [PMID:19123937]
67. Lam HY, Khurana E, Fang G, Cayting P, Carriero N, CheungKH, Gerstein MB. Pseudofam: the pseudogene families
database. Nucleic Acids Res 2009; 37:D738-43. [PMID:18957444]
68. Pal S, Gupta R, Kim H, Wickramasinghe P, Baubet V, ShoweLC, Dahmane N, Davuluri RV. Alternative transcriptionexceeds alternative splicing in generating the transcriptomediversity of cerebellar development. Genome Res 2011;21:1260-72. [PMID: 21712398]
69. Majewski J, Pastinen T. The study of eQTL variations by RNA-seq: from SNPs to phenotypes. Trends Genet 2011; 27:72-9.[PMID: 21122937]
70. Cheung MS, Down TA, Latorre I, Ahringer J. Systematic biasin high-throughput sequencing data and its correction byBEADS. Nucleic Acids Res 2011; 39:e103. [PMID:21646344]
71. Gao L, Fang Z, Zhang K, Zhi D, Cui X. Length bias correctionfor RNA-seq data in gene set analyses. Bioinformatics 2011;27:662-9. [PMID: 21252076]
72. Roberts A, Trapnell C, Donaghey J, Rinn JL, Pachter L.Improving RNA-Seq expression estimates by correcting forfragment bias. Genome Biol 2011; 12:R22. [PMID:21410973]
Molecular Vision 2011; 17:3034-3054 <http://www.molvis.org/molvis/v17/a327> © 2011 Molecular Vision
Articles are provided courtesy of Emory University and the Zhongshan Ophthalmic Center, Sun Yat-sen University, P.R. China.The print version of this article was created on 20 November 2011. This reflects all typographical corrections and errata to thearticle through that date. Details of any changes may be found in the online version of the article.
3054