next generation sequencing - leymus genomics · since its introduction in 2009 by wang et al., mrna...
TRANSCRIPT

Next Generation SequencingNext Generation SequencingBioinformatics mRNA-Seq Data Analysis
Guidelines
genomescan.nl

GenomeScans’ Guidelines for mRNA Sequencing Analysis Using our own proprietary data analysis pipelines Dear customer, As of the beginning of 2015 ServiceXS became a trademark of GenomeScan B.V. GenomeScan focuses exclusively on Molecular Diagnostics whereas our ServiceXS trademark is intended for your R&D projects. GenomeScan is dedicated to help you design and perform Next Generation Sequencing (NGS) experiments that generate high quality results. This guide provides information for our data analysis services and resources and tools for further analysis of your sequencing data. NGS experiments result in vast amounts of data and therefore data analysis can be challenging. Our ability to assist in the analysis of your results can be the key factor leading to a successful project. Our experience in the past years is that even state-of-the-art NGS software is not always able to fulfil the data analysis needs of our customers. To alleviate this problem our experienced team of bioinformaticians and molecular biologists can provide standard or custom bioinformatics solutions to get the most out of your project. GenomeScan provides a comprehensive package of bioinformatics services for our NGS customers, which enable them to utilise all the applications that are possible with billions of bases of sequence data per run. GenomeScan can advise and assist you in every step of the data analysis. Do not hesitate to contact us if you have any questions after reading this guideline! On behalf of the Bioinformatics team, Thomas Chin-A-Woeng Project Manager

GenomeScan Guidelines- Page 2 of 12 mRNA Sequencing Analysis for NGS projects v2.0
© 2015 GenomeScan B.V. All rights reserved
ServiceXS™ | GenomeScan B.V. | Plesmanlaan 1D | 2333 BZ Leiden | The Netherlands
Telephone: +31 (0)71 568 1050 | Fax: +31 (0)71 568 1055 [email protected] | [email protected] | www.genomescan.nl | www.servicexs.com
Document Outline Page
1 Introduction 3
2 Application
2.1 Quality Filtering and Trimming 2.2 Alignment 2.3 Mapped mRNA Counting 2.4 Normalisations 2.5 Differential Expression Analysis 2.6 Principal Component Analysis 2.7 Read Statistics
4
3 Results
3.1 Normalized Gene Expression Values 3.2 Differentially Expressed Genes 3.3 Sample Expression Heatmap 3.4 MA Plot 3.5 Sample PCA Plot 3.6 Read Statistics 3.7 Transcript variants (optional)
7
4 File Formats
4.1 sample_id_FPKM.tab 4.2 analysis_Sig_Exp.tab 4.3 Image files 4.4 read_statistics.txt 4.5 counted_variants.tab (optional)
9
Changes to Previous Version (1.0) -Layout changes

GenomeScan Guidelines- Page 3 of 12 mRNA Sequencing Analysis for NGS projects v2.0
© 2015 GenomeScan B.V. All rights reserved
ServiceXS™ | GenomeScan B.V. | Plesmanlaan 1D | 2333 BZ Leiden | The Netherlands
Telephone: +31 (0)71 568 1050 | Fax: +31 (0)71 568 1055 [email protected] | [email protected] | www.genomescan.nl | www.servicexs.com
Chapter 1 Introduction
Ever since the first gene sequence was identified within a bacterium in 1972, molecular biologists have focussed on studying gene regulation and the ribonucleic acid (RNA) products that are derived from the gene sequences. There are several classes of these RNA molecules in a cell, most of them (rRNA, tRNA, etc) are involved in producing peptides and protein structures that are used for household function. Approximately, two percent of all RNAs in a given cell are sequences called messenger RNAs (mRNAs). These mRNAs encode the actual peptide sequence of proteins, and are used as a blueprint for making proteins. In broad terms, this means that if other factors within a cell remain constant, that mRNA abundance levels determine how often a certain protein is produced, which in turn changes a cells phenotype. These changes affect the cell, tissues, and organism, for example in terms of growth, hormone production, and also when disease occurs. Measuring mRNA transcript amounts in a cell can tell a researcher many things about the state it is in. Over the years many methods were devised to measure mRNA levels within a cell or tissue. It was soon recognised that genes are regulated within complex pathways and can function as antagonists for some genes and protagonists for others. This meant that to get a good overview of the activities within a cell, many if not all genes must be analysed at the same instance. To meet this demand, high-throughput gene expression analysis by use of microarrays was introduced. By capturing and converting mRNA from a sample to cDNA, it could be bound to a probe sequence which is hybridised on a glass microarray. By incorporating for example a fluorescent dye to the probe and the cDNA sequence, the binding of a cDNA could be measured and relative levels of cDNA (thus mRNA) could be inferred. Since its introduction in 2009 by Wang et al., mRNA sequencing is rapidly replacing gene expression microarrays in many studies and research groups. Also known as mRNA-Seq, the technique uses next-generation sequencing to create datasets containing many millions of short sequence 'reads' that describe the mRNAs found in the analysed sample. mRNA-seq has several advantages over microarray based experiments. Since mRNA-seq does not use probes or primers, the data suffer much less from biases. The reads directly represent mRNA transcripts, not ratios between foreground and background illumination measurements on arrays. This means that mRNA-seq can register a very high dynamic range of expression levels, ranging from absolute zero to many tens of thousands of reads for one gene. This sensitivity helps with detecting rare transcripts. With microarrays, researchers of lesser known organisms have to specially design arrays for expression detection, which is not required with this method. mRNA-seq also has shown a high degree of dataset robustness across platforms and studies. mRNA-seq does require cutting edge data analysis tools and pipelines to extract the most relevant results from these large datasets.

GenomeScan Guidelines- Page 4 of 12 mRNA Sequencing Analysis for NGS projects v2.0
© 2015 GenomeScan B.V. All rights reserved
ServiceXS™ | GenomeScan B.V. | Plesmanlaan 1D | 2333 BZ Leiden | The Netherlands
Telephone: +31 (0)71 568 1050 | Fax: +31 (0)71 568 1055 [email protected] | [email protected] | www.genomescan.nl | www.servicexs.com
Chapter 2 Applications
A short-read sequencer can generate many millions of short sequences that describe the mRNA transcripts that were extracted during sample preparation. To transform this raw data to relevant mRNA abundance levels information, our mRNA-Seq data analysis pipeline performs several steps which we will discuss in this chapter. 2.1 Quality filtering and trimming The mRNA-Seq pipeline starts with quality filtering and trimming of the sequence reads. For filtering a set of standard thresholds is used which are optimised for the mRNA-Seq analysis pipeline. The main parameter defaults are: Table 1. mRNA-Seq pipeline settings
Filter Default Description
Adapter trimming On Illumina sequencing adapters are removed
Minimal Q-score 22 All bases in the read should have at least a Q-score of 22 (corresponding to a chance of one error in 160 bases), bases with lower qualities are trimmed off
Minimal read length
36 After trimming bases reads should be at least 36 bp to be kept in the data set
Paired-end On For paired-end reads both reads should be kept or removed altogether
5' or 3' trim Off 5' and 3' end of reads can be optionally trimmed for adapter sequences or other unwanted bases indicated by the customer
Presumed adapter sequences are removed from the read when the bases match a sequence in the adapter sequence set (Illumina TruSeq adapters) with two or less mismatches and an alignment quality of at least 12. To remove noise introduced by sequencing errors, reads are filtered and clipped by quality. By default, the reads are filtered using a phred score of Q22 as a minimum threshold. Bases with phred scores below this level are removed and as a consequence reads are split. If the resulting reads are shorter than the minimal read length (36 bp by default), the reads are removed altogether (both pairs in paired-end reads) when paired-end mode is used. The filtered reads are written to FASTQ format and filtering statistics are calculated and reported. The filtered reads are used for the next stage of the pipeline. 2.2 Alignment Considering the nature of reads based on mRNA transcripts (e.g. exon junctions, alternative splicing) a mRNA-specific tool is used. The tool uses a short-read aligner based on Burrows–Wheeler Transform to ensure maximum sensitivity for mapping reads to exons of genes. A mismatch rate of 2% (2 mismatches in a read of 100 bases) is used by default. The alignment files (BAM files sorted and indexed .bam files according to SAM specifications) containing the mapped read information are provided on the data disk in the Alignments folder.
GenomeScan Guidelines- Page 5 of 12 mRNA Sequencing Analysis for NGS projects v2.0
© 2015 GenomeScan B.V. All rights reserved
ServiceXS™ | GenomeScan B.V. | Plesmanlaan 1D | 2333 BZ Leiden | The Netherlands
Telephone: +31 (0)71 568 1050 | Fax: +31 (0)71 568 1055 [email protected] | [email protected] | www.genomescan.nl | www.servicexs.com
2.3 Mapped mRNA Counting After the reads are mapped to the reference and stored in the BAM file, a mRNA quantifying tool will count all the reads that map to an annotated protein coding gene region of the reference. The mRNA counts are the basis for the differential expression analysis. 2.4 Normalisations Originally, gene expression microarray analysis is based on the ratios of expression differences between two groups of samples (sample versus controls or samples under different conditions). Differential expression analysis was specifically tailored to the needs of microarray based data like normalisations, removal of systematic biases and differing experimental designs. With mRNA-Seq, this analysis shifted away towards the specificities of mRNA-Seq, namely the concept of discrete counts of mRNA transcipts sequenced into short reads. Normalisations are still required but are less complex, they are mostly focussed on the inherent probabilistic nature of short read sequencing. The main form of RNA-Seq count normalisation results in Fragments (a.k.a. Both mapped paired-end reads counted as one fragment) per Kilobase of exon Per Million fragments mapped (FPKM) values. With FPKM values the counted mRNA reads mapped to the annotated genes are normalised to the size of the exon they align to (larger exons or genes have a higher chance to have more reads in the dataset) and also normalised for the amount of reads sequenced for the sample (to compensate for dataset size differences between samples). These FPKM values are saved in a file for all samples, found in the FPKM directory in the Analysis folder of the data disk, and can be used for general filtering and selection or differential expression analysis methods that are used in microarray based experiments. The normalisation performed for the differential expression analysis has a different basis. This method is based on the expectation that most genes are not differentially expressed. A scaling factor for a given dataset is computed as the median of the ratio, for each gene, of its read count over its geometric mean across the whole dataset. The underlying idea is that non-differential expressed genes should have similar read counts across samples, leading to a ratio of 1. Assuming most genes are not differentially expressed, the median of this ratio for the lane provides an estimate of the correction factor that should be applied to all read counts of this dataset to fulfill the expectation. 2.5 Differential Expression Analysis After normalisation our pipeline continues with differential expression analysis. The method was specifically developed to find differentially expressed genes between two conditions for mRNA-Seq data with small sample size and over-dispersion, uses a model based on a negative binomial distribution and local regression to estimate the relationship between the mean and variance of each gene. Furthermore, it allows scaling factors to be easily included in the statistical test. The differential expression analysis uses these models to calculate the difference of expression of the genes between two groups or two samples. It accurately provides the base mean levels of expression of the measured genes, fold and log2 fold change of expression between two groups/samples, the significance (p-value) of the difference and the multiple testing (Benjamini-Hochberg) corrected p-value. The significantly over- or under expressed genes are selected and ranked based their corrected p-value, with a cut-off of p=0.05.

GenomeScan Guidelines- Page 6 of 12 mRNA Sequencing Analysis for NGS projects v2.0
© 2015 GenomeScan B.V. All rights reserved
ServiceXS™ | GenomeScan B.V. | Plesmanlaan 1D | 2333 BZ Leiden | The Netherlands
Telephone: +31 (0)71 568 1050 | Fax: +31 (0)71 568 1055 [email protected] | [email protected] | www.genomescan.nl | www.servicexs.com
2.6 Principal Component Analysis In order to get an unbiased and quick overview of the variance within the samples, we perform a Principle Component analysis on the normalised FPKM values. The Principle component analysis provides useful sample clustering and can be used to identify deviant samples. 2.7 Read Statistics Lastly, to provide the customer with relevant sequence quality control data, we generate several read statistics, including before and after read filtering statistics, alignment, and count statistics. These values help you evaluate the quality of the dataset and identify issues if there are any.

GenomeScan Guidelines- Page 7 of 12 mRNA Sequencing Analysis for NGS projects v2.0
© 2015 GenomeScan B.V. All rights reserved
ServiceXS™ | GenomeScan B.V. | Plesmanlaan 1D | 2333 BZ Leiden | The Netherlands
Telephone: +31 (0)71 568 1050 | Fax: +31 (0)71 568 1055 [email protected] | [email protected] | www.genomescan.nl | www.servicexs.com
Chapter 3 Results
3.1 Normalised Gene Expression Values The main product of the mRNA-Seq pipeline are the normalised values of gene expression, which can be filtered and used in downstream analysis performed by the customer. The expression values are normalised using FPKM normalization as described in Chapter 2. All the genes found in the reference annotation are included, even if they do not have any associated expression. Each expressed gene is listed separately per Ensembl Gene ID and the Gene Symbol associated with the Ensemble Gene ID is also included as annotation. The FPKM file and its content is described in Chapter 4.1. 3.2 Differentially Expressed Genes To report relevant differential expression analysis between two groups or two samples a comprehensive list with the differentially expressed genes and their associated statistics is provided. If a gene is found to be differential expressed with a corrected p-value of 0.05, it will be included in the list, and all the differentially expressed genes will be ranked according to their p-value. Each expressed gene is listed separately per Ensembl Gene ID and the Gene Symbol associated with the Ensemble Gene ID is also included as annotation. The list with differentially expressed genes is described in Chapter 4.2.
3.3 Sample Expression Heatmap To show an overview how the expression levels of the different samples relate to each other, a sample heatmap based on expression data is generated. The heatmap also includes a cluster branching tree to identify which samples cluster together in groups. The heatmap can be used to investigate if the sample grouping during analysis is sensible and can identify deviant samples. All image file formats are described in Chapter 4.3. 3.4 MA Plot In microarray experiments, MA plots are generated before normalisation to inform the user of any pre-existing systematic biases that need to be corrected before any further analysis can be performed. For mRNA-Seq a MA plot is produced to identify if the gene expression differential ratios show any deviations that might affect the analysis, but also to give the customer with experiences in microarray analysis a familiar overview. The plot is supplied as a PNG image, all the image files are described in Chapter 4.3. 3.5 Sample PCA Plot To get an unbiased and quick overview of the variance within the samples, a PCA plot is optionally generated. As the name implies, the first component shows how the variance of the FKPM normalised counts appears per sample. The plot can also be used as a way to identify issues or deviant samples. The plot is supplied as a PNG image, all the image files are described in Chapter 4.3. 3.6 Read Statistics To determine read filtering and read mapping efficiency and to investigate possible issues during of before sequencing, the pipeline generates a file with read statistics. The read statistics file and its content are described in Chapter 4.4.

GenomeScan Guidelines- Page 8 of 12 mRNA Sequencing Analysis for NGS projects v2.0
© 2015 GenomeScan B.V. All rights reserved
ServiceXS™ | GenomeScan B.V. | Plesmanlaan 1D | 2333 BZ Leiden | The Netherlands
Telephone: +31 (0)71 568 1050 | Fax: +31 (0)71 568 1055 [email protected] | [email protected] | www.genomescan.nl | www.servicexs.com
3.7 Transcript Variants (optional)
One of the advantages of mRNA-Seq is that we can thoroughly identify the sequence of a mRNA transcript and classify if it is an alternative variation. This makes it possible to determine if alternative variants are found in the sample, with more sensitivity then (custom) microarrays. The file is based on the Ensembl Transcript ID and will contain counted (non-normalised) expressions values and will have Gene Symbol annotation per transcript. The transcript variants file and its content is described in Chapter 4.5.
GenomeScan Guidelines- Page 9 of 12 mRNA Sequencing Analysis for NGS projects v2.0
© 2015 GenomeScan B.V. All rights reserved
ServiceXS™ | GenomeScan B.V. | Plesmanlaan 1D | 2333 BZ Leiden | The Netherlands
Telephone: +31 (0)71 568 1050 | Fax: +31 (0)71 568 1055 [email protected] | [email protected] | www.genomescan.nl | www.servicexs.com
Chapter 4 File Formats
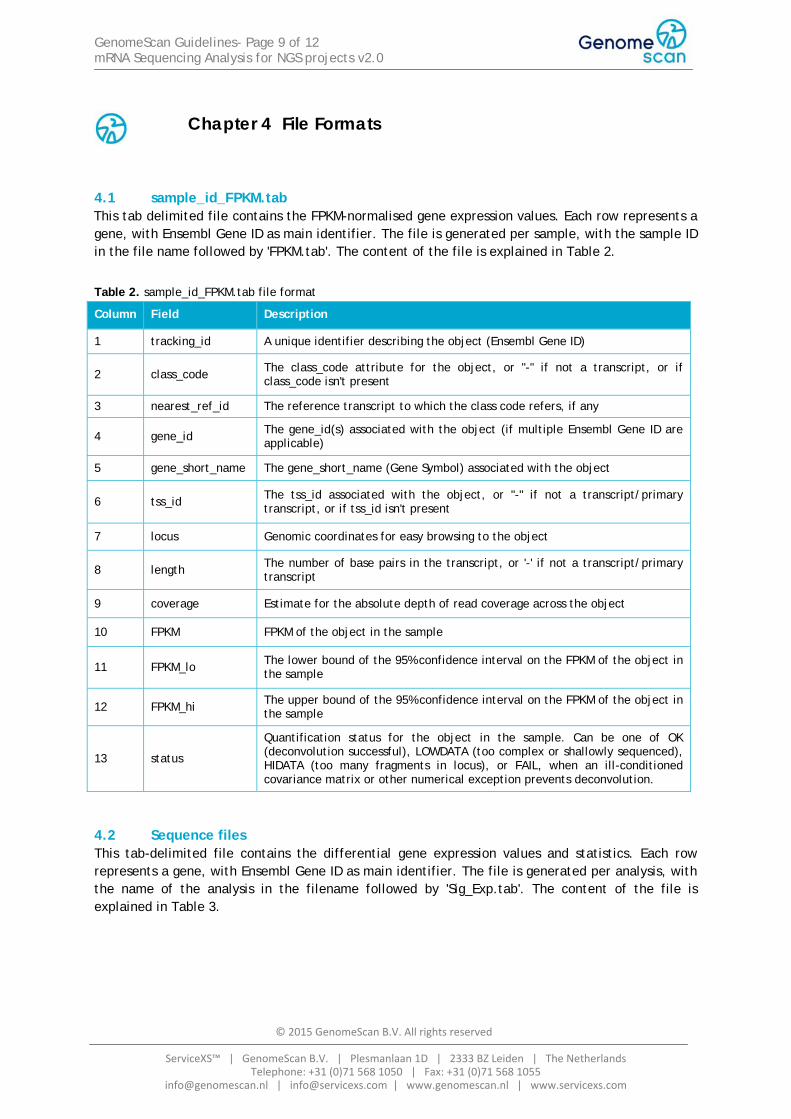
4.1 sample_id_FPKM.tab This tab delimited file contains the FPKM-normalised gene expression values. Each row represents a gene, with Ensembl Gene ID as main identifier. The file is generated per sample, with the sample ID in the file name followed by 'FPKM.tab'. The content of the file is explained in Table 2.
Table 2. sample_id_FPKM.tab file format
Column Field Description
1 tracking_id A unique identifier describing the object (Ensembl Gene ID)
2 class_code The class_code attribute for the object, or "-" if not a transcript, or if class_code isn't present
3 nearest_ref_id The reference transcript to which the class code refers, if any
4 gene_id The gene_id(s) associated with the object (if multiple Ensembl Gene ID are applicable)
5 gene_short_name The gene_short_name (Gene Symbol) associated with the object
6 tss_id The tss_id associated with the object, or "-" if not a transcript/primary transcript, or if tss_id isn't present
7 locus Genomic coordinates for easy browsing to the object
8 length The number of base pairs in the transcript, or '-' if not a transcript/primary transcript
9 coverage Estimate for the absolute depth of read coverage across the object
10 FPKM FPKM of the object in the sample
11 FPKM_lo The lower bound of the 95% confidence interval on the FPKM of the object in the sample
12 FPKM_hi The upper bound of the 95% confidence interval on the FPKM of the object in the sample
13 status
Quantification status for the object in the sample. Can be one of OK (deconvolution successful), LOWDATA (too complex or shallowly sequenced), HIDATA (too many fragments in locus), or FAIL, when an ill-conditioned covariance matrix or other numerical exception prevents deconvolution.
4.2 Sequence files This tab-delimited file contains the differential gene expression values and statistics. Each row represents a gene, with Ensembl Gene ID as main identifier. The file is generated per analysis, with the name of the analysis in the filename followed by 'Sig_Exp.tab'. The content of the file is explained in Table 3.

GenomeScan Guidelines- Page 10 of 12 mRNA Sequencing Analysis for NGS projects v2.0
© 2015 GenomeScan B.V. All rights reserved
ServiceXS™ | GenomeScan B.V. | Plesmanlaan 1D | 2333 BZ Leiden | The Netherlands
Telephone: +31 (0)71 568 1050 | Fax: +31 (0)71 568 1055 [email protected] | [email protected] | www.genomescan.nl | www.servicexs.com
Table 3. analysis_Sig_Exp.tab file format
Column Field Description
1 GeneID Ensembl Gene ID for which the calculation is made
2 Mean coverage Mean expression level (at the base scale) as a joint estimate from both groups
3 BaseMeanA (Sample ID's of group) Estimated expression level for group 1
4 BaseMeanB (Sample ID's of group) Estimated expression level for group 2
5 BaseMeanB / baseMeanA The level of the fold change between the groups
6 2log (baseMeanB / BaseMeanA) The logarithm (to basis 2) of the fold change between the groups
7 P-value of log2FoldChange P-value for the statistical significance of the fold change
8 adjusted p-value P-value corrected for multiple testing for the fold change, to counterbalance the false discovery rate
9 rank Rank based on the corrected p-value
4.3 Image Files This section describes the various images that are generated during the pipeline analysis. All images are also explained and interpreted in the Data Analysis Report.
Analysis_heatmap_plot.png The following image (Fig. 1) is an example of a sample expression heatmap. The file is generated per analysis, with the name of the analysis in the filename followed by 'heatmap_plot.png'. The gradient colour represents the relative variation of expression between the samples, as defined by the legend. The branching tree shows which samples group together, without being influenced by the predefined grouping.
Fig. 1. Heatmap plot

GenomeScan Guidelines- Page 11 of 12 mRNA Sequencing Analysis for NGS projects v2.0
© 2015 GenomeScan B.V. All rights reserved
ServiceXS™ | GenomeScan B.V. | Plesmanlaan 1D | 2333 BZ Leiden | The Netherlands
Telephone: +31 (0)71 568 1050 | Fax: +31 (0)71 568 1055 [email protected] | [email protected] | www.genomescan.nl | www.servicexs.com
Analysis_res_ma_plot.png The following image (Fig. 2) is an example of a MA plot. The file is generated per analysis, with the name of the analysis in the file name followed by 'res_ma_plot.png'. The log2 fold change levels are plotted against the base mean expression level to show any structural or systematic deviations and to show the differentially expressed genes, shown by the red dots. The mass of the measurements should centre around zero, because most genes do not have a deviant expression.
Fig. 2. MA Plot Analysis_pca.png The following image (Fig. 3) is an example of a Principle Component Analysis plot. The file is generated per analysis using FKPM values, with the name of the analysis in the filename followed by 'pca.png'. The PCA plot shows the relative variation based on the first two components (component 1 on x axis, component 2 on y axis). The first component (principle component) always has the highest differential power. If samples show clustering on the x axis that should be an indication that they resemble each other.
Fig. 3. PCA plot using normalised values

GenomeScan Guidelines- Page 12 of 12 mRNA Sequencing Analysis for NGS projects v2.0
© 2015 GenomeScan B.V. All rights reserved
ServiceXS™ | GenomeScan B.V. | Plesmanlaan 1D | 2333 BZ Leiden | The Netherlands
Telephone: +31 (0)71 568 1050 | Fax: +31 (0)71 568 1055 [email protected] | [email protected] | www.genomescan.nl | www.servicexs.com
4.4 read_statistics.txt This tab delimited file contains the numbers of reads and counts for the raw data and intermediate datasets. The file is generated per project, the filename is always the same. This file can be used to view the process from filtered FASTQ reads to counted mRNAs. If a loss of data occurs during analysis, this file helps pinpoint where. The content of the file is explained in Table 4. Table 4. Read statistics
Column Field Description
1 Sample_Filename Name of the sample filtered Fastq file
2 Fastq_Read_Counts Amount of filtered Fastq reads
3 Unique_reads_in_SAM Amount of unique and aligned reads in SAM
4 Total_Counts Total amount of counts found by HTSeq count
4.5 counted_variants.tab (optional) This tab delimited file contains the counts per Ensemble Transcript ID for each sample is reported. The file is generated per project, the filename is always the same. This file can be used to identify alternative transcript variants and their quantities, but is less suitable for expression analysis. The content of the file is explained in Table 5. Table 5. Count file format
Column Field Description
1 Transcript ID Transcript ID which is counted
2..n Sample columns Each sample is represented in one column of the table
Last Annotation Gene Symbol that is associated to the Transcript ID