next generation sequencing, tiling arrays and - r¤tsch lab
TRANSCRIPT
Next Generation Sequencing, Tiling Arrays and
Predictive Sequence Analysis for
Transcriptome Analysis
Gunnar Ratsch
Friedrich Miescher Laboratory
Max Planck Society, Tubingen, Germany
9th Course in Bioinformatics and Systems Biologyfor Molecular Biologists (March 24, 2009)
c© Gunnar Ratsch (FML, Tubingen) Methods for Transcriptome Analysis Bertinoro Systems Biology 1 / 89
Introduction
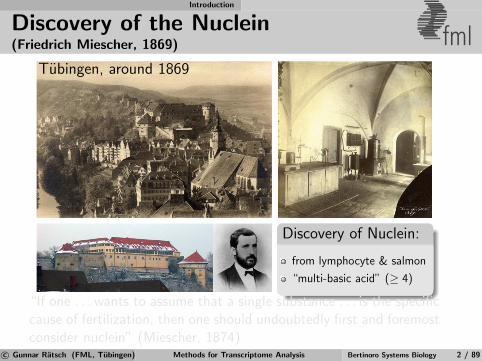
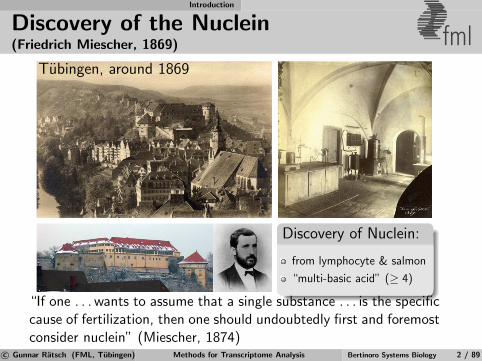
Discovery of the Nuclein(Friedrich Miescher, 1869) fml
Discovery of Nuclein:
from lymphocyte & salmon
“multi-basic acid” (≥ 4)
Tubingen, around 1869
“If one . . . wants to assume that a single substance . . . is the specificcause of fertilization, then one should undoubtedly first and foremostconsider nuclein” (Miescher, 1874)
c© Gunnar Ratsch (FML, Tubingen) Methods for Transcriptome Analysis Bertinoro Systems Biology 2 / 89
Introduction
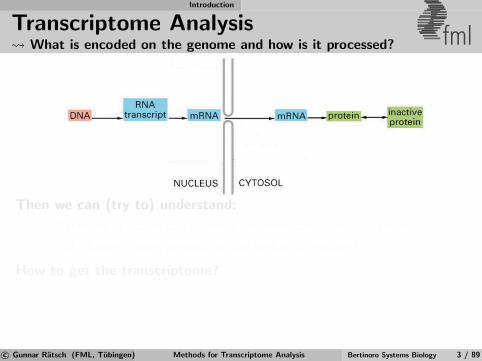
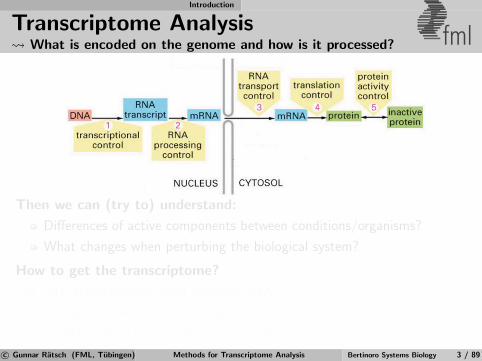
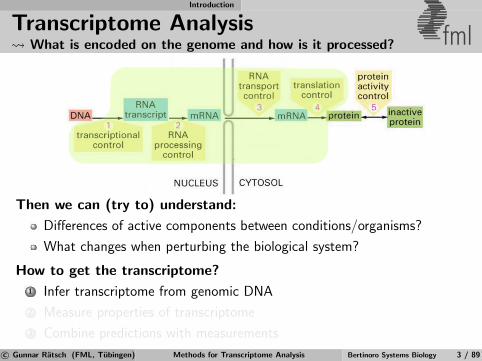
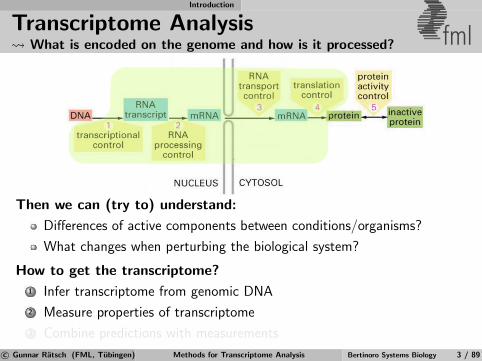
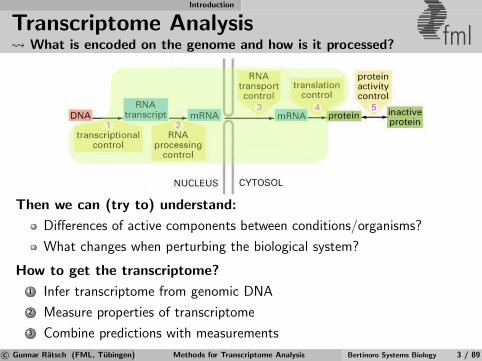
Transcriptome Analysis What is encoded on the genome and how is it processed? fml
Then we can (try to) understand:
Differences of active components between conditions/organisms?
What changes when perturbing the biological system?
How to get the transcriptome?
1 Infer transcriptome from genomic DNA
2 Measure properties of transcriptome
3 Combine predictions with measurements
c© Gunnar Ratsch (FML, Tubingen) Methods for Transcriptome Analysis Bertinoro Systems Biology 3 / 89
Introduction
Transcriptome Analysis What is encoded on the genome and how is it processed? fml
Then we can (try to) understand:
Differences of active components between conditions/organisms?
What changes when perturbing the biological system?
How to get the transcriptome?
1 Infer transcriptome from genomic DNA
2 Measure properties of transcriptome
3 Combine predictions with measurements
c© Gunnar Ratsch (FML, Tubingen) Methods for Transcriptome Analysis Bertinoro Systems Biology 3 / 89
Introduction
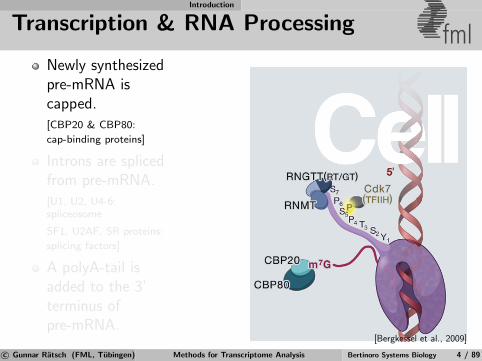
Transcription & RNA Processing fmlNewly synthesizedpre-mRNA iscapped.[CBP20 & CBP80:
cap-binding proteins]
Introns are splicedfrom pre-mRNA.[U1, U2, U4-6:spliceosome
SF1, U2AF, SR proteins:
splicing factors]
A polyA-tail isadded to the 3’terminus ofpre-mRNA.
[Bergkessel et al., 2009]
c© Gunnar Ratsch (FML, Tubingen) Methods for Transcriptome Analysis Bertinoro Systems Biology 4 / 89
Introduction
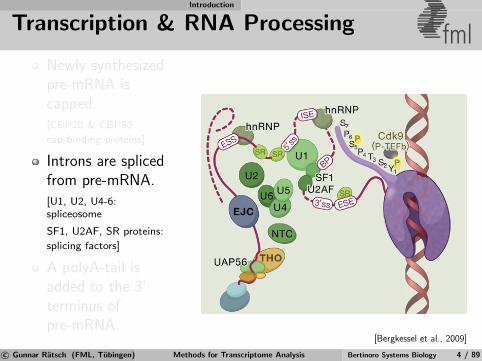
Transcription & RNA Processing fmlNewly synthesizedpre-mRNA iscapped.[CBP20 & CBP80:
cap-binding proteins]
Introns are splicedfrom pre-mRNA.[U1, U2, U4-6:spliceosome
SF1, U2AF, SR proteins:
splicing factors]
A polyA-tail isadded to the 3’terminus ofpre-mRNA.
[Bergkessel et al., 2009]
c© Gunnar Ratsch (FML, Tubingen) Methods for Transcriptome Analysis Bertinoro Systems Biology 4 / 89
Introduction
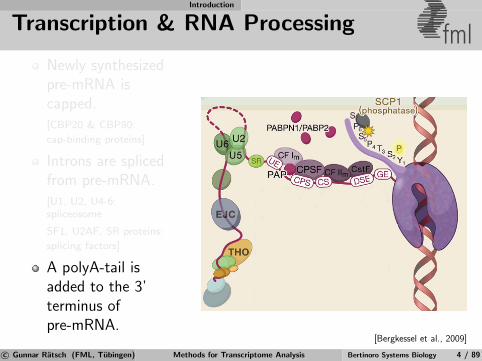
Transcription & RNA Processing fmlNewly synthesizedpre-mRNA iscapped.[CBP20 & CBP80:
cap-binding proteins]
Introns are splicedfrom pre-mRNA.[U1, U2, U4-6:spliceosome
SF1, U2AF, SR proteins:
splicing factors]
A polyA-tail isadded to the 3’terminus ofpre-mRNA.
[Bergkessel et al., 2009]
c© Gunnar Ratsch (FML, Tubingen) Methods for Transcriptome Analysis Bertinoro Systems Biology 4 / 89
Introduction
RNA Transcripts fml
Protein-coding mRNAs
Noncoding RNAs
Structural RNAs (e.g. rRNAs, tRNAs, . . .)Small RNAs (e.g. miRNAs, endogenous siRNAs, . . .)Antisense / promoter-associated transcripts. . .
c© Gunnar Ratsch (FML, Tubingen) Methods for Transcriptome Analysis Bertinoro Systems Biology 5 / 89
Introduction
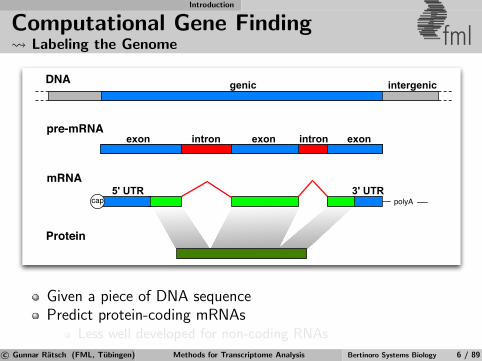
Computational Gene Finding Labeling the Genome fml
DNA
pre-mRNA
mRNA
Protein
5' UTR
exon
intergenic
3' UTR
intron
genic
exon exonintron
polyAcap
Given a piece of DNA sequencePredict protein-coding mRNAs
Less well developed for non-coding RNAs
c© Gunnar Ratsch (FML, Tubingen) Methods for Transcriptome Analysis Bertinoro Systems Biology 6 / 89
Introduction
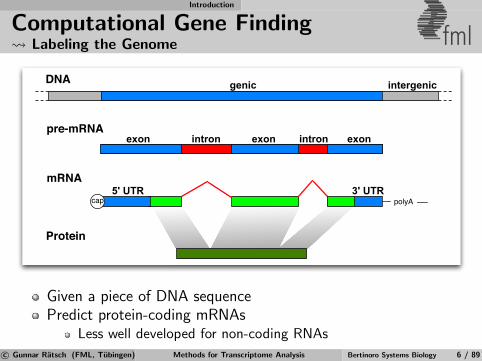
Computational Gene Finding Labeling the Genome fml
DNA
pre-mRNA
mRNA
Protein
5' UTR
exon
intergenic
3' UTR
intron
genic
exon exonintron
polyAcap
Given a piece of DNA sequencePredict protein-coding mRNAs
Less well developed for non-coding RNAs
c© Gunnar Ratsch (FML, Tubingen) Methods for Transcriptome Analysis Bertinoro Systems Biology 6 / 89
Introduction
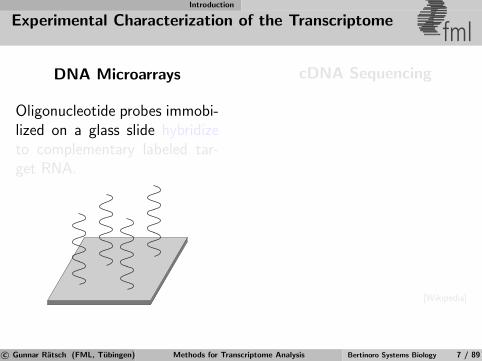
Experimental Characterization of the Transcriptomefml
DNA Microarrays
Oligonucleotide probes immobi-lized on a glass slide hybridizeto complementary labeled tar-get RNA.
cDNA Sequencing
[Wikipedia]
c© Gunnar Ratsch (FML, Tubingen) Methods for Transcriptome Analysis Bertinoro Systems Biology 7 / 89
Introduction
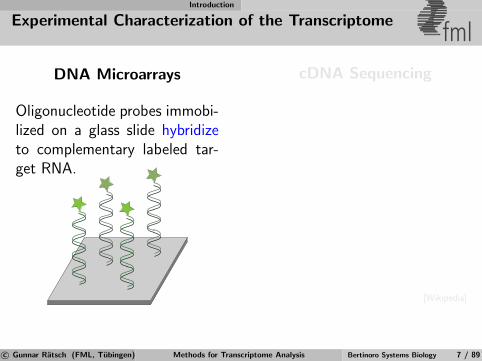
Experimental Characterization of the Transcriptomefml
DNA Microarrays
Oligonucleotide probes immobi-lized on a glass slide hybridizeto complementary labeled tar-get RNA.
cDNA Sequencing
[Wikipedia]
c© Gunnar Ratsch (FML, Tubingen) Methods for Transcriptome Analysis Bertinoro Systems Biology 7 / 89

Introduction
Experimental Characterization of the Transcriptomefml
DNA Microarrays
Oligonucleotide probes immobi-lized on a glass slide hybridizeto complementary labeled tar-get RNA.
cDNA Sequencing
[Wikipedia]
c© Gunnar Ratsch (FML, Tubingen) Methods for Transcriptome Analysis Bertinoro Systems Biology 7 / 89
Introduction
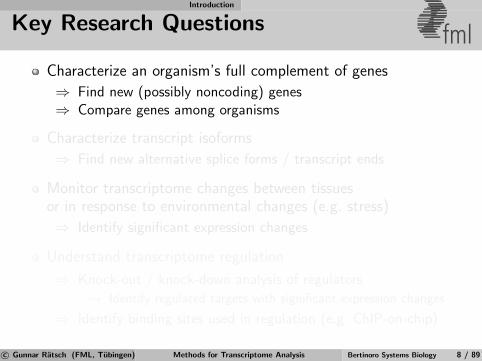
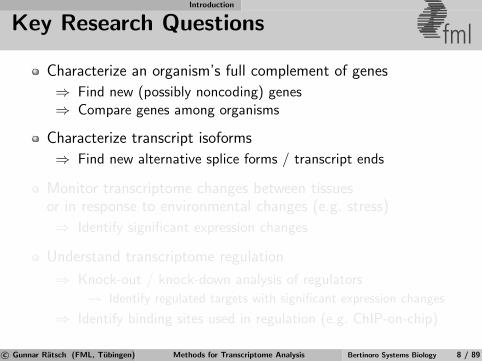
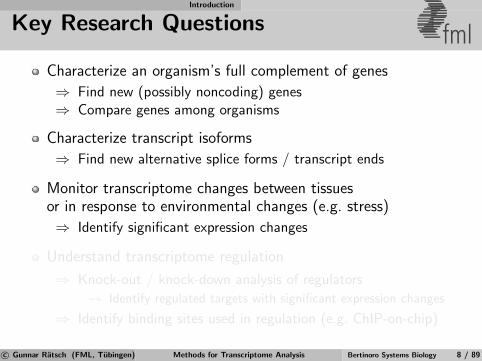
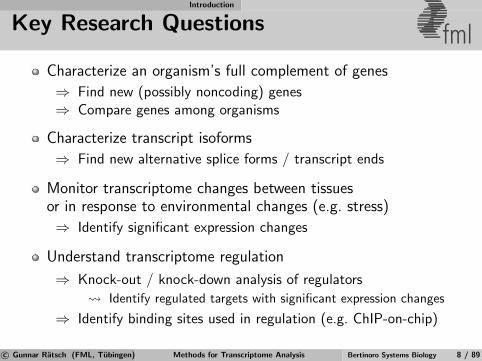
Key Research Questions fmlCharacterize an organism’s full complement of genes
⇒ Find new (possibly noncoding) genes⇒ Compare genes among organisms
Characterize transcript isoforms
⇒ Find new alternative splice forms / transcript ends
Monitor transcriptome changes between tissuesor in response to environmental changes (e.g. stress)
⇒ Identify significant expression changes
Understand transcriptome regulation
⇒ Knock-out / knock-down analysis of regulators
Identify regulated targets with significant expression changes
⇒ Identify binding sites used in regulation (e.g. ChIP-on-chip)
c© Gunnar Ratsch (FML, Tubingen) Methods for Transcriptome Analysis Bertinoro Systems Biology 8 / 89
Introduction
Key Research Questions fmlCharacterize an organism’s full complement of genes
⇒ Find new (possibly noncoding) genes⇒ Compare genes among organisms
Characterize transcript isoforms
⇒ Find new alternative splice forms / transcript ends
Monitor transcriptome changes between tissuesor in response to environmental changes (e.g. stress)
⇒ Identify significant expression changes
Understand transcriptome regulation
⇒ Knock-out / knock-down analysis of regulators
Identify regulated targets with significant expression changes
⇒ Identify binding sites used in regulation (e.g. ChIP-on-chip)
c© Gunnar Ratsch (FML, Tubingen) Methods for Transcriptome Analysis Bertinoro Systems Biology 8 / 89

Roadmap fml1 Computational Gene Finding
Identification of Genomic SignalsLearning to Predict mRNA Transcripts
2 Whole-genome Tiling ArraysTechnology and LimitationsIdentification of Expression DifferencesDe Novo Transcript Discovery
3 Next-generation SequencingTechnology & LimitationsAssembly & Read Mapping
4 ExtensionsQuantification of TranscriptsChIP-on-Chip Studies
c© Gunnar Ratsch (FML, Tubingen) Methods for Transcriptome Analysis Bertinoro Systems Biology 9 / 89
Computational Gene Finding Basics
Computational Gene Finding Labeling the Genome fml
DNA
Protein
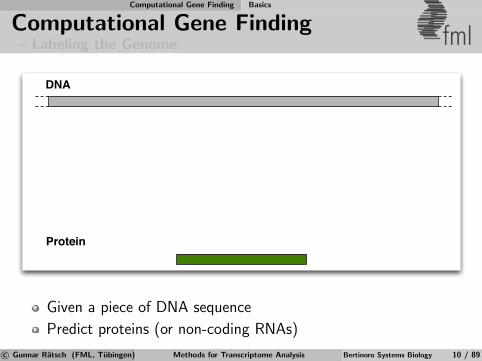
Given a piece of DNA sequence
Predict proteins (or non-coding RNAs)
c© Gunnar Ratsch (FML, Tubingen) Methods for Transcriptome Analysis Bertinoro Systems Biology 10 / 89
Computational Gene Finding Basics
Computational Gene Finding Labeling the Genome fml
DNA
pre-mRNA
mRNA
Protein
5' UTR
exon
intergenic
3' UTR
intron
genic
exon exonintron
polyAcap
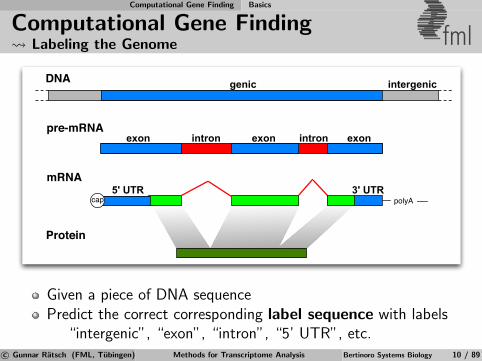
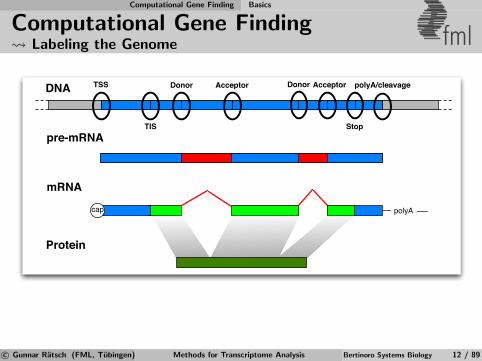
Given a piece of DNA sequencePredict the correct corresponding label sequence with labels
“intergenic”, “exon”, “intron”, “5’ UTR”, etc.c© Gunnar Ratsch (FML, Tubingen) Methods for Transcriptome Analysis Bertinoro Systems Biology 10 / 89
Computational Gene Finding Basics
Hidden Markov Models fmlDNA
pre - mRNA
major RNA
protein
5' UTR
Exon
Intergenic
3' UTR
Intron
genic
Exon ExonIntron
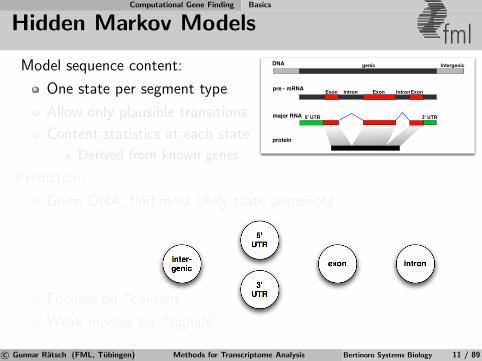
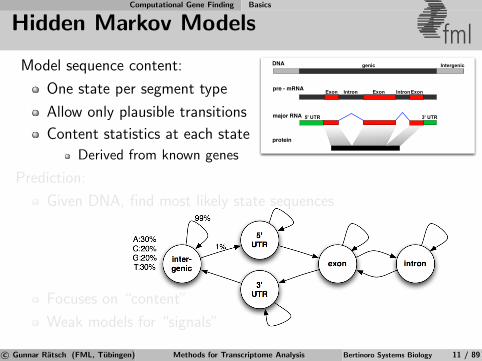
Model sequence content:
One state per segment type
Allow only plausible transitions
Content statistics at each state
Derived from known genes
Prediction:
Given DNA, find most likely state sequences
Focuses on “content”
Weak models for “signals”
c© Gunnar Ratsch (FML, Tubingen) Methods for Transcriptome Analysis Bertinoro Systems Biology 11 / 89
Computational Gene Finding Basics
Hidden Markov Models fmlDNA
pre - mRNA
major RNA
protein
5' UTR
Exon
Intergenic
3' UTR
Intron
genic
Exon ExonIntron
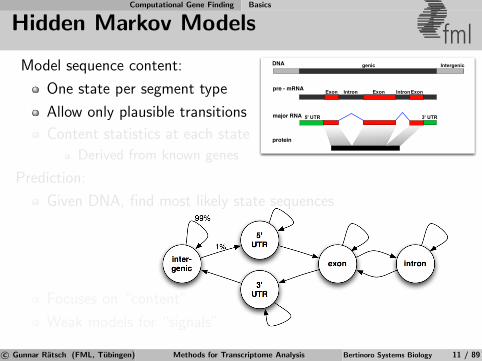
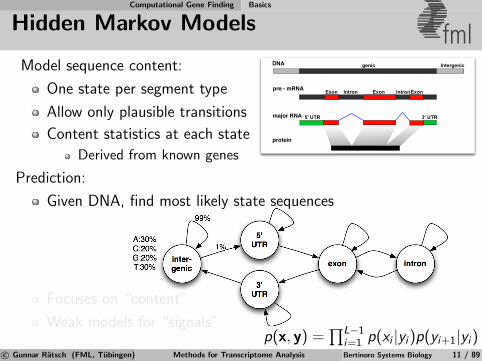
p(x, y) =∏L−1
i=1 p(xi |yi)p(yi+1|yi)
Model sequence content:
One state per segment type
Allow only plausible transitions
Content statistics at each state
Derived from known genes
Prediction:
Given DNA, find most likely state sequences
Focuses on “content”
Weak models for “signals”
c© Gunnar Ratsch (FML, Tubingen) Methods for Transcriptome Analysis Bertinoro Systems Biology 11 / 89
Computational Gene Finding Basics
Hidden Markov Models fmlDNA
pre - mRNA
major RNA
protein
5' UTR
Exon
Intergenic
3' UTR
Intron
genic
Exon ExonIntron
p(x, y) =∏L−1
i=1 p(xi |yi)p(yi+1|yi)
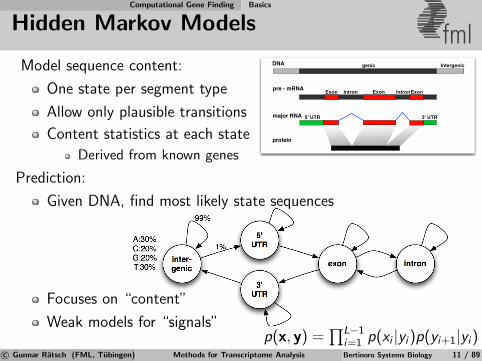
Model sequence content:
One state per segment type
Allow only plausible transitions
Content statistics at each state
Derived from known genes
Prediction:
Given DNA, find most likely state sequences
Focuses on “content”
Weak models for “signals”
c© Gunnar Ratsch (FML, Tubingen) Methods for Transcriptome Analysis Bertinoro Systems Biology 11 / 89
Computational Gene Finding Basics
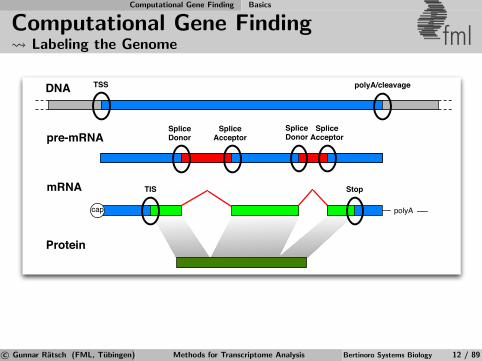
Computational Gene Finding Labeling the Genome fml
DNA
pre-mRNA
mRNA
Protein
polyAcap
TSS
SpliceDonor
SpliceAcceptor
SpliceDonor
SpliceAcceptor
TIS Stop
polyA/cleavage
c© Gunnar Ratsch (FML, Tubingen) Methods for Transcriptome Analysis Bertinoro Systems Biology 12 / 89
Computational Gene Finding Basics
Computational Gene Finding Labeling the Genome fml
DNA
pre-mRNA
mRNA
Protein
polyAcap
TSS Donor Acceptor Donor Acceptor
TIS Stop
polyA/cleavage
c© Gunnar Ratsch (FML, Tubingen) Methods for Transcriptome Analysis Bertinoro Systems Biology 12 / 89

Computational Gene Finding Basics
Computational Gene Finding Labeling the Genome fml
DNA
pre-mRNA
mRNA
Protein
polyAcap
TSS Donor Acceptor Donor Acceptor
TIS Stop
polyA/cleavage
TSS TIS cleaveStop
Don Acc
c© Gunnar Ratsch (FML, Tubingen) Methods for Transcriptome Analysis Bertinoro Systems Biology 12 / 89
Computational Gene Finding Identification of Genomic Signals
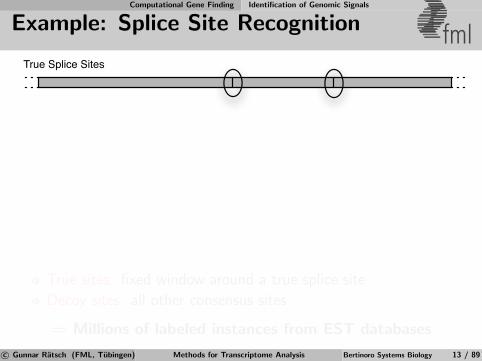
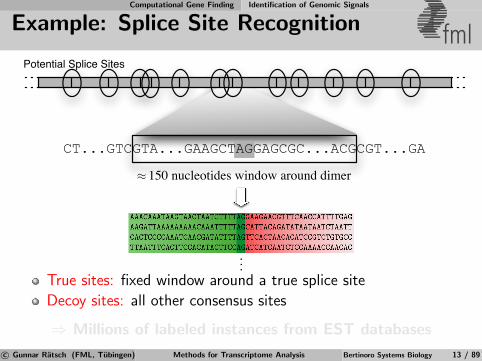
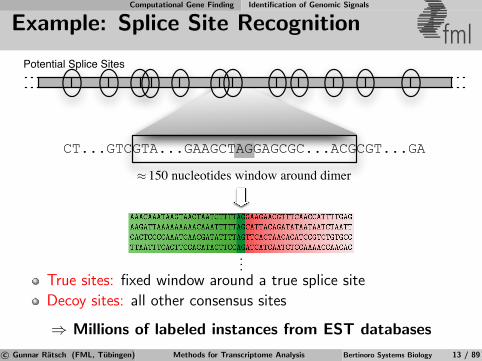
Example: Splice Site Recognition fmlTrue Splice Sites
True sites: fixed window around a true splice site
Decoy sites: all other consensus sites
⇒ Millions of labeled instances from EST databases
c© Gunnar Ratsch (FML, Tubingen) Methods for Transcriptome Analysis Bertinoro Systems Biology 13 / 89
Computational Gene Finding Identification of Genomic Signals
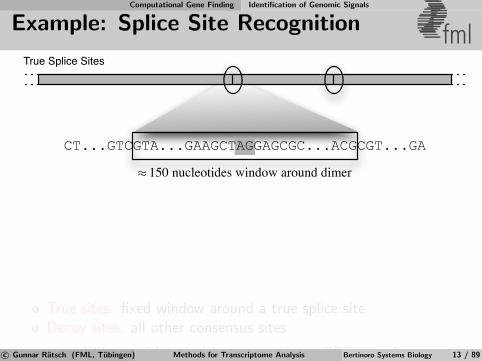
Example: Splice Site Recognition fml
CT...GTCGTA...GAAGCTAGGAGCGC...ACGCGT...GA
150 nucleotides window around dimer≈
True Splice Sites
True sites: fixed window around a true splice siteDecoy sites: all other consensus sites
⇒ Millions of labeled instances from EST databasesc© Gunnar Ratsch (FML, Tubingen) Methods for Transcriptome Analysis Bertinoro Systems Biology 13 / 89
Computational Gene Finding Identification of Genomic Signals
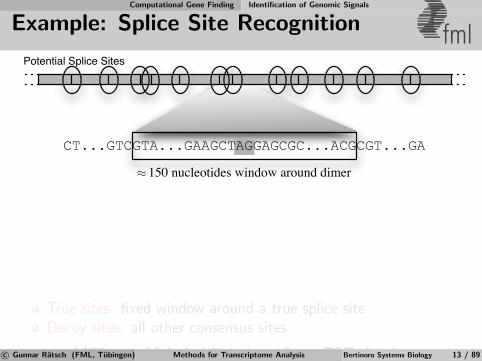
Example: Splice Site Recognition fml
CT...GTCGTA...GAAGCTAGGAGCGC...ACGCGT...GA
150 nucleotides window around dimer≈
Potential Splice Sites
True sites: fixed window around a true splice siteDecoy sites: all other consensus sites
⇒ Millions of labeled instances from EST databasesc© Gunnar Ratsch (FML, Tubingen) Methods for Transcriptome Analysis Bertinoro Systems Biology 13 / 89
Computational Gene Finding Identification of Genomic Signals
Example: Splice Site Recognition fml
CT...GTCGTA...GAAGCTAGGAGCGC...ACGCGT...GA
150 nucleotides window around dimer≈
Potential Splice Sites
...True sites: fixed window around a true splice site
Decoy sites: all other consensus sites
⇒ Millions of labeled instances from EST databases
c© Gunnar Ratsch (FML, Tubingen) Methods for Transcriptome Analysis Bertinoro Systems Biology 13 / 89
Computational Gene Finding Identification of Genomic Signals
Example: Splice Site Recognition fml
CT...GTCGTA...GAAGCTAGGAGCGC...ACGCGT...GA
150 nucleotides window around dimer≈
Potential Splice Sites
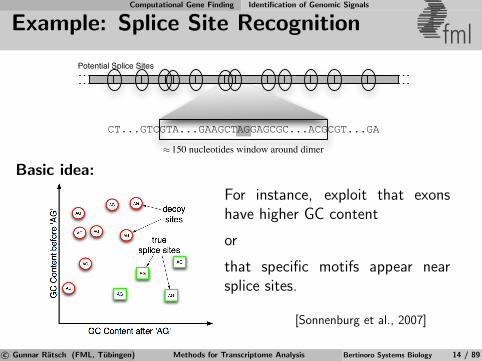
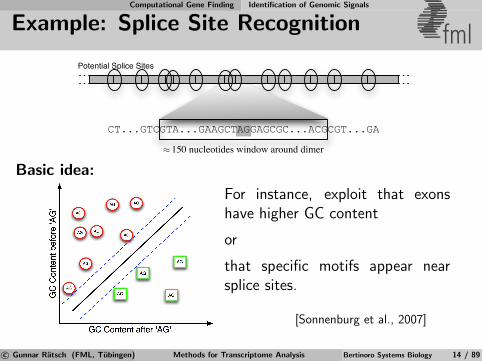
Basic idea:
For instance, exploit that exonshave higher GC content
or
that specific motifs appear nearsplice sites.
[Sonnenburg et al., 2007]
c© Gunnar Ratsch (FML, Tubingen) Methods for Transcriptome Analysis Bertinoro Systems Biology 14 / 89
Computational Gene Finding Identification of Genomic Signals
Example: Splice Site Recognition fml
CT...GTCGTA...GAAGCTAGGAGCGC...ACGCGT...GA
150 nucleotides window around dimer≈
Potential Splice Sites
Basic idea:
For instance, exploit that exonshave higher GC content
or
that specific motifs appear nearsplice sites.
[Sonnenburg et al., 2007]
c© Gunnar Ratsch (FML, Tubingen) Methods for Transcriptome Analysis Bertinoro Systems Biology 14 / 89

Computational Gene Finding Identification of Genomic Signals
Example: Splice Site Recognition fml
CT...GTCGTA...GAAGCTAGGAGCGC...ACGCGT...GA
150 nucleotides window around dimer≈
Potential Splice Sites
Basic idea:
In practice: Use one feature perpossible substring (e.g. ≤20) at allpositions
150·(41+. . .+420) ≈ 2·1014 features
[Sonnenburg et al., 2007]
c© Gunnar Ratsch (FML, Tubingen) Methods for Transcriptome Analysis Bertinoro Systems Biology 14 / 89
Computational Gene Finding Identification of Genomic Signals
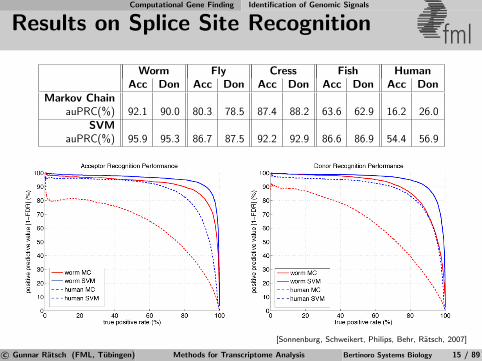
Results on Splice Site Recognition fmlWorm Fly Cress Fish Human
Acc Don Acc Don Acc Don Acc Don Acc DonMarkov Chain
auPRC(%) 92.1 90.0 80.3 78.5 87.4 88.2 63.6 62.9 16.2 26.0SVM
auPRC(%) 95.9 95.3 86.7 87.5 92.2 92.9 86.6 86.9 54.4 56.9
[Sonnenburg, Schweikert, Philips, Behr, Ratsch, 2007]
c© Gunnar Ratsch (FML, Tubingen) Methods for Transcriptome Analysis Bertinoro Systems Biology 15 / 89
Computational Gene Finding Identification of Genomic Signals
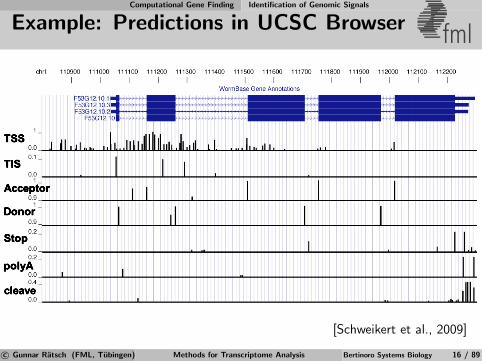
Example: Predictions in UCSC Browser fml
cleave
polyA
Stop
Acceptor
Donor
TIS
TSS
[Schweikert et al., 2009]
c© Gunnar Ratsch (FML, Tubingen) Methods for Transcriptome Analysis Bertinoro Systems Biology 16 / 89
Computational Gene Finding Identification of Genomic Signals
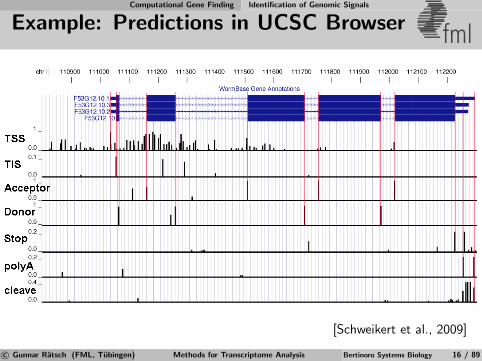
Example: Predictions in UCSC Browser fml
[Schweikert et al., 2009]
c© Gunnar Ratsch (FML, Tubingen) Methods for Transcriptome Analysis Bertinoro Systems Biology 16 / 89
Computational Gene Finding Identification of Genomic Signals
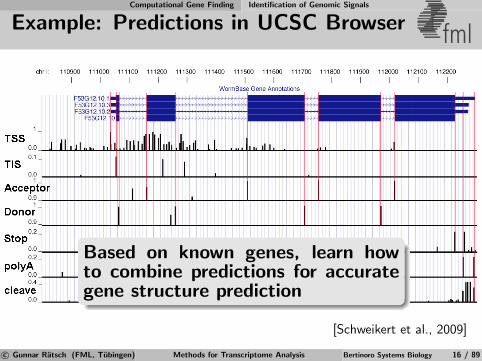
Example: Predictions in UCSC Browser fml
Based on known genes, learn howto combine predictions for accurategene structure prediction
[Schweikert et al., 2009]
c© Gunnar Ratsch (FML, Tubingen) Methods for Transcriptome Analysis Bertinoro Systems Biology 16 / 89

Computational Gene Finding Learning to Predict mRNA Transcripts
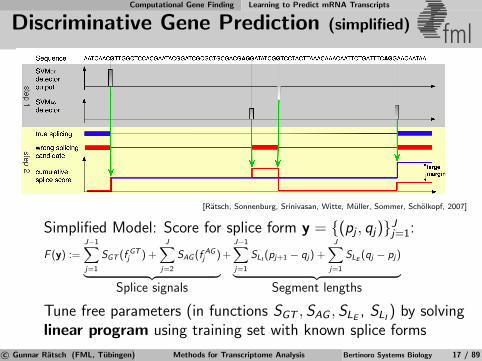
Discriminative Gene Prediction (simplified) fml
[Ratsch, Sonnenburg, Srinivasan, Witte, Muller, Sommer, Scholkopf, 2007]
Simplified Model: Score for splice form y = {(pj , qj)}Jj=1:
F (y) :=J−1∑j=1
SGT (f GTj ) +
J∑j=2
SAG (f AGj )︸ ︷︷ ︸
Splice signals
+J−1∑j=1
SLI(pj+1 − qj) +
J∑j=1
SLE(qj − pj)︸ ︷︷ ︸
Segment lengths
Tune free parameters (in functions SGT , SAG , SLE, SLI
) by solvinglinear program using training set with known splice forms
c© Gunnar Ratsch (FML, Tubingen) Methods for Transcriptome Analysis Bertinoro Systems Biology 17 / 89
Computational Gene Finding Learning to Predict mRNA Transcripts
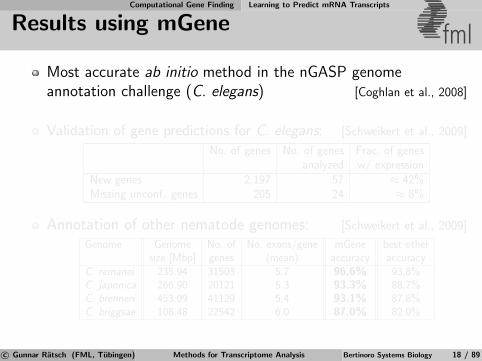
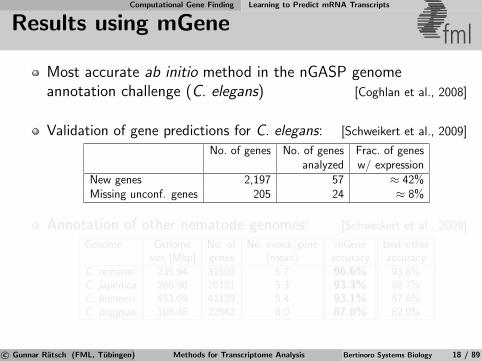
Results using mGene fmlMost accurate ab initio method in the nGASP genomeannotation challenge (C. elegans) [Coghlan et al., 2008]
Validation of gene predictions for C. elegans: [Schweikert et al., 2009]
No. of genes No. of genes Frac. of genesanalyzed w/ expression
New genes 2,197 57 ≈ 42%Missing unconf. genes 205 24 ≈ 8%
Annotation of other nematode genomes: [Schweikert et al., 2009]
Genome Genome No. of No. exons/gene mGene best othersize [Mbp] genes (mean) accuracy accuracy
C. remanei 235.94 31503 5.7 96.6% 93.8%C. japonica 266.90 20121 5.3 93.3% 88.7%C. brenneri 453.09 41129 5.4 93.1% 87.8%C. briggsae 108.48 22542 6.0 87.0% 82.0%
c© Gunnar Ratsch (FML, Tubingen) Methods for Transcriptome Analysis Bertinoro Systems Biology 18 / 89
Computational Gene Finding Learning to Predict mRNA Transcripts
Results using mGene fmlMost accurate ab initio method in the nGASP genomeannotation challenge (C. elegans) [Coghlan et al., 2008]
Validation of gene predictions for C. elegans: [Schweikert et al., 2009]
No. of genes No. of genes Frac. of genesanalyzed w/ expression
New genes 2,197 57 ≈ 42%Missing unconf. genes 205 24 ≈ 8%
Annotation of other nematode genomes: [Schweikert et al., 2009]
Genome Genome No. of No. exons/gene mGene best othersize [Mbp] genes (mean) accuracy accuracy
C. remanei 235.94 31503 5.7 96.6% 93.8%C. japonica 266.90 20121 5.3 93.3% 88.7%C. brenneri 453.09 41129 5.4 93.1% 87.8%C. briggsae 108.48 22542 6.0 87.0% 82.0%
c© Gunnar Ratsch (FML, Tubingen) Methods for Transcriptome Analysis Bertinoro Systems Biology 18 / 89
Computational Gene Finding Learning to Predict mRNA Transcripts
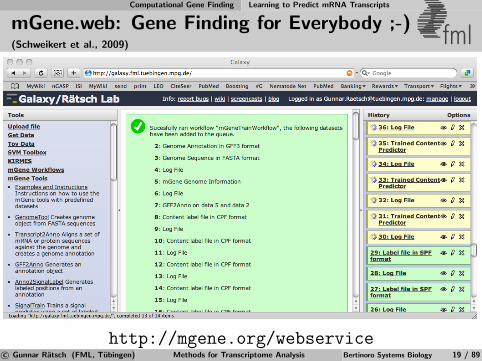
mGene.web: Gene Finding for Everybody ;-)(Schweikert et al., 2009) fml
http://mgene.org/webservicec© Gunnar Ratsch (FML, Tubingen) Methods for Transcriptome Analysis Bertinoro Systems Biology 19 / 89
Computational Gene Finding Learning to Predict mRNA Transcripts
Limitations/Extensions fml
Gene finding accuracy still far from perfect
Misses genes, predicts incorrect gene models
Does not (yet) predict alternative transcripts
Cannot predict when transcripts areexpressed/modified/degraded. . .
Need experimental data for condition specific transcriptomes.
Then we can learn to predict (hopefully).
c© Gunnar Ratsch (FML, Tubingen) Methods for Transcriptome Analysis Bertinoro Systems Biology 20 / 89

Roadmap fml1 Computational Gene Finding
Identification of Genomic SignalsLearning to Predict mRNA Transcripts
2 Whole-genome Tiling ArraysTechnology and LimitationsIdentification of Expression DifferencesDe Novo Transcript Discovery
3 Next-generation SequencingTechnology & LimitationsAssembly & Read Mapping
4 ExtensionsQuantification of TranscriptsChIP-on-Chip Studies
c© Gunnar Ratsch (FML, Tubingen) Methods for Transcriptome Analysis Bertinoro Systems Biology 21 / 89
Whole-genome Tiling Arrays
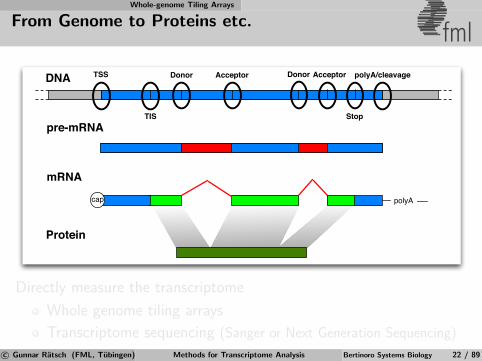
From Genome to Proteins etc. fml
DNA
pre-mRNA
mRNA
Protein
polyAcap
TSS Donor Acceptor Donor Acceptor
TIS Stop
polyA/cleavage
Directly measure the transcriptome
Whole genome tiling arrays
Transcriptome sequencing (Sanger or Next Generation Sequencing)
c© Gunnar Ratsch (FML, Tubingen) Methods for Transcriptome Analysis Bertinoro Systems Biology 22 / 89
Whole-genome Tiling Arrays
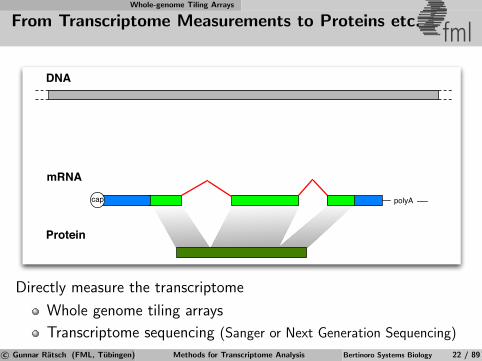
From Transcriptome Measurements to Proteins etc. fml
mRNA
Protein
polyAcap
DNA
Directly measure the transcriptome
Whole genome tiling arrays
Transcriptome sequencing (Sanger or Next Generation Sequencing)
c© Gunnar Ratsch (FML, Tubingen) Methods for Transcriptome Analysis Bertinoro Systems Biology 22 / 89
Whole-genome Tiling Arrays Technology and Limitations
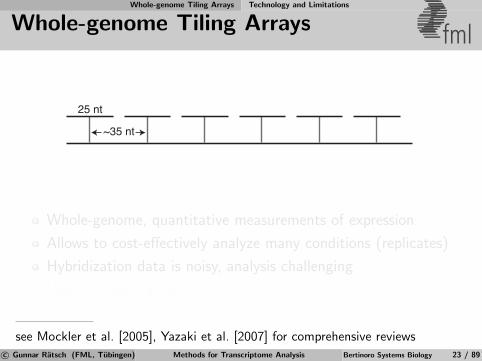
Whole-genome Tiling Arrays fml
25 nt
~35 nt
Whole-genome, quantitative measurements of expression
Allows to cost-effectively analyze many conditions (replicates)
Hybridization data is noisy, analysis challenging
Variants: exon arrays, exon junction arrays
see Mockler et al. [2005], Yazaki et al. [2007] for comprehensive reviewsc© Gunnar Ratsch (FML, Tubingen) Methods for Transcriptome Analysis Bertinoro Systems Biology 23 / 89

Whole-genome Tiling Arrays Technology and Limitations
Whole-genome Tiling Arrays fml
Hybridization intensity
Hybridizing RNA transcript
25 nt
~35 nt
. . .
. . .
. . .
. . .
. . .
. . .
. . .
. . .
. . .
. . .
. . .
. . .
. . .
. . .
. . .
. . .
. . .
. . .
. . .
. . .
Whole-genome, quantitative measurements of expression
Allows to cost-effectively analyze many conditions (replicates)
Hybridization data is noisy, analysis challenging
Variants: exon arrays, exon junction arrays
see Mockler et al. [2005], Yazaki et al. [2007] for comprehensive reviewsc© Gunnar Ratsch (FML, Tubingen) Methods for Transcriptome Analysis Bertinoro Systems Biology 23 / 89
Whole-genome Tiling Arrays Technology and Limitations
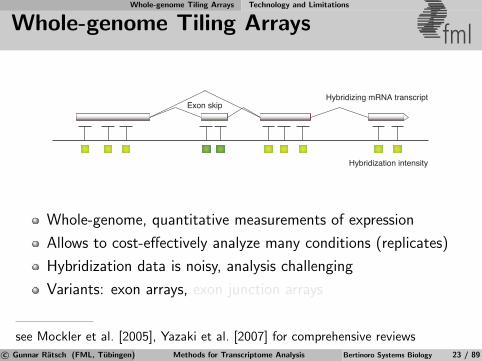
Whole-genome Tiling Arrays fml
Hybridization intensity
Hybridizing mRNA transcriptExon skip
Whole-genome, quantitative measurements of expression
Allows to cost-effectively analyze many conditions (replicates)
Hybridization data is noisy, analysis challenging
Variants: exon arrays, exon junction arrays
see Mockler et al. [2005], Yazaki et al. [2007] for comprehensive reviewsc© Gunnar Ratsch (FML, Tubingen) Methods for Transcriptome Analysis Bertinoro Systems Biology 23 / 89
Whole-genome Tiling Arrays Technology and Limitations
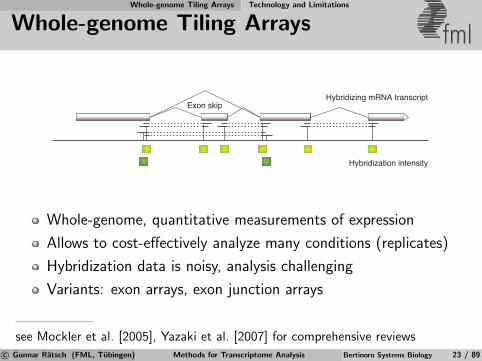
Whole-genome Tiling Arrays fml
Hybridization intensity
Hybridizing mRNA transcriptExon skip
Whole-genome, quantitative measurements of expression
Allows to cost-effectively analyze many conditions (replicates)
Hybridization data is noisy, analysis challenging
Variants: exon arrays, exon junction arrays
see Mockler et al. [2005], Yazaki et al. [2007] for comprehensive reviewsc© Gunnar Ratsch (FML, Tubingen) Methods for Transcriptome Analysis Bertinoro Systems Biology 23 / 89
Whole-genome Tiling Arrays Technology and Limitations
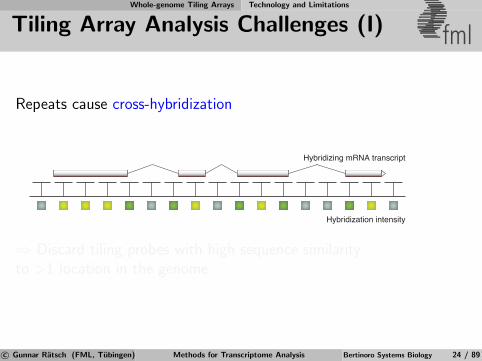
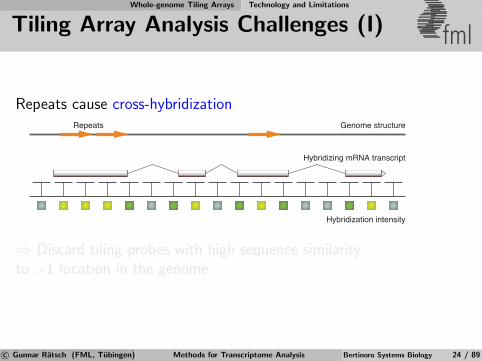
Tiling Array Analysis Challenges (I) fml
Repeats cause cross-hybridization
Hybridization intensity
Hybridizing mRNA transcript
⇒ Discard tiling probes with high sequence similarityto >1 location in the genome
c© Gunnar Ratsch (FML, Tubingen) Methods for Transcriptome Analysis Bertinoro Systems Biology 24 / 89
Whole-genome Tiling Arrays Technology and Limitations
Tiling Array Analysis Challenges (I) fml
Repeats cause cross-hybridization
Hybridization intensity
Hybridizing mRNA transcript
Genome structureRepeats
⇒ Discard tiling probes with high sequence similarityto >1 location in the genome
c© Gunnar Ratsch (FML, Tubingen) Methods for Transcriptome Analysis Bertinoro Systems Biology 24 / 89
Whole-genome Tiling Arrays Technology and Limitations
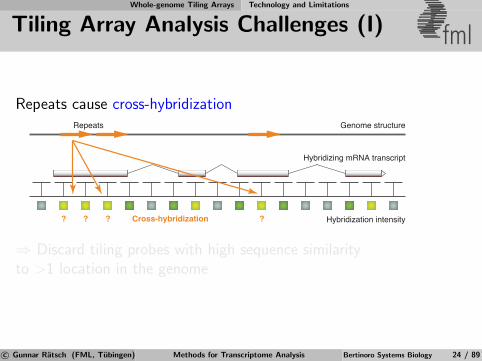
Tiling Array Analysis Challenges (I) fml
Repeats cause cross-hybridization
Hybridization intensity
Hybridizing mRNA transcript
? ???
Genome structureRepeats
Cross-hybridization
⇒ Discard tiling probes with high sequence similarityto >1 location in the genome
c© Gunnar Ratsch (FML, Tubingen) Methods for Transcriptome Analysis Bertinoro Systems Biology 24 / 89
Whole-genome Tiling Arrays Technology and Limitations
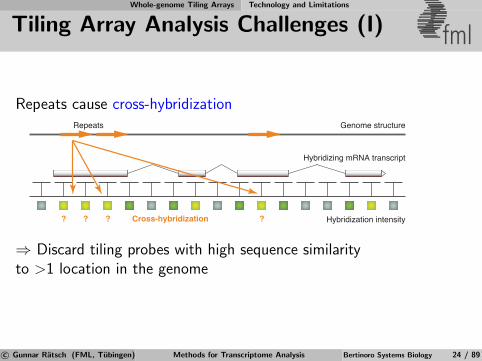
Tiling Array Analysis Challenges (I) fml
Repeats cause cross-hybridization
Hybridization intensity
Hybridizing mRNA transcript
? ???
Genome structureRepeats
Cross-hybridization
⇒ Discard tiling probes with high sequence similarityto >1 location in the genome
c© Gunnar Ratsch (FML, Tubingen) Methods for Transcriptome Analysis Bertinoro Systems Biology 24 / 89
Whole-genome Tiling Arrays Technology and Limitations
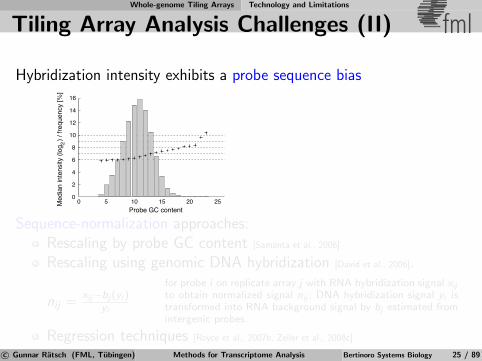
Tiling Array Analysis Challenges (II) fml
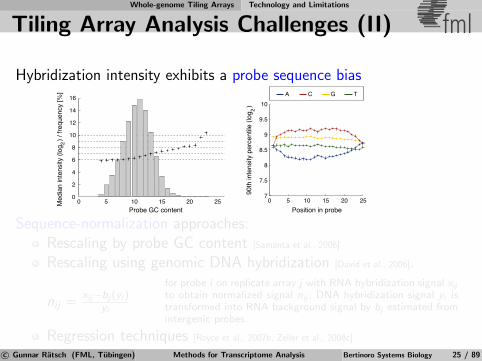
Hybridization intensity exhibits a probe sequence bias
Probe GC content0 5 10 15 20 25
0
2
4
6
8
10
12
14
16
Med
ian
inte
nsity
(log
) /
frequ
ency
[%]
2
Sequence-normalization approaches:Rescaling by probe GC content [Samanta et al., 2006]
Rescaling using genomic DNA hybridization [David et al., 2006].
nij =xij−bj (yi )
yi
for probe i on replicate array j with RNA hybridization signal xij
to obtain normalized signal nij ; DNA hybridization signal yi istransformed into RNA background signal by bj estimated fromintergenic probes.
Regression techniques [Royce et al., 2007b, Zeller et al., 2008c]
c© Gunnar Ratsch (FML, Tubingen) Methods for Transcriptome Analysis Bertinoro Systems Biology 25 / 89
Whole-genome Tiling Arrays Technology and Limitations
Tiling Array Analysis Challenges (II) fml
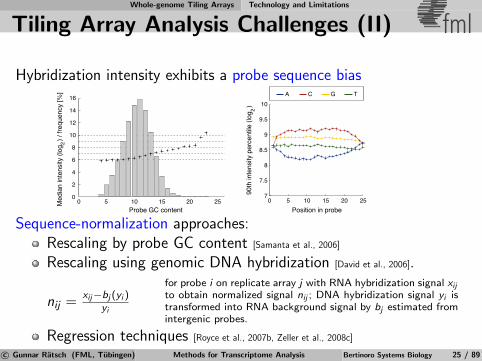
Hybridization intensity exhibits a probe sequence bias
Probe GC content0 5 10 15 20 25
0
2
4
6
8
10
12
14
16
Med
ian
inte
nsity
(log
) /
frequ
ency
[%]
2
A C G T
0 5 10 15 20 25Position in probe
7
7.5
8
8.5
9
9.5
10
90th
inte
nsity
per
cent
ile (l
og ) 2
Sequence-normalization approaches:Rescaling by probe GC content [Samanta et al., 2006]
Rescaling using genomic DNA hybridization [David et al., 2006].
nij =xij−bj (yi )
yi
for probe i on replicate array j with RNA hybridization signal xij
to obtain normalized signal nij ; DNA hybridization signal yi istransformed into RNA background signal by bj estimated fromintergenic probes.
Regression techniques [Royce et al., 2007b, Zeller et al., 2008c]
c© Gunnar Ratsch (FML, Tubingen) Methods for Transcriptome Analysis Bertinoro Systems Biology 25 / 89
Whole-genome Tiling Arrays Technology and Limitations
Tiling Array Analysis Challenges (II) fml
Hybridization intensity exhibits a probe sequence bias
Probe GC content0 5 10 15 20 25
0
2
4
6
8
10
12
14
16
Med
ian
inte
nsity
(log
) /
frequ
ency
[%]
2
A C G T
0 5 10 15 20 25Position in probe
7
7.5
8
8.5
9
9.5
10
90th
inte
nsity
per
cent
ile (l
og ) 2
Sequence-normalization approaches:Rescaling by probe GC content [Samanta et al., 2006]
Rescaling using genomic DNA hybridization [David et al., 2006].
nij =xij−bj (yi )
yi
for probe i on replicate array j with RNA hybridization signal xij
to obtain normalized signal nij ; DNA hybridization signal yi istransformed into RNA background signal by bj estimated fromintergenic probes.
Regression techniques [Royce et al., 2007b, Zeller et al., 2008c]
c© Gunnar Ratsch (FML, Tubingen) Methods for Transcriptome Analysis Bertinoro Systems Biology 25 / 89
Whole-genome Tiling Arrays Technology and Limitations
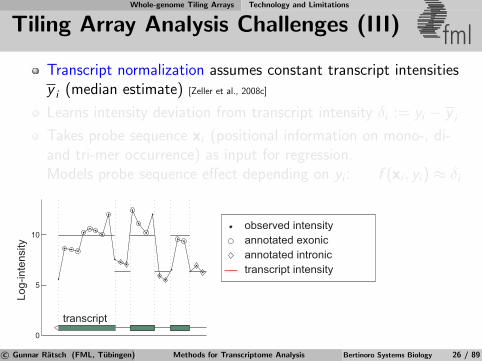
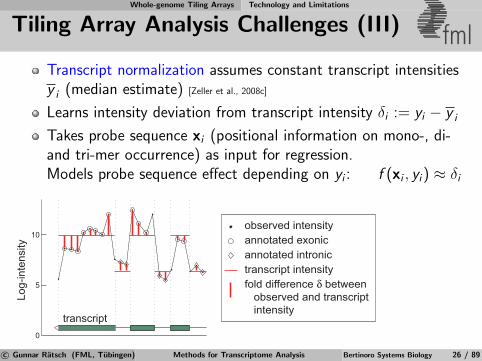
Tiling Array Analysis Challenges (III) fmlTranscript normalization assumes constant transcript intensitiesy i (median estimate) [Zeller et al., 2008c]
Learns intensity deviation from transcript intensity δi := yi − y i
Takes probe sequence xi (positional information on mono-, di-and tri-mer occurrence) as input for regression.Models probe sequence effect depending on yi : f (xi , yi) ≈ δi
0
5
10
Log-
inte
nsity
transcript
transcript intensity
observed intensityannotated exonicannotated intronic
c© Gunnar Ratsch (FML, Tubingen) Methods for Transcriptome Analysis Bertinoro Systems Biology 26 / 89
Whole-genome Tiling Arrays Technology and Limitations
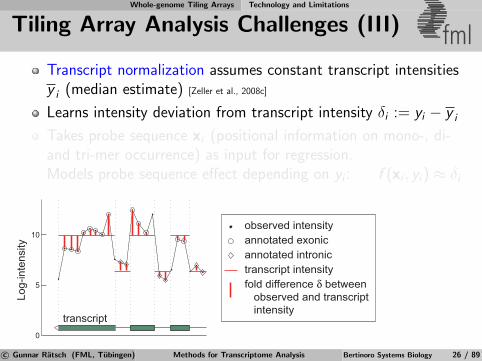
Tiling Array Analysis Challenges (III) fmlTranscript normalization assumes constant transcript intensitiesy i (median estimate) [Zeller et al., 2008c]
Learns intensity deviation from transcript intensity δi := yi − y i
Takes probe sequence xi (positional information on mono-, di-and tri-mer occurrence) as input for regression.Models probe sequence effect depending on yi : f (xi , yi) ≈ δi
0
5
10
Log-
inte
nsity
transcript
transcript intensityfold difference δ between observed and transcript intensity
observed intensityannotated exonicannotated intronic
c© Gunnar Ratsch (FML, Tubingen) Methods for Transcriptome Analysis Bertinoro Systems Biology 26 / 89
Whole-genome Tiling Arrays Technology and Limitations
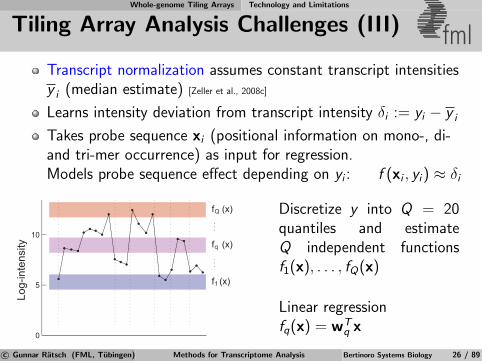
Tiling Array Analysis Challenges (III) fmlTranscript normalization assumes constant transcript intensitiesy i (median estimate) [Zeller et al., 2008c]
Learns intensity deviation from transcript intensity δi := yi − y i
Takes probe sequence xi (positional information on mono-, di-and tri-mer occurrence) as input for regression.Models probe sequence effect depending on yi : f (xi , yi) ≈ δi
0
5
10
Log-
inte
nsity
f (x)1
f (x)q
f (x)Q. .
.. .
.Discretize y into Q = 20quantiles and estimateQ independent functionsf1(x), . . . , fQ(x)
Linear regressionfq(x) = wT
q x
c© Gunnar Ratsch (FML, Tubingen) Methods for Transcriptome Analysis Bertinoro Systems Biology 26 / 89
Whole-genome Tiling Arrays Identification of Expression Differences
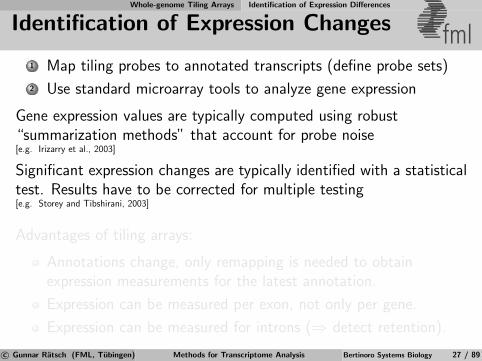
Identification of Expression Changes fml1 Map tiling probes to annotated transcripts (define probe sets)
2 Use standard microarray tools to analyze gene expression
Gene expression values are typically computed using robust“summarization methods” that account for probe noise[e.g. Irizarry et al., 2003]
Significant expression changes are typically identified with a statisticaltest. Results have to be corrected for multiple testing[e.g. Storey and Tibshirani, 2003]
Advantages of tiling arrays:
Annotations change, only remapping is needed to obtainexpression measurements for the latest annotation.
Expression can be measured per exon, not only per gene.
Expression can be measured for introns (⇒ detect retention).
c© Gunnar Ratsch (FML, Tubingen) Methods for Transcriptome Analysis Bertinoro Systems Biology 27 / 89
Whole-genome Tiling Arrays Identification of Expression Differences
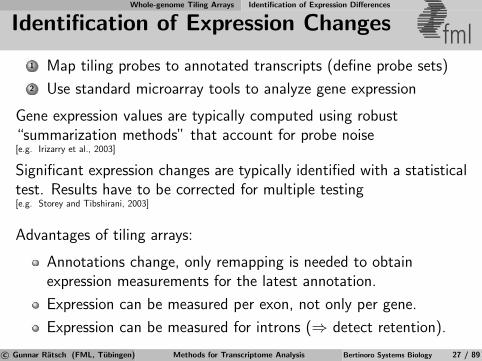
Identification of Expression Changes fml1 Map tiling probes to annotated transcripts (define probe sets)
2 Use standard microarray tools to analyze gene expression
Gene expression values are typically computed using robust“summarization methods” that account for probe noise[e.g. Irizarry et al., 2003]
Significant expression changes are typically identified with a statisticaltest. Results have to be corrected for multiple testing[e.g. Storey and Tibshirani, 2003]
Advantages of tiling arrays:
Annotations change, only remapping is needed to obtainexpression measurements for the latest annotation.
Expression can be measured per exon, not only per gene.
Expression can be measured for introns (⇒ detect retention).
c© Gunnar Ratsch (FML, Tubingen) Methods for Transcriptome Analysis Bertinoro Systems Biology 27 / 89
Whole-genome Tiling Arrays Identification of Expression Differences
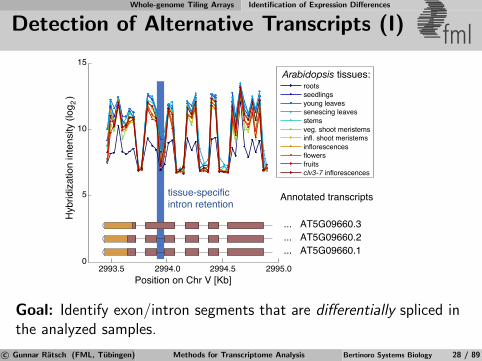
Detection of Alternative Transcripts (I) fml
2993.5 2994.0 2994.5 2995.00
5
10
15
... AT5G09660.1
... AT5G09660.2
... AT5G09660.3
rootsseedlingsyoung leavessenescing leavesstemsveg. shoot meristemsinfl. shoot meristemsinflorescencesflowersfruitsclv3-7 inflorescences
Position on Chr V [Kb]
Hyb
ridiz
atio
n in
tens
ity (l
og ) 2
tissue-specificintron retention
Annotated transcripts
Arabidopsis tissues:
Goal: Identify exon/intron segments that are differentially spliced inthe analyzed samples.
c© Gunnar Ratsch (FML, Tubingen) Methods for Transcriptome Analysis Bertinoro Systems Biology 28 / 89

Whole-genome Tiling Arrays Identification of Expression Differences
Detection of Alternative Transcripts (II) fml
6719.5 6720 6720.5 6721 6721.5
... AT4G10970.1
... EST-based isoform
Position on Chr IV [Kb]
5
10
15H
ybrid
izat
ion
inte
nsity
(log
) 2
rootsseedlingsyoung leavessenescing leavesstemsveg. shoot meristemsinfl. shoot meristemsinflorescencesflowersfruitsclv3-7 inflorescences
Arabidopsis tissues:
partialintron retention Annotated transcripts
Goal: Identify exon/intron segments that show different intensitiesthan other exons/introns in at least one analyzed sample.
c© Gunnar Ratsch (FML, Tubingen) Methods for Transcriptome Analysis Bertinoro Systems Biology 29 / 89

Whole-genome Tiling Arrays Identification of Expression Differences
Detecting Alternative Exons fml
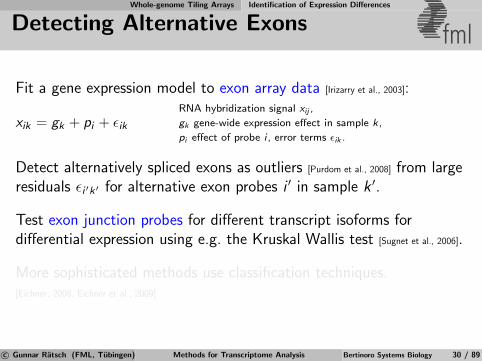
Fit a gene expression model to exon array data [Irizarry et al., 2003]:
xik = gk + pi + εikRNA hybridization signal xij ,
gk gene-wide expression effect in sample k,
pi effect of probe i , error terms εik .
Detect alternatively spliced exons as outliers [Purdom et al., 2008] from largeresiduals εi ′k ′ for alternative exon probes i ′ in sample k ′.
Test exon junction probes for different transcript isoforms fordifferential expression using e.g. the Kruskal Wallis test [Sugnet et al., 2006].
More sophisticated methods use classification techniques.[Eichner, 2008, Eichner et al., 2009]
c© Gunnar Ratsch (FML, Tubingen) Methods for Transcriptome Analysis Bertinoro Systems Biology 30 / 89
Whole-genome Tiling Arrays Identification of Expression Differences
Detecting Alternative Exons fml
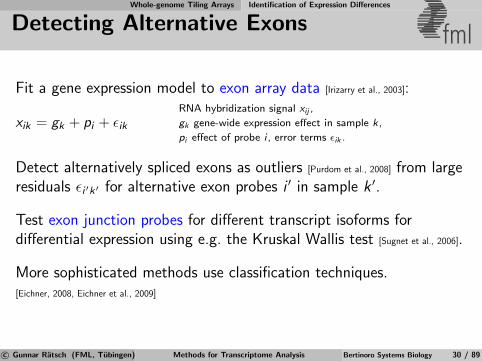
Fit a gene expression model to exon array data [Irizarry et al., 2003]:
xik = gk + pi + εikRNA hybridization signal xij ,
gk gene-wide expression effect in sample k,
pi effect of probe i , error terms εik .
Detect alternatively spliced exons as outliers [Purdom et al., 2008] from largeresiduals εi ′k ′ for alternative exon probes i ′ in sample k ′.
Test exon junction probes for different transcript isoforms fordifferential expression using e.g. the Kruskal Wallis test [Sugnet et al., 2006].
More sophisticated methods use classification techniques.[Eichner, 2008, Eichner et al., 2009]
c© Gunnar Ratsch (FML, Tubingen) Methods for Transcriptome Analysis Bertinoro Systems Biology 30 / 89
Whole-genome Tiling Arrays De Novo Transcript Discovery
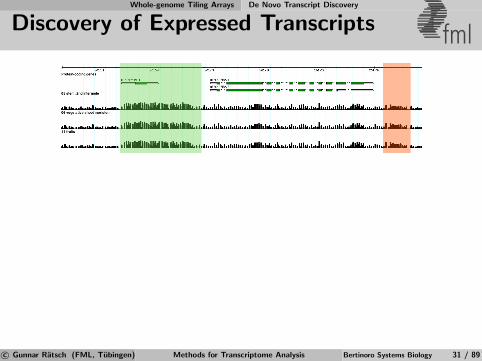
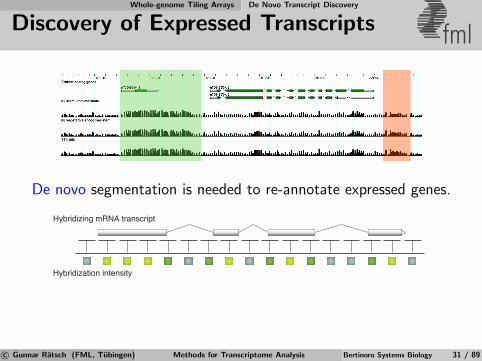
Discovery of Expressed Transcripts fml
De novo transcript identification is needed to re-annotate expressedgenes.
c© Gunnar Ratsch (FML, Tubingen) Methods for Transcriptome Analysis Bertinoro Systems Biology 31 / 89
Whole-genome Tiling Arrays De Novo Transcript Discovery
Discovery of Expressed Transcripts fml
De novo segmentation is needed to re-annotate expressed genes.
Hybridization intensity
Hybridizing mRNA transcript
c© Gunnar Ratsch (FML, Tubingen) Methods for Transcriptome Analysis Bertinoro Systems Biology 31 / 89
Whole-genome Tiling Arrays De Novo Transcript Discovery
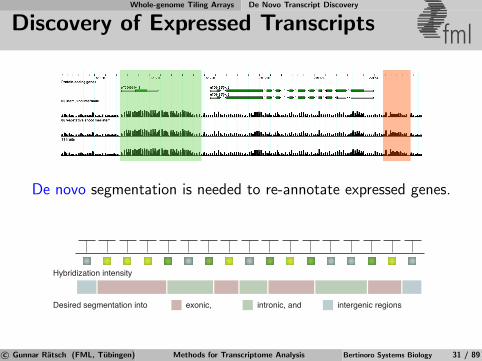
Discovery of Expressed Transcripts fml
De novo segmentation is needed to re-annotate expressed genes.
Hybridization intensity
Desired segmentation into intergenic regionsintronic, andexonic,
c© Gunnar Ratsch (FML, Tubingen) Methods for Transcriptome Analysis Bertinoro Systems Biology 31 / 89
Whole-genome Tiling Arrays De Novo Transcript Discovery
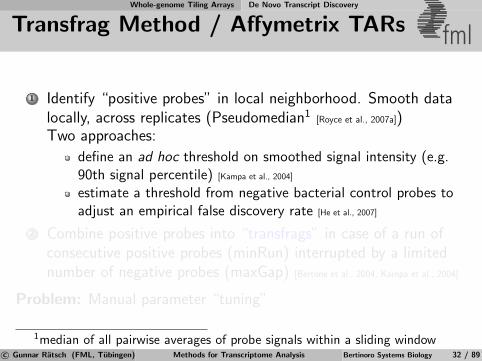
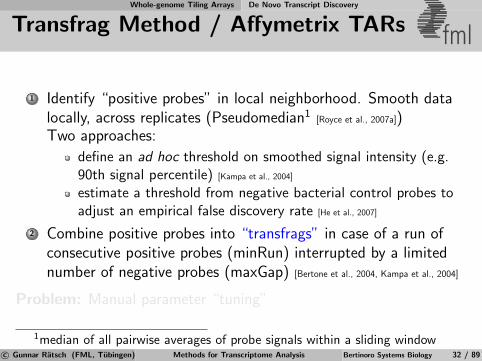
Transfrag Method / Affymetrix TARs fml
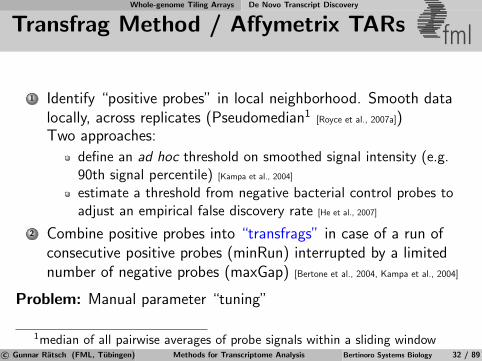
1 Identify “positive probes” in local neighborhood. Smooth datalocally, across replicates (Pseudomedian1
[Royce et al., 2007a])Two approaches:
define an ad hoc threshold on smoothed signal intensity (e.g.90th signal percentile) [Kampa et al., 2004]
estimate a threshold from negative bacterial control probes toadjust an empirical false discovery rate [He et al., 2007]
2 Combine positive probes into “transfrags” in case of a run ofconsecutive positive probes (minRun) interrupted by a limitednumber of negative probes (maxGap) [Bertone et al., 2004, Kampa et al., 2004]
Problem: Manual parameter “tuning”
1median of all pairwise averages of probe signals within a sliding windowc© Gunnar Ratsch (FML, Tubingen) Methods for Transcriptome Analysis Bertinoro Systems Biology 32 / 89
Whole-genome Tiling Arrays De Novo Transcript Discovery
Transfrag Method / Affymetrix TARs fml
1 Identify “positive probes” in local neighborhood. Smooth datalocally, across replicates (Pseudomedian1
[Royce et al., 2007a])Two approaches:
define an ad hoc threshold on smoothed signal intensity (e.g.90th signal percentile) [Kampa et al., 2004]
estimate a threshold from negative bacterial control probes toadjust an empirical false discovery rate [He et al., 2007]
2 Combine positive probes into “transfrags” in case of a run ofconsecutive positive probes (minRun) interrupted by a limitednumber of negative probes (maxGap) [Bertone et al., 2004, Kampa et al., 2004]
Problem: Manual parameter “tuning”
1median of all pairwise averages of probe signals within a sliding windowc© Gunnar Ratsch (FML, Tubingen) Methods for Transcriptome Analysis Bertinoro Systems Biology 32 / 89
Whole-genome Tiling Arrays De Novo Transcript Discovery
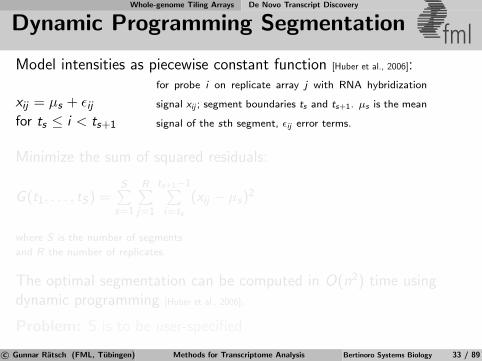
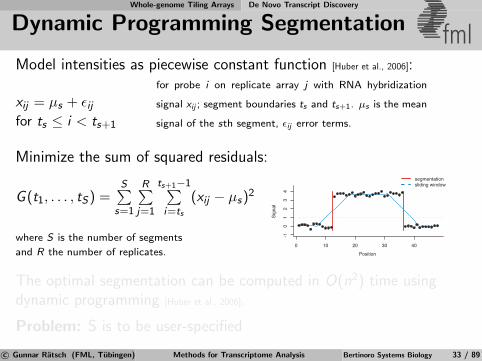
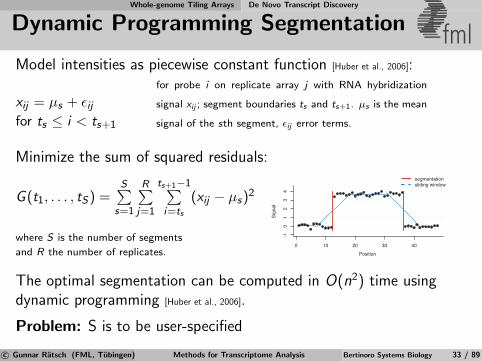
Dynamic Programming Segmentation fmlModel intensities as piecewise constant function [Huber et al., 2006]:
xij = µs + εijfor ts ≤ i < ts+1
for probe i on replicate array j with RNA hybridization
signal xij ; segment boundaries ts and ts+1. µs is the mean
signal of the sth segment, εij error terms.
Minimize the sum of squared residuals:
G (t1, . . . , tS) =S∑
s=1
R∑j=1
ts+1−1∑i=ts
(xij − µs)2
where S is the number of segments
and R the number of replicates.
0 10 20 30 40
-10
12
34
Position
Sign
al
segmentationsliding window
The optimal segmentation can be computed in O(n2) time usingdynamic programming [Huber et al., 2006].
Problem: S is to be user-specified
c© Gunnar Ratsch (FML, Tubingen) Methods for Transcriptome Analysis Bertinoro Systems Biology 33 / 89
Whole-genome Tiling Arrays De Novo Transcript Discovery
Dynamic Programming Segmentation fmlModel intensities as piecewise constant function [Huber et al., 2006]:
xij = µs + εijfor ts ≤ i < ts+1
for probe i on replicate array j with RNA hybridization
signal xij ; segment boundaries ts and ts+1. µs is the mean
signal of the sth segment, εij error terms.
Minimize the sum of squared residuals:
G (t1, . . . , tS) =S∑
s=1
R∑j=1
ts+1−1∑i=ts
(xij − µs)2
where S is the number of segments
and R the number of replicates.0 10 20 30 40
-10
12
34
Position
Sign
al
segmentationsliding window
The optimal segmentation can be computed in O(n2) time usingdynamic programming [Huber et al., 2006].
Problem: S is to be user-specified
c© Gunnar Ratsch (FML, Tubingen) Methods for Transcriptome Analysis Bertinoro Systems Biology 33 / 89
Whole-genome Tiling Arrays De Novo Transcript Discovery
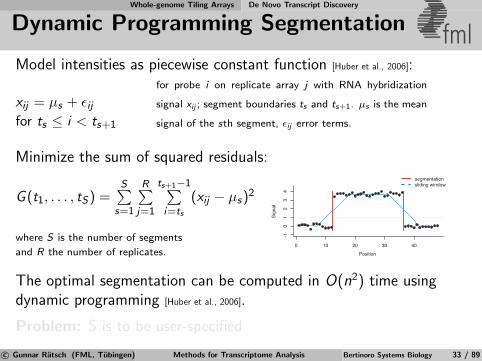
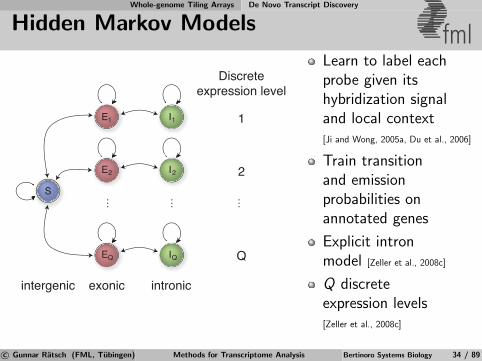
Hidden Markov Models fml
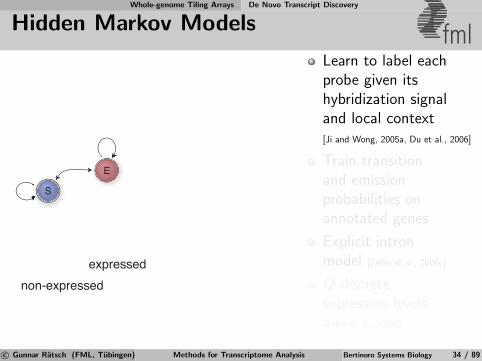
non-expressedexpressed
S
E
Learn to label eachprobe given itshybridization signaland local context[Ji and Wong, 2005a, Du et al., 2006]
Train transitionand emissionprobabilities onannotated genes
Explicit intronmodel [Zeller et al., 2008c]
Q discreteexpression levels[Zeller et al., 2008c]
c© Gunnar Ratsch (FML, Tubingen) Methods for Transcriptome Analysis Bertinoro Systems Biology 34 / 89
Whole-genome Tiling Arrays De Novo Transcript Discovery
Hidden Markov Models fml
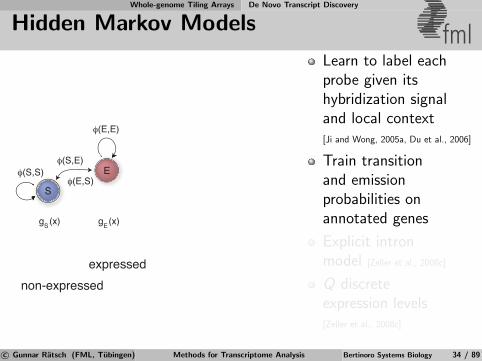
non-expressedexpressed
S
E
φ(E,E)
φ(S,S)φ(S,E)
φ(E,S)
g (x) g (x)S E
Learn to label eachprobe given itshybridization signaland local context[Ji and Wong, 2005a, Du et al., 2006]
Train transitionand emissionprobabilities onannotated genes
Explicit intronmodel [Zeller et al., 2008c]
Q discreteexpression levels[Zeller et al., 2008c]
c© Gunnar Ratsch (FML, Tubingen) Methods for Transcriptome Analysis Bertinoro Systems Biology 34 / 89
Whole-genome Tiling Arrays De Novo Transcript Discovery
Hidden Markov Models fml
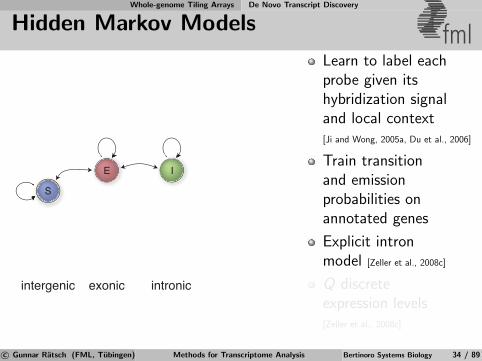
intergenic exonic intronic
S
E I
Learn to label eachprobe given itshybridization signaland local context[Ji and Wong, 2005a, Du et al., 2006]
Train transitionand emissionprobabilities onannotated genes
Explicit intronmodel [Zeller et al., 2008c]
Q discreteexpression levels[Zeller et al., 2008c]
c© Gunnar Ratsch (FML, Tubingen) Methods for Transcriptome Analysis Bertinoro Systems Biology 34 / 89
Whole-genome Tiling Arrays De Novo Transcript Discovery
Hidden Markov Models fml
. . .
. . .
Discreteexpression level
1
2
Q
. . .
intergenic exonic intronic
S
EQ
E2
E1
IQ
I2
I1
Learn to label eachprobe given itshybridization signaland local context[Ji and Wong, 2005a, Du et al., 2006]
Train transitionand emissionprobabilities onannotated genes
Explicit intronmodel [Zeller et al., 2008c]
Q discreteexpression levels[Zeller et al., 2008c]
c© Gunnar Ratsch (FML, Tubingen) Methods for Transcriptome Analysis Bertinoro Systems Biology 34 / 89
Whole-genome Tiling Arrays De Novo Transcript Discovery
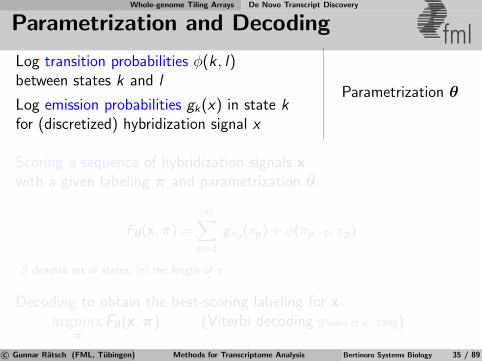
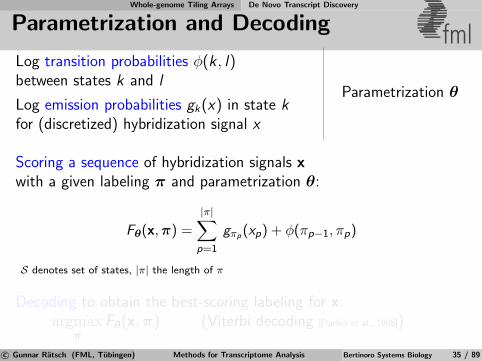
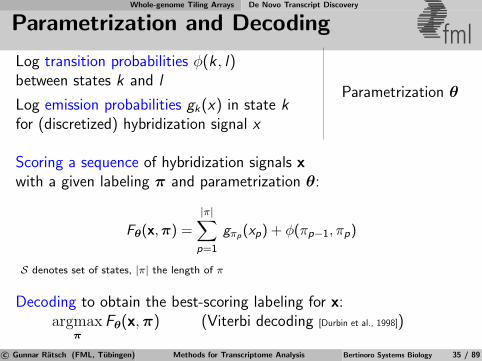
Parametrization and Decoding fmlLog transition probabilities φ(k , l)between states k and l
Log emission probabilities gk(x) in state kfor (discretized) hybridization signal x
Parametrization θ
Scoring a sequence of hybridization signals xwith a given labeling π and parametrization θ:
Fθ(x,π) =
|π|∑p=1
gπp(xp) + φ(πp−1, πp)
S denotes set of states, |π| the length of π
Decoding to obtain the best-scoring labeling for x:argmax
πFθ(x, π) (Viterbi decoding [Durbin et al., 1998])
c© Gunnar Ratsch (FML, Tubingen) Methods for Transcriptome Analysis Bertinoro Systems Biology 35 / 89
Whole-genome Tiling Arrays De Novo Transcript Discovery
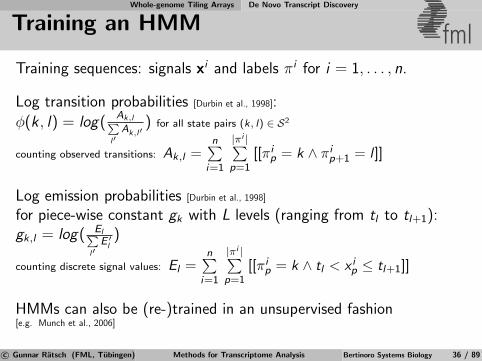
Training an HMM fmlTraining sequences: signals xi and labels πi for i = 1, . . . , n.
Log transition probabilities [Durbin et al., 1998]:
φ(k , l) = log(Ak,lP
l′Ak,l′
) for all state pairs (k, l) ∈ S2
counting observed transitions: Ak,l =n∑
i=1
|πi |∑p=1
[[πip = k ∧ πi
p+1 = l ]]
Log emission probabilities [Durbin et al., 1998]
for piece-wise constant gk with L levels (ranging from tl to tl+1):gk,l = log( ElP
l′E ′l
)
counting discrete signal values: El =n∑
i=1
|πi |∑p=1
[[πip = k ∧ tl < x i
p ≤ tl+1]]
HMMs can also be (re-)trained in an unsupervised fashion[e.g. Munch et al., 2006]
c© Gunnar Ratsch (FML, Tubingen) Methods for Transcriptome Analysis Bertinoro Systems Biology 36 / 89
Whole-genome Tiling Arrays De Novo Transcript Discovery
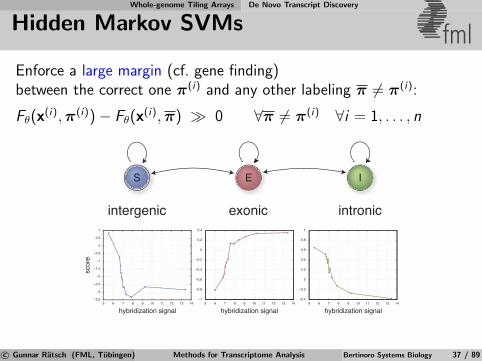
Hidden Markov SVMs fmlEnforce a large margin (cf. gene finding)between the correct one π(i) and any other labeling π 6= π(i):
Fθ(x(i), π(i))− Fθ(x(i), π) � 0 ∀π 6= π(i) ∀i = 1, . . . , n
intergenic exonic intronic
E I
0
0.2
0.4
0.6
0.8
1
5 6 7 8 9 10 11 12 13 14
hybridization signal
0
0.2
0.4
5 6 7 8 9 10 11 12 13 14
hybridization signal
0
0.5
1
scor
e
5 6 7 8 9 10 11 12 13 14
hybridization signal
S
c© Gunnar Ratsch (FML, Tubingen) Methods for Transcriptome Analysis Bertinoro Systems Biology 37 / 89

Whole-genome Tiling Arrays De Novo Transcript Discovery
Method Comparison fmlPr
ecis
ion
[%]
Recall [%]0 20 40 60 80 100
0
20
40
60
80
100
0 20 40 60 80 1000
20
40
60
80
100
Recall [%]
HMMHM-SVM
Transfrags
Recall: Proportion of annotated exons/introns covered by predictions.Precision: Proportion of predictions covered by annotated exons/introns.
c© Gunnar Ratsch (FML, Tubingen) Methods for Transcriptome Analysis Bertinoro Systems Biology 38 / 89
Whole-genome Tiling Arrays Differential TARs
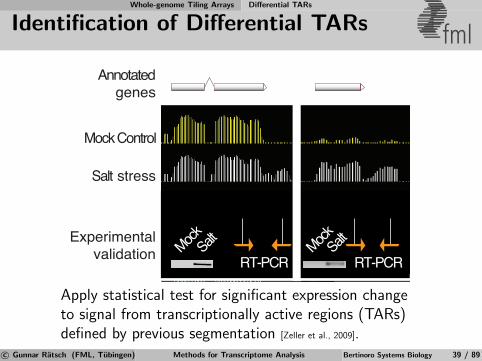
Identification of Differential TARs fml
Salt
MockSalt stress
Mock Control
Annotatedgenes
Figure 6Salt
Mock Salt
Mock
RT-PCRRT-PCRExperimental
validation
Apply statistical test for significant expression changeto signal from transcriptionally active regions (TARs)defined by previous segmentation [Zeller et al., 2009].
c© Gunnar Ratsch (FML, Tubingen) Methods for Transcriptome Analysis Bertinoro Systems Biology 39 / 89
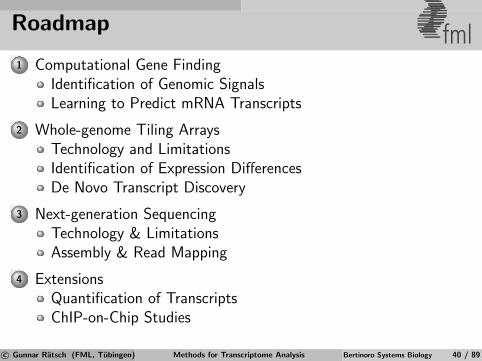
Roadmap fml1 Computational Gene Finding
Identification of Genomic SignalsLearning to Predict mRNA Transcripts
2 Whole-genome Tiling ArraysTechnology and LimitationsIdentification of Expression DifferencesDe Novo Transcript Discovery
3 Next-generation SequencingTechnology & LimitationsAssembly & Read Mapping
4 ExtensionsQuantification of TranscriptsChIP-on-Chip Studies
c© Gunnar Ratsch (FML, Tubingen) Methods for Transcriptome Analysis Bertinoro Systems Biology 40 / 89
Next-generation Sequencing Technology & Limitations
Sequencing Techniques & Applications fmlApplications of DNA/RNA sequencing:
De novo genome sequencing
Genome resequencing
Transcriptome sequencing
Methylation analysis
Sequencing Technology
Capillary/Sanger sequencing
Pyrosequencing (Roche/454)
SOLiD sequencing (ABI)
Flow cell sequencing (Illumina)
Single molecule sequencing (Nanopores, etc.)
} Next Generation Se-quencing
c© Gunnar Ratsch (FML, Tubingen) Methods for Transcriptome Analysis Bertinoro Systems Biology 41 / 89
Next-generation Sequencing Technology & Limitations
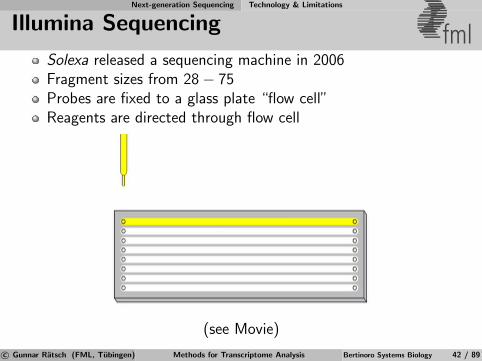
Illumina Sequencing fmlSolexa released a sequencing machine in 2006Fragment sizes from 28− 75Probes are fixed to a glass plate “flow cell”Reagents are directed through flow cell
(see Movie)
c© Gunnar Ratsch (FML, Tubingen) Methods for Transcriptome Analysis Bertinoro Systems Biology 42 / 89
Next-generation Sequencing Technology & Limitations
Illumina Sequencing fml
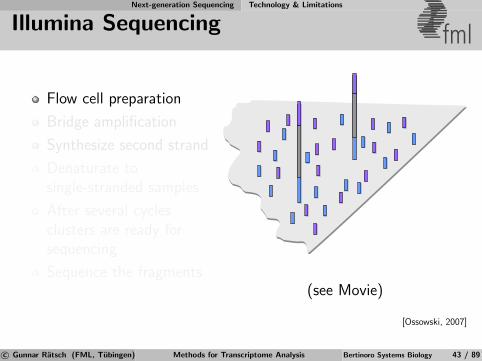
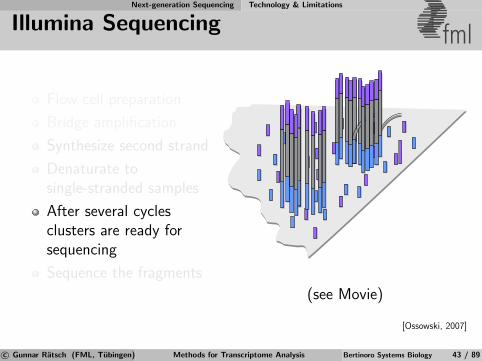
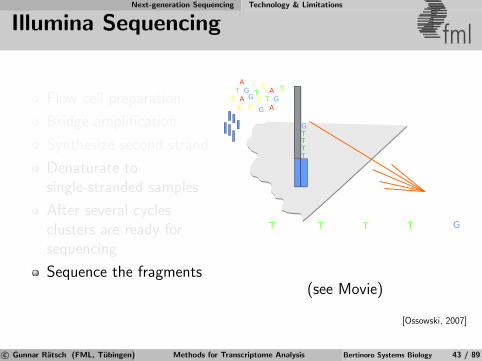
Flow cell preparation
Bridge amplification
Synthesize second strand
Denaturate tosingle-stranded samples
After several cyclesclusters are ready forsequencing
Sequence the fragments(see Movie)
[Ossowski, 2007]
c© Gunnar Ratsch (FML, Tubingen) Methods for Transcriptome Analysis Bertinoro Systems Biology 43 / 89
Next-generation Sequencing Technology & Limitations
Illumina Sequencing fml
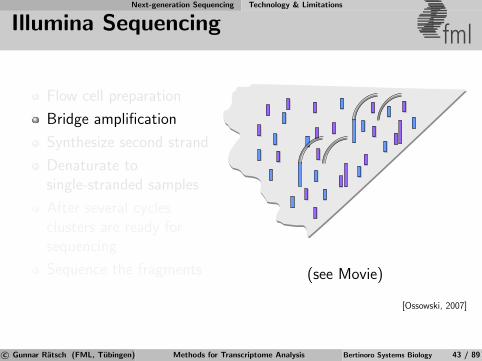
Flow cell preparation
Bridge amplification
Synthesize second strand
Denaturate tosingle-stranded samples
After several cyclesclusters are ready forsequencing
Sequence the fragments (see Movie)
[Ossowski, 2007]
c© Gunnar Ratsch (FML, Tubingen) Methods for Transcriptome Analysis Bertinoro Systems Biology 43 / 89
Next-generation Sequencing Technology & Limitations
Illumina Sequencing fml
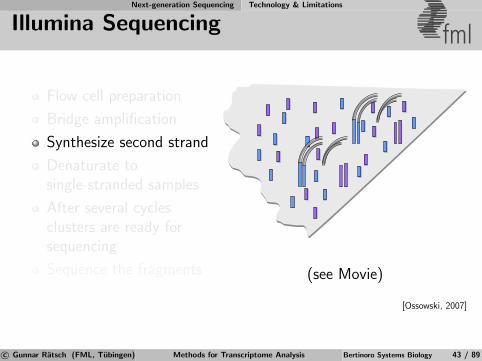
Flow cell preparation
Bridge amplification
Synthesize second strand
Denaturate tosingle-stranded samples
After several cyclesclusters are ready forsequencing
Sequence the fragments (see Movie)
[Ossowski, 2007]
c© Gunnar Ratsch (FML, Tubingen) Methods for Transcriptome Analysis Bertinoro Systems Biology 43 / 89
Next-generation Sequencing Technology & Limitations
Illumina Sequencing fml
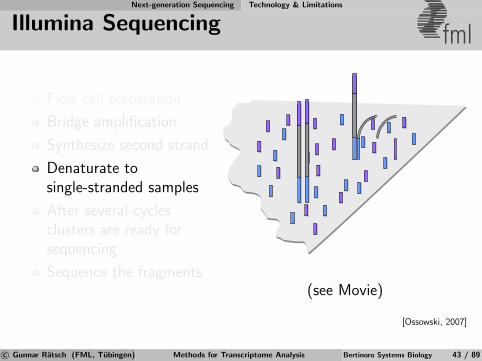
Flow cell preparation
Bridge amplification
Synthesize second strand
Denaturate tosingle-stranded samples
After several cyclesclusters are ready forsequencing
Sequence the fragments(see Movie)
[Ossowski, 2007]
c© Gunnar Ratsch (FML, Tubingen) Methods for Transcriptome Analysis Bertinoro Systems Biology 43 / 89
Next-generation Sequencing Technology & Limitations
Illumina Sequencing fml
Flow cell preparation
Bridge amplification
Synthesize second strand
Denaturate tosingle-stranded samples
After several cyclesclusters are ready forsequencing
Sequence the fragments
(see Movie)
[Ossowski, 2007]
c© Gunnar Ratsch (FML, Tubingen) Methods for Transcriptome Analysis Bertinoro Systems Biology 43 / 89
Next-generation Sequencing Technology & Limitations
Illumina Sequencing fml
Flow cell preparation
Bridge amplification
Synthesize second strand
Denaturate tosingle-stranded samples
After several cyclesclusters are ready forsequencing
Sequence the fragments
TTTT
G
T
CAG
TC
AC
GTTTT
G TC A GT
CA
C
Laser
G
Camera
ImageAnalysis
(see Movie)
[Ossowski, 2007]
c© Gunnar Ratsch (FML, Tubingen) Methods for Transcriptome Analysis Bertinoro Systems Biology 43 / 89
Next-generation Sequencing Technology & Limitations
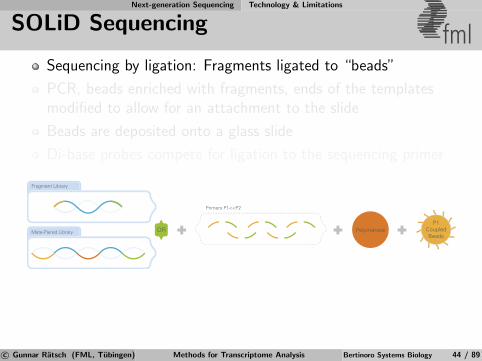
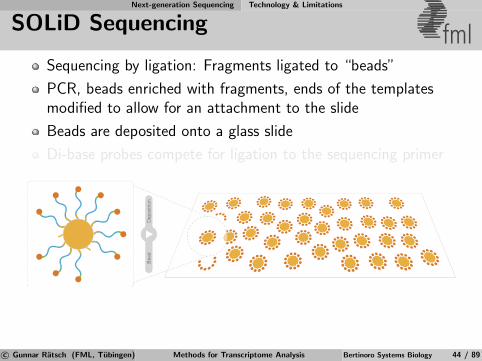
SOLiD Sequencing fmlSequencing by ligation: Fragments ligated to “beads”
PCR, beads enriched with fragments, ends of the templatesmodified to allow for an attachment to the slide
Beads are deposited onto a glass slide
Di-base probes compete for ligation to the sequencing primer
c© Gunnar Ratsch (FML, Tubingen) Methods for Transcriptome Analysis Bertinoro Systems Biology 44 / 89
Next-generation Sequencing Technology & Limitations
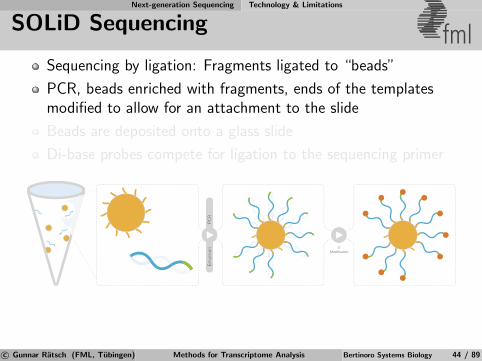
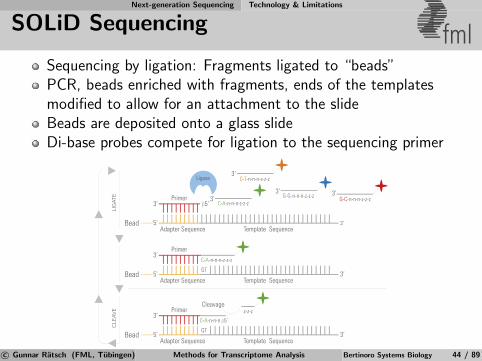
SOLiD Sequencing fmlSequencing by ligation: Fragments ligated to “beads”PCR, beads enriched with fragments, ends of the templatesmodified to allow for an attachment to the slideBeads are deposited onto a glass slideDi-base probes compete for ligation to the sequencing primer
c© Gunnar Ratsch (FML, Tubingen) Methods for Transcriptome Analysis Bertinoro Systems Biology 44 / 89
Next-generation Sequencing Technology & Limitations
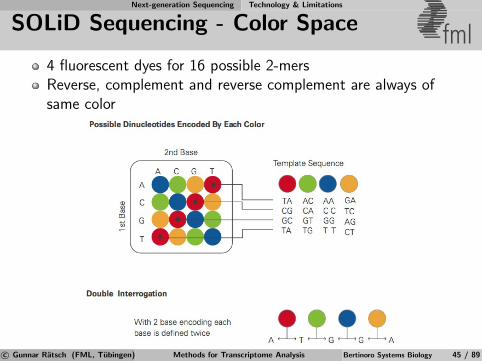
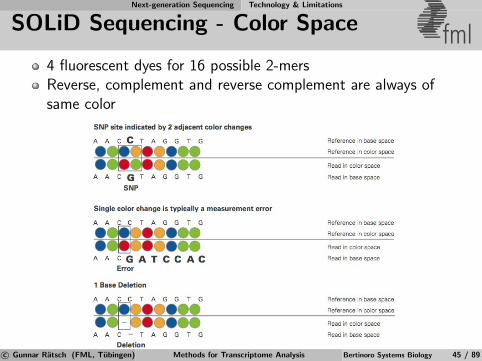
SOLiD Sequencing - Color Space fml4 fluorescent dyes for 16 possible 2-mersReverse, complement and reverse complement are always ofsame color
c© Gunnar Ratsch (FML, Tubingen) Methods for Transcriptome Analysis Bertinoro Systems Biology 45 / 89
Next-generation Sequencing Technology & Limitations
SOLiD Sequencing - Color Space fml4 fluorescent dyes for 16 possible 2-mersReverse, complement and reverse complement are always ofsame color
c© Gunnar Ratsch (FML, Tubingen) Methods for Transcriptome Analysis Bertinoro Systems Biology 45 / 89
Next-generation Sequencing Technology & Limitations
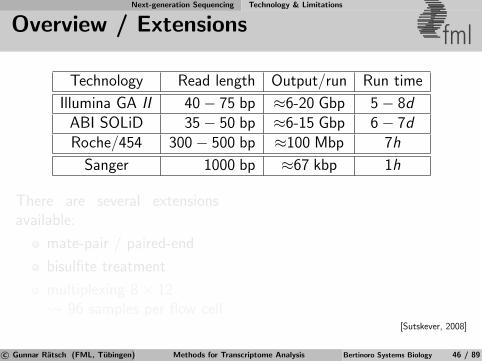
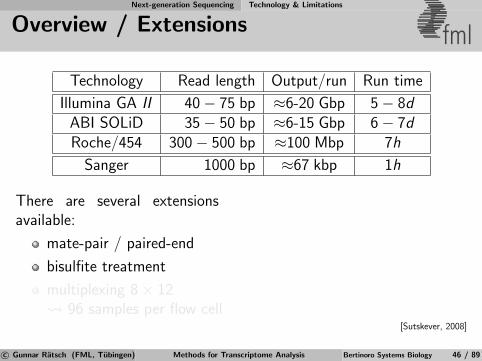
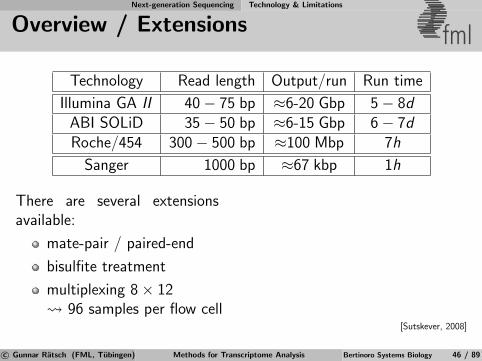
Overview / Extensions fml
Technology Read length Output/run Run time
Illumina GA II 40− 75 bp ≈6-20 Gbp 5− 8dABI SOLiD 35− 50 bp ≈6-15 Gbp 6− 7dRoche/454 300− 500 bp ≈100 Mbp 7h
Sanger 1000 bp ≈67 kbp 1h
There are several extensionsavailable:
mate-pair / paired-end
bisulfite treatment
multiplexing 8× 12 96 samples per flow cell
[Sutskever, 2008]
c© Gunnar Ratsch (FML, Tubingen) Methods for Transcriptome Analysis Bertinoro Systems Biology 46 / 89

Next-generation Sequencing Technology & Limitations
Overview / Extensions fml
Technology Read length Output/run Run time
Illumina GA II 40− 75 bp ≈6-20 Gbp 5− 8dABI SOLiD 35− 50 bp ≈6-15 Gbp 6− 7dRoche/454 300− 500 bp ≈100 Mbp 7h
Sanger 1000 bp ≈67 kbp 1h
There are several extensionsavailable:
mate-pair / paired-end
bisulfite treatment
multiplexing 8× 12 96 samples per flow cell
CCGTTT TATTTTTT
75 75
4K
[Sutskever, 2008]
c© Gunnar Ratsch (FML, Tubingen) Methods for Transcriptome Analysis Bertinoro Systems Biology 46 / 89
Next-generation Sequencing Technology & Limitations
Overview / Extensions fml
Technology Read length Output/run Run time
Illumina GA II 40− 75 bp ≈6-20 Gbp 5− 8dABI SOLiD 35− 50 bp ≈6-15 Gbp 6− 7dRoche/454 300− 500 bp ≈100 Mbp 7h
Sanger 1000 bp ≈67 kbp 1h
There are several extensionsavailable:
mate-pair / paired-end
bisulfite treatment
multiplexing 8× 12 96 samples per flow cell
[Sutskever, 2008]
c© Gunnar Ratsch (FML, Tubingen) Methods for Transcriptome Analysis Bertinoro Systems Biology 46 / 89

Next-generation Sequencing Assembly & Read Mapping
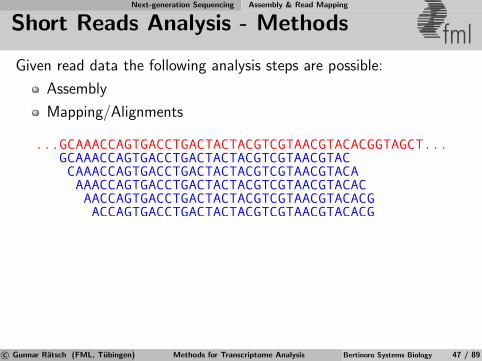
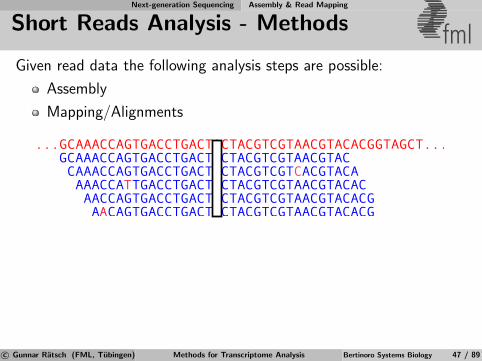
Short Reads Analysis - Methods fmlGiven read data the following analysis steps are possible:
AssemblyMapping/Alignments
CCGTTT TATTTTTTTCTAAG AGATAAA
CTCTGTA TGACTC
ACGTACCGTTTGACTCTAGTATCTTCTAGTAGATATTTTTTTTTTAGATAAAA
Assembled genome
Reads
?
magic
??
?
?
?
?
?
?
CTCTGTA
TATTTTTT
AGATAAA
CCGTTT
CCGTTT
[Sutskever, 2008]c© Gunnar Ratsch (FML, Tubingen) Methods for Transcriptome Analysis Bertinoro Systems Biology 47 / 89
Next-generation Sequencing Assembly & Read Mapping
Short Reads Analysis - Methods fmlGiven read data the following analysis steps are possible:
Assembly
Mapping/Alignments
c© Gunnar Ratsch (FML, Tubingen) Methods for Transcriptome Analysis Bertinoro Systems Biology 47 / 89
Next-generation Sequencing Assembly & Read Mapping
Short Reads Analysis - Methods fmlGiven read data the following analysis steps are possible:
Assembly
Mapping/Alignments
c© Gunnar Ratsch (FML, Tubingen) Methods for Transcriptome Analysis Bertinoro Systems Biology 47 / 89
Next-generation Sequencing Assembly & Read Mapping
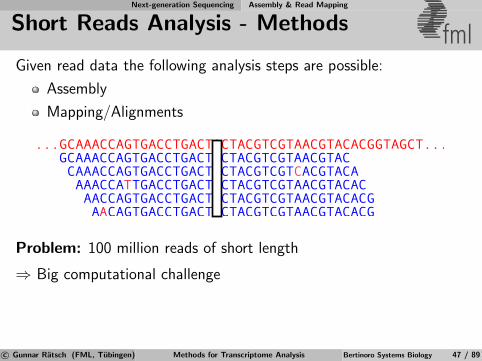
Short Reads Analysis - Methods fmlGiven read data the following analysis steps are possible:
Assembly
Mapping/Alignments
Problem: 100 million reads of short length
⇒ Big computational challenge
c© Gunnar Ratsch (FML, Tubingen) Methods for Transcriptome Analysis Bertinoro Systems Biology 47 / 89
Next-generation Sequencing Assembly & Read Mapping
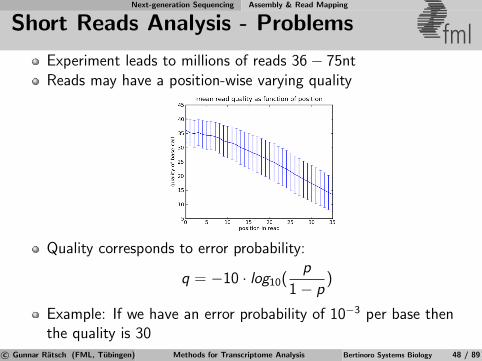
Short Reads Analysis - Problems fmlExperiment leads to millions of reads 36− 75ntReads may have a position-wise varying quality
Quality corresponds to error probability:
q = −10 · log10(p
1− p)
Example: If we have an error probability of 10−3 per base thenthe quality is 30
c© Gunnar Ratsch (FML, Tubingen) Methods for Transcriptome Analysis Bertinoro Systems Biology 48 / 89
Next-generation Sequencing Assembly & Read Mapping
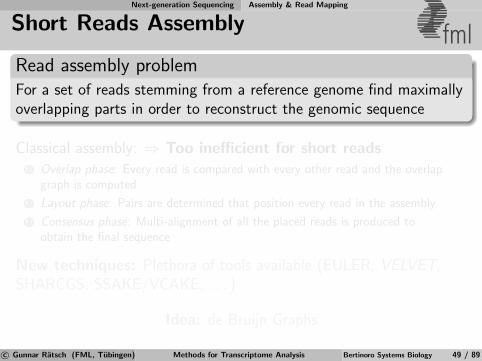
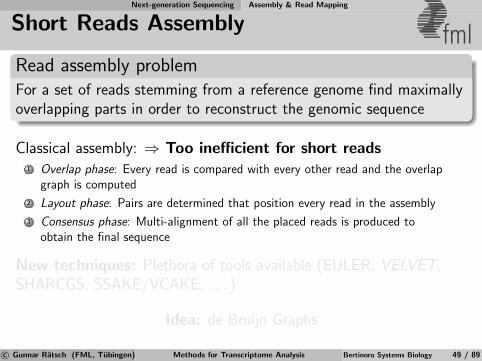
Short Reads Assembly fmlRead assembly problemFor a set of reads stemming from a reference genome find maximallyoverlapping parts in order to reconstruct the genomic sequence
Classical assembly: ⇒ Too inefficient for short reads1 Overlap phase: Every read is compared with every other read and the overlap
graph is computed
2 Layout phase: Pairs are determined that position every read in the assembly
3 Consensus phase: Multi-alignment of all the placed reads is produced toobtain the final sequence
New techniques: Plethora of tools available (EULER, VELVET,SHARCGS, SSAKE/VCAKE, . . . )
Idea: de Bruijn Graphs
c© Gunnar Ratsch (FML, Tubingen) Methods for Transcriptome Analysis Bertinoro Systems Biology 49 / 89

Next-generation Sequencing Assembly & Read Mapping
Short Reads Assembly fmlRead assembly problemFor a set of reads stemming from a reference genome find maximallyoverlapping parts in order to reconstruct the genomic sequence
Classical assembly: ⇒ Too inefficient for short reads1 Overlap phase: Every read is compared with every other read and the overlap
graph is computed
2 Layout phase: Pairs are determined that position every read in the assembly
3 Consensus phase: Multi-alignment of all the placed reads is produced toobtain the final sequence
New techniques: Plethora of tools available (EULER, VELVET,SHARCGS, SSAKE/VCAKE, . . . )
Idea: de Bruijn Graphs
c© Gunnar Ratsch (FML, Tubingen) Methods for Transcriptome Analysis Bertinoro Systems Biology 49 / 89
Next-generation Sequencing Assembly & Read Mapping
Short Reads Assembly - de Bruijn Graphs fmlExample:
001 011
110100
000 101 010 111
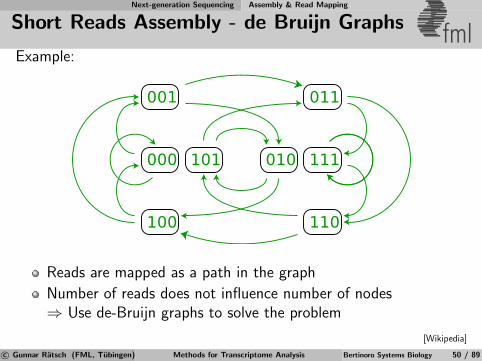
Reads are mapped as a path in the graph
Number of reads does not influence number of nodes⇒ Use de-Bruijn graphs to solve the problem
[Wikipedia]
c© Gunnar Ratsch (FML, Tubingen) Methods for Transcriptome Analysis Bertinoro Systems Biology 50 / 89
Next-generation Sequencing Assembly & Read Mapping
de Bruijn Graphs fmlExample: TAGAC
AGACT
AGACT ACTGA
CTGAT
TGATT
GATTG ATTGA
TTGAC
TGACC
GACCA
ATTGC
TTGCC
1. TAGACTTATTGACCA2. TAGACTTATTGCC.....
de Bruin graph for two reads:
[Zerbino and Birney, 2008]
Nodes represent k-mers smaller than read lengthA k-mer can refer to thousands of reads containing itRead errors or ambiguities lead to branching of pathsEach node also stores the reverse complement
c© Gunnar Ratsch (FML, Tubingen) Methods for Transcriptome Analysis Bertinoro Systems Biology 51 / 89
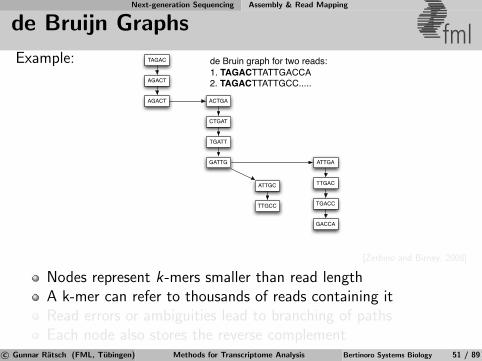

Next-generation Sequencing Assembly & Read Mapping
de Bruijn Graphs fmlExample:
[Zerbino and Birney, 2008]
Nodes represent k-mers smaller than read length
A k-mer can refer to thousands of reads containing it
Read errors or ambiguities lead to branching of paths
Each node also stores the reverse complement
c© Gunnar Ratsch (FML, Tubingen) Methods for Transcriptome Analysis Bertinoro Systems Biology 51 / 89
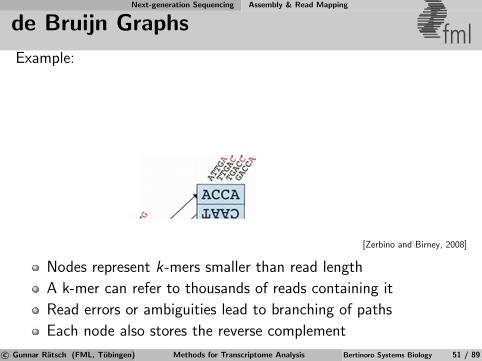
Next-generation Sequencing Assembly & Read Mapping
de Bruijn Graphs fmlExample:
[Zerbino and Birney, 2008]
Nodes represent k-mers smaller than read length
A k-mer can refer to thousands of reads containing it
Read errors or ambiguities lead to branching of paths
Each node also stores the reverse complement
c© Gunnar Ratsch (FML, Tubingen) Methods for Transcriptome Analysis Bertinoro Systems Biology 51 / 89
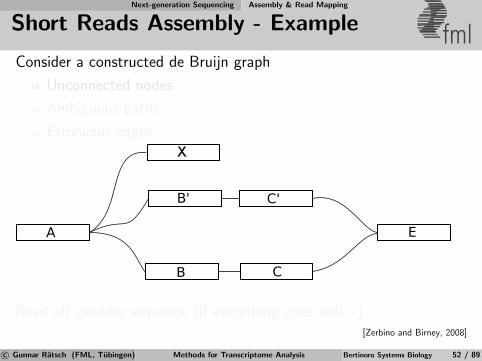
Next-generation Sequencing Assembly & Read Mapping
Short Reads Assembly - Example fmlConsider a constructed de Bruijn graph
Unconnected nodes
Ambiguous paths
Erroneous edges
A
B
B'
C
C'
X
E
Read off genome sequence (if everything goes well ;-)[Zerbino and Birney, 2008]
c© Gunnar Ratsch (FML, Tubingen) Methods for Transcriptome Analysis Bertinoro Systems Biology 52 / 89
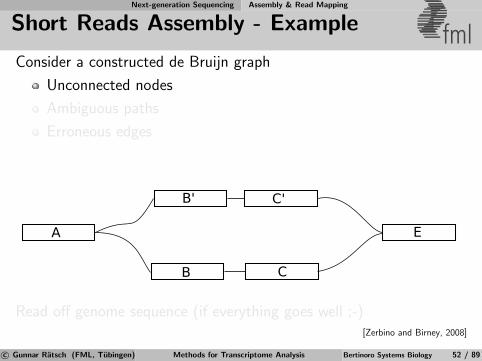
Next-generation Sequencing Assembly & Read Mapping
Short Reads Assembly - Example fmlConsider a constructed de Bruijn graph
Unconnected nodes
Ambiguous paths
Erroneous edges
A
B
B'
C
C'
E
Read off genome sequence (if everything goes well ;-)[Zerbino and Birney, 2008]
c© Gunnar Ratsch (FML, Tubingen) Methods for Transcriptome Analysis Bertinoro Systems Biology 52 / 89
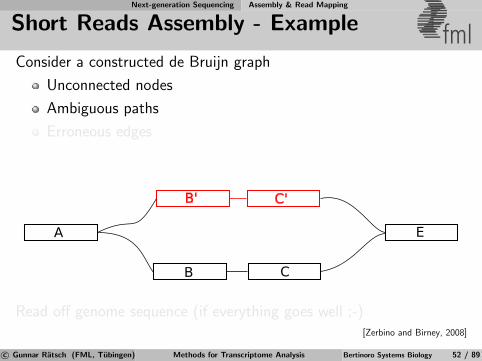
Next-generation Sequencing Assembly & Read Mapping
Short Reads Assembly - Example fmlConsider a constructed de Bruijn graph
Unconnected nodes
Ambiguous paths
Erroneous edges
A
B
B'
C
C'
E
Read off genome sequence (if everything goes well ;-)[Zerbino and Birney, 2008]
c© Gunnar Ratsch (FML, Tubingen) Methods for Transcriptome Analysis Bertinoro Systems Biology 52 / 89
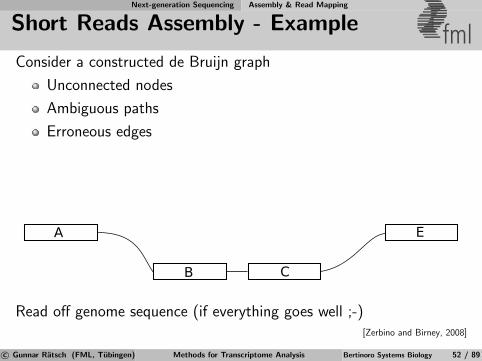
Next-generation Sequencing Assembly & Read Mapping
Short Reads Assembly - Example fmlConsider a constructed de Bruijn graph
Unconnected nodes
Ambiguous paths
Erroneous edges
A
B C
E
Read off genome sequence (if everything goes well ;-)[Zerbino and Birney, 2008]
c© Gunnar Ratsch (FML, Tubingen) Methods for Transcriptome Analysis Bertinoro Systems Biology 52 / 89
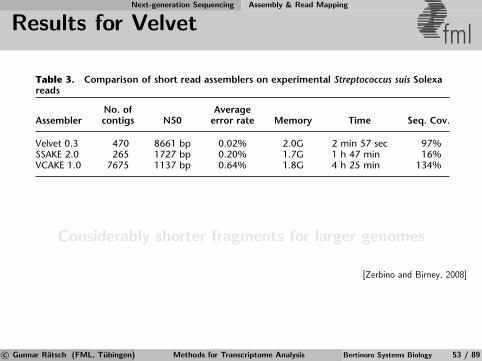
Next-generation Sequencing Assembly & Read Mapping
Results for Velvet fml
vet uses slightly more memory, it is significantly faster and pro-duces larger contigs, without mis-assembly. Furthermore, it cov-ers a large area of the genome with high precision.
We also tried using SHARCGS (Dohm et al. 2007) andEULER (Pevzner et al. 2001) but were not able to make theseprograms work with our data sets. This is probably due to differ-ences in the expected input, particularly in terms of coveragedepth and read length.
DiscussionWe have developed Velvet, a novel set of de Bruijn graph-basedsequence assembly methods for very short reads that can bothremove errors and, in the presence of read pair information, re-solve a large number of repeats. With unpaired reads, the assem-bly is broken when there is a repeat longer than the k-mer length.With the addition of short reads in read pair format, many ofthese repeats can be resolved, leading to assemblies similar todraft status in bacteria and reasonably long (∼5 kb) SCSCs ineukaryotic genomes.
For the latter genomes, the short readcontigs will probably have to be combinedwith long reads or other sequencing strate-gies such as BAC or fosmid pooling. Simu-lations of Breadcrumb produced virtuallyidentical N50 lengths on both a continuous5-Mb region and a discontinuous 5-Mb re-gion made up of random 150-kb BACs, with
twofold variation in BAC concentration(data not shown). This approach wouldthen require merging local assemblies.
Sequence connected supercontigshave considerably more informationthan gapped supercontigs, in that the se-quence content separating the definitivecontigs is an unresolved graph. One caneasily imagine methods that can excludethe presence of a novel sequence in theSCSC completely by considering thepotential paths in the unresolved se-quence regions, in contrast to tradi-tional supercontigs, where one cannever make such a claim. In addition,the unresolved regions will often be dis-persed repeats, and as such the classifi-cation of such regions as repeats is moreimportant than their sequence contentfor many applications.
It is important to emphasize thatassembly is not a solved problem, in par-ticular with very short reads, and therewill continue to be considerable algo-rithmic improvements. Velvet can al-ready convert high-coverage very shortreads into reasonably sized contigs withno additional information. With addi-tional paired read information to resolvesmall repeats, almost complete genomescan be assembled. We believe the Velvetframework will provide a rich set of dif-ferent algorithmic options tailored todifferent tasks and thus provide a plat-
form for cheap de novo sequence assemblies, eventually for allgenomes.
MethodsVelvet parametersVelvet was implemented in C and tested on a 64-bit Linux ma-chine.
The results of Velvet are very sensitive to the parameter k asmentioned previously. The optimum depends on the genome,the coverage, the quality, and the length of the reads. One ap-proach consists in testing several alternatives in parallel and pick-ing the best.
Another method consists in estimating the expected num-ber X of times a unique k-mer in a genome of length G is observedin a set of n reads of length l. We can link this number to thetraditional value of coverage, noted C, with the relations:
E!X" =n!l − k + 1"
G − k + 1≈
nG !l − k + 1" = C
l − k + 1l
Figure 6. Breadcrumb performance on simulated data sets. As in Figure 3, we sampled 5-Mb DNAsequences from four different species (E. coli, S. cerevisiae, C. elegans, and H. sapiens, respectively) andgenerated 50! read sets. The horizontal lines represent the N50 reached at the end of Tour Bus (seeFig. 3) (broken black line) and after applying a 4! coverage cutoff (broken red line). Note how thedifference in N50 between the graph of perfect reads and that of erroneous reads is significantlyreduced by this last cutoff. (Black curves) The results after the basic Breadcrumb algorithm; (red curves)the results after super-contigging.
Table 3. Comparison of short read assemblers on experimental Streptococcus suis Solexareads
AssemblerNo. ofcontigs N50
Averageerror rate Memory Time Seq. Cov.
Velvet 0.3 470 8661 bp 0.02% 2.0G 2 min 57 sec 97%SSAKE 2.0 265 1727 bp 0.20% 1.7G 1 h 47 min 16%VCAKE 1.0 7675 1137 bp 0.64% 1.8G 4 h 25 min 134%
Short read de novo assembly using de Bruijn graphs
Genome Research 827www.genome.org
Cold Spring Harbor Laboratory Press on March 21, 2009 - Published by genome.cshlp.orgDownloaded from
Considerably shorter fragments for larger genomes
[Zerbino and Birney, 2008]
c© Gunnar Ratsch (FML, Tubingen) Methods for Transcriptome Analysis Bertinoro Systems Biology 53 / 89
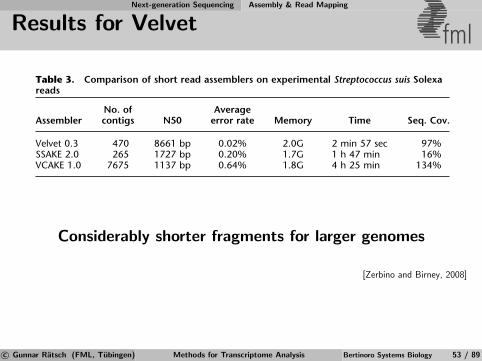
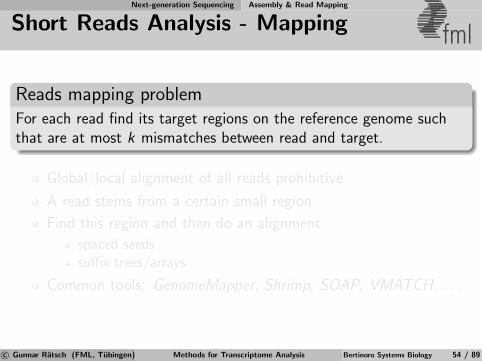
Next-generation Sequencing Assembly & Read Mapping
Short Reads Analysis - Mapping fml
Reads mapping problemFor each read find its target regions on the reference genome suchthat are at most k mismatches between read and target.
Global/local alignment of all reads prohibitive
A read stems from a certain small region
Find this region and then do an alignment
spaced seedssuffix trees/arrays
Common tools: GenomeMapper, Shrimp, SOAP, VMATCH, . . .
c© Gunnar Ratsch (FML, Tubingen) Methods for Transcriptome Analysis Bertinoro Systems Biology 54 / 89
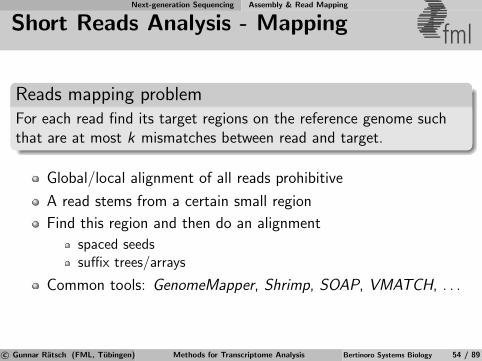
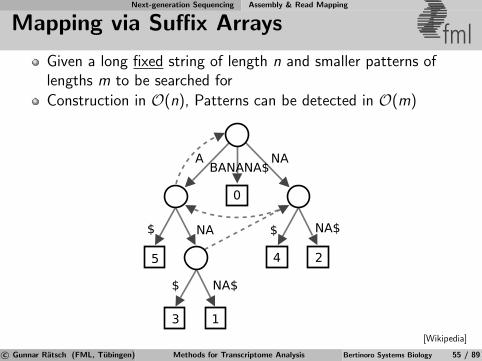
Next-generation Sequencing Assembly & Read Mapping
Mapping via Suffix Arrays fmlGiven a long fixed string of length n and smaller patterns oflengths m to be searched for
Construction in O(n), Patterns can be detected in O(m)
3 1
5
A NA
NA$NA$ $
BANANA$
4 2
0
NA$$
[Wikipedia]
c© Gunnar Ratsch (FML, Tubingen) Methods for Transcriptome Analysis Bertinoro Systems Biology 55 / 89
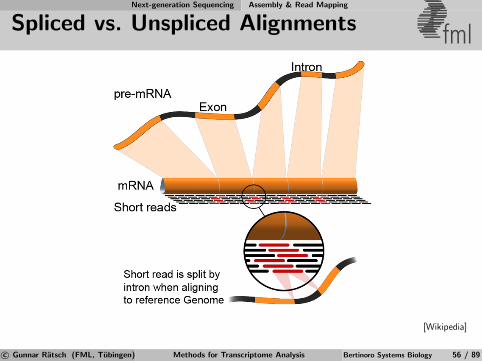
Next-generation Sequencing Assembly & Read Mapping
Spliced vs. Unspliced Alignments fml
[Wikipedia]
c© Gunnar Ratsch (FML, Tubingen) Methods for Transcriptome Analysis Bertinoro Systems Biology 56 / 89
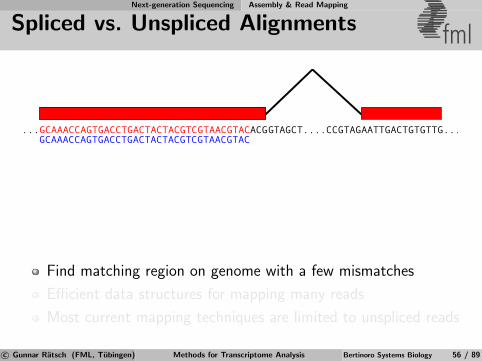
Next-generation Sequencing Assembly & Read Mapping
Spliced vs. Unspliced Alignments fml
Find matching region on genome with a few mismatches
Efficient data structures for mapping many reads
Most current mapping techniques are limited to unspliced reads
c© Gunnar Ratsch (FML, Tubingen) Methods for Transcriptome Analysis Bertinoro Systems Biology 56 / 89
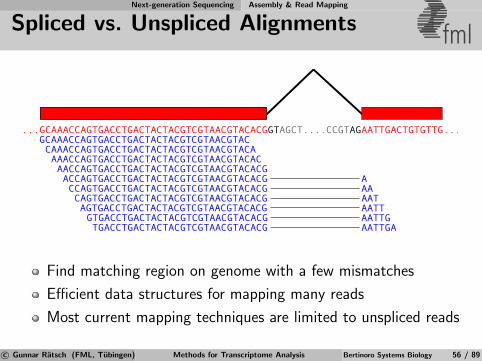
Next-generation Sequencing Assembly & Read Mapping
Spliced vs. Unspliced Alignments fml
Find matching region on genome with a few mismatches
Efficient data structures for mapping many reads
Most current mapping techniques are limited to unspliced reads
c© Gunnar Ratsch (FML, Tubingen) Methods for Transcriptome Analysis Bertinoro Systems Biology 56 / 89
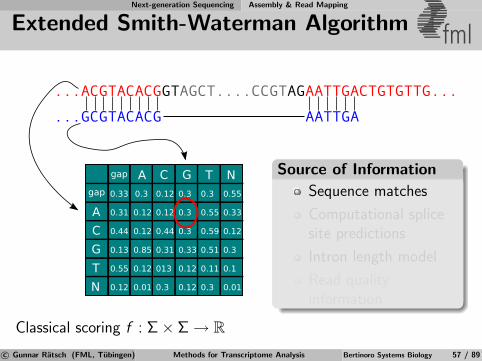
Next-generation Sequencing Assembly & Read Mapping
Extended Smith-Waterman Algorithm fml
Classical scoring f : Σ× Σ → R
Source of Information
Sequence matches
Computational splicesite predictions
Intron length model
Read qualityinformation
c© Gunnar Ratsch (FML, Tubingen) Methods for Transcriptome Analysis Bertinoro Systems Biology 57 / 89
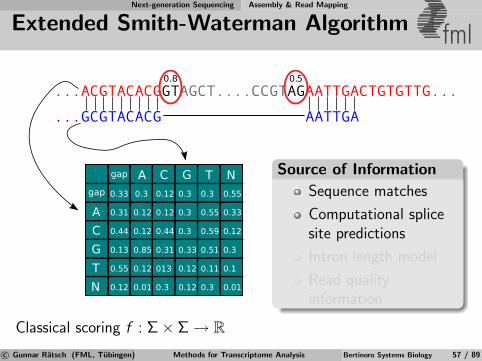
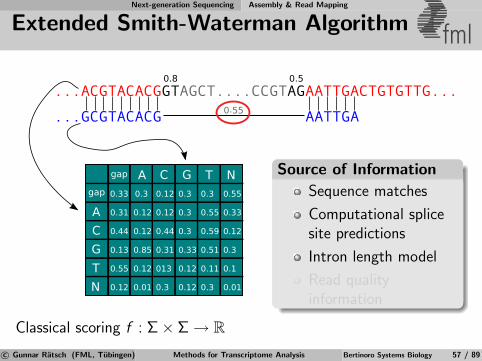
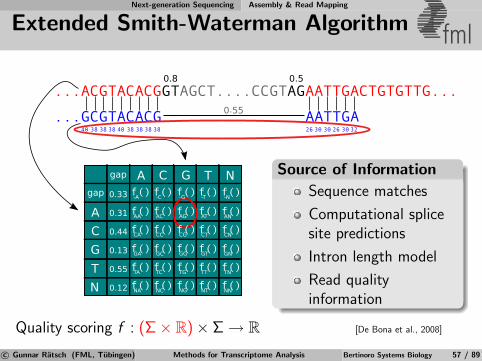
Next-generation Sequencing Assembly & Read Mapping
Extended Smith-Waterman Algorithm fml
Quality scoring f : (Σ× R)× Σ → R [De Bona et al., 2008]
Source of Information
Sequence matches
Computational splicesite predictions
Intron length model
Read qualityinformation
c© Gunnar Ratsch (FML, Tubingen) Methods for Transcriptome Analysis Bertinoro Systems Biology 57 / 89
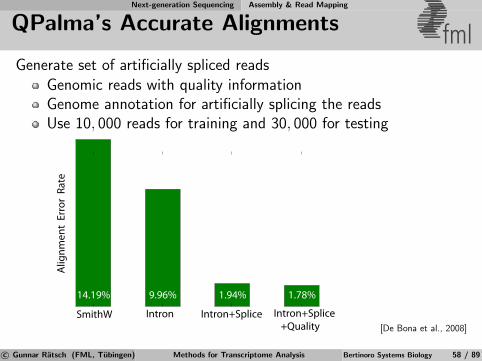
Next-generation Sequencing Assembly & Read Mapping
QPalma’s Accurate Alignments fmlGenerate set of artificially spliced reads
Genomic reads with quality informationGenome annotation for artificially splicing the readsUse 10, 000 reads for training and 30, 000 for testing
SmithW Intron Intron+Splice Intron+Splice +Quality
Alig
nmen
t Er
ror
Rate
14.19% 9.96% 1.94% 1.78%
[De Bona et al., 2008]
c© Gunnar Ratsch (FML, Tubingen) Methods for Transcriptome Analysis Bertinoro Systems Biology 58 / 89
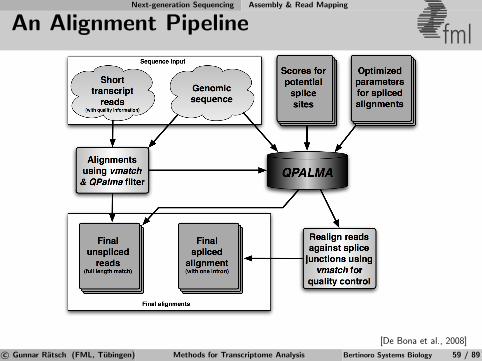
Next-generation Sequencing Assembly & Read Mapping
An Alignment Pipeline fml
[De Bona et al., 2008]
c© Gunnar Ratsch (FML, Tubingen) Methods for Transcriptome Analysis Bertinoro Systems Biology 59 / 89
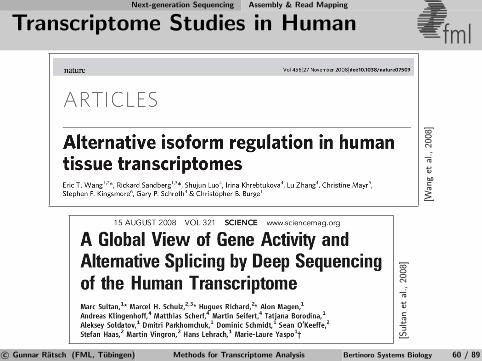
Next-generation Sequencing Assembly & Read Mapping
Transcriptome Studies in Human fml
[Wan
get
al.,
2008
]
[Sul
tan
etal
.,20
08]
c© Gunnar Ratsch (FML, Tubingen) Methods for Transcriptome Analysis Bertinoro Systems Biology 60 / 89
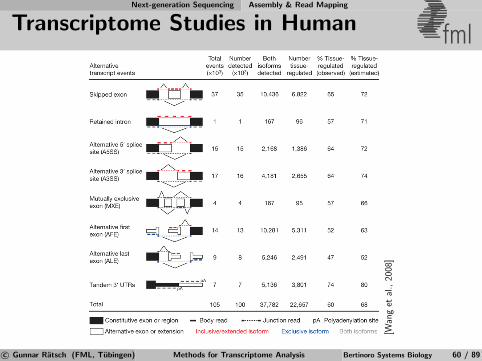
Next-generation Sequencing Assembly & Read Mapping
Transcriptome Studies in Human fml
[Wan
get
al.,
2008
]
c© Gunnar Ratsch (FML, Tubingen) Methods for Transcriptome Analysis Bertinoro Systems Biology 60 / 89
Next-generation Sequencing Assembly & Read Mapping
Roadmap fml1 Computational Gene Finding
Identification of Genomic SignalsLearning to Predict mRNA Transcripts
2 Whole-genome Tiling ArraysTechnology and LimitationsIdentification of Expression DifferencesDe Novo Transcript Discovery
3 Next-generation SequencingTechnology & LimitationsAssembly & Read Mapping
4 ExtensionsQuantification of TranscriptsChIP-on-Chip Studies
c© Gunnar Ratsch (FML, Tubingen) Methods for Transcriptome Analysis Bertinoro Systems Biology 61 / 89
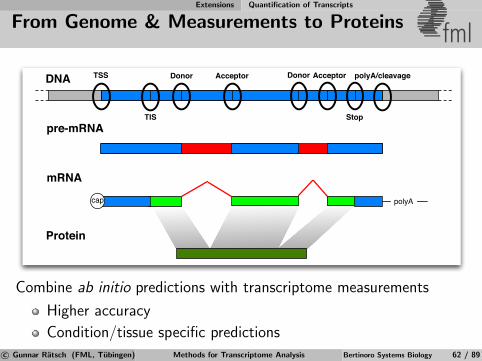
Extensions Quantification of Transcripts
From Genome & Measurements to Proteins fml
DNA
pre-mRNA
mRNA
Protein
polyAcap
TSS Donor Acceptor Donor Acceptor
TIS Stop
polyA/cleavage
Combine ab initio predictions with transcriptome measurements
Higher accuracy
Condition/tissue specific predictionsc© Gunnar Ratsch (FML, Tubingen) Methods for Transcriptome Analysis Bertinoro Systems Biology 62 / 89
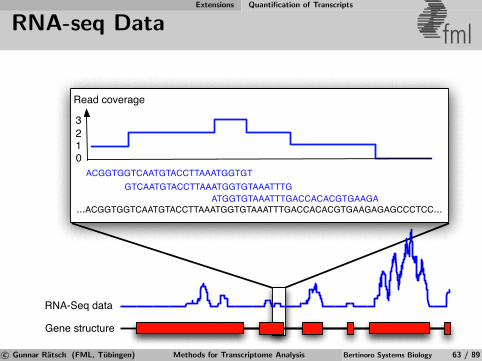
Extensions Quantification of Transcripts
RNA-seq Data fml
...ACGGTGGTCAATGTACCTTAAATGGTGTAAATTTGACCACACGTGAAGAGAGCCCTCC...
ACGGTGGTCAATGTACCTTAAATGGTGTGTCAATGTACCTTAAATGGTGTAAATTTG
ATGGTGTAAATTTGACCACACGTGAAGA
Read coverage
0123
RNA-Seq data
Gene structure
c© Gunnar Ratsch (FML, Tubingen) Methods for Transcriptome Analysis Bertinoro Systems Biology 63 / 89
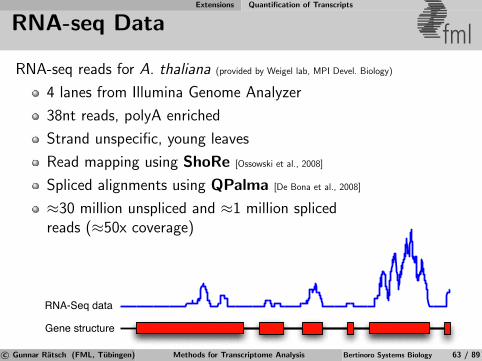
Extensions Quantification of Transcripts
RNA-seq Data fmlRNA-seq reads for A. thaliana (provided by Weigel lab, MPI Devel. Biology)
4 lanes from Illumina Genome Analyzer
38nt reads, polyA enriched
Strand unspecific, young leaves
Read mapping using ShoRe [Ossowski et al., 2008]
Spliced alignments using QPalma [De Bona et al., 2008]
≈30 million unspliced and ≈1 million splicedreads (≈50x coverage)
RNA-Seq data
Gene structure
c© Gunnar Ratsch (FML, Tubingen) Methods for Transcriptome Analysis Bertinoro Systems Biology 63 / 89
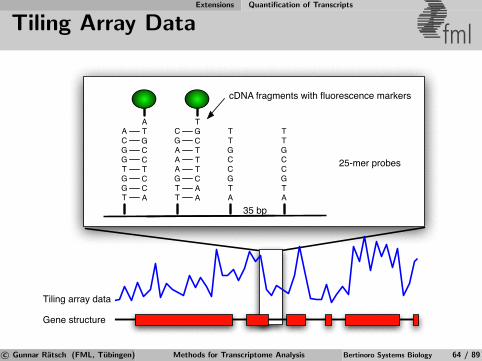
Extensions Quantification of Transcripts
Tiling Array Data fml
Tiling array data
Gene structure
35 bp
25-mer probes
ACGGTGGT
ATGCCTCCA
TTGCCGTA
CGAAAGTT
TGCTTTCAA
TTGCCGTA
cDNA fragments with fluorescence markers
c© Gunnar Ratsch (FML, Tubingen) Methods for Transcriptome Analysis Bertinoro Systems Biology 64 / 89
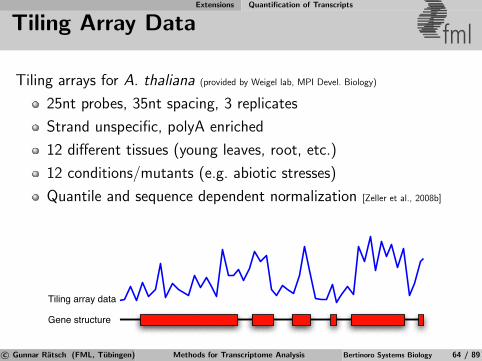
Extensions Quantification of Transcripts
Tiling Array Data fml
Tiling arrays for A. thaliana (provided by Weigel lab, MPI Devel. Biology)
25nt probes, 35nt spacing, 3 replicates
Strand unspecific, polyA enriched
12 different tissues (young leaves, root, etc.)
12 conditions/mutants (e.g. abiotic stresses)
Quantile and sequence dependent normalization [Zeller et al., 2008b]
Tiling array data
Gene structure
c© Gunnar Ratsch (FML, Tubingen) Methods for Transcriptome Analysis Bertinoro Systems Biology 64 / 89

Extensions Quantification of Transcripts
Learning to Integrate Data Sources[Behr et al., 2008] fml
acc
don
tss
tis
stop
True gene model 2 3 4 5
STEP 1: SVM Signal Predictions
genomic position
genomic position
c© Gunnar Ratsch (FML, Tubingen) Methods for Transcriptome Analysis Bertinoro Systems Biology 65 / 89

Extensions Quantification of Transcripts
Learning to Integrate Data Sources[Behr et al., 2008] fml
acc
don
tss
tis
stop
True gene model 2 3 4 5
F(x,y)
transform features
STEP 1: SVM Signal Predictions
STEP 2: Integration
genomic position
genomic position
c© Gunnar Ratsch (FML, Tubingen) Methods for Transcriptome Analysis Bertinoro Systems Biology 65 / 89
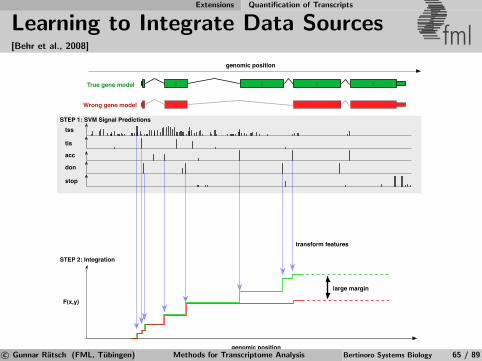
Extensions Quantification of Transcripts
Learning to Integrate Data Sources[Behr et al., 2008] fml
acc
don
tss
tis
stop
True gene model 2 3 4 5
Wrong gene model
large margin
F(x,y)
transform features
STEP 1: SVM Signal Predictions
STEP 2: Integration
genomic position
genomic position
c© Gunnar Ratsch (FML, Tubingen) Methods for Transcriptome Analysis Bertinoro Systems Biology 65 / 89
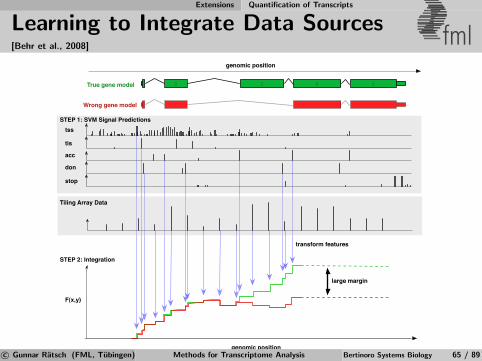
Extensions Quantification of Transcripts
Learning to Integrate Data Sources[Behr et al., 2008] fml
acc
don
tss
tis
stop
True gene model 2 3 4 5
Wrong gene model
large margin
F(x,y)
transform features
STEP 1: SVM Signal Predictions
STEP 2: Integration
Tiling Array Data
genomic position
genomic position
c© Gunnar Ratsch (FML, Tubingen) Methods for Transcriptome Analysis Bertinoro Systems Biology 65 / 89
Extensions Quantification of Transcripts
Results: How much does the data help?[Behr et al., 2008] fmlExperimental setup (Arabidopsis thaliana):
60% of known genes for training signals in step 1
400 genes for training of combination of data
300 regions around cDNA confirmed genes for evaluation
c© Gunnar Ratsch (FML, Tubingen) Methods for Transcriptome Analysis Bertinoro Systems Biology 66 / 89
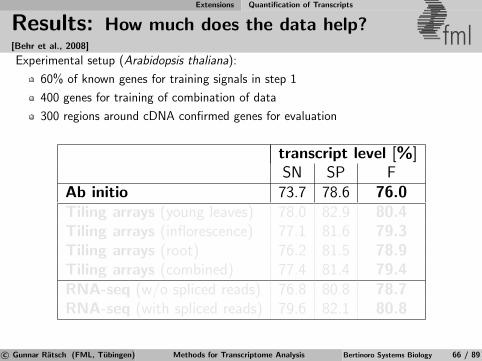
Extensions Quantification of Transcripts
Results: How much does the data help?[Behr et al., 2008] fmlExperimental setup (Arabidopsis thaliana):
60% of known genes for training signals in step 1
400 genes for training of combination of data
300 regions around cDNA confirmed genes for evaluation
transcript level [%]SN SP F
Ab initio 73.7 78.6 76.0Tiling arrays (young leaves) 78.0 82.9 80.4Tiling arrays (inflorescence) 77.1 81.6 79.3Tiling arrays (root) 76.2 81.5 78.9Tiling arrays (combined) 77.4 81.4 79.4RNA-seq (w/o spliced reads) 76.8 80.8 78.7RNA-seq (with spliced reads) 79.6 82.1 80.8
c© Gunnar Ratsch (FML, Tubingen) Methods for Transcriptome Analysis Bertinoro Systems Biology 66 / 89
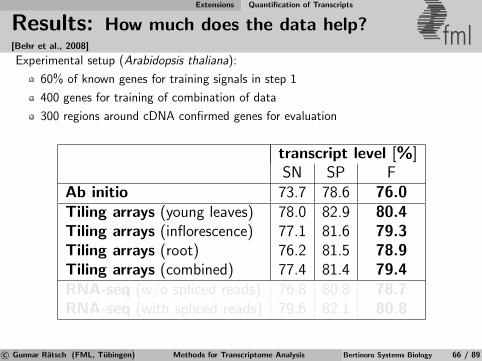
Extensions Quantification of Transcripts
Results: How much does the data help?[Behr et al., 2008] fmlExperimental setup (Arabidopsis thaliana):
60% of known genes for training signals in step 1
400 genes for training of combination of data
300 regions around cDNA confirmed genes for evaluation
transcript level [%]SN SP F
Ab initio 73.7 78.6 76.0Tiling arrays (young leaves) 78.0 82.9 80.4Tiling arrays (inflorescence) 77.1 81.6 79.3Tiling arrays (root) 76.2 81.5 78.9Tiling arrays (combined) 77.4 81.4 79.4RNA-seq (w/o spliced reads) 76.8 80.8 78.7RNA-seq (with spliced reads) 79.6 82.1 80.8
c© Gunnar Ratsch (FML, Tubingen) Methods for Transcriptome Analysis Bertinoro Systems Biology 66 / 89
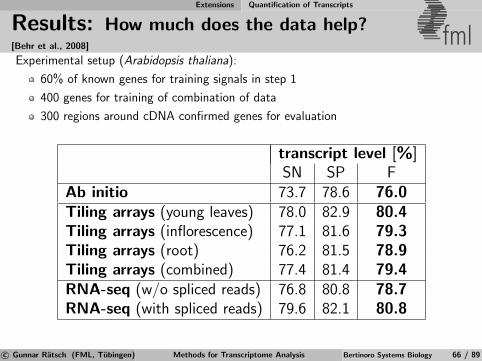
Extensions Quantification of Transcripts
Results: How much does the data help?[Behr et al., 2008] fmlExperimental setup (Arabidopsis thaliana):
60% of known genes for training signals in step 1
400 genes for training of combination of data
300 regions around cDNA confirmed genes for evaluation
transcript level [%]SN SP F
Ab initio 73.7 78.6 76.0Tiling arrays (young leaves) 78.0 82.9 80.4Tiling arrays (inflorescence) 77.1 81.6 79.3Tiling arrays (root) 76.2 81.5 78.9Tiling arrays (combined) 77.4 81.4 79.4RNA-seq (w/o spliced reads) 76.8 80.8 78.7RNA-seq (with spliced reads) 79.6 82.1 80.8
c© Gunnar Ratsch (FML, Tubingen) Methods for Transcriptome Analysis Bertinoro Systems Biology 66 / 89

Extensions Quantification of Transcripts
Results: How much data is needed?[Behr et al., 2008] fmlExperimental setup (Arabidopsis thaliana):
60% of known genes for training signals in step 1
400 genes for training of combination of data
300 regions around cDNA confirmed genes for evaluation
transcript level [%]SN SP F
Ab initio 73.7 78.6 76.0RNA-seq 1/128 75.5 78.7 77.1RNA-seq 1/64 76.8 79.5 78.1RNA-seq 1/32 76.2 79.6 77.9RNA-seq 1/16 77.1 79.1 78.1RNA-seq 1/8 78.6 80.1 79.4RNA-seq 1/4 77.4 79.6 78.5RNA-seq 1/2 79.3 82.1 80.6RNA-seq 79.6 82.1 80.8
c© Gunnar Ratsch (FML, Tubingen) Methods for Transcriptome Analysis Bertinoro Systems Biology 66 / 89
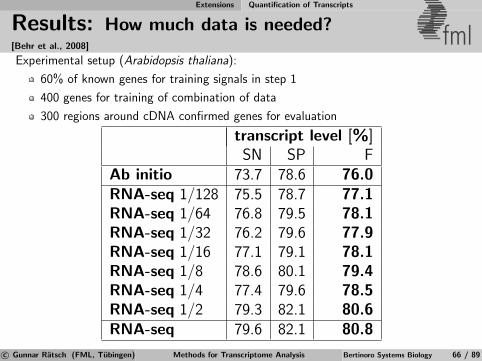
Extensions Quantification of Transcripts
Results: How much data is needed?[Behr et al., 2008] fmlExperimental setup (Arabidopsis thaliana):
60% of known genes for training signals in step 1
400 genes for training of combination of data
300 regions around cDNA confirmed genes for evaluation
transcript level [%]SN SP F
Ab initio 73.7 78.6 76.0RNA-seq 1/128 75.5 78.7 77.1RNA-seq 1/64 76.8 79.5 78.1RNA-seq 1/32 76.2 79.6 77.9RNA-seq 1/16 77.1 79.1 78.1RNA-seq 1/8 78.6 80.1 79.4RNA-seq 1/4 77.4 79.6 78.5RNA-seq 1/2 79.3 82.1 80.6RNA-seq 79.6 82.1 80.8
c© Gunnar Ratsch (FML, Tubingen) Methods for Transcriptome Analysis Bertinoro Systems Biology 66 / 89
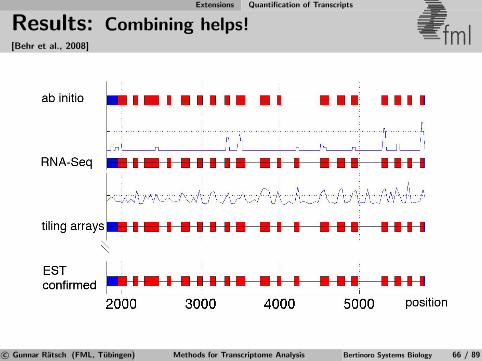
Extensions Quantification of Transcripts
Results: Combining helps![Behr et al., 2008] fml
c© Gunnar Ratsch (FML, Tubingen) Methods for Transcriptome Analysis Bertinoro Systems Biology 66 / 89
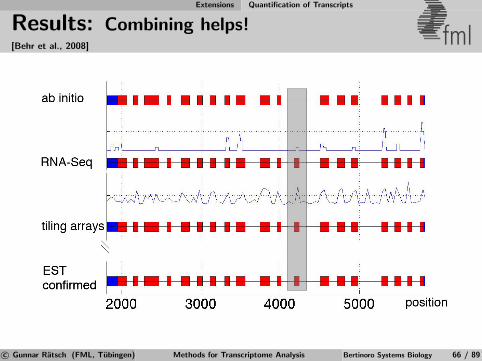
Extensions Quantification of Transcripts
Results: Combining helps![Behr et al., 2008] fml
c© Gunnar Ratsch (FML, Tubingen) Methods for Transcriptome Analysis Bertinoro Systems Biology 66 / 89
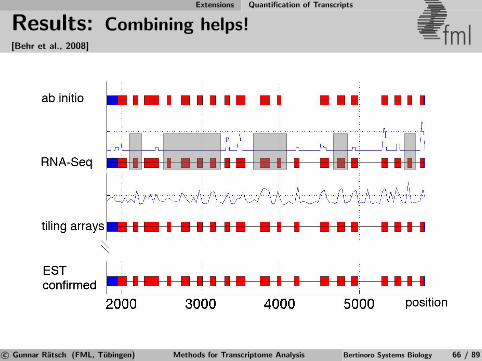
Extensions Quantification of Transcripts
Results: Combining helps![Behr et al., 2008] fml
c© Gunnar Ratsch (FML, Tubingen) Methods for Transcriptome Analysis Bertinoro Systems Biology 66 / 89
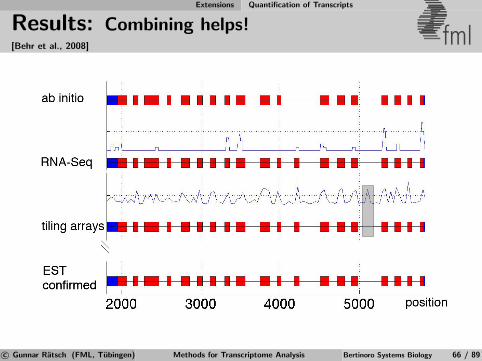
Extensions Quantification of Transcripts
Results: Combining helps![Behr et al., 2008] fml
c© Gunnar Ratsch (FML, Tubingen) Methods for Transcriptome Analysis Bertinoro Systems Biology 66 / 89
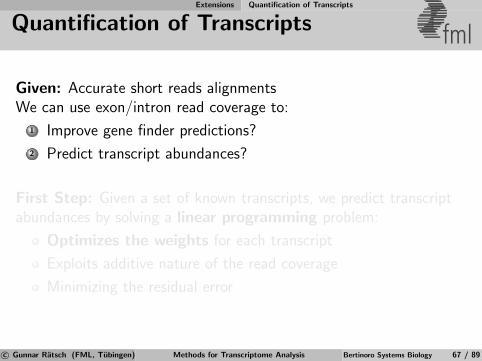
Extensions Quantification of Transcripts
Quantification of Transcripts fml
Given: Accurate short reads alignmentsWe can use exon/intron read coverage to:
1 Improve gene finder predictions?
2 Predict transcript abundances?
First Step: Given a set of known transcripts, we predict transcriptabundances by solving a linear programming problem:
Optimizes the weights for each transcript
Exploits additive nature of the read coverage
Minimizing the residual error
c© Gunnar Ratsch (FML, Tubingen) Methods for Transcriptome Analysis Bertinoro Systems Biology 67 / 89
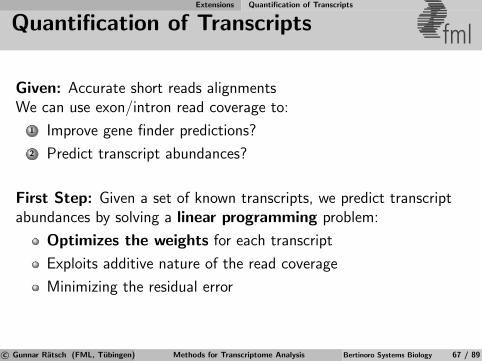
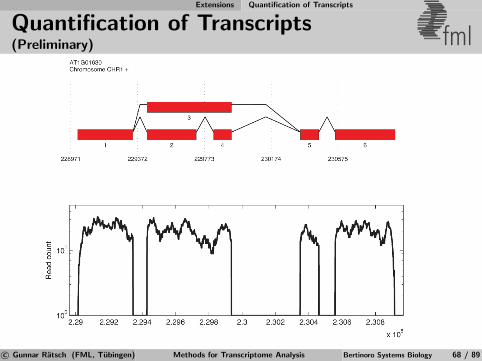
Extensions Quantification of Transcripts
Quantification of Transcripts(Preliminary) fml
c© Gunnar Ratsch (FML, Tubingen) Methods for Transcriptome Analysis Bertinoro Systems Biology 68 / 89
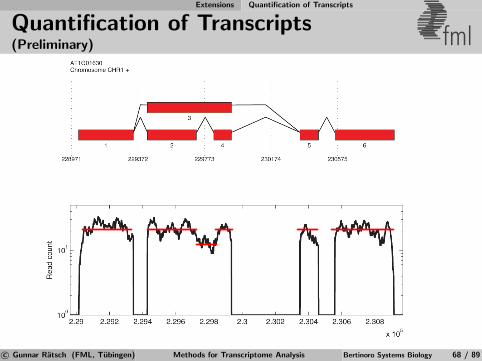
Extensions Quantification of Transcripts
Quantification of Transcripts(Preliminary) fml
c© Gunnar Ratsch (FML, Tubingen) Methods for Transcriptome Analysis Bertinoro Systems Biology 68 / 89
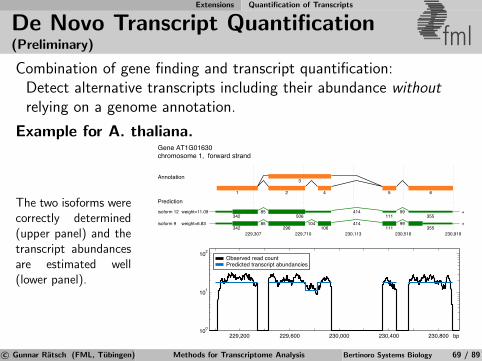
Extensions Quantification of Transcripts
De Novo Transcript Quantification(Preliminary) fmlCombination of gene finding and transcript quantification:
Detect alternative transcripts including their abundance withoutrelying on a genome annotation.
Example for A. thaliana.
The two isoforms werecorrectly determined(upper panel) and thetranscript abundancesare estimated well(lower panel).
Gene AT1G01630chromosome 1, forward strand
+
+
229,200 229,600 230,000 230,400 230,800100
101
102
bp
Observed read countPredicted transcript abundancies
weight=6.83 342 296 106 111 355
85 104 414 99
weight=11.09 342 506 111 355
85 414 99
1 2
3
4 5 6
229,307 229,710 230,113 230,516 230,919
isoform 12
isoform 9
Annotation
Prediction
Transcript identification with artifi-cially generated reads from two iso-forms. The first isoform’s average readcoverage is constant 10, while the sec-ond one’s is varied (x-axis). The systemaccurately determines the transcripts in-cluding their abundance (y-axis) shown inblue and green.
c© Gunnar Ratsch (FML, Tubingen) Methods for Transcriptome Analysis Bertinoro Systems Biology 69 / 89

Roadmap fml1 Computational Gene Finding
Identification of Genomic SignalsLearning to Predict mRNA Transcripts
2 Whole-genome Tiling ArraysTechnology and LimitationsIdentification of Expression DifferencesDe Novo Transcript Discovery
3 Next-generation SequencingTechnology & LimitationsAssembly & Read Mapping
4 ExtensionsQuantification of TranscriptsChIP-on-Chip Studies
c© Gunnar Ratsch (FML, Tubingen) Methods for Transcriptome Analysis Bertinoro Systems Biology 70 / 89
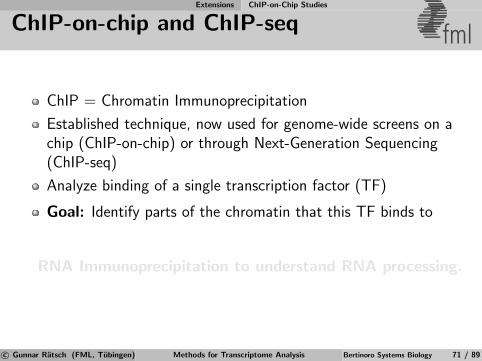
Extensions ChIP-on-Chip Studies
ChIP-on-chip and ChIP-seq fml
ChIP = Chromatin Immunoprecipitation
Established technique, now used for genome-wide screens on achip (ChIP-on-chip) or through Next-Generation Sequencing(ChIP-seq)
Analyze binding of a single transcription factor (TF)
Goal: Identify parts of the chromatin that this TF binds to
RNA Immunoprecipitation to understand RNA processing.
c© Gunnar Ratsch (FML, Tubingen) Methods for Transcriptome Analysis Bertinoro Systems Biology 71 / 89
Extensions ChIP-on-Chip Studies
ChIP Protocol: Preparations fml
ChIP: Chromatin Immunoprecipitation
Create antibody against a certain TF:
Identify the TF-coding gene
Transfer gene sequence to a cloning vector
Get cells (E. coli, yeast, . . . ) to express the protein
Extract (correctly folded) protein from cells, purify, then purifyagain
Inject in animal, extract, purify, . . .⇒ Obtain (poly-clonal) antibody
c© Gunnar Ratsch (FML, Tubingen) Methods for Transcriptome Analysis Bertinoro Systems Biology 72 / 89
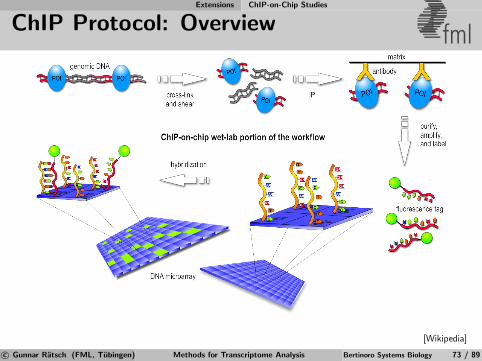
Extensions ChIP-on-Chip Studies
ChIP Protocol: Overview fml
[Wikipedia]
c© Gunnar Ratsch (FML, Tubingen) Methods for Transcriptome Analysis Bertinoro Systems Biology 73 / 89

Extensions ChIP-on-Chip Studies
ChIP-on-chip: Detection fmlTiling arrays or Sequencing analysis pipelines can be used⇒ Similar problems as in transcriptome analysis
Compare with control experiment, e.g. LOF of the TF, calculatep-values of binding probability using a smoothing window
ChIP arrays often analyzed with specialized methods:Model-based Analysis of Tiling-array (MAT), TileMap; TiMAT
ML approaches: Learn expected distribution from regulatoryregion, where binding peak is to be expected(often difficult as labeled data is scarse)
[Provided by Sebastian Schultheiss]
c© Gunnar Ratsch (FML, Tubingen) Methods for Transcriptome Analysis Bertinoro Systems Biology 74 / 89
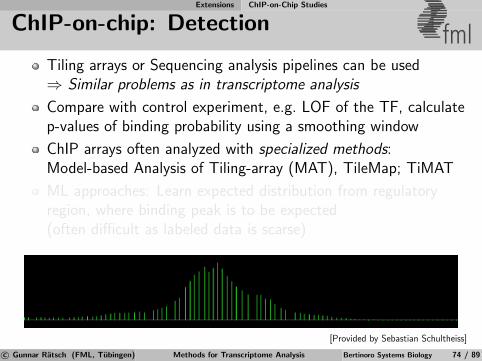
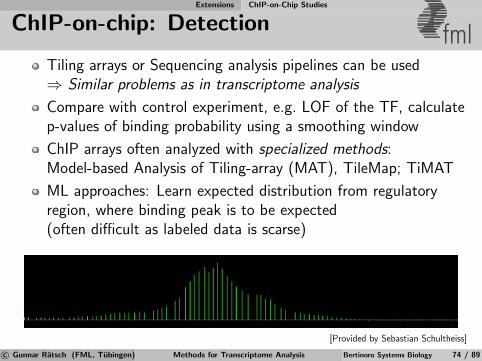
Extensions ChIP-on-Chip Studies
ChIP-on-chip: MAT fml
MAT: Model-based analysis of tiling arrays for ChIP-chip
Idea: Majority of signal is due to non-specific binding, thereare strong probe sequence effects⇒ Formulate an array probe affinity model
[Johnson et al., 2006]
c© Gunnar Ratsch (FML, Tubingen) Methods for Transcriptome Analysis Bertinoro Systems Biology 75 / 89
Extensions ChIP-on-Chip Studies
ChIP-on-chip: MAT fmlAlgorithm:
Divide probes into affinity bins
Sample probe signal variance for every probe per bin (morenumbers makes this more stable than just comparing replicates)
Calculate a t-value t(k) per probe k
Compute trimmed mean TM in sliding window
The central probe of the window from probes i to j will beassigned a MATscorei, j =
√j− i · TMj
k=it(k)
Define a MATscore threshold above which a probe is classifiedas enriched, subtract control experiments if available
Threshold can be found by MAT using a p-value from anon-enriched null sample or a user-supplied FDR
MAT merges all enriched regions within 300 bp and assignsthem the highest MATscore of the region
c© Gunnar Ratsch (FML, Tubingen) Methods for Transcriptome Analysis Bertinoro Systems Biology 76 / 89
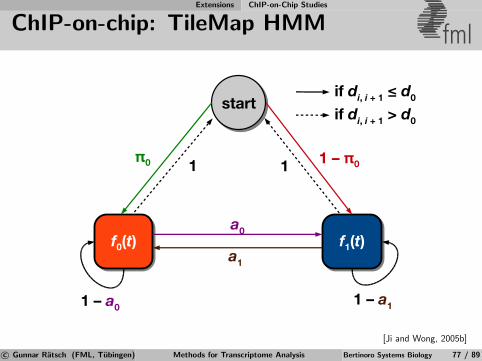
Extensions ChIP-on-Chip Studies
ChIP-on-chip: TileMap HMM fml
start
π0 1
f0(t) f1(t)
1 1 – π0
1 – a0
a1
a0
1 – a1
if di, i + 1 ≤ d0
if di, i + 1 > d0
[Ji and Wong, 2005b]
c© Gunnar Ratsch (FML, Tubingen) Methods for Transcriptome Analysis Bertinoro Systems Biology 77 / 89
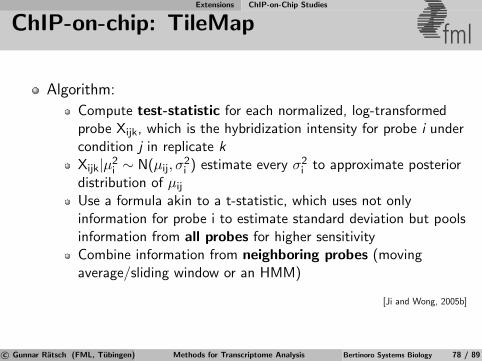
Extensions ChIP-on-Chip Studies
ChIP-on-chip: TileMap fml
Algorithm:
Compute test-statistic for each normalized, log-transformedprobe Xijk, which is the hybridization intensity for probe i undercondition j in replicate kXijk|µ2
i ∼ N(µij, σ2i ) estimate every σ2
i to approximate posteriordistribution of µij
Use a formula akin to a t-statistic, which uses not onlyinformation for probe i to estimate standard deviation but poolsinformation from all probes for higher sensitivityCombine information from neighboring probes (movingaverage/sliding window or an HMM)
[Ji and Wong, 2005b]
c© Gunnar Ratsch (FML, Tubingen) Methods for Transcriptome Analysis Bertinoro Systems Biology 78 / 89

Extensions ChIP-on-Chip Studies
ChIP-on-chip: What do we learn? fml
ChIP-on-chip experiment on known TF(plant stem cell regulator)
Wetlab
Models should be based on transcripts not genes!
c© Gunnar Ratsch (FML, Tubingen) Methods for Transcriptome Analysis Bertinoro Systems Biology 79 / 89
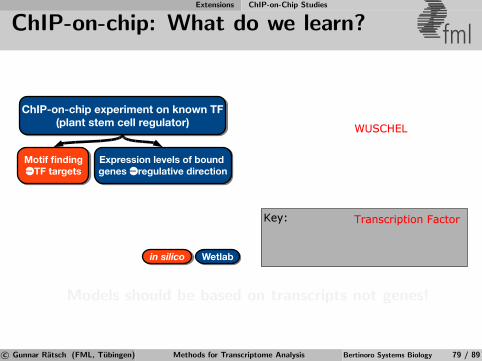
Extensions ChIP-on-Chip Studies
ChIP-on-chip: What do we learn? fml
ChIP-on-chip experiment on known TF(plant stem cell regulator)
Motif fndingÜTF targets
Expression levels of bound genes Üregulative direction
in silico Wetlab
Models should be based on transcripts not genes!
c© Gunnar Ratsch (FML, Tubingen) Methods for Transcriptome Analysis Bertinoro Systems Biology 79 / 89
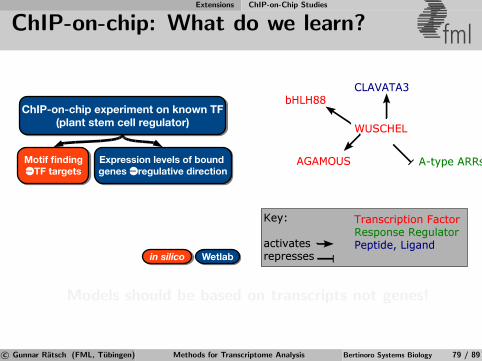
Extensions ChIP-on-Chip Studies
ChIP-on-chip: What do we learn? fml
ChIP-on-chip experiment on known TF(plant stem cell regulator)
Motif fndingÜTF targets
Expression levels of bound genes Üregulative direction
in silico Wetlab
Models should be based on transcripts not genes!
c© Gunnar Ratsch (FML, Tubingen) Methods for Transcriptome Analysis Bertinoro Systems Biology 79 / 89
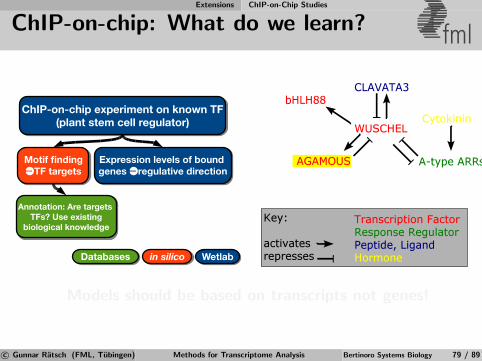
Extensions ChIP-on-Chip Studies
ChIP-on-chip: What do we learn? fml
ChIP-on-chip experiment on known TF(plant stem cell regulator)
Motif fndingÜTF targets
Expression levels of bound genes Üregulative direction
Annotation: Are targets TFs? Use existing
biological knowledge
in silico WetlabDatabases
Models should be based on transcripts not genes!
c© Gunnar Ratsch (FML, Tubingen) Methods for Transcriptome Analysis Bertinoro Systems Biology 79 / 89
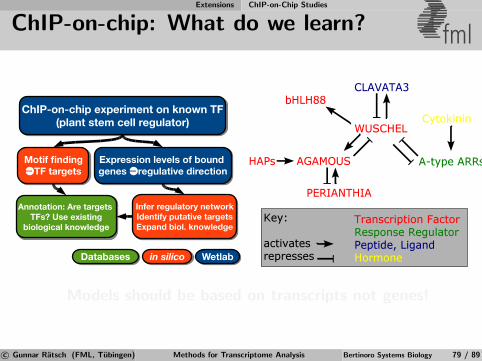
Extensions ChIP-on-Chip Studies
ChIP-on-chip: What do we learn? fml
ChIP-on-chip experiment on known TF(plant stem cell regulator)
Motif fndingÜTF targets
Expression levels of bound genes Üregulative direction
Annotation: Are targets TFs? Use existing
biological knowledge
in silico WetlabDatabases
Infer regulatory networkIdentify putative targetsExpand biol. knowledge
Models should be based on transcripts not genes!
c© Gunnar Ratsch (FML, Tubingen) Methods for Transcriptome Analysis Bertinoro Systems Biology 79 / 89
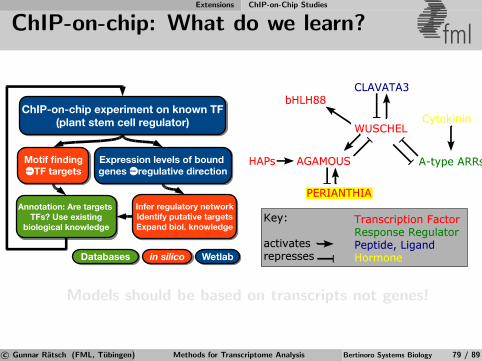
Extensions ChIP-on-Chip Studies
ChIP-on-chip: What do we learn? fml
ChIP-on-chip experiment on known TF(plant stem cell regulator)
Motif fndingÜTF targets
Expression levels of bound genes Üregulative direction
Annotation: Are targets TFs? Use existing
biological knowledge
in silico WetlabDatabases
Infer regulatory networkIdentify putative targetsExpand biol. knowledge
Models should be based on transcripts not genes!
c© Gunnar Ratsch (FML, Tubingen) Methods for Transcriptome Analysis Bertinoro Systems Biology 79 / 89
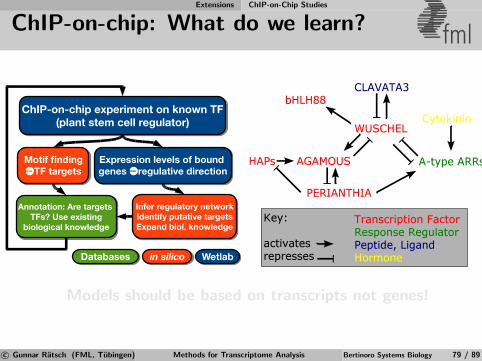
Extensions ChIP-on-Chip Studies
ChIP-on-chip: What do we learn? fml
ChIP-on-chip experiment on known TF(plant stem cell regulator)
Motif fndingÜTF targets
Expression levels of bound genes Üregulative direction
Annotation: Are targets TFs? Use existing
biological knowledge
in silico WetlabDatabases
Infer regulatory networkIdentify putative targetsExpand biol. knowledge
Models should be based on transcripts not genes!
c© Gunnar Ratsch (FML, Tubingen) Methods for Transcriptome Analysis Bertinoro Systems Biology 79 / 89
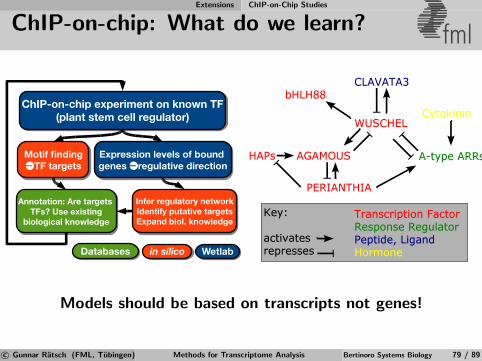
Extensions ChIP-on-Chip Studies
ChIP-on-chip: What do we learn? fml
ChIP-on-chip experiment on known TF(plant stem cell regulator)
Motif fndingÜTF targets
Expression levels of bound genes Üregulative direction
Annotation: Are targets TFs? Use existing
biological knowledge
in silico WetlabDatabases
Infer regulatory networkIdentify putative targetsExpand biol. knowledge
Models should be based on transcripts not genes!
c© Gunnar Ratsch (FML, Tubingen) Methods for Transcriptome Analysis Bertinoro Systems Biology 79 / 89
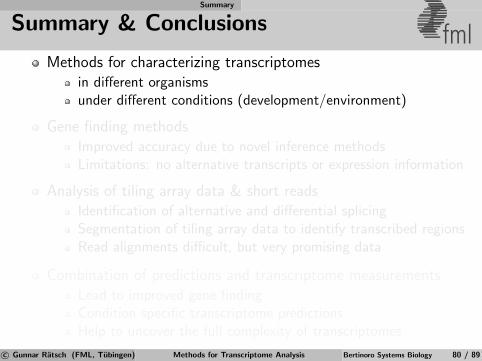
Summary
Summary & Conclusions fmlMethods for characterizing transcriptomes
in different organismsunder different conditions (development/environment)
Gene finding methodsImproved accuracy due to novel inference methodsLimitations: no alternative transcripts or expression information
Analysis of tiling array data & short readsIdentification of alternative and differential splicingSegmentation of tiling array data to identify transcribed regionsRead alignments difficult, but very promising data
Combination of predictions and transcriptome measurementsLead to improved gene findingCondition specific transcriptome predictionsHelp to uncover the full complexity of transcriptomes
c© Gunnar Ratsch (FML, Tubingen) Methods for Transcriptome Analysis Bertinoro Systems Biology 80 / 89
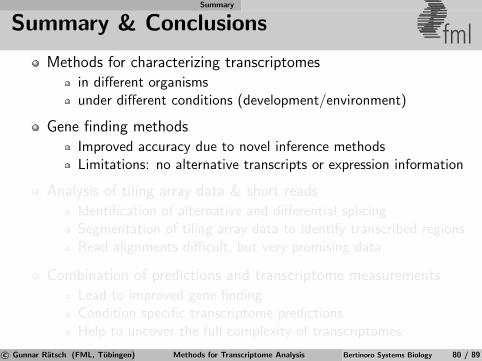
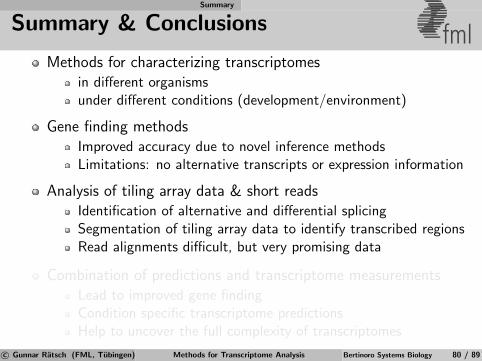
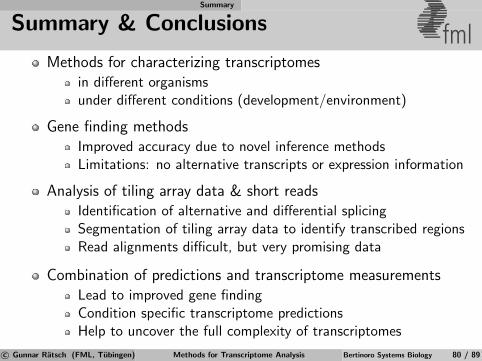

Summary
Acknowledgments fmlGene Finding
Gabi Schweikert (FML)
Jonas Behr (FML)
Alex Zien (FML & FIRST)
Georg Zeller (FML & MPI)
Tiling Arrays
Georg Zeller (FML & MPI)
Johannes Eichner (FML)
Sascha Laubinger (MPI)
Detlef Weigel (MPI)
Short Read Analysis
Fabio De Bona (FML)
Stephan Ossowski (MPI)
Korbinian Schneeberger (MPI)
CHiP-on-Chip
Sebastian Schultheiss(FML & Uni HD)
Jan Lohmann (Uni HD)
More Information
http://www.fml.mpg.de/raetsch
Slides with references are available onlinec© Gunnar Ratsch (FML, Tubingen) Methods for Transcriptome Analysis Bertinoro Systems Biology 81 / 89
Summary
Acknowledgments Thank you! fmlGene Finding
Gabi Schweikert (FML)
Jonas Behr (FML)
Alex Zien (FML & FIRST)
Georg Zeller (FML & MPI)
Tiling Arrays
Georg Zeller (FML & MPI)
Johannes Eichner (FML)
Sascha Laubinger (MPI)
Detlef Weigel (MPI)
Short Read Analysis
Fabio De Bona (FML)
Stephan Ossowski (MPI)
Korbinian Schneeberger (MPI)
CHiP-on-Chip
Sebastian Schultheiss(FML & Uni HD)
Jan Lohmann (Uni HD)
More Information
http://www.fml.mpg.de/raetsch
Slides with references are available onlinec© Gunnar Ratsch (FML, Tubingen) Methods for Transcriptome Analysis Bertinoro Systems Biology 81 / 89
Summary
References I
J. Behr, G. Schweikert, J. Cao, F. De Bona, G. Zeller, S. Laubinger, S. Ossowski,K. Schneeberger, D. Weigel, and G. Ratsch. Rna-seq and tiling arrays for improved genefinding. URL http:
//www.fml.tuebingen.mpg.de/raetsch/lectures/RaetschGenomeInformatics08.pdf.Oral presentation at the CSHL Genome Informatics Meeting, September 2008.
M. Bergkessel, G. Wilmes, and C. Guthrie. Snapshot: Formation of mrnps. Cell, 136, January2009.
Paul Bertone, Viktor Stolc, Thomas E Royce, Joel S Rozowsky, Alexander E Urban, XiaoweiZhu, John L Rinn, Waraporn Tongprasit, Manoj Samanta, Sherman Weissman, MarkGerstein, and Michael Snyder. Global identification of human transcribed sequences withgenome tiling arrays. Science, 306(5705):2242–6, Dec 2004. doi: 10.1126/science.1103388.
RM Clark, G Schweikert, C Toomajian, S Ossowski, G Zeller, P Shinn, N Warthmann, TT Hu,G Fu, DA Hinds, H Chen, KA Frazer, DH Huson, B Scholkopf, M Nordborg, G Ratsch,JR Ecker, and D Weigel. Common sequence polymorphisms shaping genetic diversity inarabidopsis thaliana. Science, 317(5836):338–342, 2007. ISSN 1095-9203 (Electronic). doi:10.1126/science.1138632.
A. Coghlan, T.J. Fiedler, S.J. McKay, P. Flicek, T.W. Harris, D. Blasiar, The nGASPConsortium, and L.D. Stein. ngasp: the nematode genome annotation assessment project.BMC Bioinformatics, 2008. submitted.
c© Gunnar Ratsch (FML, Tubingen) Methods for Transcriptome Analysis Bertinoro Systems Biology 82 / 89
Summary
References II
Lior David, Wolfgang Huber, Marina Granovskaia, Joern Toedling, Curtis J Palm, Lee Bofkin,Ted Jones, Ronald W Davis, and Lars M Steinmetz. A high-resolution map of transcriptionin the yeast genome. Proc Natl Acad Sci USA, 103(14):5320–5, Apr 2006. doi:10.1073/pnas.0601091103.
F. De Bona, S. Ossowski, K. Schneeberger, and G. Ratsch. Qpalma: Optimal splicedalignments of short sequence reads. Bioinformatics, 24:i174–i180, 2008.
Jiang Du, Joel S Rozowsky, Jan O Korbel, Zhengdong D Zhang, Thomas E Royce, Martin HSchultz, Michael Snyder, and Mark Gerstein. A supervised hidden markov model frameworkfor efficiently segmenting tiling array data in transcriptional and chip-chip experiments:systematically incorporating validated biological knowledge. Bioinformatics, 22(24):3016–24,Dec 2006. doi: 10.1093/bioinformatics/btl515.
R Durbin, S Eddy, A Krogh, and G Mitchison. Biological Sequence Analysis: Probabilisticmodels of protein and nucleic acids. Cambridge University Press, 1998.
J. Eichner. Analysis of alternative transcripts in arabidopsis thaliana with whole genome arrays.Master’s thesis, University of Tubingen, Sand 13, 72076 Tubingen, Germany, June 2008.
J. Eichner, G. Zeller, S. Laubinger, D. Weigel, and G. Ratsch. Analysis of alternative transcriptsin arabidopsis thaliana with whole genome arrays. forthcoming, March 2009.
c© Gunnar Ratsch (FML, Tubingen) Methods for Transcriptome Analysis Bertinoro Systems Biology 83 / 89
Summary
References III
Housheng He, Jie Wang, Tao Liu, X Shirley Liu, Tiantian Li, Yunfei Wang, Zuwei Qian, HaixiaZheng, Xiaopeng Zhu, Tao Wu, Baochen Shi, Wei Deng, Wei Zhou, Geir Skogerbø, andRunsheng Chen. Mapping the c. elegans noncoding transcriptome with a whole-genometiling microarray. Genome Research, 17(10):1471–7, Oct 2007. doi: 10.1101/gr.6611807.
Wolfgang Huber, Joern Toedling, and Lars M Steinmetz. Transcript mapping with high-densityoligonucleotide tiling arrays. Bioinformatics, 22(16):1963–70, Aug 2006. doi:10.1093/bioinformatics/btl289. URLhttp://bioinformatics.oxfordjournals.org/cgi/content/full/22/16/1963.
Rafael A Irizarry, Benjamin M Bolstad, Francois Collin, Leslie M Cope, Bridget Hobbs, andTerence P Speed. Summaries of affymetrix genechip probe level data. Nucleic AcidsResearch, 31(4):e15, Feb 2003.
Hongkai Ji and Wing Hung Wong. Tilemap: create chromosomal map of tiling arrayhybridizations. Bioinformatics, 21(18):3629–36, Sep 2005a. doi:10.1093/bioinformatics/bti593. URLhttp://bioinformatics.oxfordjournals.org/cgi/content/full/21/18/3629.
Hongkai Ji and Wing Hung Wong. Tilemap: create chromosomal map of tiling arrayhybridizations. Bioinformatics, 21(18):3629–3636, Sep 2005b. ISSN 1367-4803 (Print). doi:10.1093/bioinformatics/bti593.
c© Gunnar Ratsch (FML, Tubingen) Methods for Transcriptome Analysis Bertinoro Systems Biology 84 / 89
Summary
References IV
W Evan Johnson, Wei Li, Clifford A Meyer, Raphael Gottardo, Jason S Carroll, Myles Brown,and X Shirley Liu. Model-based analysis of tiling-arrays for chip-chip. Proc Natl Acad Sci US A, 103(33):12457–12462, Aug 2006. ISSN 0027-8424 (Print). doi:10.1073/pnas.0601180103.
Dione Kampa, Jill Cheng, Philipp Kapranov, Mark Yamanaka, Shane Brubaker, Simon Cawley,Jorg Drenkow, Antonio Piccolboni, Stefan Bekiranov, Gregg Helt, Hari Tammana, andThomas R Gingeras. Novel rnas identified from an in-depth analysis of the transcriptome ofhuman chromosomes 21 and 22. Genome Research, 14(3):331–42, Mar 2004. doi:10.1101/gr.2094104. URL http://genome.cshlp.org/cgi/content/full/14/3/331.
Todd C Mockler, Simon Chan, Ambika Sundaresan, Huaming Chen, Steven E Jacobsen, andJoseph R Ecker. Applications of dna tiling arrays for whole-genome analysis. Genomics, 85(1):1–15, Jan 2005. doi: 10.1016/j.ygeno.2004.10.005.
Kasper Munch, Paul P Gardner, Peter Arctander, and Anders Krogh. A hidden markov modelapproach for determining expression from genomic tiling micro arrays. BMC Bioinformatics,7:239, Jan 2006. doi: 10.1186/1471-2105-7-239.
Ossowski. Next generation sequencing. Oral presentation at the PhD Symposium in Tubingen,Germany, November 2007.
S. Ossowski, K. Schneeberger, R. Clark, C. Lanz, N. Warthmann, and D. Weigel. Sequencing ofnatural strains of arabidopsis thaliana with short reads. Genome Research, 18(2024–2033),2008.
c© Gunnar Ratsch (FML, Tubingen) Methods for Transcriptome Analysis Bertinoro Systems Biology 85 / 89
Summary
References V
E Purdom, K M Simpson, M D Robinson, J G Conboy, A V Lapuk, and T P Speed. Firma: amethod for detection of alternative splicing from exon array data. Bioinformatics, 24(15):1707–14, Aug 2008. doi: 10.1093/bioinformatics/btn284. URLhttp://bioinformatics.oxfordjournals.org/cgi/content/full/24/15/1707.
G. Ratsch and S. Sonnenburg. Accurate splice site detection for Caenorhabditis elegans. InK. Tsuda B. Schoelkopf and J.-P. Vert, editors, Kernel Methods in Computational Biology.MIT Press, 2004.
G. Ratsch, S. Sonnenburg, and B. Scholkopf. RASE: recognition of alternatively spliced exonsin C. elegans. Bioinformatics, 21(Suppl. 1):i369–i377, June 2005.
Thomas E Royce, Nicholas J Carriero, and Mark B Gerstein. An efficient pseudomedian filter fortiling microrrays. BMC Bioinformatics, 8:186, Jan 2007a. doi: 10.1186/1471-2105-8-186.
Thomas E Royce, Joel S Rozowsky, and Mark B Gerstein. Assessing the need forsequence-based normalization in tiling microarray experiments. Bioinformatics, 23(8):988–97, Apr 2007b. doi: 10.1093/bioinformatics/btm052. URLhttp://bioinformatics.oxfordjournals.org/cgi/content/full/23/8/988.
Manoj Pratim Samanta, Waraporn Tongprasit, Himanshu Sethi, Chen-Shan Chin, and ViktorStolc. Global identification of noncoding rnas in saccharomyces cerevisiae by modulating anessential rna processing pathway. Proc Natl Acad Sci USA, 103(11):4192–7, Mar 2006. doi:10.1073/pnas.0507669103.
c© Gunnar Ratsch (FML, Tubingen) Methods for Transcriptome Analysis Bertinoro Systems Biology 86 / 89

Summary
References VI
G. Schweikert, G. Zeller, A. Zien, J. Behr, C.S. Ong, P. Philips, A. Bohlen, R. Bohnert, F. DeBona, S. Sonnenburg, and G. Ratsch. mGene: Accurate computational gene finding withapplication to nematode genomes. under revision for Genome Research, March 2009.
S. Sonnenburg, G. Ratsch, A. Jagota, and K.-R. Muller. New methods for splice-siterecognition. In Proc. International Conference on Artificial Neural Networks, 2002.
S Sonnenburg, G Schweikert, P Philips, J Behr, and G Ratsch. Accurate splice site predictionusing support vector machines. BMC Bioinformatics, 8 Suppl 10:S7, 2007. ISSN 1471-2105(Electronic). doi: 10.1186/1471-2105-8-S10-S7.
Soren Sonnenburg, Alexander Zien, and Gunnar Ratsch. ARTS: Accurate Recognition ofTranscription Starts in Human. Bioinformatics, 22(14):e472–480, 2006.
John D Storey and Robert Tibshirani. Statistical significance for genomewide studies. Proc NatlAcad Sci USA, 100(16):9440–5, Aug 2003. doi: 10.1073/pnas.1530509100.
Charles W Sugnet, Karpagam Srinivasan, Tyson A Clark, Georgeann O’brien, Melissa S Cline,Hui Wang, Alan Williams, David Kulp, John E Blume, David Haussler, and Manuel Ares.Unusual intron conservation near tissue-regulated exons found by splicing microarrays. PLoSComput Biol, 2(1):e4, Jan 2006. doi: 10.1371/journal.pcbi.0020004.
c© Gunnar Ratsch (FML, Tubingen) Methods for Transcriptome Analysis Bertinoro Systems Biology 87 / 89

Summary
References VII
Marc Sultan, Marcel H Schulz, Hugues Richard, Alon Magen, Andreas Klingenhoff, MatthiasScherf, Martin Seifert, Tatjana Borodina, Aleksey Soldatov, Dmitri Parkhomchuk, DominicSchmidt, Sean O’Keeffe, Stefan Haas, Martin Vingron, Hans Lehrach, and Marie-LaureYaspo. A global view of gene activity and alternative splicing by deep sequencing of thehuman transcriptome. Science, 321(5891):956–960, 2008. ISSN 1095-9203 (Electronic).doi: 10.1126/science.1160342.
I. Sutskever. Arachne: A whole genome shotgun assembler. oral presentation, 2008.
E.T. Wang, R. Sandberg, S. Luo, I. Khrebtukova, L. Zhang, C. Mayr, S.F. Kingsmore, G.P.Schroth, and C.B. Burge. Alternative isoform regulation in human tissue transcriptomes.Nature, 456(7221):470–476, 2008. ISSN 1476-4687 (Electronic). doi: 10.1038/nature07509.
Junshi Yazaki, Brian D Gregory, and Joseph R Ecker. Mapping the genome landscape usingtiling array technology. Current Opinion in Plant Biology, 10(5):534–42, Oct 2007. doi:10.1016/j.pbi.2007.07.006. URL http:
//www.sciencedirect.com/science? ob=ArticleURL& udi=B6VS4-4PG2S31-1& user=
29041& rdoc=1& fmt=& orig=search& sort=d&view=c& acct=C000003178& version=
1& urlVersion=0& userid=29041&md5=80ec1d3e091fd96a9f662289f6584c05.
G Zeller, RM Clark, K Schneeberger, A Bohlen, D Weigel, and G Ratsch. Detectingpolymorphic regions in arabidopsis thaliana with resequencing microarrays. Genome Res, 18(6):918–929, 2008a. ISSN 1088-9051 (Print). doi: 10.1101/gr.070169.107.
c© Gunnar Ratsch (FML, Tubingen) Methods for Transcriptome Analysis Bertinoro Systems Biology 88 / 89
Summary
References VIII
G. Zeller, S. Henz, S. Laubinger, D. Weigel, and G. Ratsch. Transcript normalization andsegmentation of tiling array data. In Proc. PSB 2008. World Scientific, 2008b.
G Zeller, S Henz, C Widmer, T Sachsenberg, G Ratsch, D Weigel, and S Laubinger.Stress-induced changes in the arabidopsis thaliana transcriptome analyzed using wholegenome tiling arrays. Plant J, Feb 2009. doi: 10.1111/j.1365-313X.2009.03835.x.
Georg Zeller, Stefan R Henz, Sascha Laubinger, Detlef Weigel, and Gunnar Ratsch. Transcriptnormalization and segmentation of tiling array data. Pacific Symposium on BiocomputingPacific Symposium on Biocomputing, pages 527–38, Jan 2008c.
D.R. Zerbino and E. Birney. Velvet: Algorithms for de novo short read assembly using de bruijngraphs. Genome Research, 18:828–829, 2008.
A. Zien, G. Ratsch, S. Mika, B. Scholkopf, T. Lengauer, and K.-R. Muller. Engineering SupportVector Machine Kernels That Recognize Translation Initiation Sites. BioInformatics, 16(9):799–807, September 2000.
c© Gunnar Ratsch (FML, Tubingen) Methods for Transcriptome Analysis Bertinoro Systems Biology 89 / 89