ngauranga to airport - travel demand management
TRANSCRIPT

Ngauranga to Airport - Travel Demand Management
Let's Get Wellington Moving
Stage 2 Report
| Final
13 November 2017
928PN
Stage 2 R eport
Let's Get Wellington Movi ng

Stage 2 Report
i
Ngauranga to Airport - Travel Demand Management
Project No: IZ073200
Document Title: Stage 2 Report
Document No.:
Revision: Final
Date: 13 November 2017
Client Name: Let's Get Wellington Moving
Client No: 928PN
Project Manager: Claire Ashburn and Bruce Walton
Author: Terri Bell
File Name: J:\IE\Projects\02_New Zealand\IZ073200\02 Documents\Stage 2\Ngauranga to Airport
Stage 2_RevE_Final.docx
Jacobs New Zealand Limited
Level 3, 86 Customhouse Quay,
PO Box 10-283
Wellington, New Zealand
T +64 4 473 4265
F +64 4 473 3369
www.jacobs.com
© Copyright 2017 Jacobs New Zealand Limited. The concepts and information contained in this document are the property of Jacobs. Use or
copying of this document in whole or in part without the written permission of Jacobs constitutes an infringement of copyright.
Limitation: This document has been prepared on behalf of, and for the exclusive use of Jacobs’ client, and is subject to, and issued in accordance with, the
provisions of the contract between Jacobs and the client. Jacobs accepts no liability or responsibility whatsoever for, or in respect of, any use of, or reliance
upon, this document by any third party.
Document history and status
Revision Date Description By Review Approved
A 22 May 2017 Draft for Workshop CA AL BW
B 31 May 2017 Final Draft for Comment CA AL BW
C 23 June 2017 Working revised report for client comment TB BW AB
D 7 July 2017 Rev D report for client comment TB BW AB
E 13 November
2017
Final revision TB BW AB

Stage 2 Report
ii
Contents
1. Introduction ................................................................................................................................................ 1
1.1 Purpose of the report ................................................................................................................................... 1
1.2 Travel demand management ...................................................................................................................... 2
1.3 Project partners ........................................................................................................................................... 3
2. Let’s Get Wellington Moving .................................................................................................................... 4
3. Short list of TDM measures ...................................................................................................................... 7
3.1 Process overview ........................................................................................................................................ 7
3.2 Shortlisting ................................................................................................................................................... 7
3.3 Short list of measures .................................................................................................................................. 8
4. Packages of measures ............................................................................................................................ 19
4.1 Key considerations for modelling approach .............................................................................................. 20
5. Next Steps ................................................................................................................................................ 22
Appendix A. Stage 1 Long list of TDM interventions
Table of Figures:
Figure 1 : Indicative Focus Area ..............................................................................................................................4 Figure 2 : Process to identify potential TDM Packages for Let’s Get Wellington Moving .......................................7 Figure 3: Overview of broad areas of measures ease of implementation and effectiveness ............................... 20
List of Tables:
Table 1: Let’s Get Wellington Moving Guiding Principles ........................................................................................5
Table 2: Workshop overview ...................................................................................................................................7
Table 3: TDM measures which were not taken forward to short list........................................................................8
Table 4: Short list of TDM measures .......................................................................................................................9
Table 5: Measure 1 – Congestion charging.......................................................................................................... 11
Table 6: Measure 2 – Dynamic / Optimised Parking ............................................................................................ 12
Table 7: Measure 3 – High Occupancy Priority .................................................................................................... 13
Table 8: Measure 4 – Improved Active Modes Infrastructure............................................................................... 14
Table 9: Measure 5 – Promoting cycling and active mode uptake through behavioural change ......................... 16
Table 10: Measure 6 – Improved Public Transport Amenity ................................................................................ 17
Table 11: Measure 7 – Travel Planning ................................................................................................................ 18
Table 12: Packages of measures ......................................................................................................................... 19

Stage 2 Report
1
1. Introduction
Wellington is a great place to live, work and visit. However, the transport system is starting to impact on
Wellington’s liveability, and its economic growth and productivity. Let’s Get Wellington Moving1 has identified
Wellington’s transport problems to include growing traffic congestion and unreliable journey times; poor and
declining levels of service; safety issues, especially for cycling and walking; vulnerability to disruption from
unplanned events; and transport for Wellington’s future2.
It is projected that by 2030 passenger numbers at Wellington airport will more than double; and by 2043 there
will be 24,000 more jobs and 46,000 more people living in Wellington City3. This means more people travelling
into, out of, and through central Wellington. Therefore, improvements are needed to make the transport system
work for everyone, and make the most of what the city has to offer.
Wellington’s unique geography, compact city, and small number of transport corridors means transport
challenges are complex to solve and trade-offs will be required. However, with the right mix of improvements,
big gains can be made for Wellington’s future.
Let’s Get Wellington Moving is a joint initiative between the New Zealand Transport Agency (NZTA), Wellington
City Council (WCC) and the Greater Wellington Regional Council (GWRC). The initiative is developing
packages of possible transport solutions – called scenarios - to help meet the public’s aspirations for how the
city looks, feels, and functions, and support Wellington’s growth, while making it safer and easier for people to
get around. The Let’s Get Wellington Moving initiative is working to present a short list of scenarios to the public
for feedback in late 2017.
This process involves examining a wide range of ideas – or possible interventions - about how to improve
transport in Wellington, combining the more promising interventions into possible scenarios, evaluating these
scenarios against the programme principles and objectives, and selecting a short list.
The initiative has gathered extensive data about Wellington’s transport network and is using this information to
better understand travel patterns and to help build a series of transport models and assessment tools to support
decisions on Wellington’s transport future.
Jacobs was engaged by the Let’s Get Wellington Moving to identify possible Travel Demand Management
(TDM) measures which are most applicable within a Wellington context and provide value for money. The Let’s
Get Wellington Moving initiative will then be able to include possible TDM measures in the scenarios and
assess their impacts using transport models and assessment tools for detailed consideration.
1.1 Purpose of the report
The identification of TDM measures has been undertaken in two stages, with the first stage undertaken by
Jacobs in early 2017.
The first stage developed a long list of TDM measures; identified which TDM measures have already been
implemented in Wellington; and undertook research into international examples. The long list was evaluated
with project partners against the Let’s Get Wellington Moving evaluation framework. The outcome of Stage 1
was the identification of TDM measures considered most applicable within a Wellington context.
1 A joint initiative between the New Zealand Transport Agency (NZTA), Wellington City Council (WCC) and the Greater Wellington Regional
Council (GWRC) 2 http://getwellymoving.co.nz/ 3 http://getwellymoving.co.nz/

Stage 2 Report
2
This report documents the outcomes of Stage 2. A short list of TDM measures was identified that were
considered most appropriate to Wellington and most likely to provide value for money. These were categorised
into three broad groups based on the primary method by which they influence travel behaviour; these categories
include:
Smart Mobility – this grouping focussed on ‘soft’ measures such as travel planning and marketing;
Reallocation of road space – using physical changes to the road network in order to influence travel
behaviours; and
Charging to manage demand – measures which charge roads users for use of one or more
infrastructure facilities.
For each of the TDM measures key considerations were captured including interdependencies; benefits;
barriers to implementation; and the level of investment that might be required. This information was used to
develop high, medium and low levels of intervention for each measure in order to generate indicative packages
of TDM measures.
The packages were developed to allow them to be included in the broader Let’s Get Wellington Moving
scenarios that are being developed as part of the wider project. Guidance on how they could best be
represented within the transport models available is provided later in this report.
1.2 Travel demand management
TDM describes a wide range of initiatives that influences travel behaviour to optimise transport system efficiency
through measures that shift passengers from single-occupancy vehicle travel to re-time (i.e. travel out of peak
hours); to re-mode (i.e. shift to cycling or public transport); to re-route (i.e. use a less congested route); or to
reduce the need to travel (i.e. work from home). The measures can influence travel behaviour including how,
when and where people travel. Determining who is travelling and why they are travelling will lead to discovering
the best TDM measures to use in a situation, for example when preparing workplace travel plans it is important
to undertake staff surveys to identify suitable TDM measures to implement.
TDM measures can be split into two broad categories, hard and soft measures. Hard TDM measures are those
such as road pricing and physical improvements of infrastructure which support alternatives modes. Soft
measures are everything else, from policy changes to car sharing initiatives, that seek to change people’s
perception of, or willingness to use, different modes.
The TDM measures can also be described as a push or pull factor. Push factors provide users with an incentive
to change their travel behaviour through making their current modal choice appear less attractive, for example
parking charges or road pricing. In contrast to push factors, pull factors are designed to increase the
attractiveness of other transport modes and include TDM measures that encourage change in travel behaviour,
for example public transport passes.
With the right mix of TDM pull and push factors and hard and soft measures, a TDM program can be effective in
influencing travel behaviour to optimise a transport system. Obtaining public acceptance for TDM measures is
an important factor in their implementation. A package of only “push” measures may be seen as punitive or
revenue raising, leading to public resistance.

Stage 2 Report
3
1.3 Project partners
The identification of TDM interventions and packages for further investigation has been undertaken in
partnership with Let’s Get Wellington Moving, including:
Greater Wellington Regional Council
o Melanie Thornton
o Harriet Shelton
o Paul Kos
o Andrew Ford
Wellington City Council
o Gunther Wild
o Paul Barker
o Joe Hewitt
o Hugh Wilson
o Luci Desrosiers
o Tom Pettit
New Zealand Transport Agency
o Amy Kearse
o Kesh Keshaboina

Stage 2 Report
4
2. Let’s Get Wellington Moving
The indicative focus area of Let’s Get Wellington Moving is from Ngauranga Gorge to the Wellington Airport, as
shown in Figure 1. This includes the Wellington Urban Motorway and connections to the Wellington Hospital
and the eastern and southern suburbs. This study has focused on TDM measures that target trips through and
within this study area.
Figure 1 : Indicative Focus Area4
As part of this initiative, Let’s Get Wellington Moving has started a conversation with the people of Wellington
about the city’s transport challenges and gathered extensive data about the transport network. This information
will help to better understand travel patterns and build a series of transport models and assessment tools to
support decisions on Wellington’s transport future.
Let’s Get Wellington Moving has used the public’s feedback to develop 12 guiding principles; to help identify the
key problems on the network; and to define the objectives for the Let’s Get Wellington Moving programme.
4 Let’s Get Wellington Moving Progress Report, Feb 2017

Stage 2 Report
5
The objectives5 are to develop a transport system that:
Enhances the liveability of the central city
Provides more efficient and reliable access for users
Reduces reliance on private vehicle travel
Improves safety for all users
Is adaptable to disruptions and future uncertainty
The guiding principles are included in Table 1.
Table 1: Let’s Get Wellington Moving Guiding Principles6
1
Accessible, healthy and safe Be socially inclusive and recognise the personal safety, access and health needs of all. Through a transport system that meets the varied access needs of people of all demographics across the region, wherever they need to travel.
2
Better public transport Significantly enhance public transport and increase its use. Through improvements in the level of service across all public transport to make it easier to get around the region.
3
Clean and green Improve environmental outcomes for the city and the region. Through a transport system that respects nature and makes a positive contribution to environmental improvement.
4
Compact city Reclaim urban space to support a compact and liveable city. Through a transport system that minimises traffic in the CBD and ensures ease of access to facilities, entertainment and jobs.
5
Demand and supply Recognise that we need to do more than just build infrastructure and consider a range of ways to manage travel demand and supply across the network. Through a transport system that has a range of costs and incentives in place to encourage change in network use.
6
Future-proof and resilient Provide a transport system that is adaptable and future-proofed for urban growth and resilient to natural hazards and climate change. Planning for the impact that social, economic and technological change may have on travel and lifestyle preferences and recognising the role of transport services in encouraging urban development where we want it.
7
Past, present, future Respect the importance of character and heritage in New Zealand’s capital city. Through a transport system that ensures infrastructure developments are integrated with their built environment.
8
Predictable travel times Significantly reduce the impact of congestion on journey time predictability for all, at all times. All includes commuters, tourists, movers of freight, tradespeople and anyone travelling to or from the hospital or airport at any time.
9
Set in nature Ensure that Wellington city remains safe and attractive, set in nature and connected to the harbour.
10
Growth Encourage continued economic growth and support population growth and intensification of Wellington city as the economic engine of the region. Through a transport system that provides opportunities for residents and businesses to support the desired growth.
11
Travel choice Provide better transport choices for the region. In alignment with the sustainable transport hierarchy in the Wellington Urban Growth Plan and the Regional Land Transport Plan.
12
Wider view Recognise that there is a wide range of benefits to be realised from integrating urban form and transport thinking, and that increased value should not be measured by cost alone.
5 http://getwellymoving.co.nz/ 6 http://getwellymoving.co.nz/

Stage 2 Report
6
The Let’s Get Wellington Moving team have held workshops to develop possible scenarios. The workshops
highlighted that Wellington’s transport problems are best addressed with a multi-modal approach – a mix of
improvements across different modes such as improvements to walking and cycling facilities, better public
transport, and improvements to roads, rather than focusing on improving just one mode.
Let’s Get Wellington Moving took the scenarios that scored well in the workshops and grouped the interventions
into four focus areas:
1. Better public transport
2. Improving the state highway
3. Active transport improvements (walking and cycling)
4. Managing travel demand
Let’s Get Wellington Moving next steps are to use feedback from the community and workshops, along with the
results of the assessment of the initial long list of scenarios, to help develop a short list of scenarios for public
engagement. This report focuses on the interventions included within the focus area “Managing travel demand”
and is an input into the scenario development.

Stage 2 Report
7
3. Short list of TDM measures
This section provides an overview of the methodology undertaken to identify the short list of possible TDM
measures for further investigation and documents why some measures were not taken forward to the short list.
The short listed TDM measures are described in more detail including their interdependencies; benefits; barriers
to implementation; and the level of investment that might be required.
3.1 Process overview
The process to identify and evaluate possible TDM measures to take forward to a short list for further
investigation has been undertaken with project partners and is summarised in Figure 2.
Figure 2 : Process to identify potential TDM Packages for Let’s Get Wellington Moving
The workshops undertaken to identify the long list and short lists of potential TDM measures is summarised in
Table 2. Alongside these workshops discussions with project partners were undertaken to determine the
existing TDM programmes, benefits and the priorities for future planning.
Table 2: Workshop overview
Workshops Purpose Outcome Attendees
Stage 1 22 November 2016
Long list evaluation against Let’s Get Moving Wellington criteria
Identification of a long list of TDM measures most applicable within a Wellington context
GWRC - Melanie Thornton - Harriet Shelton
NZTA - Amy Kearse (workshop1)
WCC - Gunther Wild
LGWM - Adam Nicholls
Stage 2 22 May 2017
Short list and criteria analysis
Identification of a short list of potential TDM measures for Let’s Get Wellington Moving
3.2 Shortlisting
During Stage 2, a workshop was held on 22nd May 2017 with members of Let’s Get Wellington Moving to
further discuss and evaluate the Stage 1 long list of TDM measures most applicable to Wellington. Appendix A7
includes the long list of TDM measures which were identified in Stage 1.
The workshop and discussions resulted in a short list of potential TDM measures suitable in a Wellington
context. It was felt that some measures were unlikely to be effective in addressing trips through or within the
Let’s Get Wellington Moving study area. In addition, some options already are included within a current
programme. Therefore, if a TDM measure did not align with the assessment criteria below it was not shortlisted.
7 Jacobs, 2017,Let's Get Wellington Moving Travel Demand Management Study, Stage One: Discovery

Stage 2 Report
8
The criteria are as follows:
1. Relevant to the Let’s Get Wellington Moving study area; and
2. Not included/covered in another scheme or programme.
The TDM measures which did not align with the criteria and were not taken forward are detailed in Table 3.
Table 3: TDM measures which were not taken forward to short list
Measure Reason for not being short listed Criteria
1 2
Accident response units
This is an operational approach which was included originally under network management; however the Wellington Traffic Operation Centre is well equipped to respond to accidents already.
X
Ramp Metering This is already being investigated separately as part of a RoNS project (Ngauranga to Aotea Quay) and is considered an operational approach. X
Tidal flow lanes
Other than tunnels, there are unlikely to be any roads within the study area which are suited to tidal flow due to physical configurations and constraints. This measure is also considered to not be covered under ‘TDM’ as it influences traffic efficiency rather than influences travel behaviour change and therefore is considered more suitable to be considered under other programmes.
X X
Allowing bikes on trains during off peak times
This is already allowed (https://www.metlink.org.nz/getting-around/using-a-cycle-on-pt/) X
Spatial plans - Integrating transport and land use planning
Land use planning and policy development is a core component of Let’s Get Wellington Moving. Policy changes to support the land use outcomes, as well as support any proposed TDM measures, will be developed during subsequent stages and haven’t been considered further here.
X
3.3 Short list of measures
Table 4 details the TDM measures which align with the criteria and as such, were identified to continue to the
short list. Through project partner discussions and the Stage 2 workshop the short list of TDM measures were
rationalised into broader groupings that are considered feasible for implementation in Wellington.
The groupings are:
Charging to manage demand, which covers:
o Measure 1: Congestion charging; and
o Measure 2: Dynamic / Optimised parking.
Reallocation of roadspace, which covers:
o Measure 3: High occupancy priority, including public transport; and
o Measure 4: Improved active modes infrastructure.
Smart mobility, which covers:
o Measure 5: Promoting cycling and active mode uptake through behavioural change;
o Measure 6: Improved public transport amenity; and
o Measure 7: Travel Planning.

Stage 2 Report
9
Table 4: Short list of TDM measures
Group Measure Components What does it do?
CH
AR
GIN
G T
O M
AN
AG
E
DE
MA
ND
Measure 1: Congestion charging
Road Pricing Installing a charge to use an infrastructure facility on a time and/or location basis
Measure 2: Dynamic / Optimised parking
Parking Management and smart pricing
Discourages driving through increasing the price of parking based on demand. Smart parking can also act as a guidance system to guide drivers to available parks, reducing circulating traffic.
Unbundled parking Where the cost of renting/owning a car park is separate from building expenses. This encourages a decrease in the supply of parking through allowing residents to only pay for a car park if they require it. This also improves the economics of building near public transport nodes.
Park and Ride (e.g. Provision of subsidised parking at train stations)
Congestion reduction by encouraging people to drive to bus/ train stations and catch public transport into town. To regulate use of park and ride car parks there may be a need to charge for parking costs in the future.
RE
AL
LO
CA
TIO
N O
F
RO
AD
SP
AC
E
Measure 3: High occupancy priority, including public transport
High occupancy toll (HOT) Travel Lanes
Allowing people to pay for using HOV travel lanes when only one person is in the car.
High occupancy vehicle (HOV) priority (e.g. T2 lanes, bus lanes, queue jump lanes)
Increasing network efficiency and the attractiveness of carpooling and public transport by providing fast lanes for vehicles with more than one person.
Public Transport Priority Increasing the attractiveness of public transport through giving it priority over private vehicles. This can make travel time more competitive.
Measure 4: Improved active modes infrastructure
Walking and cycling infrastructure improvements
Increasing the attractiveness of walking and cycling.
Traffic calming Increasing the attractiveness and safety of walking and cycling through reducing the amount and speed of through traffic.
SM
AR
T M
OB
ILIT
Y
Measure 5: Promoting cycling and active mode uptake through behavioural change
Bike sharing (e.g. Provision of bicycle hire schemes)
Allows users to have access to publicly located bicycles, encourages the use of the bicycle as a mainstream transport mode, targets opportune and short trips.
End of Trip Facilities for Walking and Cycling
Increases the attractiveness of walking and cycling by providing facilities for the end of the trip, such as showers, lockers, bicycle parking etc.
Linking cycling and public transport (e.g. Bike-Train)
Targets the egress trips to train stations to be undertaken by bicycle, decreasing the overall journey time and increasing the accessibility of public transport.
Measure 6:
Improved public transport amenity
Simplified public transport fare pricing
Making it easier and cheaper to use public transport by having a consistent pricing structure, based on number of zones you pass through rather than the number of services you take.
Transit Free Zone Public transport users travel free within a certain zone, usually within the CBD area.
Universal access card Making it easier and cheaper to use public transport by having a consistent pricing structure with consistent electronic payment services.
Measure 7:
Travel Planning.
Public Transport Incentives – both government and organisation level
Encourages public transport usage by subsidising the cost of monthly passes, e.g. Subsidised public transport fares as part of employment package. Tax incentives also eliminate financial biases toward car use.
Multimodal access guide Making it easier to get around a city by any mode by identifying the different options along with travel time and cost per trip.
Public Education Reducing car travel demand by informing the public about the different transport modes available.
Ridesharing Increases car occupancy by encouraging people to travel together. Ride sharing and taxi services use private vehicles, e.g. Uber and Lyft.
Tourist transport management
Reducing peak car travel demand by encouraging tourist to use different transport modes/ travel times.
Wayfinding Making it easier to find your way around by walking and cycling.
Work place incentives Alternative work schedules/variable work times; encourage working from home; and using telecommunications will lead to congestion reduction during peak travel times by encouraging flexible working arrangements.
Car free planning (e.g. Car free days)
Closes areas off to motorised traffic for a specific time period so people can experience what their city would be like car free.
Development Travel Plans Travel planning tool for new commercial and residential developments so that provision for other transport modes is taken into consideration.
Logistics Plans - encouraging consolidation of freight
Increases the efficiency of logistics in urban areas and reduces the number of trucks/vans on urban streets.
Stage 2 Report
10
Group Measure Components What does it do?
Personalised Travel Plans Identifies alterative transport modes that meet the needs of individuals.
Improved travel time information
Provides customers with up to date, real time travel time information.
Mobility as a service Mobility as a Service can be considered to be personalised journey information across all modes of transport, including the facility to book and pay for journeys available to a user through their preferred technology. Reduces barriers to access of public transport for non-users
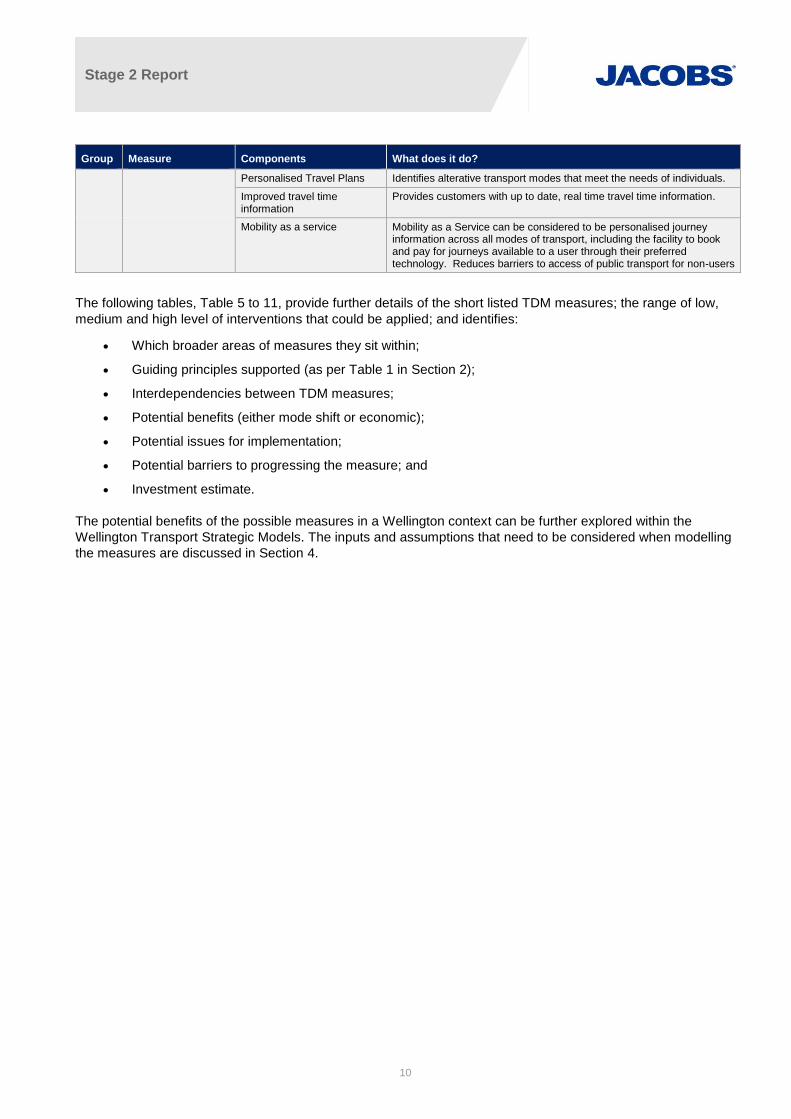
The following tables, Table 5 to 11, provide further details of the short listed TDM measures; the range of low,
medium and high level of interventions that could be applied; and identifies:
Which broader areas of measures they sit within;
Guiding principles supported (as per Table 1 in Section 2);
Interdependencies between TDM measures;
Potential benefits (either mode shift or economic);
Potential issues for implementation;
Potential barriers to progressing the measure; and
Investment estimate.
The potential benefits of the possible measures in a Wellington context can be further explored within the
Wellington Transport Strategic Models. The inputs and assumptions that need to be considered when modelling
the measures are discussed in Section 4.

Stage 2 Report
11
Table 5: Measure 1 – Congestion charging
Grouping: CHARGING TO MANAGE DEMAND Guiding Principles:
Measure 1: Road pricing
Description: Charging motorists for entering a chosen cordoned area or travelling along a particular corridor. The applicability to the Wellington region was examined in a study undertaken for GWRC by SKM: Wellington Region Road Pricing Study – Stage 2 – Technical Report. This study included a
recommendation for the use of a regional pricing strategy. Charging may be varied by time of day to minimise impacts on business in cordoned areas. Different types of charging includes:
Strategic (arterial) Network Charges – Levying a fee for use of a particular route or road;
Full Network Charges – Imposing a charge for any use of a network, most commonly distance or time based;
Area Charge – Levying a charge for use of all public roads within a defined area; and
Cordon Charge – Installing a charge for crossing a defined cordon.
Current
Commitments and
Previous Studies
In February 2007, SKM produced a report for GWRC, Wellington Region Road Pricing Study – Stage 2 – Technical Report. Key findings were8:
o Screenline locations for charging were tested at a number of locations with varying pricing strategies and tested in WTSM. The optimum result was considered to be a combination of southern and medium screenlines.
o Suitable pricing was estimated by the 2007 study to be in the range between $1 and $4.50, dependent on location.
o A CBD cordon was also considered.
For the purposes of this study a similar scheme would be representative of potential balanced road pricing options in Wellington.
Intervention Level: Road pricing. The road pricing scheme would need to reflect socio-economic, PT, safety, affordability and sustainability factors. A publically and politically acceptable and balanced scheme would need to be developed. For the purposes of initial scenario testing it is representative to
use the 2007 option within a 2017 context.
Interdependencies: Public transport improvements would be required – the SKM study1 noted that there was potential for an additional 1000 trips into the CBD from the southern suburbs alone.
Active mode accessibility improvements would be required if a cordon was located close to the CBD. This would enable those living just outside any cordon to have more choice if they had previously relied on the use of a car to access the CBD.
Integrated transport and land use.
Parking charge cordon around the CBD – this should be modelled to establish which approach would give greater benefits.
Potential Benefits: Reduced travel times for people travelling in peak periods. The SKM study1 found travel times to the CBD from the north could reduce by up to 30%.
Reduced flows. The SKM study1 found person kilometres could reduce by up to 4%.
Reduced vehicle emissions.
Increased use of alternative modes, particularly public transport.
Would encourage peak spreading to avoid high charges.
Revenue raised can be used to accelerate implementation of hard measures such as increased public transport services that may otherwise be unfunded.
Potential Issues: May be issues collecting money from non-regular users.
May be expensive to operate. In London the costs of operating the scheme were around 40% of the revenue gathered9 and Stockholm found costs were around 30% of revenue gathered.10 Lower levels of congestion in Wellington may suggest the system may be less efficient than
London and Stockholm. Revenue collection costs are reducing over time with advances in scanning technology.
Investment in public transport required to provide greater peak capacity. May need 10% - 25% greater future capacity (coupled with a potential 6% decrease in car trips into the CBD).
Effects on people who live close to the edge of the cordon need to be considered.
Possible issues with altered flow patterns at the edge of the cordon, from people altering their trip to avoid it.
If it is only applied to Wellington City it may encourage development to spread out within the region where costs are less.
Potential Barriers: High costs of operation.
May be politically unpopular, especially if this initiative is not part of a package that uses revenue collected to support other transport initiatives.
Effects on individual residents in the Region are likely to be highly dependent on where the cordon is placed within the City.
Investment Estimate: The 2007 SKM study1 estimated the rough order of cost would be $10 million to $45 million (depending on the option) with operating costs of $3-4 million p.a. for lower cost options and $10-13 million p.a. for higher cost options (all costs in 2005 dollars). Note costs and technology
have changed since 2007 NZTA are now operating three toll roads, Northern Gateway (opened 2009), Tauranga Eastern Link (opened 2015) and Takitmu Drive, previously Route K, (taken over 2015). All three are operating the same technology and are managed through a central
system; it is likely that any charging system could also be operated through the NZTA system.
Operating costs to manage the Wellington transactions, based on the three existing toll routes, is $3.6M p.a. System maintenance, periodic and reactive being $0.4M. The capital expenditure to install a system will depend substantially on the size of the network being included and
number of charge points. The Wellington system could be up to 16 charge gates. The Stockholm system consisted of 18 gates and cost $215M, (though through learnings they believe they could do it for half that price now) and is consistent with the capital cost of other congestion
charge projects around the world of a similar size. With this in mind the previous estimate would appear low, with a revised capital estimate closer to $80 million being better aligned (depending on the option chosen). This also assumes that the majority of the backroom operating is
undertaken through the existing NZTA systems with expansion as necessary.
8 SKM, 2007 Wellington Region Road Pricing Study - Stage 2 – Technical Report, Greater Wellington Regional Council 9 C40. (2011). C40: London's Congestion Charge Cuts CO2 Emissions by 16%. [online] Available at: http://www.c40.org/case_studies/londons-congestion-charge-cuts-co2-emissions-by-16 [Accessed 24 May 2017]. 10 Eliasson, J. and Transek, A. (2017). Cost-benefit analysis of the Stockholm congestion charging system. [Case Study] http://www.eltis.org/sites/eltis/files/case-studies/documents/stockholmcongestioncbaeliassonn0_8.pdf, Brussels.

Stage 2 Report
12
Table 6: Measure 2 – Dynamic / Optimised Parking
Grouping: CHARGING TO MANAGE DEMAND Guiding Principles:
Measure 2: Dynamic / Optimised Parking
Description: Implementing forms of parking management to meet the objectives of the WCC parking policy.
Current Commitments and Previous Studies
There is currently no regional park and ride strategy. Parking is prioritised for car poolers at certain park and ride locations this is to be extended to all park and ride car parks.
A City parking strategy is being developed.
Intervention Level: Low Medium High
Increased subsidised park and ride at major stations.
Prioritised parking for car sharing (e.g. Cityhop car share) and EV spaces (already being
pursued by WCC).
Parking guidance app.
Low, plus:
Time based charging focused on deterring peak period travel while enabling short term
convenience parking to support economic activity.
Medium, plus:
Restrictions on building additional parking capacity in the CBD.
Setting a car parking levy on commuter parking in Central Wellington (car parks used
for either residential or retail would be exempt). Note a bylaw change may be required.
Interdependencies: Accessible PT from Park and Ride stations. This would need to be linked to MaaS applications in order to keep users informed of
changes to rates and availability
A dynamic levy would also need to be linked to MaaS applications in order for it to be
flexible and seen as fair and transparent
Potential Benefits: Park and ride restrains traffic growth in the study corridor and encourages PT use11.
Prioritised parking for car sharing is likely to mainly benefit small businesses and people living
in an apartment who would otherwise purchase a car for occasional use.
Variable parking charges and increasing parking charges for on street parking would
optimise the use of high value car parks, encouraging longer term parkers to park in
buildings. It will also reduce circulation from drivers looking for an on street car park. It will
encourage use of car parks for retail / short term commercial use as opposed to being
used for commuter parking.
Setting a car parking levy on commuter parking will ensure there is some availably of
retail parking during the day. Since the 2014 and 2016 earthquakes, car park buildings
have greatly increased their parking charges but there is still limited availability (e.g. the
car park in the Travel Lodge hotel car park at the top of the Plimmers Steps has
increased its charge for early bird commuter parking from approximately $12.50 in 2012
to $18.50 currently. There is however typically no availability of car parking for casual
parking around the middle of the day).
Setting a car parking levy will discourage drivers from driving to work, and so could serve
a similar function to congestion charging (without the potentially very high operation costs
of congestion charging).
A parking levy could be an effective way of metering demand into the CBD.
Cap combined with levy may leave existing parking operators no worse off financially,
but still reduce parking demand.
Potential Issues: Expanding park and ride parking could in some cases be difficult as there is little available
land and multi-story parking would be too expensive to be cost effective (potentially a $10 per
day return required which could prompt some drivers to commute or park on local streets).
Use of land around some commuter stations for park and ride may conflict with possible
future transit orientated development.
To regulate use of park and ride car parks there may be a need to charge for parking costs in
the future.
Prioritised parking for car sharing may result in a loss of income to the Council for the car
parks where car parks are provided for this use for a reduced cost or for free.
The ability to cancel a contract with a provider (such as Cityhop) where the car is
underutilised.
This could end up being linked to private parking costs as a form of escalator and a
strategy would be required to identify a cost ceiling for parking.
Detailed consultation needed a precinct level prior to implementation
• If a levy were to be applied, a by-law change is likely to be necessary.
Detailed consultation needed a precinct level prior to implementation
Potential Barriers: Availability of land for park and ride parking. It is unclear if a parking tax or levy could be implemented without a change in legislation.
Legal advice would be required to determine if this would be considered to be a rates
charge on parking.
Possible resistance from the public to higher parking charges.
Opposition to a by-law change
Investment Estimate: Cost of park and ride depends on the particular site. For land costing around $500 per m2 the
costs of a car park would be around $17,000 per space.
For prioritised parking for car sharing the costs to Council are likely to relate to the loss of
income from the car parking.
Assume $0.5M for consultancy fees to scope out and implement the charging process.
This would include the necessary linkages to MaaS apps.
Assume $2M for consultancy and legal fees to introduce levies.
11 Transfund NZ Research Report (No. 136), Park and Ride Policies and Criteria, Booz Allen & Hamilton (NZ) Ltd

Stage 2 Report
13
Table 7: Measure 3 – High Occupancy Priority
Grouping: REALLOCATION OF ROADSPACE Guiding Principles:
Measure 3: High Occupancy Priority
Description: Redistributing space in the carriageway to provide priority for vehicles carrying more than one person (note, this includes use of these lanes by buses, however bus only priority is covered in Measure 6).
Current
Commitments and
Previous Studies
It is understood that currently there are no HOV lanes in the Wellington region.
There are estimated costs over the six years from 2015 of $68 million to be spent by the Wellington City Council on a road space reallocation corridor programme.
Intervention Level: Low Medium High
Where appropriate (on existing multi lane carriageways) provide high occupancy vehicle lanes
(e.g. T2 and T3 lanes) – one potential location would be State Highway 1 Ngauranga to Aotea
Quay (or the adjacent section of the Hutt Road).
Low, plus:
A higher level of expenditure and more widespread provision of lanes.
Also, consider high occupancy vehicle lanes with the ability for low occupancy vehicles
to pay a toll to use the lane (Toll Travel Lanes) where appropriate – one possible
location where this could be considered is SH1 between the airport and the CBD
(Cobham Drive).
Medium, plus:
A higher level of expenditure and more widespread provision of lanes.
Potential through-CBD tolling depending on tunnel routes.
Interdependencies: Integrated transport and land use.
Travel planning.
Potential Benefits: Encourages a mode shift for commuters from cars to public transport.
Also effective in encouraging car sharing.
Toll vehicle lanes would be likely to increase the applicably of HOV lanes, as it would increase the efficiency of these lanes by increasing the flow (and reducing the percentage of
HOVs required to operate efficiently).
Potential Issues: Only applicable on congested roads where the carriageway is wide enough to provide dual lanes (either permanently or in peak periods). Most roads in Wellington are narrow and so this limits applicability.
HOV lanes are only likely to be effective when they are able to attract a sufficient volume of users (i.e. empty lanes are inefficient). For three lane roads, at least 20% of traffic would need to be HOVs to be efficient, and for two lane roads the percentage would need to be far greater.
This is likely to limit potential locations. HOV lanes are open to buses as well, increasing the allowed traffic on some routes.
This measure may reduce the utility of bus lanes, or reduce the number of locations bus lanes are viable.
Toll vehicle lanes would slightly reduce the speed of traffic in the HOV lane.
Potential Barriers: Finding suitable roads that meet the above criteria - much of the regional State Highway and Motorway network comprises single or dual lane roads only.
Some people could perceive toll vehicle lanes to be elitist.
Investment Estimate: The costs of these measures depend greatly on the location. In some locations where only
minor road marking and signage is required, the costs would be minimal.
Assuming part time HOV lane utilising existing lane space. Install associated signs/markings
and surface colouring only - SH1 & Hutt Rd $150k.
In other locations there could be significant construction costs.

Stage 2 Report
14
Table 8: Measure 4 – Improved Active Modes Infrastructure
Grouping: REALLOCATION OF ROADSPACE Guiding Principles:
Measure 4: Improved Active Modes Infrastructure
Description: Supporting uptake of active modes through infrastructure improvements which increase safety and accessibility and facilitate behavioural change
Current
Commitments and
Previous Studies
Up to June 2018, around $35 million will be invested in Cycling in Wellington city including $9.5 million from the Urban Cycleways Programme12, and contributions from rates and the National Land Transport Fund. To continue the programme, and provide a worthwhile expansion of the
network a further investment of around $65 million would be required over the next 10 plus years13. $1.5M in CBD.
GWRC own a central area Network Operating Framework which includes space reallocation and priority corridor.
Bike stands are implemented as part of minor works. Advance stop boxes exist, along with, sharrows on single lane roundabouts.
Regional Programme14 10 year projected costs of committed activity from:
o Hutt City Council for cycleway network development – $5.90 million
Petone to Ngauranga - $1 million
o Kapiti Coast District Council for Kapiti strategic cycle network - $9.25 million
o Porirua City Council for CBD to Paremata bridge cycleway – $0.95 million
Hutt City Council for Wainuiomata Hill cycling facilities - $6.54 million
Intervention Level: Low Medium High
Increased walking and cycling priority access through minor infrastructure improvements on major cycling and
walking routes, including regional planning to link communities, urban and business hubs and recreational
areas. Completion of “missing links” for roads lacking pedestrian and cycling facilities.
Reduced speed limits on all residential roads and all urban suburban centres.
Cycle parking and city centre facilities (e.g. fixed pumps).
Local area traffic management in suburban areas to improve safety and prevent rat running where there is an
identified problem.
Low, plus:
Traffic improvements including median refuges, kerb buildouts and fewer free left
turns at intersections.
Additional expenditure to create improved cycle facilities on the WCC Wellington
Cycle Network.15
Introduce the concept of ‘cycle stations’ that are integrated with PT stations making
multi-modal trips or trip-chaining more accessible16.
Smart biking infrastructure – radar counting, LED lighting to help timing with green
phases, group detection of cyclists to maintain green phases etc.16
Alter traffic signal phasing to increase cycle time and/or priority to pedestrians.
Medium, plus:
Separated cycling and walking paths on the WCC Wellington Cycle Network
to create a cohesive network.
Cycle ‘superhighways’ connecting region to CBD (e.g. Wellington to Hutt
Valley Cycleway).
PPP approach for funding with outcome based contracts.
Implementation of shared or fully pedestrianised streets in city centre.
Interdependencies: Effort applied to increasing active mode share through behavioural change is likely to be low return without an environment that is conducive to new users. This environment is likely to include infrastructure improvements.
Potential Benefits: Cycle infrastructure improvements are likely to result in a significant increase in cycle flows.
Reduced speed limits on residential roads and in urban and suburban centres is likely to improve pedestrian safety.
Prioritising cycle facilities promotes mode shift.
Creating a hub makes the facilities attractive and encourages use.
Improved pedestrian infrastructure will also increase public transport usage.
Improved pedestrianisation near business centres typically improves profitability.
PPP allows more development than government could afford in budget.
Major change to City centre amenity
Potential Issues: Increasing walking and cycling priority is likely to require considerable reallocation of the road space in
Wellington City reducing parking and traffic capacity in some locations.
Reduced speed limits are unlikely to be enforced however typically this is not required to achieve a significant
behavioural change.
Developing the Wellington Cycle Network is likely to require considerable
reallocation of the road space in Wellington City reducing parking and traffic
capacity in some locations.
Some traffic improvements for pedestrians and cyclists will reduce car capacity.
PPP contracts require consideration of how risk and cost is apportioned
between the public and private to ensure a successful outcome.
Potential Barriers: Potential barriers to cycle infrastructure improvements including likely opposition from affected businesses or
residents to cycle lanes or paths where there is a loss of parking.
The narrow width of roads restricts the ability to easily provide space for cyclists.
High construction costs particularly as steep topography adds to the cost of road construction.
Lack of connectivity of streets in Wellington (mainly due to topography) restricts potential options for cycle
facilities and results in high demand for road space on some roads.
Lack of political support for tough decisions, lack of political and public support and lack of support by some residents.
Funding.
Car lobby group.
There are multiple potential barriers to the success of all PPP contracts
stemming from having multiple parties involved. These can include conflicts
arising from, for example, differing focuses and priorities; lack of
communication; or varying timeline constraints. These will be reduced with
smaller PPP projects and through risk management.
Investment
Estimate:
There is no significant cost for reducing the speed limit.
Local Area Traffic Management is typically expensive and is only likely to be justified in a few places where these is a severe issue from rat running.
Assume a similar level of investment to the current ‘low’ levels.
A cycle station could cost from around $2,000 per space for an unattended hub (with around $15,000 p.a. operating costs) to AU$7M for a full cycle station such as
To fully develop the Wellington Cycle Network potentially up to $200 million
would be required.
12 Note part of this programme of work has been delayed and so will extend past June 2018. 13 The Wellington Cycleway Masterplan, September 2015 States there is around $100 million of potential funding available for cycleways over the next 10 plus years to fund the Masterplan. 14 Regional Programme 15 WCC, 2015, Cycling Framework 2015 16 Viechnicki, P., Khuperkar, A., Fisherman, T. and Eggers, W. (2015). Smart mobility: Reducing congestion and fostering faster, greener, and cheaper transportation options. [online] DU Press. Available at: https://dupress.deloitte.com/dup-us-en/industry/public-sector/smart-mobility-trends.html [Accessed 30 May
2017]
Stage 2 Report
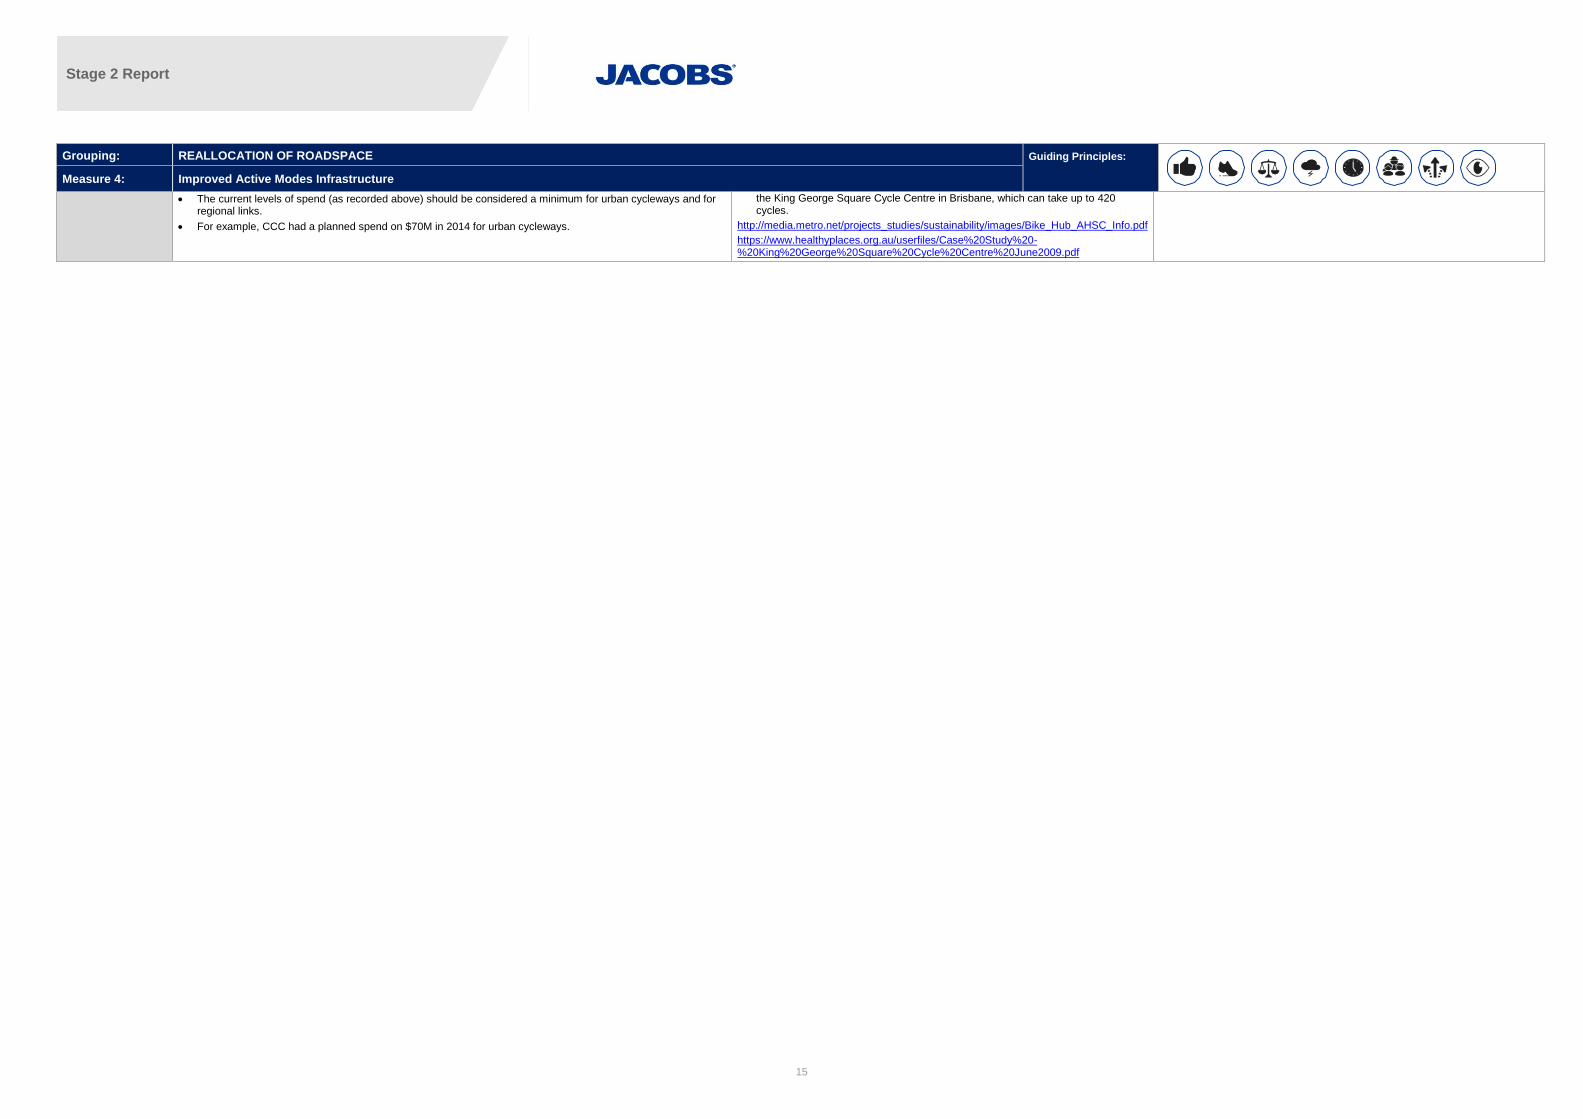
15
Grouping: REALLOCATION OF ROADSPACE Guiding Principles:
Measure 4: Improved Active Modes Infrastructure
The current levels of spend (as recorded above) should be considered a minimum for urban cycleways and for regional links.
For example, CCC had a planned spend on $70M in 2014 for urban cycleways.
the King George Square Cycle Centre in Brisbane, which can take up to 420 cycles.
http://media.metro.net/projects_studies/sustainability/images/Bike_Hub_AHSC_Info.pdf
https://www.healthyplaces.org.au/userfiles/Case%20Study%20-%20King%20George%20Square%20Cycle%20Centre%20June2009.pdf
Stage 2 Report
16
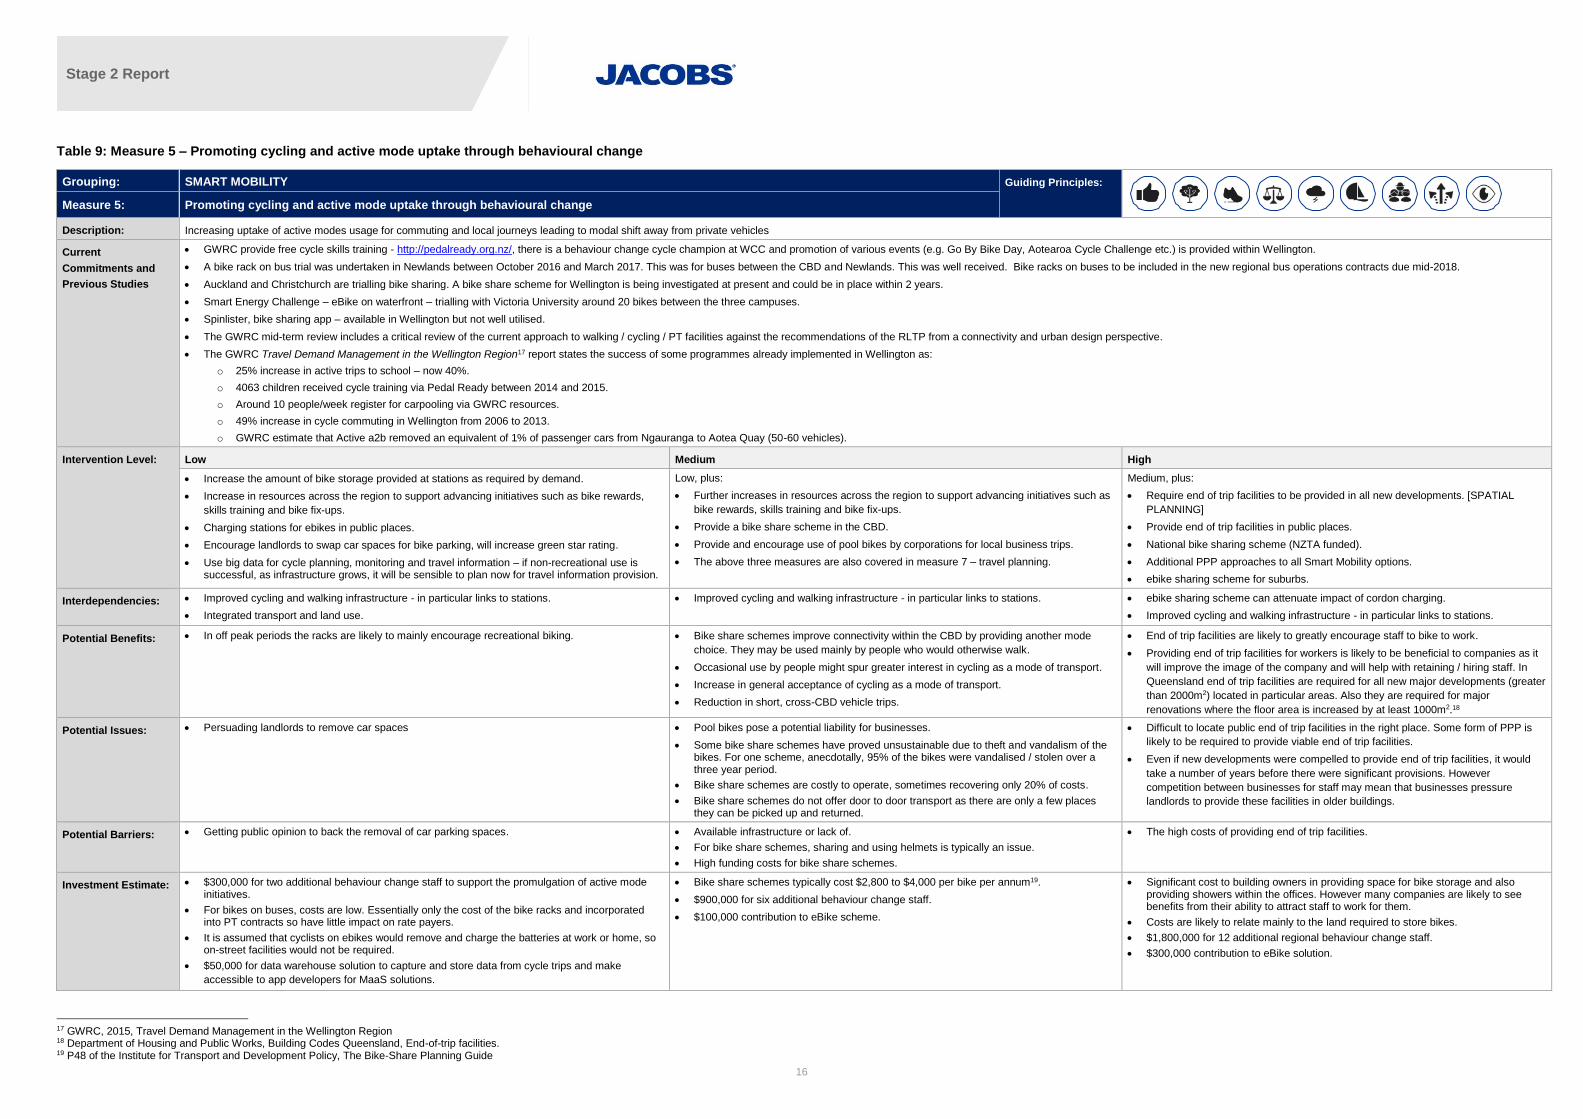
Table 9: Measure 5 – Promoting cycling and active mode uptake through behavioural change
Grouping: SMART MOBILITY Guiding Principles:
Measure 5: Promoting cycling and active mode uptake through behavioural change
Description: Increasing uptake of active modes usage for commuting and local journeys leading to modal shift away from private vehicles
Current
Commitments and
Previous Studies
GWRC provide free cycle skills training - http://pedalready.org.nz/, there is a behaviour change cycle champion at WCC and promotion of various events (e.g. Go By Bike Day, Aotearoa Cycle Challenge etc.) is provided within Wellington.
A bike rack on bus trial was undertaken in Newlands between October 2016 and March 2017. This was for buses between the CBD and Newlands. This was well received. Bike racks on buses to be included in the new regional bus operations contracts due mid-2018.
Auckland and Christchurch are trialling bike sharing. A bike share scheme for Wellington is being investigated at present and could be in place within 2 years.
Smart Energy Challenge – eBike on waterfront – trialling with Victoria University around 20 bikes between the three campuses.
Spinlister, bike sharing app – available in Wellington but not well utilised.
The GWRC mid-term review includes a critical review of the current approach to walking / cycling / PT facilities against the recommendations of the RLTP from a connectivity and urban design perspective.
The GWRC Travel Demand Management in the Wellington Region17 report states the success of some programmes already implemented in Wellington as:
o 25% increase in active trips to school – now 40%.
o 4063 children received cycle training via Pedal Ready between 2014 and 2015.
o Around 10 people/week register for carpooling via GWRC resources.
o 49% increase in cycle commuting in Wellington from 2006 to 2013.
o GWRC estimate that Active a2b removed an equivalent of 1% of passenger cars from Ngauranga to Aotea Quay (50-60 vehicles).
Intervention Level: Low Medium High
Increase the amount of bike storage provided at stations as required by demand.
Increase in resources across the region to support advancing initiatives such as bike rewards,
skills training and bike fix-ups.
Charging stations for ebikes in public places.
Encourage landlords to swap car spaces for bike parking, will increase green star rating.
Use big data for cycle planning, monitoring and travel information – if non-recreational use is successful, as infrastructure grows, it will be sensible to plan now for travel information provision.
Low, plus:
Further increases in resources across the region to support advancing initiatives such as
bike rewards, skills training and bike fix-ups.
Provide a bike share scheme in the CBD.
Provide and encourage use of pool bikes by corporations for local business trips.
The above three measures are also covered in measure 7 – travel planning.
Medium, plus:
Require end of trip facilities to be provided in all new developments. [SPATIAL
PLANNING]
Provide end of trip facilities in public places.
National bike sharing scheme (NZTA funded).
Additional PPP approaches to all Smart Mobility options.
ebike sharing scheme for suburbs.
Interdependencies: Improved cycling and walking infrastructure - in particular links to stations.
Integrated transport and land use.
Improved cycling and walking infrastructure - in particular links to stations.
ebike sharing scheme can attenuate impact of cordon charging.
Improved cycling and walking infrastructure - in particular links to stations.
Potential Benefits: In off peak periods the racks are likely to mainly encourage recreational biking.
Bike share schemes improve connectivity within the CBD by providing another mode
choice. They may be used mainly by people who would otherwise walk.
Occasional use by people might spur greater interest in cycling as a mode of transport.
Increase in general acceptance of cycling as a mode of transport.
Reduction in short, cross-CBD vehicle trips.
End of trip facilities are likely to greatly encourage staff to bike to work.
Providing end of trip facilities for workers is likely to be beneficial to companies as it
will improve the image of the company and will help with retaining / hiring staff. In
Queensland end of trip facilities are required for all new major developments (greater
than 2000m2) located in particular areas. Also they are required for major
renovations where the floor area is increased by at least 1000m2.18
Potential Issues: Persuading landlords to remove car spaces
Pool bikes pose a potential liability for businesses.
Some bike share schemes have proved unsustainable due to theft and vandalism of the bikes. For one scheme, anecdotally, 95% of the bikes were vandalised / stolen over a three year period.
Bike share schemes are costly to operate, sometimes recovering only 20% of costs.
Bike share schemes do not offer door to door transport as there are only a few places they can be picked up and returned.
Difficult to locate public end of trip facilities in the right place. Some form of PPP is
likely to be required to provide viable end of trip facilities.
Even if new developments were compelled to provide end of trip facilities, it would
take a number of years before there were significant provisions. However
competition between businesses for staff may mean that businesses pressure
landlords to provide these facilities in older buildings.
Potential Barriers: Getting public opinion to back the removal of car parking spaces. Available infrastructure or lack of.
For bike share schemes, sharing and using helmets is typically an issue.
High funding costs for bike share schemes.
The high costs of providing end of trip facilities.
Investment Estimate: $300,000 for two additional behaviour change staff to support the promulgation of active mode initiatives.
For bikes on buses, costs are low. Essentially only the cost of the bike racks and incorporated into PT contracts so have little impact on rate payers.
It is assumed that cyclists on ebikes would remove and charge the batteries at work or home, so on-street facilities would not be required.
$50,000 for data warehouse solution to capture and store data from cycle trips and make
accessible to app developers for MaaS solutions.
Bike share schemes typically cost $2,800 to $4,000 per bike per annum19.
$900,000 for six additional behaviour change staff.
$100,000 contribution to eBike scheme.
Significant cost to building owners in providing space for bike storage and also providing showers within the offices. However many companies are likely to see benefits from their ability to attract staff to work for them.
Costs are likely to relate mainly to the land required to store bikes.
$1,800,000 for 12 additional regional behaviour change staff.
$300,000 contribution to eBike solution.
17 GWRC, 2015, Travel Demand Management in the Wellington Region 18 Department of Housing and Public Works, Building Codes Queensland, End-of-trip facilities. 19 P48 of the Institute for Transport and Development Policy, The Bike-Share Planning Guide

Stage 2 Report
17
Table 10: Measure 6 – Improved Public Transport Amenity
Grouping: SMART MOBILITY Guiding Principles:
Measure 6: Improved Public Transport Amenity
Description: Improve the Public Transport Amenity including the convenience, quality, frequency and pricing of services. Measures aimed at changing behaviour are covered elsewhere.
Current
Commitments and
Previous Studies
Public transport Behaviour Change Programme.
Free transfers across the bus network.
Public transport Sweet Treats existing programme to make public transport travel more pleasant.
Universal Access Card (Integrated ticketing. GWRC is currently proposing this).
Regional Programme20 10 year projected costs of committed activity from:
o Wellington City Council for small bus priority - $4.63 million.
o GWRC for public transport programme:
2015-18 total mobility operation - $27.72 million
2015-18 PT information operation and maintenance - $20.24 million
BRT PBC Analytics – $0.25 million
BRT implementation plan 2015-18 - $3.09 million
Regional rail plan – passenger rail improvements - $51.67 million
Wellington integrated fares and ticketing - $98.99 million
WCC BRT infrastructure improvements - $31 million over 6 years (2015-21)
Intervention Level: Low Medium High
Improving the overall quality of public transport services (e.g. removing advertising from bus
windows, improving the reliability of services, increasing comfort including heating, improving
shelters, reducing the travel times for buses on key routes, and improving wayfinding).
Improved frequency of services.
Investigate the potential for reducing fares charged for services.
Introduce new technologies for making payment.
Low, plus:
Additional expenditure to improve the quality and frequency and reduce the fares charged for
services.
Transit free zone through Lambton Quay and Courtney Place.
Public transport priority (e.g. Bus lanes, Queue jump lanes).
Bus Priority from the Wellington Railway Station through to Newtown and Kilbirnie.
Medium, plus:
Additional expenditure to improve the quality and frequency and reduce the fares
charged for services.
Bus Rapid Transit Priority or Light Rail Transit from the Wellington Railway
Station through to Newtown and Kilbirnie.
Interdependencies: High occupancy priority.
Integrated transport and land use.
Payment methods can be extended to: car sharing, ride sharing, bike sharing etc. (MaaS).
Potential Benefits: The measures proposed would encourage increased patronage, particularly from discretionary
travellers who would otherwise drive. Litman reports that Pratt (1999) concluded that the
elasticity of transit use with respect to transit service averages 0.5, meaning that each 1%
increase in transit service frequency, vehicle mileage or operating hours increases ridership
0.5%, although this varies depending on service type, demographic and geographic factors21.
Encourages better land use.
Introducing new technologies for making payment increases the convenience of using public transport.
The transit free zone is likely to support business and shopping in the CBD, particularly if the
service is highly regular throughout the day (say at a 5 minute headway).
The transit free zone may support tourists, especially those from cruise ships.
Improved quality of services will encourage a mode shift to Public Transport for
trips to or from the southern or eastern suburbs.
Potential Issues: Fare cost changes have little impact – reduction in fares does not give proportional increase in
patronage.
Increased costs from implementing these measures.
The transit free zone through Lambton Quay and Courtenay Place could increase bus traffic
on a part of the system that is operating at close to capacity in peak periods. To reduce the
potential for this, it could be run off peak (9:00am to 4:00pm seven days) this spreading the
peak demand.
Requires the reallocation of the road corridor space from other road users to
provide for bus priority or bus rapid transit. This would reduce available parking
and the capacity of some intersections.
Potential Barriers: Universal access card requires agreement across all providers and integration of ticketing
systems.
There are technological barriers for introducing new technologies for making payment. An off
the shelf system is likely to be required to minimise costs. As such, WCC would need to be a
follower of systems which are already used overseas.
Opposition from public, including those who currently drive through what would become the
widened area of the transit free zone.
Reliant on roading improvements at the Basin Reserve to support the Newtown
route and possibly also the Kilbirnie route (if the Kilbirnie route is aligned through
the Mt Victoria Tunnel as opposed to the bus tunnel).
The Kilbirnie route is possibly also reliant on the Tunnel Duplication Project if the
route is aligned through the Mt Victoria Tunnel.
Investment Estimate: There is already some funding being put aside for these measures in the regional programme. The Wellington Public Transport Spine Project Alternative Funding Options Study22 estimated the annual funding requirement for Bus Priority to be $2.7m per annum.
Comprehensive investment is needed to encourage people to use a platform such as MaaS
and to establish the platform through various contracts with providers.
The Wellington Public Transport Spine Project Alternative Funding Options Study
estimated the annual funding requirement for Bus Rapid Transit and Light Rail
Transit to respectively be $5M and $47M per annum.
20 Regional Programme 21 Todd Litman (2017), Evaluating Public Transit Benefits and Costs Best Practices Guidebook, Victoria Transport Policy Institute, www.vtpi.org/tranben.pdf 22 Hill Young Cooper (2013), Wellington Public Transport Spine Project Alternative Funding Options Study, GWRC

Stage 2 Report
18
Table 11: Measure 7 – Travel Planning
Grouping: SMART MOBILITY Guiding Principles:
Measure 7: Travel Planning
Description: TDM measures that change the way people think about and use their private vehicles.
Current
Commitments and
Previous Studies
GWRC car-pooling resource. Uses incentives and mobile applications - http://www.gw.govt.nz/smart-travel/ Includes guaranteed ride home.
GWRC also have a number of workplace initiatives including Transport friendly Workplace, Guaranteed Ride Home and public transport trial providing free Snapper cards for qualifying new users. Workplace schemes are typically aimed at large workplaces, or amalgamations of
similar workplaces (e.g. CCDHB, Miramar studios). GWRC plan to commence a new personalised journey planning programme in July 2018.
WCC are supporting the change of use of on-street parking for car sharing (including EV vehicles). At present around 20 spaces have been reallocated.
Road safety promotions as part of TDM programme.
Current spend around $1.5M p.a. including staff and projects costs for GWRC / WCC.
Intervention Level: Low Medium High
Increased subsidy of public transport.
Assisting work places to create travel plans which encourage changes in behaviour (e.g. by allowing
flexibility around work hours and locations).
CBD workplace ride sharing planning support and car sharing that can be used by individuals outside of
work hours.
Trial personalised travel plans for select suburbs.
Provide maps and signage to inform people of the best way to get to their destination (both online and
wayfinding signs on streets).
Improve travel time information.
Identify targeted locations for integrated mobility hubs.
Start targeting young commuters and future workers – they will be more receptive to Smart Mobility
concepts and therefore likely to have a bigger impact in future.
Car or ride sharing to the airport. Dedicated portal for access to sharing.
PPP approach – create car sharing pods in urban and residential centres or hubs.
Build awareness of car sharing as a less expensive approach to car ownership – particularly for the
younger urban generation.
Create data collection, harmonisation and sharing approach for all forms of Smart Mobility – this will allow
a more targeted planning and benefits assessment.
Support Smart Travel platform. This would simplify the process of organising and planning journeys
around Wellington by creating a ‘one stop’ resource linking individuals with the most up to date travel
information and incentives from across multiple transport modes.
Low, plus:
Further investment in car sharing and ride sharing facilitation (GWRC are
currently developing a ride share site) to include private sector investment.
Travel plans required for existing developments.
Implement personalised travel plans across Wellington.
Travel plans targeted at tourists to the area.
Identification and promotion of rideshare corridors – build critical mass of users.
Park and ride car share facilities along corridors.
PPP style schemes to improve mobility with contracts that specify mobility
outcomes.
Medium, plus:
Car free planning.
Mobility as a service connecting all modes of travel – tie in to NZTA platform.
o Journey planning implementing all options
o Cost analysis of journey options
o One place to pay from
Reduction in vehicle registration costs where a vehicle is used for ride sharing.
Link travel planning with commercial on demand services (i.e. Uber), particularly for
first and last mile journey segments.
Interdependencies: Integrated transport and land use. Ride sharing can be supported by HOV lanes, where they exist.
Potential Benefits: These measures typically result in a significant reduction in traffic flow from drivers of single occupancy
vehicles changing to public transport or alternatively to car sharing.
In particular Workplace Travel plans would result in a reduction in employee trips23.
The road capacity generated by ride sharing has significant benefits when
compared to the cost of additional infrastructure required to provide the same
capacity.
Car free planning would encourage the use of public transport and cycling on this
day, with a possible change in the mind set of people potentially changing behaviour
on other days as well.
Potential Issues: There is an obvious cost from increasing the public transport subsidy. Permanently increasing the subsidy
would result in a significant council/government cost which may not be able to be justified. However
potentially a very large subsidy could be placed on commuter services for say a two month period to try
and permanently alter behaviour after the subsidy was removed. This could be undertaken in one suburb,
with flyers dropped prior to inform people.
Cost effectiveness of each measure would need to be checked to ensure there was a significant change
in behaviour.
Compelling existing developments to provide travel plans may not result in an
improved outcome as it is difficult to enforce their application.
Car free days would be difficult / costly to organise. As well, the traffic management
would need to ensure businesses and residents still retained access to their
properties. There would be a need to ensure businesses were not adversely affected
by the closures.
Potential Barriers: Account based system required – need to monitor usage and uptake of initiatives using travel cards.
The labour costs for implementing these measures.
Lack of mandatory insurance keeps car ownership cheap.
Ride sharing can be time consuming to organise.
The complexity of commuters having to organise transport – needs to be
overcome using a Smart Mobility approach.
The need for support from local businesses, including hotels.
Legislative change and technology needed to verify vehicles being uses for ride
sharing.
Investment Estimate: Cost of subsidising for one suburban area for free services may be around $50,000.
Assisting work places to develop workplace plans could involve the costs of a single council officer,
potentially $150,000 per annum.
The software has already been developed for a ride-sharing platform. Three
travel planning staff in the CBD - $400,000.
Significant investment in traffic management and reorganisation of public transport is
typically required.
Set up data collection for Smart Mobility local platform approx. $100,000.
Six travel planning staff - $900,000.
23 The Seattle Best Practices Transport Demand Management, January 2008 document states on page 7E-3 that employer based TDM Strategies can have the following reducing in employee vehicle trips: parking charges (where previously free parking was provided 20-30%; information alone on transport
alternatives 1.4%; services such as ride matching, shuttles, guaranteed ride home 8.5%, services such as ride matching etc plus transit vouchers 24.5%; Cash benefits in lieu of accepting free parking 17%.

Stage 2 Report
19
4. Packages of measures
As Let’s Get Wellington Moving has identified through its research, to achieve mode shift it is important to
implement a multi-modal approach of a package of measures that are complimentary. Packages would include
measures such as improvements to walking and cycling facilities; better public transport; and improvements to
roads, rather than focusing on improving just one mode. For example, improving walking and cycling facilities
also increases the “walk-up” catchment of bus stops. This provision of a range of hard and soft measures and
pull and push factors provides transport and modal choice and is more likely to encourage a change in travel
behaviour for example if charging is implemented it is more effective with public transport priority and promotion
and less effective with road widening measures.
The short list of possible TDM measures identified with project partners and included in Section 4 was
combined into packages to reflect a focus on different aspects of TDM for Let’s Get Wellington Moving scenario
testing in the future.
Table 12 provides a summary of the measures included in each scenario. In order to provide practical and
representative packages of TDM measures for Let’s Get Wellington Moving we have included a combination of
measures across the groupings, as summarised below:
‘Focus on soft measures’ includes limited investment on physical infrastructure changes as the focus
of Smart Mobility involves technology, promotion and making more efficient use of the existing
network.
‘Focus on physical interventions’, improving the infrastructure to provide for active modes or
redistributing space for HOV and would require some investment in the softer measures to support
behavioural change.
‘Focus on charging to manage demand’ includes road pricing and supporting TDM measures that
would be required to support multi-modal shift and public and political acceptability.
‘Balanced Package’ includes potential measures from each of the three groupings at varying degrees
of investment. This combination aims to incorporate the key benefits from the other packages in order
to create a balanced approach and support behavioural change and multi-modal shift.
Table 12: Packages of measures
Wider Grouping
Measure Focus on soft
measures Focus on physical
interventions Focus on charging to manage demand
Balanced Package
Charging to
Manage
Demand
1.Road Pricing H H
2.Dynamic / Optimised Parking H M
Reallocation of
Roadspace
3.Redistributing space to
higher occupancy vehicles
(HOV), including PT
H L M
4.Infrastructure improvements
for active modes L H L M
Smart Mobility
5. Promoting cycling and active
mode uptake H L L M
6. Improve the Public Transport
Amenity H L L M
7. Travel Planning H L L L
Complementary measures Improve bus capacity
Improve bus and rail
capacity
Improve bus and
rail capacity

Stage 2 Report
20
As outlined above, within the packages, each TDM measure is able to be implemented to a low, medium and
high intervention level. Therefore, ease of implementation, risks and benefits will be dependant of the level each
measure is implemented within the package. Figure 3 provides a schematic of the range of the broad areas of
measures ease of implementation and effectiveness.
Figure 3: Overview of broad areas of measures ease of implementation and effectiveness
4.1 Key considerations for modelling approach
We have identified some key considerations and further investigations for the Let’s Get Wellington Moving team when considering the modelling approach to TDM. This is not a comprehensive review, rather some general guidance to facilitate further discussion on the approach.
Smart Mobility
Our international experience suggests that Smart Mobility TDM measures are generally not modelled explicitly.
Instead, demand effects are often asserted within the modelling tools to understand what the implications of
reduced, retimed, rerouted or reassigned trips might be.
Depending on the structure of the available transport model the scale and impact of the TDM effects can be
estimated based on factors including the proportions of people that work from home (e.g. to reflect increase
teleworking), trip purpose, and the particular type of ‘soft’ TDM being represented. For example in multimodal
models, the effect of work place travel plans can be represented by a reduction in the proportions of home
based work trips with a proportion of these trips reassigned from the private vehicle matrices to public transport
or active modes. Alternatively simplified assertions about reductions in long distance trips and reassignment to
public transport and active modes can be used.
For the Melbourne Metro project, rather than asserting the impacts of TDM, a targeted reduction in trips was
identified to maintain a required level of network performance. The focus has then been on developing
complementary TDM measures to achieve the required reductions.
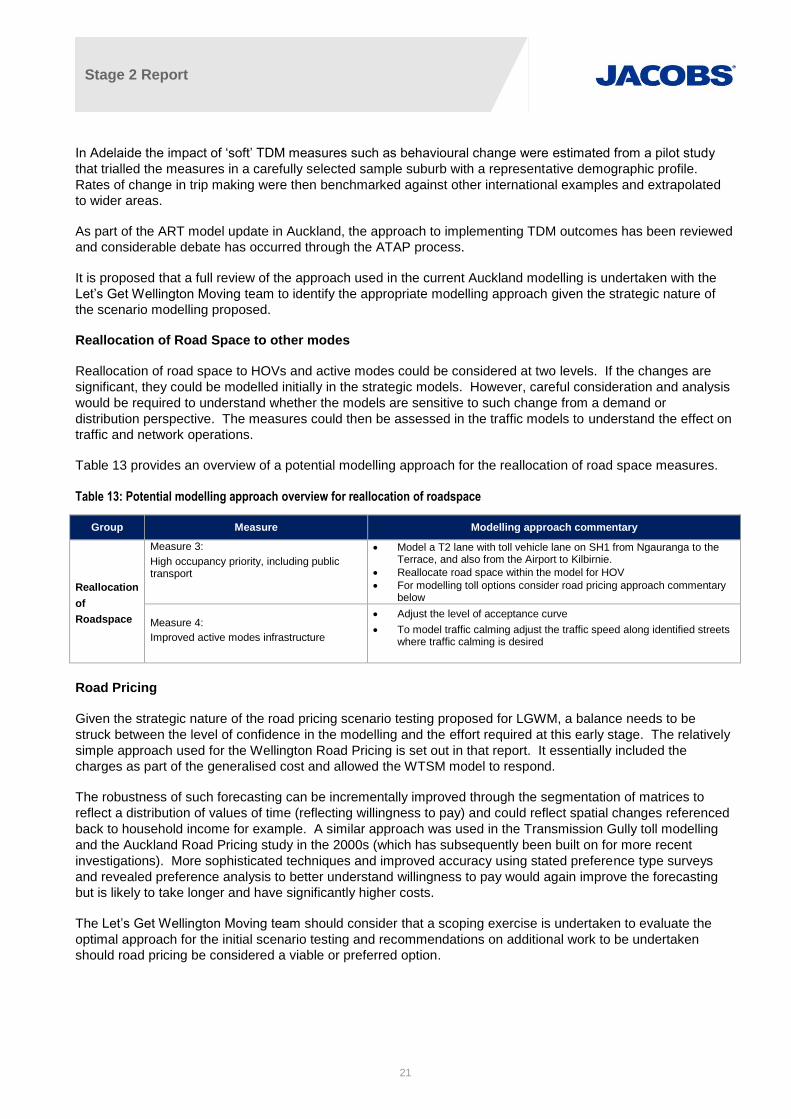
Stage 2 Report
21
In Adelaide the impact of ‘soft’ TDM measures such as behavioural change were estimated from a pilot study
that trialled the measures in a carefully selected sample suburb with a representative demographic profile.
Rates of change in trip making were then benchmarked against other international examples and extrapolated
to wider areas.
As part of the ART model update in Auckland, the approach to implementing TDM outcomes has been reviewed
and considerable debate has occurred through the ATAP process.
It is proposed that a full review of the approach used in the current Auckland modelling is undertaken with the
Let’s Get Wellington Moving team to identify the appropriate modelling approach given the strategic nature of
the scenario modelling proposed.
Reallocation of Road Space to other modes
Reallocation of road space to HOVs and active modes could be considered at two levels. If the changes are
significant, they could be modelled initially in the strategic models. However, careful consideration and analysis
would be required to understand whether the models are sensitive to such change from a demand or
distribution perspective. The measures could then be assessed in the traffic models to understand the effect on
traffic and network operations.
Table 13 provides an overview of a potential modelling approach for the reallocation of road space measures.
Table 13: Potential modelling approach overview for reallocation of roadspace
Group Measure Modelling approach commentary
Reallocation
of
Roadspace
Measure 3:
High occupancy priority, including public transport
Model a T2 lane with toll vehicle lane on SH1 from Ngauranga to the Terrace, and also from the Airport to Kilbirnie.
Reallocate road space within the model for HOV
For modelling toll options consider road pricing approach commentary below
Measure 4:
Improved active modes infrastructure
Adjust the level of acceptance curve
To model traffic calming adjust the traffic speed along identified streets where traffic calming is desired
Road Pricing
Given the strategic nature of the road pricing scenario testing proposed for LGWM, a balance needs to be
struck between the level of confidence in the modelling and the effort required at this early stage. The relatively
simple approach used for the Wellington Road Pricing is set out in that report. It essentially included the
charges as part of the generalised cost and allowed the WTSM model to respond.
The robustness of such forecasting can be incrementally improved through the segmentation of matrices to
reflect a distribution of values of time (reflecting willingness to pay) and could reflect spatial changes referenced
back to household income for example. A similar approach was used in the Transmission Gully toll modelling
and the Auckland Road Pricing study in the 2000s (which has subsequently been built on for more recent
investigations). More sophisticated techniques and improved accuracy using stated preference type surveys
and revealed preference analysis to better understand willingness to pay would again improve the forecasting
but is likely to take longer and have significantly higher costs.
The Let’s Get Wellington Moving team should consider that a scoping exercise is undertaken to evaluate the
optimal approach for the initial scenario testing and recommendations on additional work to be undertaken
should road pricing be considered a viable or preferred option.
Stage 2 Report
22
5. Next Steps
As part of the next steps of the Let’s Get Wellington Moving wider project the following steps should be
considered:
Refinement and endorsement of the packages of TDM measures, including the level of investment for
each group of TDM measure;
Determine the supporting complementary public transport requirements on the corridor;
Undertake a full review of the approach used in the current Auckland modelling to identify the
appropriate modelling approach;
Undertake a scoping exercise considering the appropriate approach for the initial scenario testing and
additional work to be undertaken should road pricing be considered a viable or preferred option; and
Engage with Let’s Get Wellington Moving team to help inform scenario development.

Stage 2 Report
23
Appendix A. Stage 1 Long list of TDM interventions
Category TDM Measure What does it do? Type Benefits Challenges Implementation
Time Frame
Economic Pricing Measures
Congestion Charging Congestion charge for entering the central city Push Factor Congestion reduction in CBD Implementation in the New Zealand context (LTMA 2003)
Medium term
Economic Pricing Measures
Distance-based charging Road pricing is based upon the distance driven Push Factor Users are only charged for how far they drive Feasibility and setup, LTMA 2003, the majority of car trips are under 6km, would this work
Medium term
Economic Pricing Measures
High occupancy toll (HOT) Travel Lanes
Allowing people to pay for using HOV travel lanes when only one person is in the car
Pull Factor More efficient use of highway capacity Space for HOV lanes, cost, effectiveness Medium term
Economic Pricing Measures
Link Tolling Tooling on specific road segments etc. Push Factor Reduction in peak travel times for link of road which has been tolled
Implementation in the New Zealand context (LTMA 2003)
Long term
Influencing Travel Behaviour
Bikes on buses Allows users to make use of public transport even when they are cycling for a section of their trip
Pull Factor Encourages people to get out on their bikes knowing that if they want to take the bus with their bike they can
Currently in trial mode in Wellington Currently in trial mode in Wellington
Influencing Travel Behaviour
Bike sharing (e.g. Provision of bicycle hire schemes)
Allows users to have access to publicly located bicycles, encourages the use of the bicycle as a mainstream transport mode, targets opportune and short trips
Pull Factor Can be provisioned by the government or by the community sharing their own bikes through a web based platform
Feasibility and set up costs Medium Term
Influencing Travel Behaviour
End of Trip Facilities for Walking and Cycling
Increases the attractiveness of walking and cycling by providing facilities for the end of the trip, such as showers, lockers, bicycle parking etc.
Pull Factor Provides facilities for pedestrians and cyclists to safely store belongings
Tied into building redevelopments Medium Term
Influencing Travel Behaviour
Improved services (e.g. Wi-Fi on buses, less advertising on the sides of buses)
Makes public transport more attractive by increasing the services offered on buses and trains (e.g. Wi-Fi)
Pull Factor Gives users an incentive to use public transport Feasibility and cost Short Term
Influencing Travel Behaviour
Linking cycling and public transport (e.g. Bike-Train)
Targets the egress trips to train stations to be undertaken by bicycle, decreasing the overall journey time and increasing the accessibility of public transport
Pull Factor Increasing the competitive advantage of public transport through encouraging cycling to and from stations
Public transport efficiency Short Term
Influencing Travel Behaviour
Multimodal access guide Making it easier to get around a city by any mode by identifying the different options along with travel time and cost per trip
Pull Factor Users are able to put a time to their travel and use the mode most suited to them.
Sometimes these are difficult to locate and many users will not know they exist.
Short Term
Influencing Travel Behaviour
Public Education Reducing travel demand by informing the public about the different transport modes available
Pull Factor Improves public perception of active modes of transport
Design of effective campaigns and how to carry on the momentum afterwards.
Short Term
Influencing Travel Behaviour
Public Transport Incentives – both government and organisation level
Encourages public transport usage by subsidising the cost of monthly passes, e.g. Subsidised public transport fares as part of employment package
Push Factor Encouraging public transport use as already paid for
Requires a culture shift regarding how public transport is paid for
Long term
Influencing Ridesharing Increases car occupancy by encouraging people to Pull Factor Each private car user who shares a ride takes Perceived safety surrounding UBER rides Existing, but

Stage 2 Report
24
Travel Behaviour
travel together. Ride sharing and taxi services use private vehicles, e.g. Uber and Lyft
one private car off the road. Uber and Lyft operate as a carpooling service except that you are guaranteed a ride and have to pay a nominal fee, essentially they are taxi services
Currently unregulated in New Zealand currently unregulated in NZ
Influencing Travel Behaviour
Simplified public transport fare pricing
Making it easier and cheaper to use public transport by having a consistent pricing structure, based on number of zones you pass through rather than the number of services you take.
Pull Factor
Easier to work out the cost of a public transport trip. Decreases the cost of public transport trips whilst also increasing the convenience and attractiveness of public transport.
Lost revenue from cheaper public transport fares
Medium Term
Influencing Travel Behaviour
Tourist transport management
Reducing travel demand by encouraging tourist to use different transport modes/ travel times
Pull Factor Tourists to the area will be able to find their way around
Investigating how much demand tourist put on the transport system during peak periods
Short Term
Influencing Travel Behaviour
Transit Free Zone Public transport users travel free within a certain zone, usually within the CBD area
Pull Factor Less private vehicles within the transit free zone Can be difficult to track if users get off the bus/train/tram within the free transit zone or not. Also makes tracking of users difficult.
Short Term
Influencing Travel Behaviour
Universal access card Making it easier and cheaper to use public transport by having a consistent pricing structure with consistent electronic payment services
Pull Factor Users only need one smart card for all travel Implementation and coordination between multiple operators
Medium Term
Influencing Travel Behaviour
Wayfinding Making it easier to find your way around by walking and cycling
Pull Factor Enables users to find where they are going easily and to see alternative routes
The provision of consistent, clear messaging, updating information when the walking and cycling networks change
Short Term
Influencing Travel Behaviour
Work place incentives
Alternative work schedules/variable work times, encourage working from home and using telecommunications will lead to congestion reduction during peak travel times by encouraging flexible working arrangements
Pull Factor Encourages active and diverse work places Requires business to change their work habits and systems
Short Term
Land Use Policies
Car free planning (e.g. Car free days)
Closes areas off to motorised traffic for a specific time period so people can experience what their city would be like car free
Pull Factor Allows users to experience the area without cars Traffic management plans. Identifying suitable areas to have car free days to have the desired impact
Short Term
Land Use Policies
Development Travel Plans Travel planning tool for new commercial and residential developments so that provision for other transport modes is taken into consideration
Pull Factor Encouraging use of other transport modes and/or travel times specific to new developments
Overall coordination, leadership Short Term
Land Use Policies
Logistics Plans - Encouraging consolidation of freight distribution
Increases the efficiency of logistics in urban areas and reduces the number of trucks/vans on urban streets
Push Factor Reduction in number of delivery vehicles in CBD Requires a cultural shift- collaboration between business/ freight operators
Short Term
Land Use Policies
Personalised Travel Plans Identifies alterative transport modes that meet the needs of individuals
Pull Factor Encouraging and educating households of other transport modes specific to their area
Ensuring that there is adequate infrastructure/incentives in place to ensure people stick to their plans
Short Term
Land Use Policies
Spatial plans - Integrating transport and land use planning
Integrates land use and transport planning Push Factor Improvement of transport networks and increasing the economic efficiency of cities
New way of thinking, challenges the spatial structure of our urban areas.
Short Term
Network Management
Accident response units Allows for accidents to be cleared or moved off the network faster
Network Optimisation
Less disruption by incidents that occur in peak time
Ensuring the accident response units are aware of incidents and can access them in a timely manner
Already exists to some degree in Wellington

Stage 2 Report
25
Network Management
High occupancy vehicle (HOV) priority (e.g. T2 lanes, bus lanes, queue jump lanes)
Increasing network efficiency and the attractiveness of carpooling and public transport by providing fast lanes for vehicles with more than one people
Pull Factor Congestion reduction Space for HOV lanes, cost Medium Term
Network Management
Public Transport Priority Increasing the attractiveness of public transport through giving it priority over private vehicles
Pull Factor Reduces travel time for public transport users Priority at intersections Medium Term
Network Management
Ramp Metering Reduces congestion on state highways through optimising the flow of traffic entering the motorway based upon current conditions
Network Optimisation
More efficient use of state highways Coordinating ramp signals based upon traffic flows/demand
Short Term
Network Management
Tidal Flow Lanes (e.g. Moveable tidal flow barriers to switch travel lanes based upon demand)
Better use of existing road space by providing an additional lane in peak demand periods
Network Optimisation
Better utilisation of road space Perceived danger issue. Location and operation
Medium Term
Network Management
Traffic calming Increasing the attractiveness and safety of walking and cycling through reducing the amount and speed of through traffic
Pull Factor
Slows traffic in suburban areas and deters people from taking routes that they see as taking longer. Also improves safety for walking and cycling by providing lower speed environments.
If traffic calming is to be carried out, other viable routes need to be provided for through traffic
Short Term
Network Management
Walking and cycling infrastructure improvements
Increasing the attractiveness of walking and cycling Pull Factor Congestion reduction/ switch to other modes More effective at targeting shorter trips, may require the reallocation of road space
Short Term
Parking Policies
Park and Ride (e.g. Provision of subsidised parking at train stations)
Congestion reduction by encouraging people to drive to bus/ train stations and catch public transport into town
Push Factor Congestion reduction, encourages public transport use
Space constraints, effective locations Short Term
Parking Policies
Parking Management Reduces the availability of on street parking making driving become less attractive
Push Factor Congestion reduction Requires a culture shift regarding the right/availability of on street parking
Short Term
Parking Policies
Smart Parking (e.g. variable parking prices based on demand)
Discourages driving through increasing the price of parking based on demand. Smart parking can also act as a guidance system to guide drivers to available parks.
Push Factor Reduction in peak travel due to higher parking prices
Requires a culture shift regarding the right/availability of on street parking
Short Term
Parking Policies
Unbundled Parking (where the cost of renting/owning a car park is separate from building expenses)
Encourages a decrease in the supply of parking through allowing residents to only pay for a car park if they require it
Push Factor Allows users to only pay for parking when they require it.
Requires a culture shift regarding how parking is provided/paid for.
Medium Term
Technology and Innovation
Improved travel time information
Provides customers with up to date, real time travel time information
Pull Factor Creates a more reliable network for users Ensuring technology is up to date and that the travel time information is reliable
Short Term
Technology and Innovation
Mobility as a service Uses technology to offer a customer any type of travel experience using any mode of transport to meet the transport requirements of the customer
Pull Factor Aims to change the thinking of the user and show all of their alternative options
Technology, understanding and thinking for mobility as a service is still being developed.
Medium Term